Abstract
Political and bureaucratic corruption is a societal threat in every country. It allows organised crime to flourish, slows economic growth, increases income inequality, reduces government effectiveness, and threatens citizens’ confidence in the rule of law. This study uses a “System Dynamics model” from a framework based on econometric analysis wherein the causal relationships between the economic and governance institutions were established. The calibrated model uses the data on institutional quality from 1996 to 2020 from “the World Bank and the World Economic Forum” to project institutional quality and control corruption in the future. The control of corruption was trending downward in the nations studied. The model shows that improving institutional quality can reverse this downward trend. However, improving institutional quality and controlling corruption requires a country-specific approach. This model suggests the most efficient ways that national leaders and policymakers can improve institutional quality and thereby control corruption in their country.
1. Introduction
Government corruption affects many aspects of everyday life for citizens in many countries. It affects political stability [1] and the amount of violence faced by a population [2], and leads to organised crime [3] or a refugee crisis [4]. It can also affect the economic growth in a country [5] and the associated socio-economic well-being of its citizens [6]. World Migration Report 2020 [7] estimates 281 million economic migrants have left their homes searching for a better life in developed countries, and government corruption is seen as a societal threat of serious proportions in these countries as per the Corruption Perception Index [8]. Barbier suggests that improving institutional quality can alleviate many societal threats [9], particularly the SDG16, which considers peace, justice, and powerful institutions under the “United Nations Sustainable Development Goals” [10].
The history of corruption is as old as pre-historic times [11]. According to Nye [12], “corruption is a behaviour which deviates from the normal duties of a public role because of private-regarding (personal, close family, private clique) pecuniary or status gains; or violates rules against certain types of private-regarding influence”. This definition by Nye has been adopted by several agencies, including the World Bank, Transparency International, OECD, the EU, and the UN [12]. Transparency International [13] states that corruption:
- Happens anywhere: in government, in business, the courts, the media, civil society, and all sectors they touch, such as from health and education to infrastructure and athletics [13].
- Involves anyone: politicians, government officials, public servants, business people or members of the public. Moreover, it happens in the shadows, often with the help of professional enablers such as bankers, lawyers, accountants and real estate agents, opaque financial systems and anonymous shell companies that allow corruption schemes to flourish and the corrupt to hide their illicit wealth [13,14].
This paper hypothesises that improving institutional quality can help control corruption. However, the authors consider that an approach to improving institutional quality needs to be country-specific. This paper aims to develop a System Dynamics model [15,16,17] with a constrained optimisation feature [18] that national leaders and policymakers can use to develop efficient policies to improve institutional quality and control corruption. However, there has never been a generic system dynamics model calibrated to replicate the institutional quality behaviour over time for any specified nation and institutional project quality into the future. Furthermore, a System Dynamics model has never been available to support country-specific decision-making on the most efficient allocation of resources to improve overall institutional quality and control corruption.
This paper examines qualitative national panel data and quantitative economic indicators to identify interrelated institutions and the effect of institutional quality on the control of corruption by applying a System Dynamics model [15,16,17]. We first examine the available political economy and econometric studies of corruption to inform the selection of institutions (factors) for the proposed System Dynamics model structure. Before describing the System Dynamics model, we also briefly look at the recent literature on System Dynamics models and corruption. From this background, we describe our approach, which involves a comprehensive qualitative model that is simplified and then converted to a quantitative model. Next, we describe our data sources and the conversion of the data into consistent scales of institutional quality. The model thus developed shall be calibrated for three example countries: a developing country, a BRICS nation (“Brazil, Russia, India, China, and South Africa”) [19], and a developed country. Next, we make projections for the near future with the calibrated model, assuming there are no significant changes to the system. Then, assuming the government of the day wants to improve institutional quality, we develop a constrained optimisation method [18] to prioritise investments in various institutions to obtain the most overall institutional quality. We show how this investment improves all institutions, but we mainly focus on improving the control of corruption. We discuss the policy implications and generalisation of the approach to institutions other than control of corruption. Finally, we discuss the limitations of this work and the future directions this work may take.
2. Literature Review
2.1. The Political Economy of Corruption
In modern times, political analysts use ‘corruption’ as a moral category to describe unacceptable traits [20], but economists find themselves uneasy making such moral judgments [21]. However, over the last few decades, the study of the political economy of corruption has generated valuable research that focuses on how public officials may act corruptly if their economic yields soar [20,21].
Lambsdorff, the creator of “Transparency International’s Corruption Perceptions Index” [5] developed several governance indicators, including control of corruption. Knowledgeable observers distinguish legal institutions, electoral rules, and judicial independence as different entities, and the disparities between “the law on the books” and “the law as it functions” can capture the different levels of corruption based on perception-based indices [22]. Additionally, Kaufmann et al. [6], at the World Bank, observed the associations between governance indicators and economic outcomes. In addition to corruption control, they constructed five other indices “voice and accountability, political instability and absence of violence, government effectiveness, regulatory quality, and the rule of law”. They argued that the perception-based data on governance does well at capturing reality and demonstrated significant variations in the indices across countries with a modest change over time. These studies suggest that perception-based time-series data will help analyse the causes and consequences of corruption in a country.
Kaufmann et al. [23] claims that the predominant cause of corruption is weak governance. With theoretical and empirical support, the recommendations of economists who urge “countries to get their macroeconomic incentives right will not work unless the state has institutions capable of putting such policies into effect”. Mauro [24] states that slow economic growth cannot be proven to be caused by “corruption alone, rather than the institutional weaknesses that are closely associated with it”. This emphasises the importance of governance institutions in enhancing economic growth.
Moreover, “a feedback mechanism from low growth to high corruption and high growth to low corruption means the growth process cannot begin unless well-functioning institutions are in place” [5,6,23]. Khan [25] reviews the typical economic analysis of corruption in developing countries, arguing that policies from countries with robust regulations and institutions are unsuitable for developing countries involved in high-level of corruption. This implies that a high level of regulatory quality is a precursor for economic growth.
While the cross-country outcomes using perception indices raise awareness, they do not suggest tangible responses. Instead, there is a requirement to examine the “benefits and costs of particular policies” to solve particular problems in particular countries. For example, Meagher et al. [26] study the incentives for corruption in the Bulgarian pharmaceutical system and highlight the consequences of regulatory quality and accountability in designing policies. Similarly, consideration of accountability to fight corruption must be embedded while delivering public services in Uganda [27]. This supports our inference that policies to control corruption need to be country specific.
Numerous studies on the “causes and consequences” of corruption consider plausible reasons, such as “the size of the public sector, quality of regulation, degree of economic competition, the structure of government, amount of decentralisation, impact of culture, values and gender, and invariant features such as geography and history” [28]. Nevertheless, findings reveal corruption linked with damaging results, thus supporting the importance of institutions. Although there are many potential causes of corruption, our approach focuses on the transient behaviour of control of corruption. Therefore, we need to establish the potential causes of corruption that vary over time.
Lambsdorff [5] claims the “consequences of corruption are difficult to distinguish from the causes”. While “inequality” is associated with raised levels of corruption, the “econometric evidence on causation is mixed”. Additionally, a vagueness arises in the relationship between “poverty and corruption” [29,30]. The results indicate advances in civil liberties, and the rule of law leads to “higher productivity and encourage capital inflows”. As such, regulatory quality raises productivity, and the rule of law is the key to attracting foreign capital [31].
Rose-Ackerman [20,21] studied concepts related to corruption, namely “poor governance, institutional structure, the transition from socialism, and anti-corruption policies”. Rousso and Steves [32] examine corruption trends in Central and Eastern Europe and emphasise “integrated anti-corruption efforts to strengthen institutions of governance and accountability”. With more countries becoming democracies, Kunicová [28] links “constitutional structures and voting rules to the perceptions of corruption”. In the same vein, Bardhan and Mookherjee [29,30] analysed links between corruption and government accountability and recommended that people monitor government officials. Although monitoring reduces corruption, it hardly eradicates it. However, this suggests that more accountability will lead to more control of corruption. Given the prominence of the judiciary both in constraining the state and enforcing private contracts, corruption undermining the rule of law may be damaging. This suggests that increased levels of corruption can negatively impact the perceptions of the quality of the rule of law.
Furthermore, Hunt and Laszlo [33] provide a solid basis for reform and argue for initiatives targeting judicial and police corruption. However, reformers must understand that the fundamental “political dynamics“ can disrupt proposals otherwise in harmony with the “principles of good public administration”. In short, corruption problems are not “technical but political” [26]. This emphasises the importance of political stability, voice, and accountability in reducing corruption.
Mauro [24], supported by Rose-Ackerman [34], Treisman [35] and Myint [36], states that institutional “weaknesses are intrinsically linked.” Furthermore, Mauro suggests that “getting rid of corruption helps a country overcome other institutional weaknesses, just as reducing other institutional weaknesses helps to curb corruption” [24]. However, with no clear way to distinguish the causes from the consequences of corruption, our assumptions must be made explicit in the modelling because System Dynamics is based on cause and effect relationships.
2.2. Econometric Studies of Corruption
We have looked at many seminal political economy studies in Section 2.1 [20,21,22,23,24,25,26,27,28,29,30,31,32,33,34,35,36] that developed measures and emphasised the importance of institutions in fighting corruption. This section looks at recent econometric studies to identify the interrelated institutional factors controlling corruption. For this, a Systematic Literature Review (SLR) methodology is adopted to ensure proper transparency and depth in the review process [37]. Moreover, it was chosen over other methods as it is a systematic, scientific and reproducible approach accepted worldwide [38]. Therefore, an SLR [39] process was considered for obtaining data from primary data sources, including Google Scholar, Mendeley, WoS and JSTOR, for ten years from 2011 to 2021. First, an initial search was made from major databases using select keywords “Econometrics AND Corruption”. Next, sampling using inclusion and exclusion criteria was performed to identify the interrelated institutional factors. Inclusion: keywords anywhere in the article, period 2011 to 2021, language as English, yielding 1220 articles from peer-reviewed journals and sorted by relevance. Exclusion: Duplications, book chapters, and conference papers were included exclusively with higher relevance; abstract reading and selection for content analysis; and finally, backwards-and-forward search selection yielded 18 relevant articles. The selected 18 articles are analysed to identify various institutions to be used to inform the System Dynamics model. Table 1 lists the sources and the identified institutions in no particular order.

Table 1.
Literature on institutional connections to corruption.
Research on the causes of corruption identified several factors under the economic, political, cultural, and institutional aspects. Among the 18 selected articles, we identified the institutional impact based on variables (dependent and independent) ([40,41,42,43,44,45,46,47,48,49,50,51,52,53,54,55,56,57]). Table 1 provides a total of thirteen unique factors for informing the System Dynamics model as institutions (model boundaries) that emerged through a systematic literature review and include, in no particular order: Control of Corruption (1); Voice and Accountability (2); Government Effectiveness (3); GDP Growth (4); Control of Income Inequality (5); Control of Inflation (6); GDP per Capita (7); Political Stability and Absence of Violence (8); Organised Crime (9); Regulatory Quality (10); Economic Openness (11); The Rule of Law (12); and Government Expenditure (13).
Section 2.3 attempts to identify if any of these thirteen institutions are available in the specific literature on System Dynamics models related to corruption.
2.3. System Dynamics Models of Corruption
Corruption, a widely spread phenomenon, has been modelled by various researchers adopting specifically the tools of System Dynamics methodology [15,16,17]. However, the exploratory and validated models are domain-specific. They include: the implications of corruption on firm performance [58]; collective organizational corruption [59]; white-collar crime [60]; corruption among village officials [61]; corruption in urban infrastructure procurement [62]; corruption’s impact on the performance of a construction project [63]; bribery of law enforcers [64]; drug trafficking in Colombia [65]; corruption in New Zealand’s dairy industry [66]; Iran’s oil industry [67]; China’s construction industry [68]; Icelandic fisheries, Romanian forestry, and Ukrainian arable soils [69]; green buildings in Qatar [70]; smart building management systems [71]; informal payments to physicians in Hungary [72]; the US financial market [73]; Kenya’s telecom markets [74]; and a transportation service [75].
While these domain-specific studies of corruption are available, none exist at the national government level. For example, a systems thinking model of “perceptions of corruption” in Pakistan suggested that “social aspects, inflation, government size, and political norms” were crucial factors [76]. We build on this systems thinking model and three econometrics models to develop a calibrated, quantitative System Dynamics model. Our approach is the first to use a System Dynamics model that includes time-series data on governance and economic institutions to support national decision-making on the most efficient allocation of resources to improve overall institutional quality and control corruption.
3. Materials and Methods
3.1. Econometric Equations
The System Dynamics model builds on the following three equations obtained using econometric methods [77,78,79]. Equation (1) attempts to determine the effect of corruption on long-run economic growth.
’s are the coefficients of the conditioning variables, ’s are the coefficients of corruption and institutional quality, is the coefficient of lag of GDP per worker, is the coefficient of capital–labour ratio, and is the random error. These conditioning variables are government expenditure, external competitiveness, population growth rate, primary and secondary school enrolment, foreign direct investment, the risk to investment ratio, corruption, bureaucratic efficiency, political stability, and institutional efficiency [77].
The relationship between red tape and corruption observed in all societies is probably the most ancient problem with bureaucracy. Corruption and red tape in bureaucracy interact. The red tape creates opportunities for corruption, and bribes may be required to overcome high levels of red tape.
The above Equation (2) includes the variables: corruption, bureaucratic quality, democratic accountability, secondary school enrollment, population, external competitiveness, government expenditure, lag of corruption, and the error term. ’s are the regression coefficients, and i and t represent the country and time, respectively [78].
The impact of corruption on income inequality can be examined, with controlling variables to minimise the omitted variable bias (see Equation (3)). These variables are per capita income , trade openness , population growth rate , education , government expenditure , capital per worker , and the past inequality. ’s are the regression parameters, is the random error term. i and t represent the country and the time, respectively [79].
These three econometric models (Equations (1)–(3)) suggest a system of simultaneous equations where corruption is endogenous and affects both economic growth and income inequality, among other institutions. Whereas econometric models use correlations and linear regression, System Dynamics is a modelling approach based on cause-and-effect relationships. It includes essential ideas about dimensional consistency and conservation of matter, such as those used in physics modelling [15,16,17].
3.2. A Systems Thinking Model
System Dynamics and Systems Thinking go hand-in-hand [16,17,80]. Systems Thinking provides a holistic view of the interactions contributing to an outcome expressed as a Causal Loop Diagram (CLD). The CLD developed using Systems Thinking shows the full complexity of the problem at hand, and then simplifications are necessary to create a working quantitative System Dynamics simulation. Figure 1 was developed in [76] based on 43 in-depth interviews and 155 survey interviews with government officials, aid agencies, civil society organizations, business people, lawyers, and the general public in Pakistan. It shows the complete set of relationships considered to represent the problem of corruption in a nation. In the CLD, connections with directed arrows imply that a change in the tail variable leads to a change in the variable at the head of the arrow. An arrow labelled with polarity ‘+’ means changes in the same direction. Increasing the tail variable increases the head variable, and decreasing the tail variable decreases the head variable.
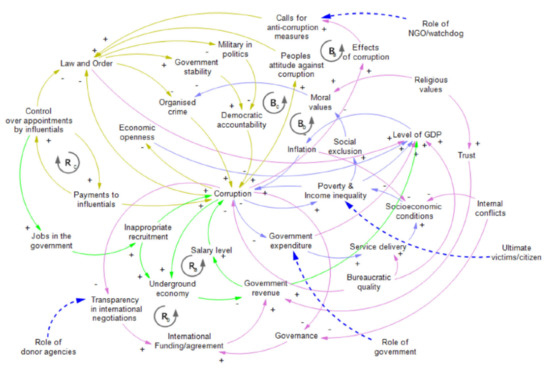
Figure 1.
A Systems Thinking model of corruption.
On the other hand, ‘−’ implies changes in the opposite direction. For example, increasing the tail variable decreases the head variable, and decreasing the tail variable increases the head variable. These connections create highly non-linear behaviour because feedback loops develop where a change in one variable in the model will ripple through the cause-and-effect structure to return to its source and either reinforce or inhibit the change. The reinforcing feedback loop is labelled with an ‘R’ and inhibiting or balancing feedback loops with a ‘B’. Connecting these loops often leads to emergent and unexpected behaviours in the system.
Figure 2 is a simplification of the part of Figure 1 that focuses on economic factors related to corruption. Because the literature review indicated the difficulty distinguishing the causes from the consequences of corruption, this model uses the interviews and surveys conducted by Ullah et al. [76]. Figure 2 shows how five reinforcing loops can explain how corruption impacts various economic factors in a country and how these economic factors, in turn, impact corruption. First, examining the reinforcing loop, , we suggest that inflation increases the cost of living in a country, causing its citizens to turn to illicit means to augment their income. The loop, , suggests that increasing levels of misbehaviour by public servants could negatively impact the effective use of government expenditure. This could result in less money devoted to social services, which will negatively impact the citizens’ socioeconomic conditions, increasing the levels of poverty and inequality, resulting in higher levels of corruption in the nation as a whole. Loop suggests a close synergistic relationship between poverty, income inequality, and corruption. Loop brings organised crime into the model in a way that results from moral values. Finally, loop suggests that although higher levels of imports and exports can support growth in GDP, it may also result in higher levels of inflation which encourages higher levels of corruption as described above. As such, the five loops reinforce each other on how economic factors in a country impact corruption.
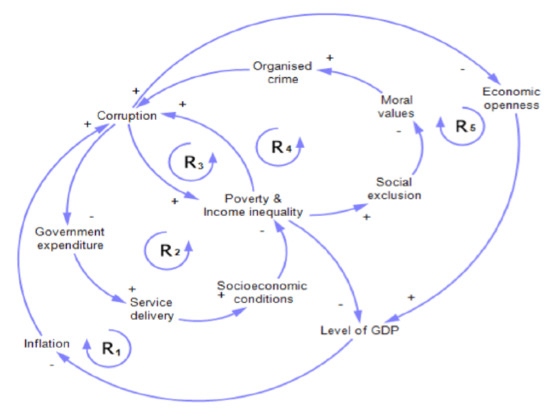
Figure 2.
A simplified Systems Thinking model of the economic factors associated with corruption.
Figure 3 is a simplification of the part of the CLD in Figure 1 that focuses on governance factors related to corruption which is similarly based on the literature review and the qualitative research by Ullah et al. [76]. Loop suggests that increasing levels of corruption can result in perceptions of lower levels of law and order, which could lead to lower government stability and political accountability, leading to more corruption. Loop brings into the model the impact of the military in politics, how it is affected by reductions in law and order, and its adverse effect on democratic accountability, resulting in increasing levels of corruption. Loop shows the close relationship between corruption’s negative impact on law and order and how reduced law and order increases the potential for higher levels of organised crime leading back to higher levels of corruption. Finally, there is a balancing loop, , where citizens may not tolerate high levels of corruption and demand higher levels of law and order, government stability, and democratic accountability, and lower levels of the military in politics and organised crime.
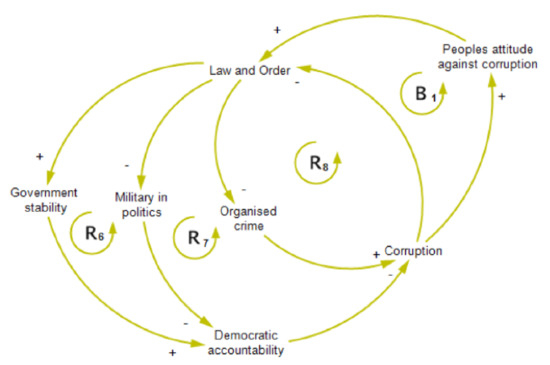
Figure 3.
A simplified Systems Thinking model of governance factors associated with corruption.
3.3. The System Dynamics Model
In the System Dynamics model of institutional quality, Figure 2 and Figure 3 were combined and further simplified into the model shown in Figure 4. The World Bank [81,82] and the World Economic Forum [83] provide qualitative and quantitative time-series data for all of these institutions for almost any country. This was considered critical for developing a generic, calibrated System Dynamics model to represent the behaviour over time of the institutions and how they impact the control of corruption in any particular country desired. Based on the literature review, the econometric equations, and the CLDs above, the institutions were connected as shown in Figure 4 with governance institutions, shown in ‘yellow’, and economic institutions, shown in ‘blue’. Between two institutions, the linking arrow implies an improvement in the institution’s quality at the arrow’s tail will likely improve the institution’s quality at the head of the arrow. Similarly, a decrease in the institution’s quality at the tail of the arrow will decrease the institution’s quality at the head of the arrow.
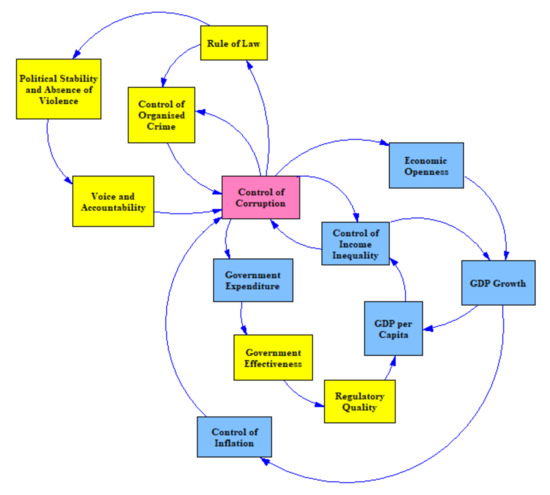
Figure 4.
Interrelationships of the institutions in the corruption model.
Notice in Figure 4 that we have reversed the negative terminology in many places. We use the terms control of corruption, control of inflation, control of income inequality, and control of organised crime instead of the alternative negative terminology in Figure 2 and Figure 3 corruption, inflation, income inequality, and organised crime. We do this for two reasons. First, most of the economic and governance measures we represented in our System Dynamics model use the reference that higher values imply better governance or economic development quality. Second, when we develop our policy priorities, we will use effort factors in which additional effort greater than in the status quo scenario is applied to improve the institutional quality.
When comparing Figure 4 with Figure 2, qualitative panel data from the World Governance Indicators [81] has been used to measure control of corruption instead of corruption directly. The values from the World Development Indicators [82] has been used for: the GINI index as the basis of a measurement of the control of income inequality; a relative value for GDP per capita to represent socio-economic conditions; a relative measure of government expenditure; and imports and exports to GDP as a proxy for economic openness. The International Country Risk Guide [84] method to categorise GDP growth from the World Development Indicators as a substitute for the level of GDP, and the same guide’s categorisation of inflation from the World Development Indicators was used. Additionally, the qualitative panel data on government effectiveness and regulatory quality from the World Governance Indicators [81] as a substitute for service delivery was applied. As there were no suitable moral values and social exclusion measures, we organised crime as part of the governance factors (and hence was not counted twice).
Moreover, when comparing Figure 4 with Figure 3, qualitative panel data from the World Governance Indicators [81] has been used. Instead of law and order, authors use the rule of law, instead of democratic accountability, voice and accountability, instead of government stability, political stability and absence of violence. This is due to the fact that no adequate measure of the military in politics was available. So, the rule of law was connected to voice and accountability directly. Furthermore, the people’s attitude against corruption could not be adequately measured; hence, this factor has not been included in the System Dynamics model.
System Dynamics modelling often utilises special-purpose software to conduct the calculations in the simulation. In this study, the Vensim software package [85] is used for developing and analysing the dynamic feedback models. System Dynamics models mimic a fluid flow movement of materials and information through a series of containers. The number of material units in the containers represents the system’s state. These containers, referred to as ‘stocks’, are shown in the software interface as labelled boxes (see Figure 5). These stocks change based on ‘inflows’ and ‘outflows’ shown in the interface by pipes with valves (see Figure 5). Information about the stocks helps to adjust the rate of the flows based on various policies entered into the software as equations for the endogenous variables shown in Figure 5 as small letter names. There are also exogenous variables shown as names in all capitals in Figure 5.
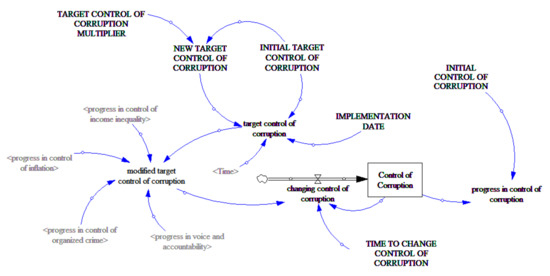
Figure 5.
A stock and flow diagram for the institution of control of corruption.
In Figure 5, a stock variable represents the institution of control of corruption. This stock changes based on a flow that can take on positive or negative values. Although shown as an inflow, it becomes an outflow when the value is negative. The flow, called the change in control of corruption, tries to close the gap between the current control of corruption and the modified target control of corruption over a particular time. The modified target control of corruption uses the target control of corruption set by the government of the day and the progress of the affiliated institutions, which are the institutions in Figure 4 with a directed arrow into the control of corruption. The progress in control of corruption was calculated as the current control of corruption divided by the initial control of corruption. This progress can represent an increase or a decline. Notice that there is an initial target control of corruption and a new target control of corruption that comes into effect at the implementation time. This new target control of corruption is calculated by multiplying the initial target control and an effort factor. This multiplier is being used as a proxy for the effort expended by the government of the day to improve the control of corruption. All thirteen institutions are represented in the System Dynamics model as stocks with similar flows, targets, times, multipliers, and progressive values.
The System Dynamics model employs a highly interconnected system of integral equations solved using numerical methods. It can employ both quantitative and qualitative measures. By calibrating a System Dynamics model [86], one can see the causes of the behaviour of changes in essential parts of the system in the past. Then with confidence in the model, the analyst can project the behaviour into the future, assuming nothing changes in the system structure [87]. Then, if the behaviour projected in the future is not desirable, the analyst can experiment with the model as if it is a digital twin of the system to determine ways to achieve a more favourable future behaviour. One of the crucial things discovered by employing a System Dynamics model is that the unintended negative consequences of a policy change often have more impact than the intended consequences. The goal of analysing a System Dynamics model is to find the powerful leverage points that can move the system in a positive direction and do not have these unintended negative consequences.
With 13 institutions considered in the model, the “quality of the institution i” at time t is expressed as where (see Equation (4)). As such, there are a series of 13 interrelated integral equations. Being primarily interested in controlling corruption, we have defined as the quality of the control of corruption at time t.
represents the change in the quality of institution i at time t and is calculated as shown in Equation (5).
Equation (5) shows the classic System Dynamics goal–gap paradigm with the goal shown as the modified target quality of institution i and the time required to close the gap. is calculated in Equation (6) using a function to ensure the value of the modified target is less than or equal to 1 or quality. In Equation (6), is the target control of corruption set by the government of the day. However, the progress in the interrelated institutions (see Equation (7)) enhances or inhibits the ability of the government to achieve its goal, where represents the interrelationships between the institutions. if there is a causal arrow in Figure 4 and if there is not. At the time t, if the quality of institution j is higher than its initial quality, then , and if , this enhances the modified target quality for institution i, ; supporting the government of the day in improving the institutional quality. and represents a decline in the quality of the interrelated institution j, hindering the ability of the government of the day to improve the quality of institution i.
We solve this system of integral equations (Equation (4)) using the Euler numerical approximation method [88] with a step-size of years. The model is designed in the special-purpose System Dynamics software Vensim [85] and then converted to a Microsoft Excel workbook [89,90] with specially written macros in Visual Basic for Applications [91].
3.4. Data Conversion
Three sources (“World Governance Indicators [81], World Development Indicators [82], and World Economic Forum [83]”) provided data for testing the model. The time-series data are denoted as to distinguish the actual institutional quality measures from the model estimates.
We converted the raw data to a 0 to 100 scale where higher values represented better governance and economic development quality. For example, the World Bank provides the World Governance Indicators [81] (control of corruption, government effectiveness, political stability and absence of violence, regulatory quality, the rule of law, and voice and accountability) on a to scale. Higher values represent improved governance. These values can be converted to a 0 to 100 scale by adding , dividing by 5, and multiplying by 100.
The World Bank provides the World Development Indicators [82] in many economic units. First, GDP Growth, GDP per capita, and control of inflation were converted to a 0 to 10 scale using the methodologies provided in the International Country Risk Guide [84]. Then, multiplied these values by 10 to obtain values between 0 and 100. Next, the values for economic openness given by the World Bank and represented as the sum of imports and exports as a fraction of GDP were used and multiplied by 100. Finally, the values for government expenditure as a fraction of GDP, , needed to be scaled to obtain reasonable values between 0 and 100. , is shown in Equation (8), where is the maximum government expenditure as a fraction of GDP in the database.
The control of income inequality, , uses the Gini index at time t, representing the level of inequality in a country as a value between 0 and 1 where a higher value implies more income inequality. The control of income inequality is estimated as shown in Equation (9).
We built the model to extract and convert the data from these sources [81,82,83] for any country and chose data from three countries: a developing country (Pakistan), a BRICS country (India), and a developed country (Canada) for case studies.
4. Results
4.1. Model Calibration
After importing the time-series data into the model, we conducted a calibration process to estimate the model’s parameters. First, we estimated the dates when there was a change in the government, then found the values of the exogenous variables (the target values for the quality of the institutions and the times to change the quality each time there was a change in the government). We minimised the squared error between the data and the model results. To do this, we used the Excel non-linear optimisation add-on called Solver [92]. This sum of squared error was for all of the institutions simultaneously (see Equation (10)).
Here, represents the target quality from Equation (5) and represents the time to change the quality from Equation (6) for each institution i and each government of the day d. is the model estimate of institutional quality at time t and is the converted data on the quality of the institution for each year from 1996 to 2020.
Figure 6, Figure 7 and Figure 8 provide the time-series data for the control of corruption (actual) and the model results for control of corruption (model) after calibration for the developing country (Pakistan), the BRICS country (India), and the developed country (Canada).
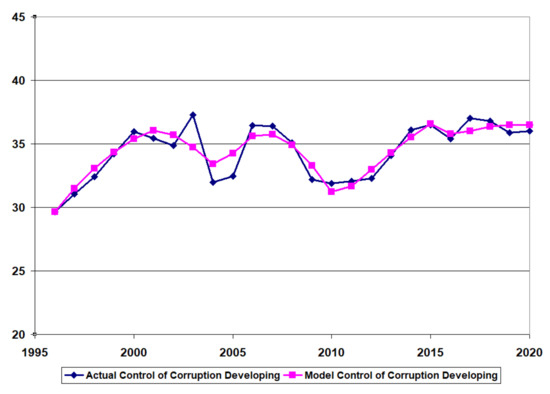
Figure 6.
Model calibration developing country (Pakistan).
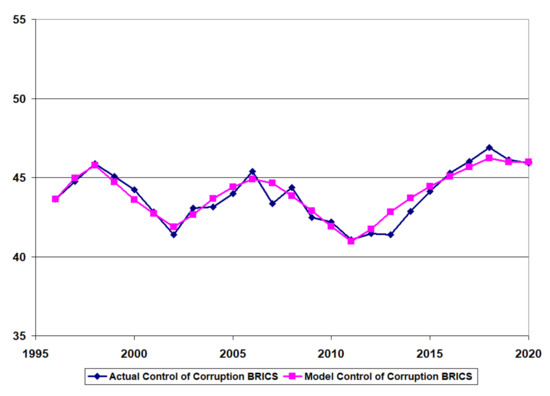
Figure 7.
Model calibration BRICS country (India).
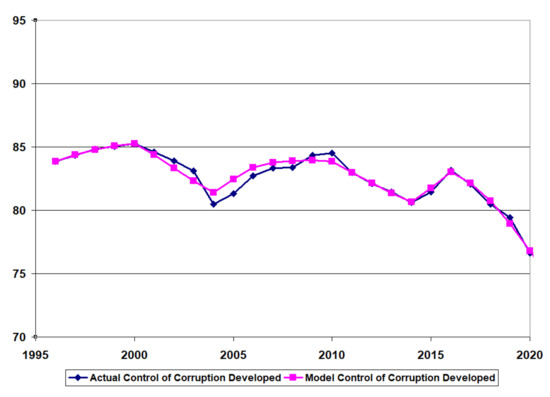
Figure 8.
Model calibration developed country (Canada).
4.2. Projected Institutional Quality
Table 2, Table 3 and Table 4 show the numeric values of the quality of the institutions at the initial time (1996), the last available data point (2020), and the projected value (2026) for the developing country (Pakistan), BRICS country (India), and developed country (Canada), respectively. Here, the projected values utilise the values of and for the government of the day in 2020 found in the calibration (Equation (10)).

Table 2.
Numeric values of institutional quality for a developing country (Pakistan).

Table 3.
Numeric values of institutional quality for a BRICS country (India).

Table 4.
Numeric values of institutional quality for a developed country (Canada).
The Table 2, Table 3 and Table 4 fail to show the variability in the institutional quality, especially in the economic indices. Figure 9 shows the transient behaviour of the calibrated results for the 13 institutions in an example developing country (Pakistan) between 1996 and 2020 and the projected values to 2026 if there are no policy changes in 2021. GDP growth and inflation control suffered a drastic decline starting around 2014, with a decline to continue into the near future. To a lesser degree, GDP per capita and control of income inequality trended downwards in the recent data, projecting further decline. Interestingly, political stability, the absence of violence, and the control of organised crime trended downward in the early years. However, as the trend reversed, it foresees a continuous upward trend but at a slower rate. Of particular interest in this study is the projection of the control of corruption to decline slightly in the future.
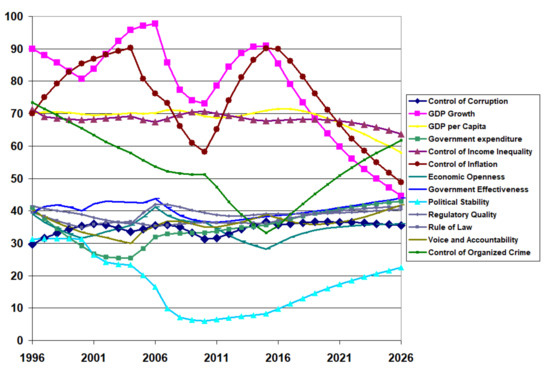
Figure 9.
Institutional quality projections for a developing country (Pakistan).
Figure 10 shows the institutional quality estimates for a typical BRICS country (India) from 1996 to 2020 and then the projected values out to 2026 with no change in policy. Notice that inflation control started a drastic decline from 2017 to 2020, continuing until 2026. On the other hand, the control of organised crime changed its drastic decline around the same time and then grew rapidly until 2020. This growth will not continue after 2020 and will remain around the 2020 level until 2026. With significant improvements in government expenditure, government effectiveness, and regulatory quality by 2026, there are modest improvements in GDP per capita and control of income inequality. Again, control of corruption peaked in 2020 and will decline slightly in the future.
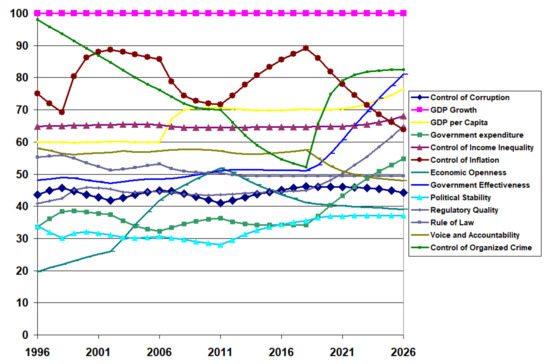
Figure 10.
Institutional quality projections for a BRICS country (India).
Figure 11 shows the calibrated institutional quality for the 13 institutions in the developed country (Canada) from 1996 to 2020, along with projections for 2026. Again, there have been drastic declines in the quality of many institutions. GDP growth started to decline in 2013 and continued to decline until 2020, and again continues to decline until 2026. Control of income inequality, regulatory quality, and economic openness declined in 2016 and continued to decline until 2020, with further decline until 2026. On the other hand, inflation control and GDP per capita started to decline in 2020 and 2021. Political stability and absence of violence trended downward heading until 2020; however, the trend will slow. Government expenditure seems to be growing slowly and steadily. Like the other developing country (Pakistan) and BRICS nations (India), the developed country (Canada) saw the downward trend in organised crime from 1996 to 2016 reverse until 2020 and should continue to improve. Control of corruption saw a severe decline from 2016 until 2020 and will decline until 2026 if there are no policy changes.
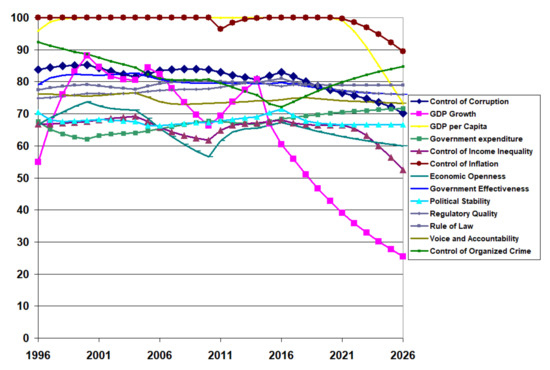
Figure 11.
Institutional quality projections for a developed country (Canada).
4.3. Projected Results if Effort Expended to Improve Institutional Quality
We used the Excel Solver [92] to conduct a constrained optimisation [18] in which the average institutional quality projected for 2026 (Equation (11)) is maximised subject to an effort constraint (see Equation (12)). The sum of the values of the multipliers are used as the constraint. These multipliers affect the target institutional quality for the government in 2020 as described in Figure 5 (see Equation (12)). The assumption is that the government of the day applies this effort from 2021 to 2026. Note that effort of 1 represents the current effort and values greater than 1 represents additional effort (see Equation (13)).
The optimal policy for the developing country (Pakistan) involves investing in the control of inflation, economic openness, and the rule of law (see Table 5). This resulted in an improvement in the projected average institutional quality in 2026 from 45% to 50%, which reversed the downward trend seen in Table 2. As a result, there is a drastic increase in inflation control and modest improvements in economic openness and the rule of law. In Figure 12, the control of inflation grew rapidly after 2021 but could not be sustained and started declining by 2026, which shows some policy resistance. On the other hand, a slight increase in GDP growth, voice and accountability, and control of organised crime are noticeable. Most importantly, the downward trend in control of corruption reversed.

Table 5.
Institutional quality for a developing country (Pakistan) with effort expended.
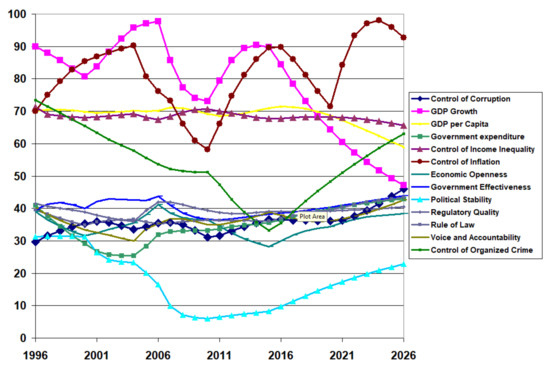
Figure 12.
Institutional quality projections for a developing country (Pakistan) with effort expended to improve control of inflation, economic openness, and the rule of law.
Figure 13 highlights the improvement in control of corruption obtained with the optimal investments in institutional quality compared to the status quo situation. The control of the corruption index should improve from a projected value of 36% if there is no change in policy to a projected value of 46% if there is an investment to improve institutional quality.
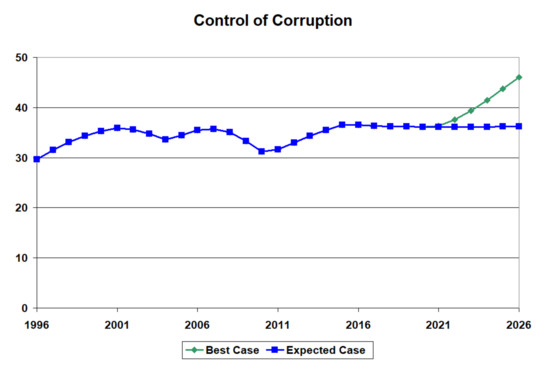
Figure 13.
Increased control of corruption in a developing country (Pakistan).
Figure 14 shows the impact of an investment to improve institutional quality for a BRICS country (India). In this case, the government of the day should concentrate investments in political stability and the absence of violence and the rule of law. The model projects this to result in an improvement of average institutional quality from 62% to 73% (see Table 6). We see drastic improvements in these institutions. There appear to be positive synergistic effects on voice and accountability and control of organised crime, with the downward trend in the former reversed. In the latter, the levelling off in the status quo situation changes to growth to a new level. These institutions improve drastically without direct investment made in them. Again, this shows the interconnected nature of the institutional systems. Most importantly, the downward trend in control of corruption reverses.
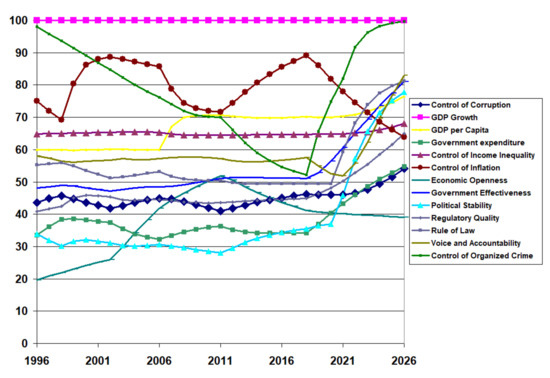
Figure 14.
Institutional quality projections for a BRICS country (India) with effort expended to improve political stability and absence of violence and the rule of law.

Table 6.
Institutional quality for a BRICS country (India) with effort expended.
Figure 15 shows the impact of investments in institutional quality on controlling corruption for a typical BRICS country (India). There appears to be a steady increase in the control of corruption, with these investments improving the index from an earlier projected value of 44% when there is no change in policy to a growing projected value of 54% in 2026. One can see that the downward trend has reversed, and the future improvements in control of corruption should grow at an increasing rate if these investments in the rule of law and political stability and absence of violence are maintained.
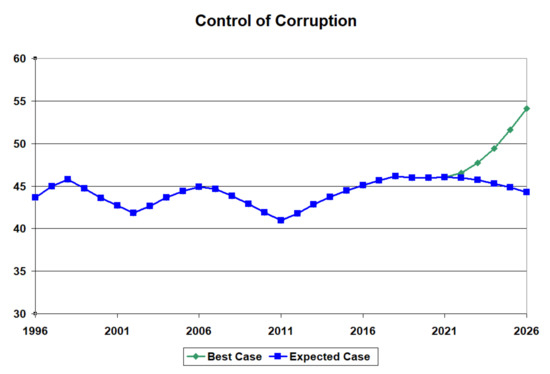
Figure 15.
Increased control of corruption in a BRICS country (India).
For the developed country (Canada), when investments are made in 2021 to improve institutional quality optimally, they should be spread over five institutions: GDP per capita, control of income inequality, political stability and absence of violence, regulatory quality, and the rule of law (see Table 7). There is a drastic improvement in these institutions (see Figure 16) and synergistic positive changes in two other institutions: voice and accountability and control of organised crime (see Table 7). The downward trend in control of corruption has been reversed (see Figure 17).

Table 7.
Institutional quality for a developed country (Canada) with effort expended.
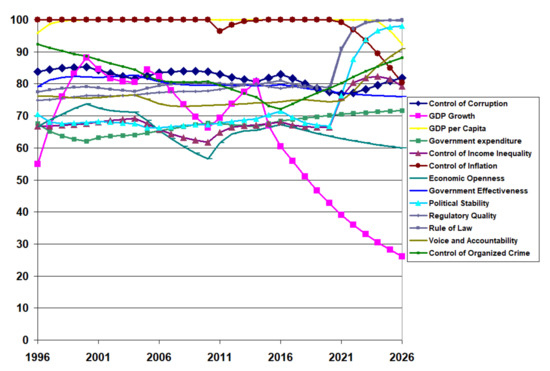
Figure 16.
Institutional quality projections for a developed country (Canada) with effort expended to improve GDP per capita, control of income inequality, political stability and absence of violence, regulatory quality, and the rule of law.
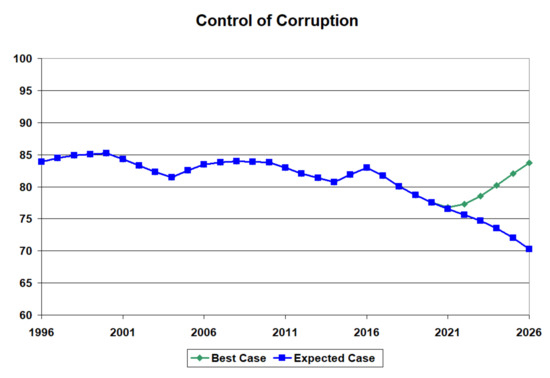
Figure 17.
Increased control of corruption in a developed country (Canada).
We found that the control of corruption declined in the developing, BRICS, and developed countries considered in this study. Furthermore, the System Dynamics model projects that this decline will continue into the near future. However, the model suggests ways to reverse these trends through wise investment in improving the country’s institutional quality. Since each country has their own particular institutional quality trends, each country needs its unique strategy of investments to improve institutional quality and thereby improve its control of corruption. National leaders and policymakers who would like to do so may consider this approach.
These results significantly depart from the econometric results that inspired them because they employ cause and effect concepts and techniques from calculus and physics rather than statistics. Furthermore, implementing a technique to apply effort to improve institutional quality has been shown to positively influence the future trajectory of control of corruption, making the technique prescriptive rather than simply descriptive.
5. Discussion
This study observed that even in a developed country like Canada, government corruption can be a severe issue, and in less developed countries like India and Pakistan, even more so. Recent protests in many countries against government corruption indicate that citizens seek more political accountability and a voice in government. The subsequent political instability and the violence that has resulted in maintaining the status quo indicate that change is not happening fast enough. It has led to a much poorer quality of life than necessary for large parts of the world. A methodology proposed here could help change the downward trend in control of corruption for reform-minded or potential leaders. In particular, our model suggests that the appropriate allocation of resources could have the most significant impact on reversing the trend in the shortest amount of time. Such a tool could be a highly valued asset for a political candidate or an incumbent leader in a democratic country. In many countries, the political agenda is not favourable for this approach. Many leaders and bureaucrats benefit from corruption on a personal level. Our approach focuses explicitly on institutional improvement, not individuals. By taking the individual leaders and bureaucrats out of focus, control of corruption may not trigger regime change and, therefore, might be done peacefully. We see a highly synergistic relationship between institutions in a country where improving one enhances another. The control of corruption is central in the system. Therefore, the emphasis on improving this particular institution will improve the quality of life for many citizens. It could resolve significant problems in many countries, such as economic disadvantages, organised crime, civil unrest, and civil wars that create the international refugee and economic migration problems.
6. Conclusions
The World Bank [81,82] and the World Economic Forum [83] provide the time-series data to apply our model to almost any country in the World. This System Dynamics model extracts the data from these databases and calibrates the model for a particular country. We chose a typical developing, BRICS, and developed country (Pakistan, India, and Canada, respectively) to demonstrate that the model does not depend on the country’s level of development. Additionally, while institutional quality may be declining all over the world, this model might be helpful for government officials and national leaders who need an efficient and effective strategy to restore their institutional quality.
We focused on the institution of control of corruption and showed that investments that improve institutional quality would particularly impact it. However, control of corruption touches on so many other institutions that it is a central policy issue for all countries. From the case studies examined, control of corruption is trending downward in all three. However, the model projected the possibility of reversing these trends through wise investment in improving certain institutions. As each country exhibited a different pattern in its institutional quality, each country required a unique investment approach to reverse the downward trend in control of corruption.
We can generalise this model to consider any of the thirteen identified institutions as all these institutions affect the well-being of a nation’s citizens. For example, institutional quality impacts economic growth. In the same way, this model can examine the impact of institutional quality on control of income inequality, government effectiveness, and control of organised crime, which are also crucial for the well-being of citizens.
This model needs to be updated every year as new data becomes available. Because of this re-calibration, very different projections than those shown in this paper might result. On the other hand, governments often produce annual policy updates and, therefore, adjustments to the effort expended could react to recent events and further improve institutional quality.
Another limitation of this model results from the assumption that all institutions have equal weight in supporting the well-being of the citizens. Furthermore, the ability to change each institution involves equal weights. The ability to change some institutions involves more complicated procedures than others and perhaps more under the control of the government of the day. Another limitation of the abstract nature of this improvement effort is that the government of the day still needs to determine the actual policy changes and programs that are needed to improve institutional quality. Significant improvements to this model might result from developing action plans such as those found in the development targets in the “United Nations Sustainable Development Goals” [10].
We recognise that our transition from the Systems Thinking Causal Loop Diagram to the quantitative System Dynamics model required us to make several modelling choices concerning the relative importance of the connections between the institutions. Future work should determine the impact of alternative modelling choices.
Additionally, many more aspects of a society influence the control of corruption other than the thirteen institutions considered in this study (recall Table 1 and Figure 1). As of now, this work is limited to specific thirteen institutions (shown in Figure 4). For this representative, time-series data for almost any country showing how the quality of these institutions changed over time [81,82,83] could be collected. Future work should attempt to find data sources on how the other aspects of society like culture, social capital, ethnolinguistic fractionalisation, and religion have changed in various countries over time and how these changes might have impacted control of corruption.
Author Contributions
Conceptualization, I.W.T., M.A.U. and M.S.U.; methodology, I.W.T., M.A.U., S.K. and M.S.U.; software, I.W.T., M.A.U., S.K. and M.S.U.; validation, I.W.T., M.A.U., S.K. and M.S.U.; formal analysis, I.W.T., M.A.U., S.K. and M.S.U.; literature review and investigation, I.W.T. and S.K.; writing—original draft preparation, I.W.T. and S.K.; writing—review and editing, I.W.T. and S.K.; supervision, I.W.T. All authors have read and agreed to the published version of the manuscript.
Funding
This research received no external funding.
Institutional Review Board Statement
Not Applicable.
Informed Consent Statement
Not Applicable.
Data Availability Statement
The theoretical model is provided as a Vensim model file and three Excel spreadsheets are provided for the developing, BRICS, and developed country case studies at https://github.com/ivanwtaylor/Corruption, accessed on 16 March 2022.
Conflicts of Interest
The authors declare no conflict of interest.
References
- Cook, S.A.; Moretti, L.; Rudin, D. Corruption and the Arab Spring. Brown J. World Aff. 2012, 18, 21–28. [Google Scholar]
- Iwuoha, V.C.; Aniche, E.T. Protests and blood on the streets: Repressive state, police brutality and #EndSARS protest in Nigeria. Secur. J. 2021, 34, 1–23. [Google Scholar]
- Blackburn, K.; Neanidis, K.C.; Rana, M.P. A theory of organised crime, corruption and economic growth. Econ. Theory Bull. 2017, 5, 227–245. [Google Scholar] [CrossRef] [Green Version]
- United Nations High Commission for Refugees (UNHCR). Available online: https://www.unhcr.org/en-us/figures-at-a-glance.html (accessed on 2 March 2022).
- Lambsdorff, J.G. Framework Document to the 2004 Corruption Perceptions Index. Transparency International Background Paper. 2004. Available online: https://www.icgg.org/downloads/FD_CPI_2004.pdf/ (accessed on 2 March 2022).
- Kaufmann, D.; Kraay, A.; Zoido-Lobatón, P. Aggregating Governance Indicators. World Bank Policy Research Working Paper No. 2195. 1999. Available online: http://info.worldbank.org/governance/wgi/pdf/govind.pdf (accessed on 2 March 2022).
- World Migration Report. Available online: https://worldmigrationreport.iom.int/wmr-2020-interactive/ (accessed on 2 March 2022).
- Transparency International. Corruption Perception Index (CPI). Available online: https://images.transparencycdn.org/images/CPI2021_Report_EN-web.pdf (accessed on 2 March 2022).
- Barbier, E.B.; Burgess, J.C. Institutional quality, Governance and Progress towards the SDGs. Sustainability 2021, 13, 11798. [Google Scholar] [CrossRef]
- United Nations Sustainable Development (UN SDG). Available online: https://sdgs.un.org/goals (accessed on 2 March 2022).
- Noonan, J.T. Bribes; University of California Press: Berkeley, CA, USA, 1984. [Google Scholar]
- Nye, J.S. Corruption and Political Development: A Cost-Benefit Analysis. Am. Political Sci. Rev. 1967, 61, 417–427. [Google Scholar] [CrossRef]
- Transparency International. Definition of Corruption. Available online: https://www.transparency.org/en/what-is-corruption (accessed on 12 April 2022).
- Fidrmuc, J.; Gërxhani, K. Mind the gap! Social capital, East and West. J. Comp. Econ. 2008, 36, 264–286. [Google Scholar] [CrossRef] [Green Version]
- Forrester, J.W. Industrial Dynamics; The MIT Press: Cambridge, MA, USA, 1961. [Google Scholar]
- Sterman, J.D. Business Dynamics: Systems Thinking and Modeling for a Complex World; Irwin McGraw-Hill: Boston, MA, USA, 2000. [Google Scholar]
- Wolstenholme, E.F. System dynamics in perspective. J. Oper. Res. Soc. 1982, 33, 547–556. [Google Scholar] [CrossRef]
- Dangerfield, B. System Dynamics Models, Optimization of. In Complex Systems in Finance and Econometrics; Meyers, R., Ed.; Springer: New York, NY, USA, 2009. [Google Scholar]
- Kesar, A.; Jena, P.K. Corruption and Economic Growth: Empirical Evidence from BRICS Nations. In India Studies of Business and Economics; Kesar, A., Jena, P.K., Eds.; Springer: Cham, Switzerland, 2022; p. 183. [Google Scholar]
- Rose-Ackerman, S. Corruption: A Study in Political Economy; Academic Press: Cambridge, MA, USA, 2013. [Google Scholar]
- Rose-Ackerman, S. (Ed.) International Handbook on the Economics of Corruption; Edward Elgar Publishing: Northampton, MA, USA, 2007. [Google Scholar]
- Laeven, L.; Woodruff, C. The quality of the legal system, firm ownership, and firm size. Rev. Econ. Stat. 2007, 89, 601–614. [Google Scholar] [CrossRef] [Green Version]
- Kaufmann, D.; Kraay, A.; Zoido-Lobatón, P. Governance Matters. World Bank Policy Research Working Paper No. 2196. 1999. Available online: https://documents1.worldbank.org/curated/en/665731468739470954/pdf/multi-page.pdf (accessed on 2 March 2022).
- Mauro, P. Corruption: Causes, Consequences, and Agenda for Further Research. Financ. Dev. 1998, 35, A004. Available online: https://www.elibrary.imf.org/view/journals/022/0035/001/article-A004-en.xml (accessed on 2 March 2022).
- Khan, M.H. State failure in developing countries and strategies of institutional reform. In Toward Pro-Poor Policies: Aid Institutions and Globalization, Proceedings of Annual World Bank Conference on Development Economics; Tungodden, B., Stern, N., Kolstad, I., Eds.; Oxford University Press and World Bank: Oxford, UK, 2004. [Google Scholar]
- Meagher, P.; Azfar, O.; Rutherford, D. Governance in Bulgaria’s Pharmaceutical System: A Synthesis of Research Findings. A Report to USAID. 1999. Available online: https://pdf.usaid.gov/pdf_docs/PNADF523.pdf (accessed on 2 March 2022).
- Reinikka, R.; Svensson, J. Local capture: Evidence from a central government transfer program in Uganda. Q. J. Econ. 2004, 119, 679–705. [Google Scholar] [CrossRef] [Green Version]
- Kunicová, J.; Rose-Ackerman, S. Electoral rules and constitutional structures as constraints on corruption. Br. J. Political Sci. 2005, 35, 573–606. [Google Scholar] [CrossRef] [Green Version]
- Bardhan, P.; Mookherjee, D. Capture and governance at local and national levels. Am. Econ. Rev. 2000, 90, 135–139. [Google Scholar] [CrossRef] [Green Version]
- Bardhan, P.; Mookherjee, D. Eds. Decentralization and Local Governance in Developing Countries: A Comparative Perspective; MIT Press: Cambridge, MA, USA, 2006. [Google Scholar]
- Uslaner, E. Trust and corruption. In The New Institutional Economics of Corruption: Norms, Trust, and Reciprocity; Lambsdorff, J.G., Schramm, M., Taube, M., Eds.; Routledge: London, UK, 2004; pp. 76–92. [Google Scholar]
- Rousso, A.; Steves, F. The effectiveness of anti-corruption programs: Preliminary evidence from the post-communist transition countries. In International Handbook on the Economics of Corruption; Edward Elgar Publishing: Northampton, MA, USA, 2007; pp. 247–269. [Google Scholar]
- Hunt, J.; Laszlo, S. Is bribery really regressive? Bribery’s costs, benefits, and mechanisms. World Dev. 2012, 40, 355–372. [Google Scholar] [CrossRef]
- Rose-Ackerman, S. The Political Economy of Corruption: Causes and Consequences. World Bank. 1996. Available online: https://openknowledge.worldbank.org/handle/10986/11629 (accessed on 2 March 2022).
- Treisman, D. The causes of corruption: A cross-country study. J. Political Econ. 2000, 76, 399–457. [Google Scholar]
- Myint, U. Corruption: Causes, Consequences and Cures. Asia-Pac. Dev. J. 2000, 7, 33–58. [Google Scholar]
- Denyer, D.; Tranfield, D. Producing a systematic review. In The Sage Handbook of Organisational Research Methods; Buchanan, D.A., Bryman, A., Eds.; Sage Publications: Thousand Oaks, CA, USA, 2009; pp. 671–689. [Google Scholar]
- Thome, A.M.; Scavarda, L.F.; Scavarda, A.J. Conducting systematic literature review in operations management. Prod. Plan. Control 2016, 27, 408–420. [Google Scholar] [CrossRef]
- Xiao, Y.; Watson, M. Guidance on conducting a systematic literature review. J. Plan. Educ. Res. 2019, 39, 93–112. [Google Scholar] [CrossRef]
- Grande, M.V.; Teixeira, A.A. Corruption and MNCs’ entry mode. An empirical econometric study of Portuguese firms investing in PALOPs. Econ. Manag. Res. Proj. Int. J. 2011, 1, 36–52. [Google Scholar]
- Lacombe, D.J.; Coats, R.M.; Shughart, W.F., II; Karahan, G. Corruption and voter turnout: A spatial econometric approach. J. Reg. Anal. Policy 2016, 46, 168–185. [Google Scholar]
- Chakravorty, N.N. How Does Corruption Affect Economic Growth? An Econometric Analysis. J. Leadersh. Account. Ethics 2019, 16, 27–60. [Google Scholar]
- Khodapanah, M.; Dehghan Shabani, Z.; Akbarzadeh, M.H.; Shojaeian, M. Spatial spillover effects of corruption in Asian countries: Spatial econometric approach. Reg. Sci. Policy Pract. 2020, 1–19. [Google Scholar] [CrossRef]
- Ata, A.Y.; Arvas, M.A. Determinants of economic corruption: A cross-country data analysis. Int. J. Bus. Soc. Sci. 2011, 2, 161–169. [Google Scholar]
- Campos, N.F.; Dimova, R.; Saleh, A. Corruption and economic growth: An econometric survey of the evidence. J. Inst. Theor. Econ. Z. Gesamte Staatswiss. 2016, 2, 161–169. [Google Scholar] [CrossRef] [Green Version]
- Márquez, M.A.; Salinas-Jiménez, J.; Salinas-Jiménez, M.D. Exploring differences in corruption: The role of neighboring countries. J. Econ. Policy Reform 2011, 14, 11–19. [Google Scholar] [CrossRef]
- Rotimi, M.E.; IseOlorunkanmi, O.J.; Rotimi, G.G.; Doorasamy, M. Re-examining corruption and economic growth nexus in oil dependent economy: Nigeria’s case. J. Money Laund. Control 2021. [Google Scholar] [CrossRef]
- Moosa, I.A. Effect of corruption on FDI: Evidence from junk-science. Transnatl. Corp. Rev. 2017, 9, 88–96. [Google Scholar] [CrossRef]
- Hao, Y.; Gai, Z.; Wu, H. How do resource misallocation and government corruption affect green total factor energy efficiency? Evidence from China. Energy Policy 2020, 143, 111562. [Google Scholar] [CrossRef]
- Mariyono, J. Corruption and welfare: A simple econometric across countries analysis. Econ. J. Emerg. Mark. 2012, 4, 63–75. [Google Scholar] [CrossRef]
- Absalyamova, S.; Absalyamov, T.; Khusnullova, A.; Mukhametgalieva, C. The impact of corruption on the sustainable development of human capital. J. Phys. Conf. Ser. 2016, 738, 012009. [Google Scholar] [CrossRef] [Green Version]
- Nasreen, S.; Riaz, M.F. Relationship between corruption, income inequality and environmental degradation in Pakistan: An econometric analysis. Bull. Energy Econ. 2016, 4, 12–22. [Google Scholar]
- Oni, O.T.; Awe, O.O. Empirical nexus between corruption and economic growth (GDP): A cross country econometric analysis. Int. J. Sci. Res. 2012, 2, 426–430. [Google Scholar]
- Kolnes, V.L. Foreign Direct Investment and Corruption. An Econometric Analysis of the Multidimensional Effects of Corruption upon FDI Inflow. Master’s Thesis, University of Bergen, Bergen, Norway, 2016. [Google Scholar]
- Evan, T.; Bolotov, I. The weak relation between foreign direct investment and corruption: A theoretical and econometric study. Prague Econ. Pap. 2014, 23, 474–492. [Google Scholar] [CrossRef]
- Majeed, M.T. Corruption and trade. J. Econ. Integr. 2014, 29, 759–782. [Google Scholar] [CrossRef] [Green Version]
- Menegaki, A.N.; Ozturk, I. Growth and energy nexus in Europe revisited: Evidence from a fixed effects political economy model. Energ Policy 2013, 61, 881–887. [Google Scholar] [CrossRef]
- Cosenz, F.; Noto, G. A dynamic simulation approach to frame drivers and implications of corruption practices on firm performance. Eur. Manag. Rev. 2014, 11, 239–257. [Google Scholar] [CrossRef]
- Kim, S.J.; Lee, J. A percolation-like process of within-organisation collective corruption: A computational approach. Bus. Soc. 2021, 60, 161–195. [Google Scholar] [CrossRef]
- Gottschalk, P. Convenience dynamics in white-collar crime: Financial motive, organisational opportunity, and deviant behavior. Deviant Behav. 2021, 42, 532–543. [Google Scholar] [CrossRef]
- Zheng, Y.; Liao, X. The formation mechanism and precision control of corruption in poverty alleviation from the perspective of system dynamics. Math. Probl. Eng. 2018, 1–10. [Google Scholar] [CrossRef]
- Owusu, E.K.; Chan, A.P.; Wang, T. Tackling corruption in urban infrastructure procurement: Dynamic evaluation of the critical constructs and the anti-corruption measures. Cities 2021, 119, 103379. [Google Scholar] [CrossRef]
- Zuo, W.; Wang, Q.; Li, P. Rent-seeking decisions of the main participants in construction projects based on evolutionary-game and system dynamics. J. Civ. Eng. Manag. 2022, 28, 106–119. [Google Scholar] [CrossRef]
- Liu, L.; Chen, X. Evolutionary Dynamics of Cooperation in a Corrupt Society with Anti-Corruption Contro. Int. J. Bifurc. Chaos 2021, 31, 2150039. [Google Scholar] [CrossRef]
- Méndez-Giraldo, G.A.; López-Santana, E.R.; Franco, C. A hybrid system dynamics and fuzzy logic approach to social problem of corruption in Colombia. In Proceedings of the Applied Computer Sciences in Engineering: 4th Workshop on Engineering Applications, WEA 2017, Cartagena, Colombia, 27–29 September 2017; pp. 250–262. [Google Scholar]
- Liu, X.; Arthanari, T.; Shi, Y. Leverage risks for supply chain robustness against corruptione. Ind. Manag. Data Syst. 2021, 121, 1496–1521. [Google Scholar] [CrossRef]
- Hosseinzadeh, M.; Foroushani, M.S.; Tang, O.; Mehregan, M.R. Complexity management of corruption in Iran’s oil industry applying soft system dynamics methodology (SSDM). Kybernetes 2021, 50, 2397–2427. [Google Scholar] [CrossRef]
- Zhu, W.; Zheng, Y.; Ye, K.; Zhang, Q.; Zhang, M. Deterrence of Punitive Measures on Collusive Bidding in the Construction Sector. Complexity 2021, 1–12. [Google Scholar] [CrossRef]
- Gisladottir, J.; Sigurgeirsdottir, S.; Ragnarsdóttir, K.V.; Stjernquist, I. Economies of scale and perceived corruption in natural resource management: A comparative study between Ukraine, Romania, and Iceland. Sustainability 2021, 13, 7363. [Google Scholar] [CrossRef]
- Raouf, A.; Al-Ghamdi, S.G. Impact of Project Delivery Systems on Cost Overruns of Green Building Projects: System Dynamics Approach. In Proceedings of the International Conference on Sustainable Infrastructure 2019: Leading Resilient Communities through the 21st Century, Los Angeles, CA, USA, 6–9 November 2019. [Google Scholar]
- Alisic, R.; Molinari, M.; Paré, P.E.; Sandberg, H. Ensuring Privacy of Occupancy Changes in Smart Buildings. In Proceedings of the IEEE Conference on Control Technology and Applications (CCTA), Montreal, QC, Canada, 24–26 August 2020. [Google Scholar]
- Somogyvári, M. The costs of organisational injustice in the Hungarian health care systeme. J. Bus. Ethics 2013, 118, 543–560. [Google Scholar] [CrossRef]
- Martinez-Moyano, I.J.; McCaffrey, D.P.; Oliva, R. Drift and adjustment in organisational rule compliance: Explaining the “regulatory pendulum” in financial markets. Organ. Sci. 2014, 25, 321–338. [Google Scholar] [CrossRef]
- Omamo, A.; Rodrigues, A.J.; Muliaro, W. Kenya’s vision 2030: Modelling technology usage and the econom. Technol. Soc. 2019, 59, 101135. [Google Scholar] [CrossRef]
- Perko, I. Hybrid Reality development-can social responsibility concepts provide guidance? Kybernetes 2021, 50, 676–693. [Google Scholar] [CrossRef]
- Ullah, M.A.; Urquhart, C.; Arthanari, T.; Ahmed, E. Dimensions of corruption in Pakistan: A systems thinking approach and qualitative analysis. Syst. Res. Behav. Sci. 2021, 39, 324–338. [Google Scholar] [CrossRef]
- Ahmad, E.; Ullah, M.A.; Arfeen, M.I. Does Corruption Affect Economic Growth? Lat. Am. J. Econ. 2012, 49, 277–305. [Google Scholar] [CrossRef] [Green Version]
- Ullah, M.A.; Ahmad, E. Bureaucracy and Corruption: A Panel Data Analysis. SAARC J. Hum. Resour. Dev. 2014, 10. [Google Scholar]
- Ullah, M.A.; Ahmad, E. Inequality and Corruption: Evidence from Panel data. Forman J. Econ. Stud. 2016, 12, 1–19. [Google Scholar] [CrossRef]
- Meadows, D.H. Thinking in Systems: A Primer; Chelsea Green Publishing: Chelsea, VT, USA, 2008. [Google Scholar]
- World Governance Indicators (WGI). Available online: http://info.worldbank.org/governance/wgi/ (accessed on 2 March 2022).
- World Development Indicators (WDI). Available online: https://databank.worldbank.org/source/world-development-indicators (accessed on 2 March 2022).
- World Economic Forum (WEF). Available online: https://www.weforum.org/reports/ (accessed on 2 March 2022).
- International-Country-Risk-Guide (ICRG). Available online: https://www.prsgroup.com/explore-our-products/international-country-risk-guide/ (accessed on 2 March 2022).
- Ventana Systems Inc. Available online: https://vensim.com/ (accessed on 3 April 2022).
- Barlas, Y. Formal aspects of model validity and validation in system dynamics. Syst. Dyn. Rev. 1996, 12, 183–210. [Google Scholar] [CrossRef]
- Forrester, J.W.; Senge, P.M. Tests for building confidence in system dynamics models. TIMS Stud. Manag. Sci. 1980, 14, 209–228. [Google Scholar]
- Iserles, A. A First Course in the Numerical Analysis of Differential Equations, 2nd ed.; Cambridge University Press: Cambridge, MA, USA, 2009. [Google Scholar]
- Microsoft Corporation. Available online: https://www.microsoft.com/en-us/microsoft-365/excel (accessed on 3 April 2022).
- Teknomo, K. System Dynamics Tutorials. 2019. Available online: https://people.revoledu.com/kardi/tutorial/SystemDynamic/ (accessed on 3 April 2022).
- Albright, S.C. VBA for Modelers: Developing Decision Support Systems, 4th ed.; Cengage Learning: Independence, KY, USA, 2011. [Google Scholar]
- Frontline Solvers. Examples of Optimization Problems. Available online: https://www.solver.com/examples-optimization-problems (accessed on 3 April 2022).
Publisher’s Note: MDPI stays neutral with regard to jurisdictional claims in published maps and institutional affiliations. |
© 2022 by the authors. Licensee MDPI, Basel, Switzerland. This article is an open access article distributed under the terms and conditions of the Creative Commons Attribution (CC BY) license (https://creativecommons.org/licenses/by/4.0/).