Prediction of Antimalarial Drug-Decorated Nanoparticle Delivery Systems with Random Forest Models

 , , ,
, , ,  ,
,  and
and 
Abstract
1. Introduction
2. Materials and Methods
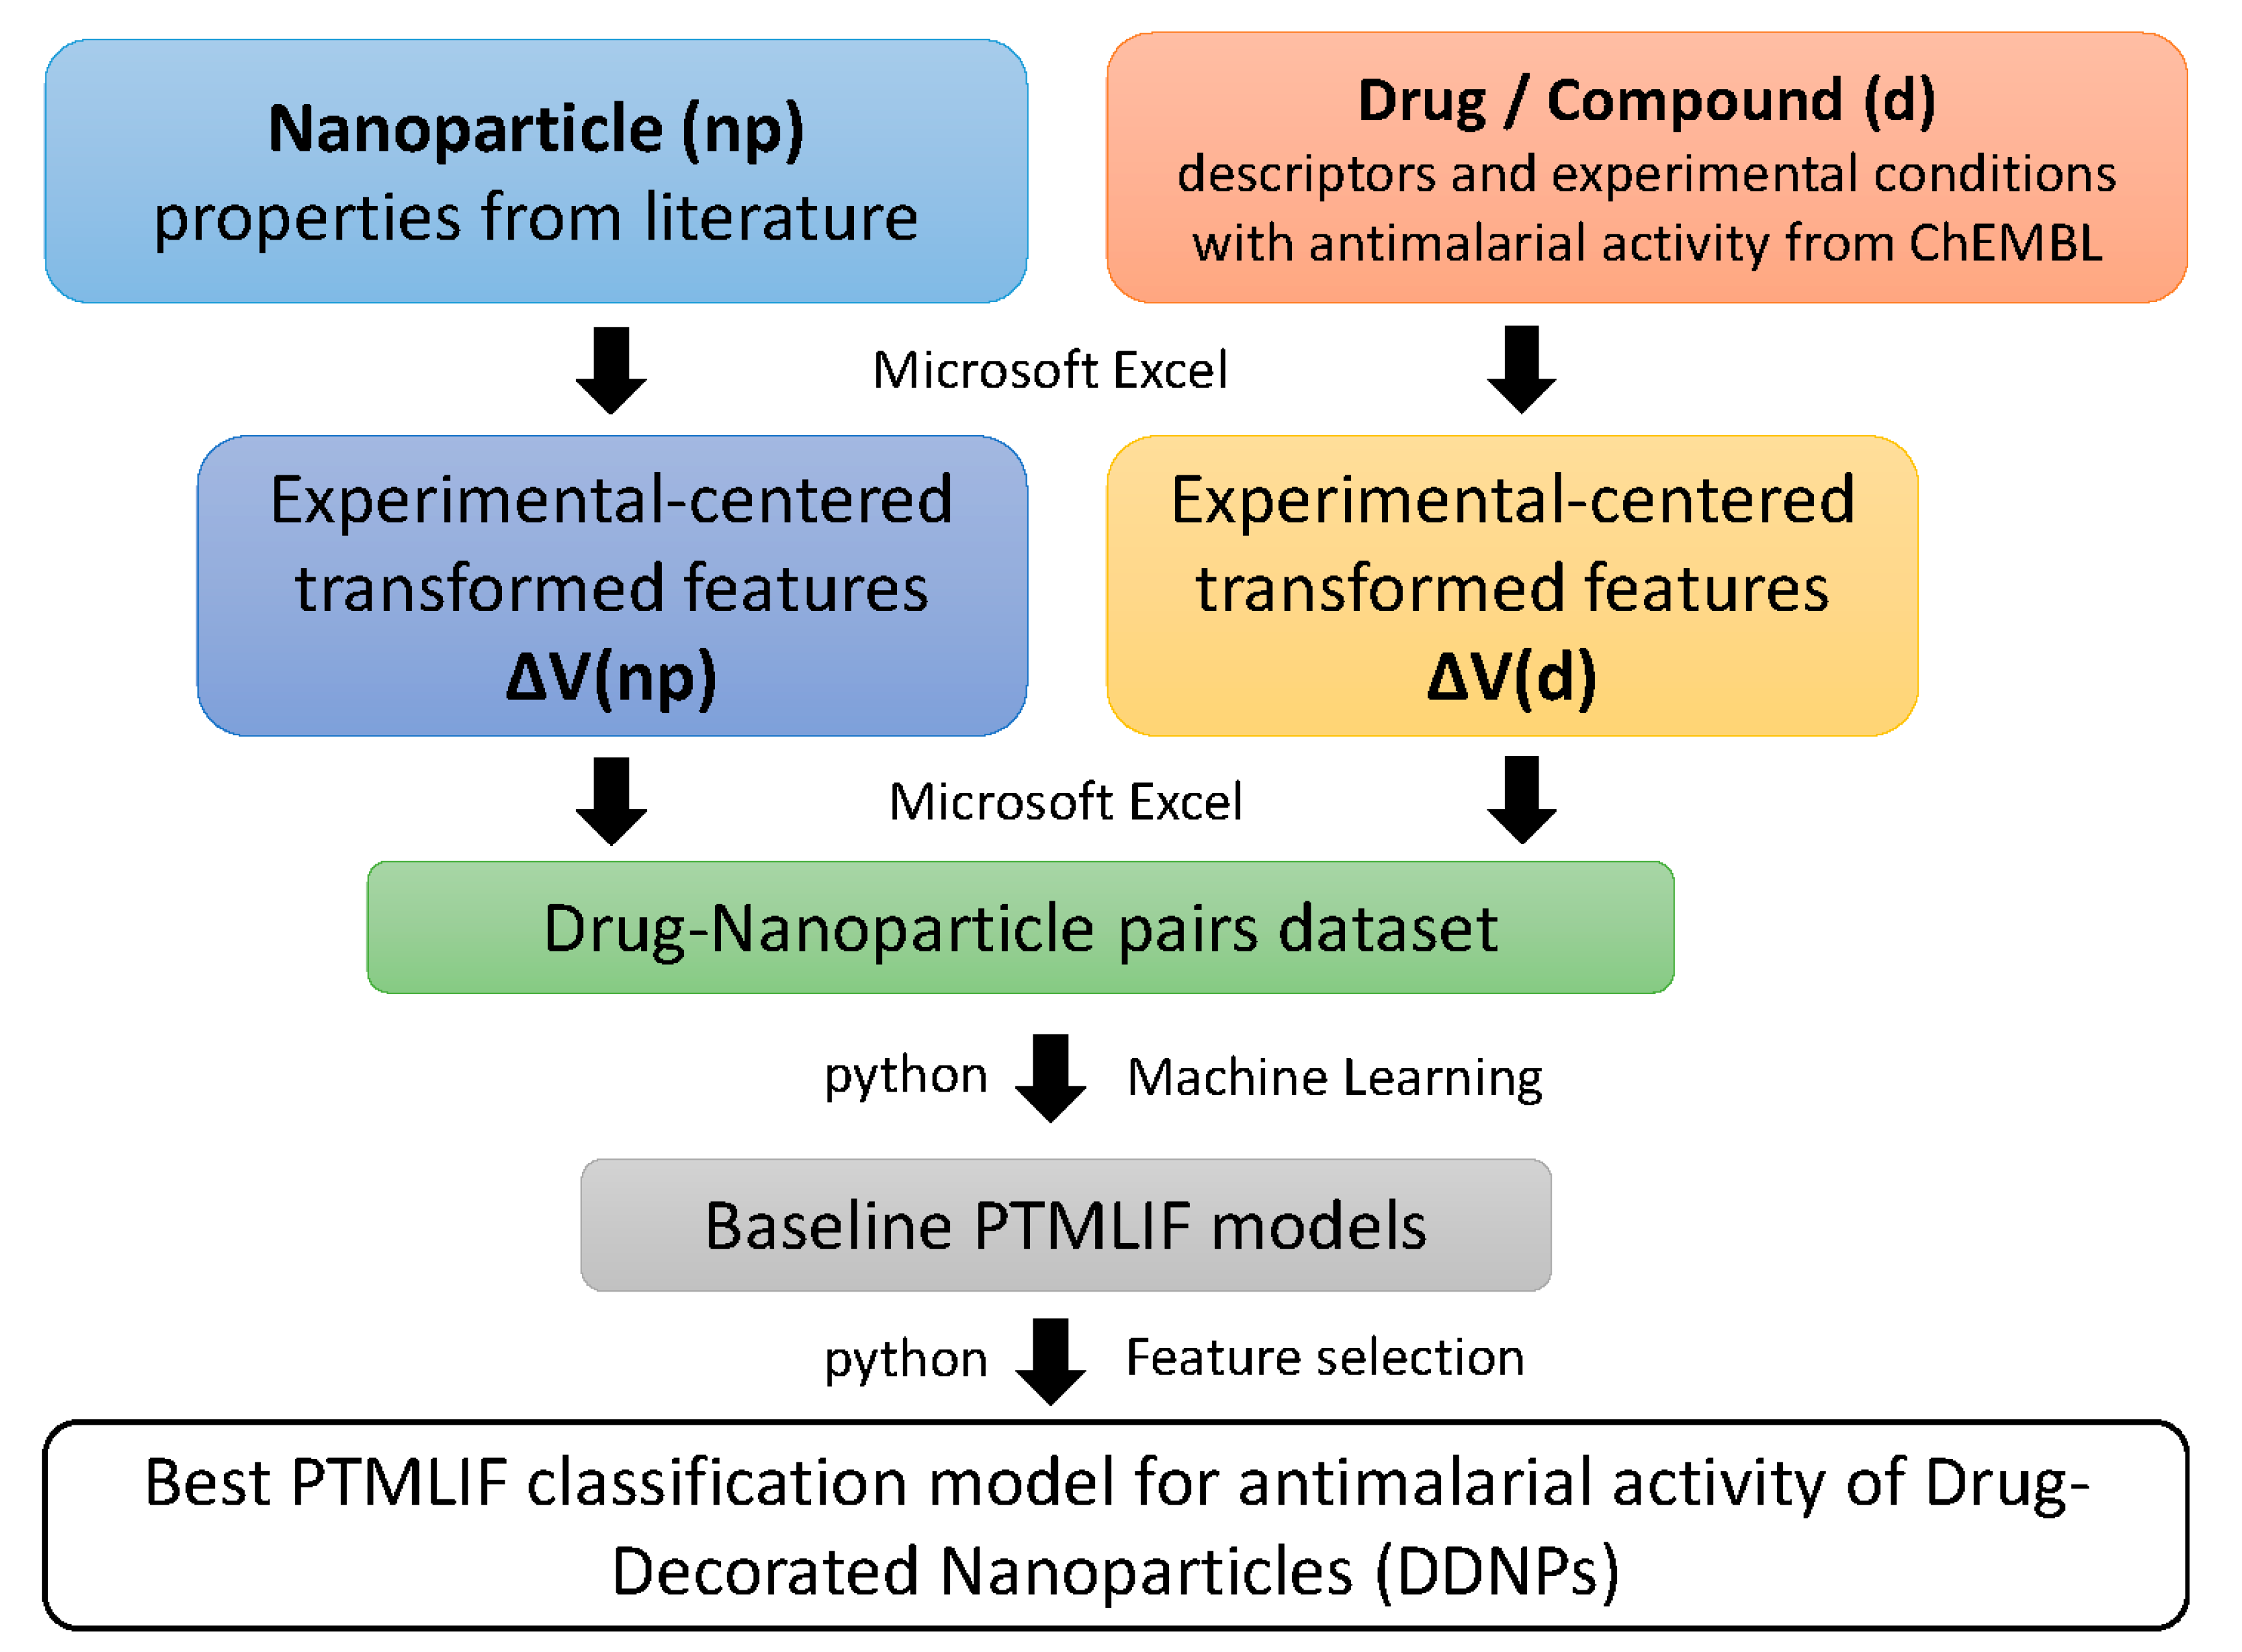
2.1. ChEMBL Data Pre-Processing
2.2. Nanoparticle Data Pre-Processing
2.3. Combine Data PRE-Processing
- -
- d_DPSA(c2) = difference (D) between original values of PSA descriptor and the mean of PSA values in experimental condition c2 (for drugs/compounds, d_);
- -
- np_DLnp(c4) = difference between Lnp value and the mean of Lnp values in experimental condition c4 (for nanoparticles, np_).
2.4. Machine Learning Methods
- KNeighborsClassifier = KNN—k-nearest neighbors: one of the most well-known non-parametric classifiers in the ML field. It assigns an unclassified sample to the same class as the nearest of the k samples in the training set [26];
- SVC(linear) = SVM linear—support vector classifier with linear kernels: the input data is non-linearly mapped to a higher dimensionality space, where a linear decision surface can be established [27];
- SVC = SVM—support vector classifier with non-linear RBF kernels: the real problems tend not to have a linear solution, and SVM can handle this limitation by using nonlinear kernel functions such as Gaussian radial basis (RBF) [28];
- LogisticRegression = LR—Logistic regression [29] is a linear model which can estimate the probability of a binary response using different factors;
- LinearDiscriminantAnalysis = LDA—linear discriminant analysis [30]: a statistical supervised method that is based on the projection of data to a lower dimension to maximize the scatter between classes versus the scatter within each class. This projection facilitates the separation of the data;
- DecisionTreeClassifier = DT—Decision Tree uses a series of decision rules inferred from the features as a tree of rules. Thus, the paths from root to leaf represent classification rules [31];
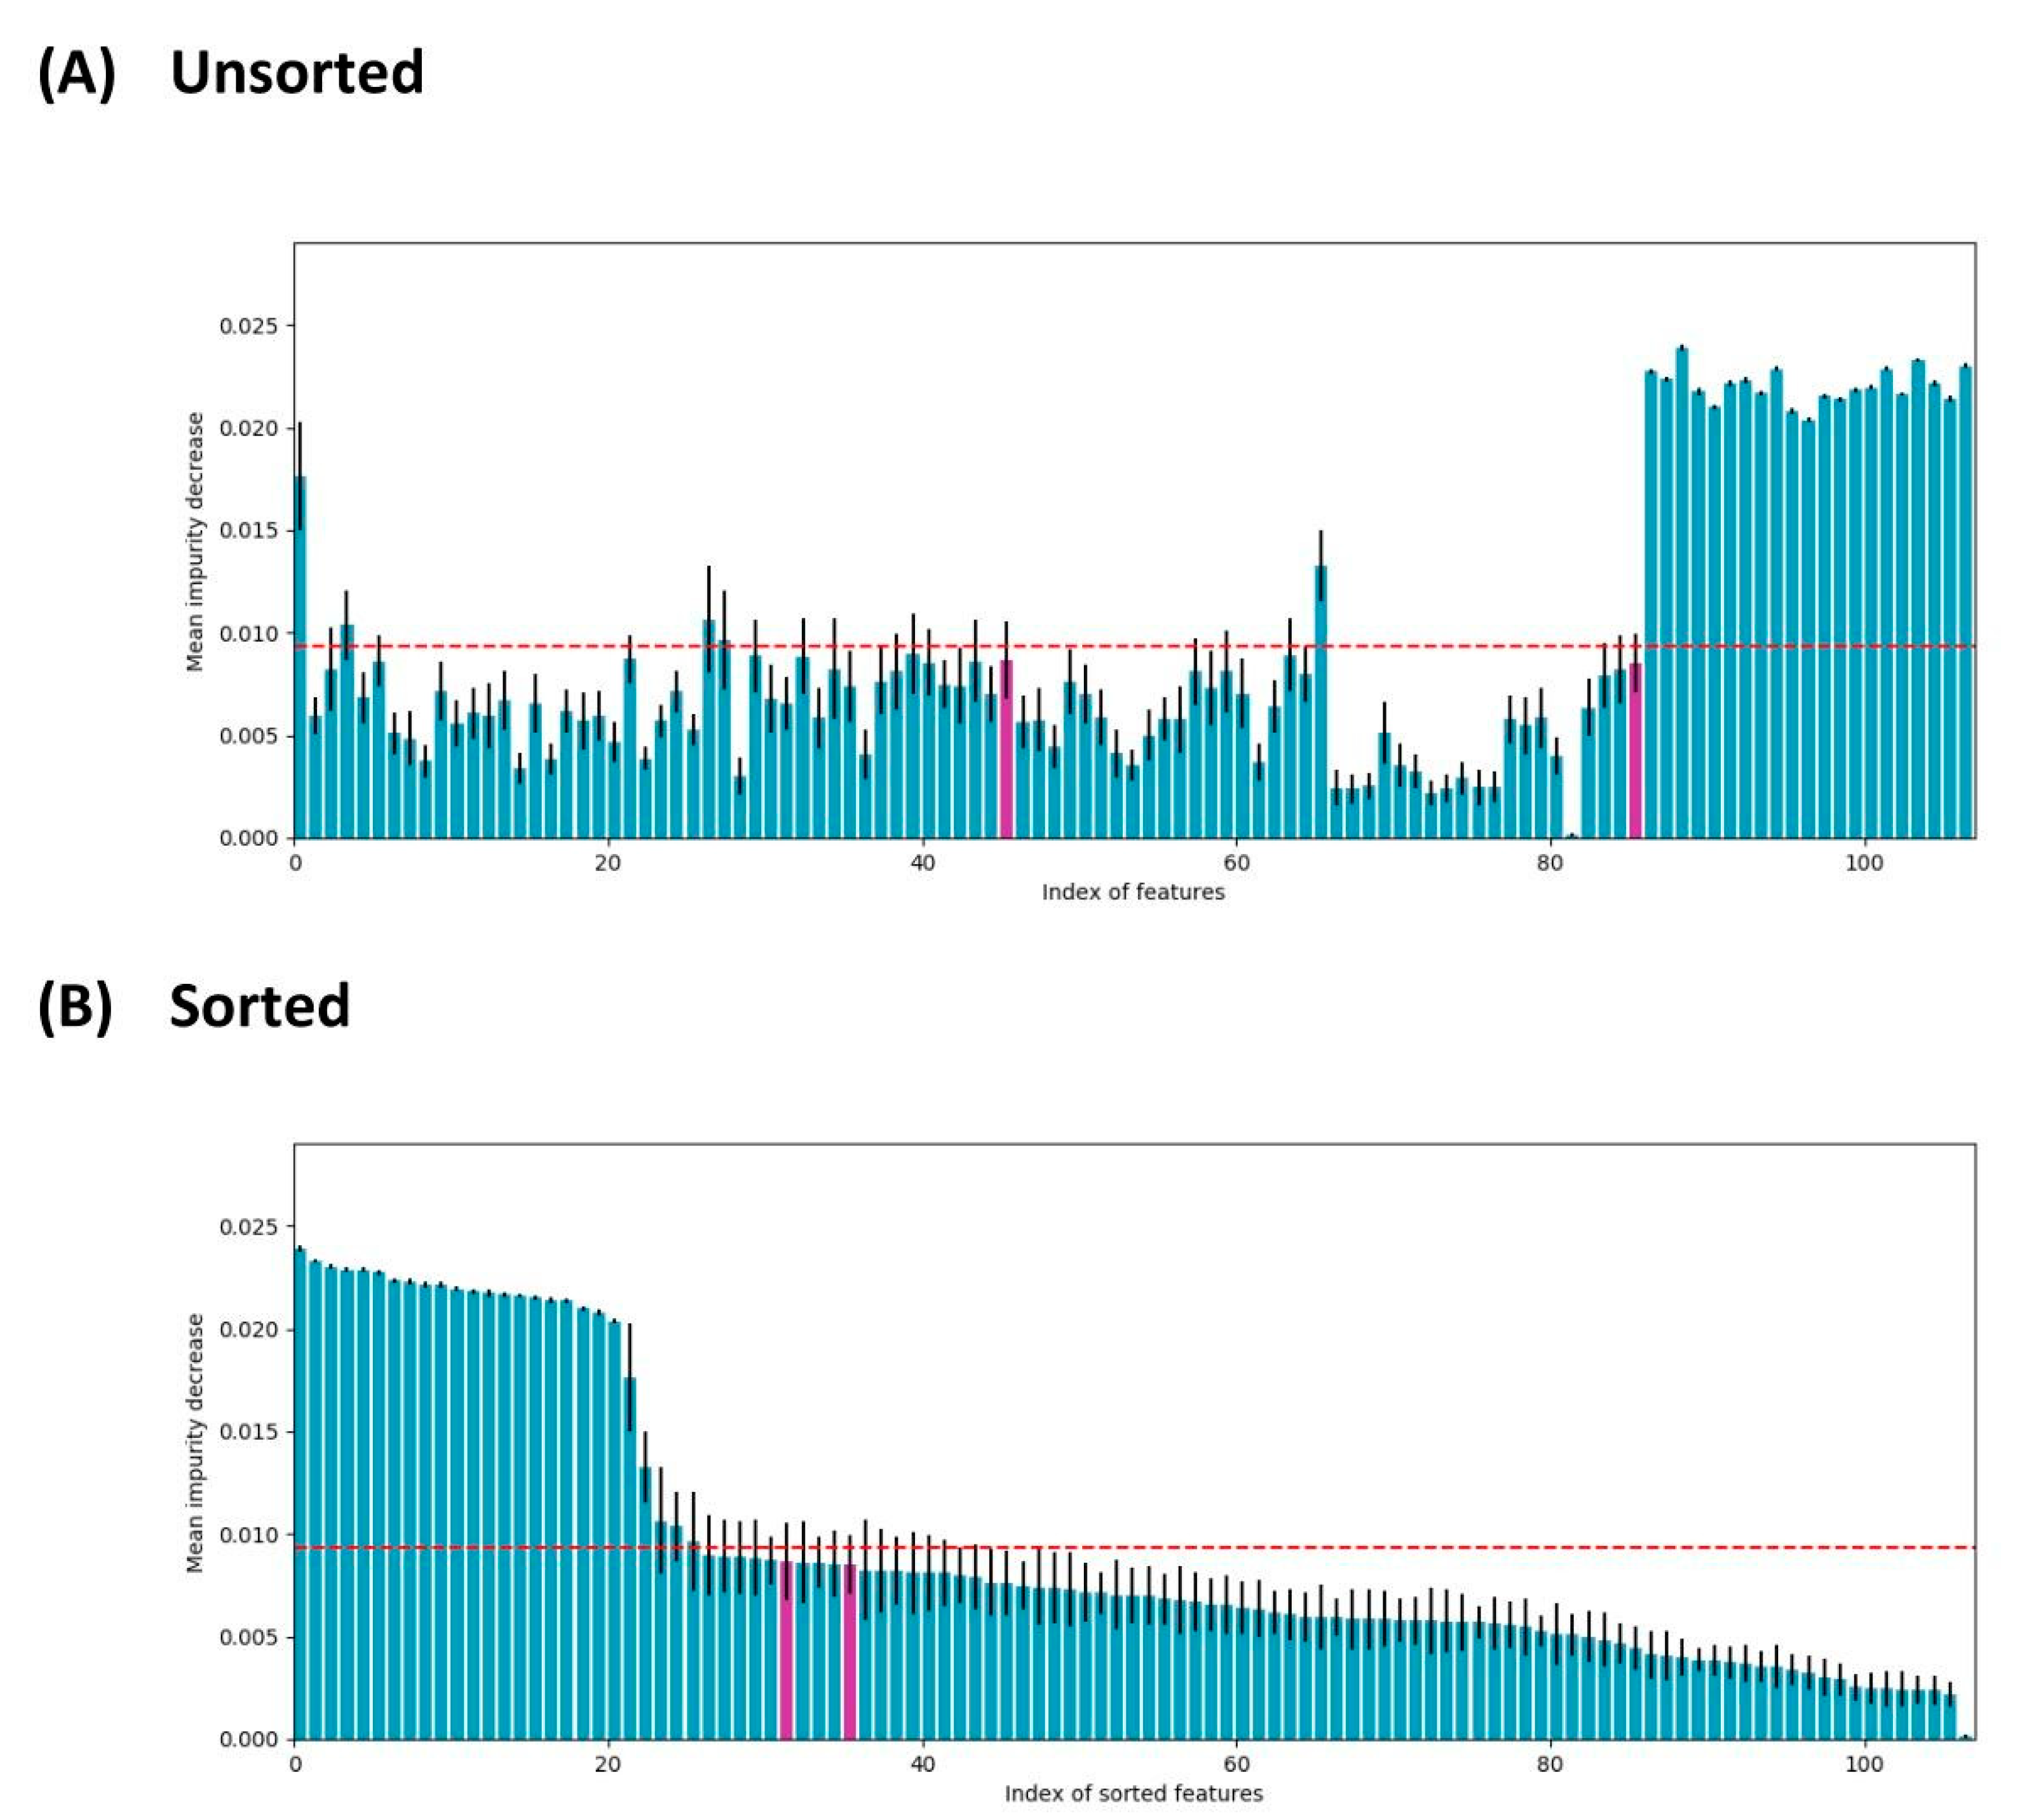
- RandomForestClassifier = RF—Random forest [32] is an ensemble method that aggregates several decision trees (parallel trees). Each tree is generated using a bootstrap sample drawn randomly from the original dataset using a classification or regression tree (CART) method and the Decrease Gini Impurity (DGI) as the splitting criterion [33]. RF is characterized by low bias and low correlation between individual trees, and high variance;
2.5. ML Workflow
3. Results and Discussion
- -
- One np–compound pair feature: prob;
- -
- 5 np features using 5 experimental conditions (c0-c4): np_DVnpu(c0), np_DUccoat(c1), np_DVnpu(c2), np_DPnpu(c3), np_DPnpu(c4);
- -
- 21 drug/compound features using 7 experimental conditions (c0-c6): d_DMw(c0), d_DALOGP(c0), d_DPSA(c0), d_DMw(c1), d_DALOGP(c1), d_DPSA(c1), d_DMw(c2), d_DALOGP(c2), d_DPSA(c2), d_DMw(c3), d_DALOGP(c3), d_DPSA(c3), d_DMw(c4), d_DALOGP(c4), d_DPSA(c4), d_DMw(c5), d_DALOGP(c5), d_DPSA(c5), d_DMw(c6), d_DALOGP(c6) and d_DPSA(c6).
- -
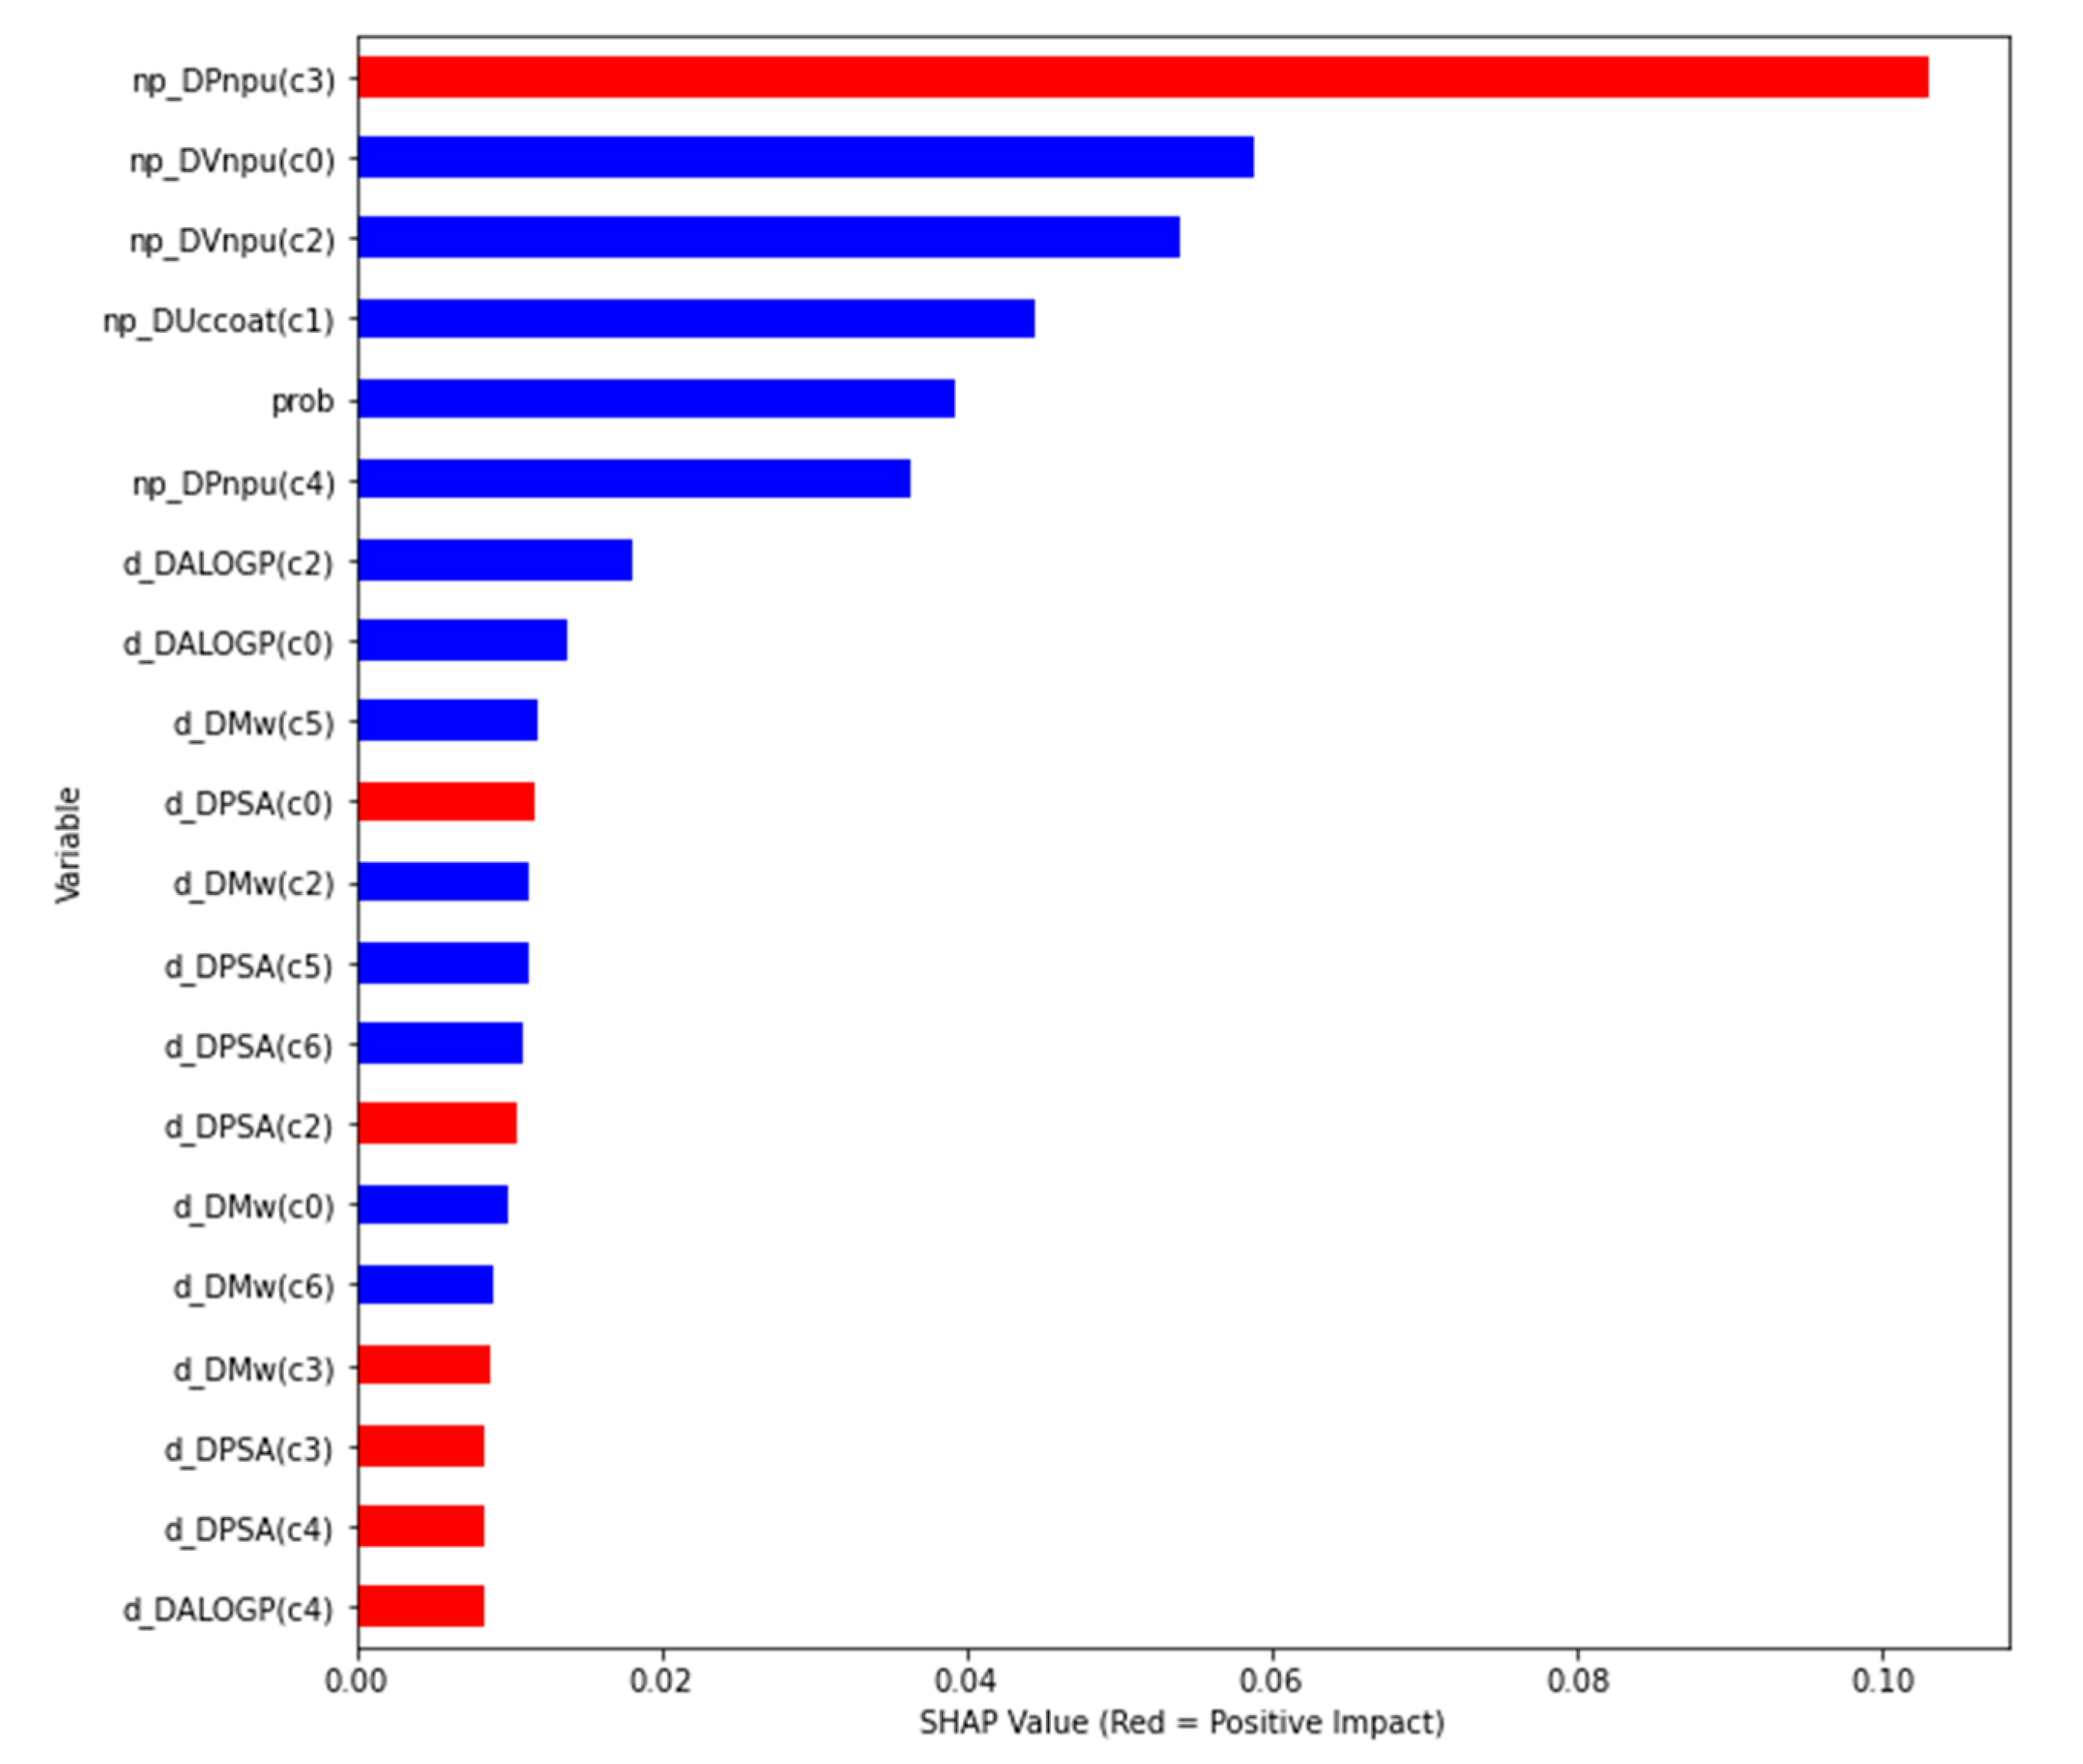
- global interpretability: how much each feature contributes, either positively or negatively, to the output variable;
- -
- local interpretability: each case/instance gets its own SHAP values in order to explain why a case has a specific prediction, and the contribution of the features to this instance.
- -
- Feature importance using SHAP values: the variables are ranked in descending order;
- -
- Impact on the prediction value using SHAP values on x-axis;
- -
- Color shows whether that variable has a positive (in red) or a negative (in blue) impact on the output variable.
4. Conclusions
Author Contributions
Funding
Acknowledgments
Conflicts of Interest
References
- Dutta, P.P.; Bordoloi, M.; Gogoi, K.; Roy, S.; Narzary, B.; Bhattacharyya, D.R.; Mohapatra, P.K.; Mazumder, B. Antimalarial silver and gold nanoparticles: Green synthesis, characterization and In Vitro study. Biomed. Pharmacother. 2017, 91, 567–580. [Google Scholar] [CrossRef] [PubMed]
- Abinaya, M.; Vaseeharan, B.; Divya, M.; Sharmili, A.; Govindarajan, M.; Alharbi, N.S.; Kadaikunnan, S.; Khaled, J.M.; Benelli, G. Bacterial exopolysaccharide (EPS)-coated ZnO nanoparticles showed high antibiofilm activity and larvicidal toxicity against malaria and zika virus vectors. J. Trace Elem. Med. Biol. 2018, 45, 93–103. [Google Scholar] [CrossRef] [PubMed]
- Quevedo-Tumailli, V.F.; Ortega-Tenezaca, B.; González-Díaz, H. Chromosome gene orientation inversion networks (GOINs) of plasmodium proteome. J. Proteome Res. 2018, 17, 1258–1268. [Google Scholar] [CrossRef]
- Ferreira da Costa, J.; Silva, D.; Caamaño, O.; Brea, J.M.; Loza, M.I.; Munteanu, C.R.; Pazos, A.; García-Mera, X.; González-Díaz, H. Perturbation theory/machine learning model of ChEMBL data for dopamine targets: Docking, synthesis, and assay of new L-prolyl-L-leucyl-glycinamide peptidomimetics. ACS Chem. Neurosci. 2018, 9, 2572–2587. [Google Scholar] [CrossRef] [PubMed]
- Martínez-Arzate, S.G.; Tenorio-Borroto, E.; Barbabosa Pliego, A.; Díaz-Albiter, H.M.; Vázquez-Chagoyán, J.C.; González-Díaz, H. PTML model for proteome mining of B-cell epitopes and theoretical-experimental study of Bm86 protein sequences from Colima, Mexico. J. Proteome Res. 2017, 16, 4093–4103. [Google Scholar] [CrossRef]
- Liu, Y.; Tang, S.; Fernandez-Lozano, C.; Munteanu, C.R.; Pazos, A.; Yu, Y.-Z.; Tan, Z.; González-Díaz, H. Experimental study and random forest prediction model of microbiome cell surface hydrophobicity. Expert Syst. Appl. 2017, 306–316. [Google Scholar] [CrossRef]
- González-Durruthy, M.; Werhli, A.V.; Seus, V.; Machado, K.S.; Pazos, A.; Munteanu, C.R.; González-Díaz, H.; Monserrat, J.M. Decrypting strong and weak single-walled carbon nanotubes interactions with mitochondrial voltage-dependent anion channels using molecular docking and perturbation theory. Sci. Rep. 2017, 7, 13271. [Google Scholar] [CrossRef]
- González-Durruthy, M.; Monserrat, J.M.; Rasulev, B.; Casañola-Martín, G.M.; Barreiro Sorrivas, J.M.; Paraíso-Medina, S.; Maojo, V.; González-Díaz, H.; Pazos, A.; Munteanu, C.R. Carbon nanotubes’ effect on mitochondrial oxygen flux dynamics: Polarography experimental study and machine learning models using star graph trace invariants of raman spectra. Nanomaterials 2017, 7, 386. [Google Scholar] [CrossRef]
- González-Durruthy, M.; Alberici, L.C.; Curti, C.; Naal, Z.; Atique-Sawazaki, D.T.; Vázquez-Naya, J.M.; González-Díaz, H.; Munteanu, C.R. Experimental-Computational study of carbon nanotube effects on mitochondrial respiration: In silico nano-QSPR machine learning models based on new raman spectra transform with Markov-Shannon entropy invariants. J. Chem. Inf. Model. 2017, 57, 1029–1044. [Google Scholar] [CrossRef]
- Ran, T.; Liu, Y.; Li, H.; Tang, S.; He, Z.; Munteanu, C.R.; González-Díaz, H.; Tan, Z.; Zhou, C. Gastrointestinal spatiotemporal mRNA expression of ghrelin vs growth hormone receptor and new growth yield machine learning model based on perturbation theory. Sci. Rep. 2016, 6, 30174. [Google Scholar] [CrossRef]
- Luan, F.; Kleandrova, V.V.; González-Díaz, H.; Ruso, J.M.; Melo, A.; Speck-Planche, A.; Cordeiro, M.N.D.S. Computer-Aided nanotoxicology: Assessing cytotoxicity of nanoparticles under diverse experimental conditions by using a novel QSTR-perturbation approach. Nanoscale 2014, 6, 10623–10630. [Google Scholar] [CrossRef] [PubMed]
- Kleandrova, V.V.; Luan, F.; González-Díaz, H.; Ruso, J.M.; Speck-Planche, A.; Cordeiro, M.N.D.S. Computational tool for risk assessment of nanomaterials: Novel QSTR-perturbation model for simultaneous prediction of ecotoxicity and cytotoxicity of uncoated and coated nanoparticles under multiple experimental conditions. Environ. Sci. Technol. 2014, 48, 14686–14694. [Google Scholar] [CrossRef] [PubMed]
- Kleandrova, V.V.; Luan, F.; González-Díaz, H.; Ruso, J.M.; Melo, A.; Speck-Planche, A.; Cordeiro, M.N.D.S. Computational ecotoxicology: Simultaneous prediction of ecotoxic effects of nanoparticles under different experimental conditions. Environ. Int. 2014, 73, 288–294. [Google Scholar] [CrossRef] [PubMed]
- Hansch, C. The Advent and Evolution of QSAR at Pomona College. J. Comput. Aided Mol. Des. 2011, 495–507. [Google Scholar] [CrossRef] [PubMed]
- Kubinyi, H. QSAR: Hansch Analysis and Related Approaches. In Methods and Principles in Medicinal Chemistry; Wiley: Hoboken, NJ, USA, 1993. [Google Scholar]
- Cho, S.J.; Hermsmeier, M.A. Genetic algorithm guided selection: Variable selection and subset selection. J. Chem. Inf. Comput. Sci. 2002, 42, 927–936. [Google Scholar] [CrossRef]
- Tetko, I.V.; Tanchuk, V.Y.; Kasheva, T.N.; Villa, A.E. Internet software for the calculation of the lipophilicity and aqueous solubility of chemical compounds. J. Chem. Inf. Comput. Sci. 2001, 41, 246–252. [Google Scholar] [CrossRef]
- Zhang, S.; Golbraikh, A.; Tropsha, A. Development of quantitative structure-binding affinity relationship models based on novel geometrical chemical descriptors of the protein-ligand interfaces. J. Med. Chem. 2006, 49, 2713–2724. [Google Scholar] [CrossRef]
- Davies, M.; Nowotka, M.; Papadatos, G.; Dedman, N.; Gaulton, A.; Atkinson, F.; Bellis, L.; Overington, J.P. ChEMBL web services: Streamlining access to drug discovery data and utilities. Nucleic Acids Res. 2015, 43, W612–W620. [Google Scholar] [CrossRef]
- Papadatos, G.; Overington, J.P. The ChEMBL database: A taster for medicinal chemists. Future Med. Chem. 2014, 6, 361–364. [Google Scholar] [CrossRef]
- Bento, A.P.; Gaulton, A.; Hersey, A.; Bellis, L.J.; Chambers, J.; Davies, M.; Krüger, F.A.; Light, Y.; Mak, L.; McGlinchey, S.; et al. The ChEMBL bioactivity database: An update. Nucleic Acids Res. 2014, 42, D1083–D1090. [Google Scholar] [CrossRef]
- Willighagen, E.L.; Waagmeester, A.; Spjuth, O.; Ansell, P.; Williams, A.J.; Tkachenko, V.; Hastings, J.; Chen, B.; Wild, D.J. The ChEMBL database as linked open data. J. Cheminform. 2013, 5, 23. [Google Scholar] [CrossRef] [PubMed]
- Hu, Y.; Bajorath, J. Growth of ligand-target interaction data in ChEMBL is associated with increasing and activity measurement-dependent compound promiscuity. J. Chem. Inf. Model. 2012, 52, 2550–2558. [Google Scholar] [CrossRef] [PubMed]
- Wassermann, A.M.; Bajorath, J. BindingDB and ChEMBL: Online compound databases for drug discovery. Expert Opin. Drug Discov. 2011, 6, 683–687. [Google Scholar] [CrossRef] [PubMed]
- Gaulton, A.; Bellis, L.J.; Bento, A.P.; Chambers, J.; Davies, M.; Hersey, A.; Light, Y.; McGlinchey, S.; Michalovich, D.; Al-Lazikani, B.; et al. ChEMBL: A large-scale bioactivity database for drug discovery. Nucleic Acids Res. 2012, 40, D1100–D1107. [Google Scholar] [CrossRef]
- Cover, T.; Hart, P. Nearest neighbor pattern classification. IEEE Trans. Inf. Theory 1967, 21–27. [Google Scholar] [CrossRef]
- Hao, J.; Ho, T.K. Machine learning made easy: A review of scikit-learn package in Python programming language. J. Educ. Behav. Stat. 2019, 107699861983224. [Google Scholar] [CrossRef]
- Patle, A.; Chouhan, D.S. SVM Kernel functions for classification. In 2013 International Conference on Advances in Technology and Engineering (ICATE); IEEE: New York, NY, USA, 2013; pp. 1–9. [Google Scholar]
- Peduzzi, P.; Concato, J.; Kemper, E.; Holford, T.R.; Feinstein, A.R. A simulation study of the number of events per variable in logistic regression analysis. J. Clin. Epidemiol. 1996, 49, 1373–1379. [Google Scholar] [CrossRef]
- Cristianini, N. Fisher Discriminant Analysis (Linear Discriminant Analysis). In Dictionary of Bioinformatics and Computational Biology; Wiley: Hoboken, NJ, USA, 2004. [Google Scholar]
- Swain, P.H.; Hauska, H. The decision tree classifier: Design and potential. IEEE Trans. Geosci. Electron. 1977, 15, 142–147. [Google Scholar] [CrossRef]
- Breiman, L. Random forests. Mach. Learn. 2001, 45, 5–32. [Google Scholar] [CrossRef]
- Calle, M.; Urrea, V. Letter to the editor: Stability of random forest importance measures. Brief. Bioinform. 2011, 12, 86–89. [Google Scholar]
- Friedman, J.H. Greedy function approximation: A gradient boosting machine. Ann. Stat. 2001, 29, 1189–1232. [Google Scholar] [CrossRef]
- Chen, T.; Guestrin, C. Xgboost: A Scalable Tree Boosting System. In Proceedings of the 22nd ACM SIGKDD International Conference on Knowledge Discovery and Data Mining, San Francisco, CA, USA, 13–17 August 2016. [Google Scholar]
- Geurts, P.; Ernst, D.; Wehenkel, L. Extremely randomized trees. Mach. Learn. 2006, 3–42. [Google Scholar] [CrossRef]
- D-Bcarrue. D-Bcarrue/NanoDrugsMalaria. Available online: https://github.com/d-bcarrue/NanoDrugsMalaria (accessed on 11 April 2019).
- Moore, D.H. Classification and regression trees, by Leo Breiman, Jerome, H.; Friedman, Richard, A. Olshen, and Charles, J. Stone. Brooks/Cole Publishing, Monterey, 1984, 358 Pages, $27.95. Cytometry 1987, 534–535. [Google Scholar] [CrossRef]
- González-Díaz, H.; Pérez-Montoto, L.G.; Ubeira, F.M. Model for vaccine design by prediction of b-epitopes of iedb given perturbations in peptide sequence, In Vivo process, experimental techniques, and source or host organisms. J. Immunol. Res. 2014, 1–15. [Google Scholar] [CrossRef] [PubMed]
- González-Díaz, H.; Arrasate, S.; Gómez-SanJuan, A.; Sotomayor, N.; Lete, E.; Besada-Porto, L.; Ruso, J.M. General theory for multiple input-output perturbations in complex molecular systems. 1. Linear QSPR electronegativity models in physical, organic, and medicinal chemistry. Curr. Top. Med. Chem. 2013, 13, 1713–1741. [Google Scholar] [CrossRef] [PubMed]
- Casañola-Martin, G.M.; Le-Thi-Thu, H.; Pérez-Giménez, F.; Marrero-Ponce, Y.; Merino-Sanjuán, M.; Abad, C.; González-Díaz, H. Multi-Output model with box-jenkins operators of linear indices to predict multi-target inhibitors of ubiquitin-proteasome pathway. Mol. Divers. 2015, 19, 347–356. [Google Scholar] [CrossRef] [PubMed]
- Tenorio-Borroto, E.; Ramirez, F.R.; Speck-Planche, A.; Cordeiro, M.N.D.S.; Luan, F.; Gonzalez-Diaz, H. QSPR and Flow Cytometry Analysis (QSPR-FCA): Review and new findings on parallel study of multiple interactions of chemical compounds with immune cellular and molecular targets. Curr. Drug Metab. 2014, 15, 414–428. [Google Scholar] [CrossRef]
- Roth, A.E. The Shapley Value: Essays in Honor of Lloyd, S. Shapley; Cambridge University Press: Cambridge, UK, 1988. [Google Scholar]


| c0 = Parameter | nj a | c0 = Parameter | nj |
|---|---|---|---|
| IC50 nM | 30,981 | IC50 ug·mL−1 | 4914 |
| EC50 nM | 10,337 | CC50 | 11,629 |
| c1 = Organism | nj | c1 = Organism | nj |
| Plasmodium falciparum D6 | 564 | Plasmodium falciparum K1 | 6066 |
| Plasmodium falciparum | 35,463 | Plasmodium yoelii yoelii | 36 |
| Plasmodium berghei | 471 | Plasmodium cynomolgi | 15 |
| c2 = Cell name | nj | c2 = Cell name | nj |
| Erythrocyte | 677 | Huh-7 | 118 |
| FM3A | 14 | L6 | 85 |
| HeLa | 19 | MRC5 | 23 |
| Hepatocyte | 28 | Oocyte | 5 |
| HepG2 | 123 | Vero | 156 |
| c3 = Assay organism | nj | c3 = Assay organism | nj |
| Plasmodium falciparum | 31,587 | Plasmodium berghei ANKA | 6 |
| Plasmodium falciparum D10 | 1147 | Plasmodium falciparum 3D7 | 2606 |
| Plasmodium falciparum FcB1/Columbia | 330 | Plasmodium falciparum NF54 | 938 |
| Plasmodium berghei | 461 | Plasmodium falciparum FCR-3/Gambia | 31 |
| c4 = Assay Strain | nj | c4 = Assay Strain | nj |
| W2mef | 39 | W2 | 8591 |
| NF54 | 929 | TM91C235 | 474 |
| W2/Indochina | 31 | VS1 | 25 |
| W2-Mef | 16 | TM90C2B | 68 |
| c5 = Curated by | nj | c5 = Curated by | nj |
| Autocuration | 38,150 | Expert | 2794 |
| Intermediate | 5288 | ||
| c6 = Assay Type | nj | c6 = Assay Type | nj |
| F | 46,179 | B | 53 |
| c0 = Activity (Units) | Statistical Parameters a | ||||||
|---|---|---|---|---|---|---|---|
| <LogP> | <PSA> | n0 | n1 | p1 | d | Cutoff | |
| IC50 nM | 4.128024 | 72.6311 | 30,981 | 8954 | 0.289 | −1 | 100.0 |
| EC50 nM | 4.2390887 | 67.1602 | 10,337 | 1437 | 0.139 | −1 | 100.0 |
| IC50 ug.mL−1 | 4.0724379 | 75.0632 | 4914 | 4889 | 0.994 | −1 | 325.0 |
| CC50 nM | 4.0650589 | 67.7534 | 11,629 | 11,608 | 0.998 | 1 | 100.0 |
| c0 = Parameter | nj a | c0 = Parameter | nj |
|---|---|---|---|
| IC50 nM | 29 | CC50 | 113 |
| EC50 nM | 30 | ||
| c1 = Cell line | nj | c1 = Cell line | nj |
| A549 (H) | 23 | BRL 3A (R) | 4 |
| Lycopersicon esculentum | 16 | 3T3 (M) | 9 |
| HepG2 (H) | 15 | CaCo-2 (H) | 6 |
| c2 = Shape | nj | c2 = Shape | nj |
| Spherical | 61 | Elliptical | 21 |
| Irregular | 3 | Pseudo-spherical | 8 |
| Slice-shaped | 3 | Polyhedral | 3 |
| Needle | 2 | Pyramidal | 10 |
| Rod | 9 | ||
| c3 = Assay Medium | nj | c3 = Assay Medium | nj |
| Dry | 118 | RPMI | 3 |
| H2O | 44 | 1% Triton X-100/H2O | 3 |
| DMEM | 3 | H2O/TMAOH | 1 |
| c4 = Surface coating | nj | c4 = Surface coating | nj |
| UC | 125 | 11-mercaptoundecanoic acid | 3 |
| PEG-Si(OMe)3 | 8 | PVP | 4 |
| PVA | 1 | Propylamonium fragment | 4 |
| Sodium citrate | 17 | Undecylazide fragment | 2 |
| c0 = Activity (Units) | Statistical Parameters a | ||||||
|---|---|---|---|---|---|---|---|
| <LogP> | <PSA> | n0 | n1 | p1 | d | Cutoff | |
| EC50 uM | 1.66 | 18.02 | 30 | 27 | 0.9 | −1 | 25,422 |
| IC50 uM | 3.24 | 38.79 | 29 | 21 | 0.7241 | −1 | 18,714 |
| CC50 uM | 1.63 | 24.97 | 113 | 21 | 0.1858 | 1 | 3099 |
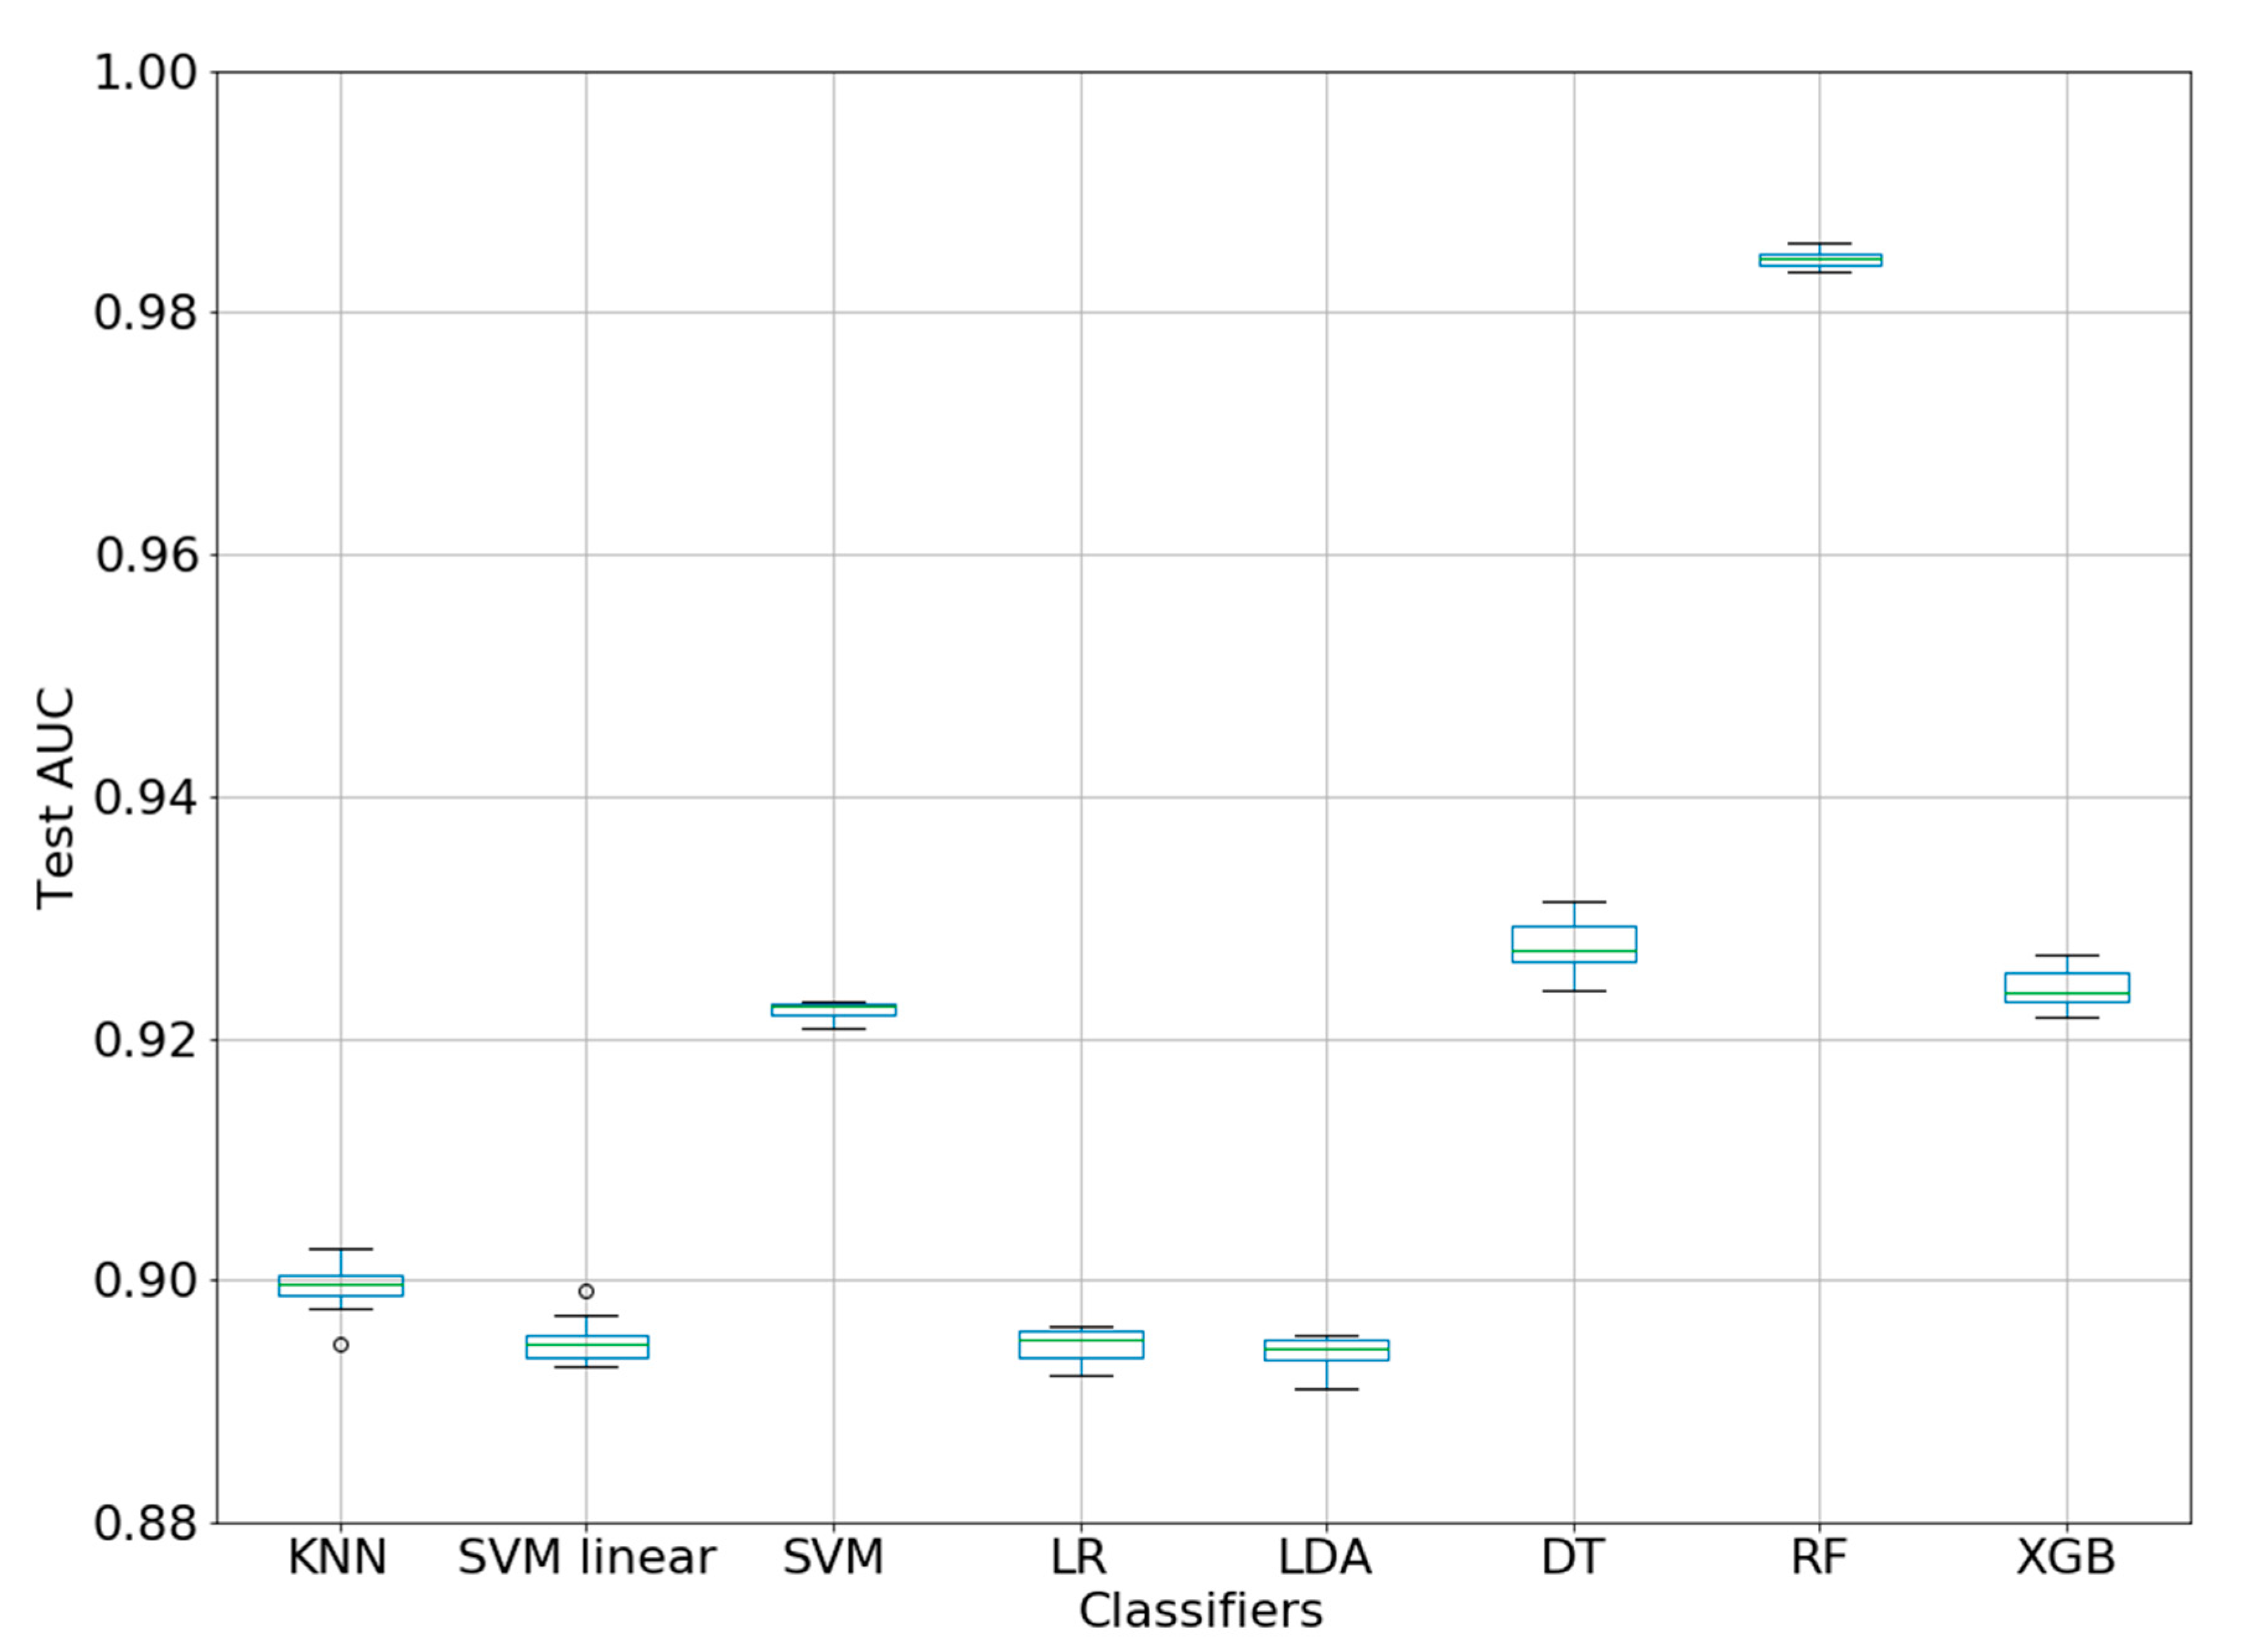
| ML Method. | Classifier | AUC Mean + sd |
|---|---|---|
| KNN | KNeighborsClassifier | 0.8994 ± 0.0022 |
| SVM linear | SVC(linear) | 0.8949 ± 0.0019 |
| SVM | SVC(rbf) | 0.9223 ± 0.0007 |
| LR | LogisticRegression | 0.8946 ± 0.0013 |
| LDA | LinearDiscriminantAnalysis | 0.8939 ± 0.0015 |
| DT | DecisionTreeClassifier | 0.9277 ± 0.0021 |
| RF | RandomForestClassifier | 0.9844 ± 0.0007 |
| XGB | XGBClassifier | 0.9242 ± 0.0017 |
© 2020 by the authors. Licensee MDPI, Basel, Switzerland. This article is an open access article distributed under the terms and conditions of the Creative Commons Attribution (CC BY) license (http://creativecommons.org/licenses/by/4.0/).
Share and Cite
Urista, D.V.; Carrué, D.B.; Otero, I.; Arrasate, S.; Quevedo-Tumailli, V.F.; Gestal, M.; González-Díaz, H.; Munteanu, C.R. Prediction of Antimalarial Drug-Decorated Nanoparticle Delivery Systems with Random Forest Models. Biology 2020, 9, 198. https://doi.org/10.3390/biology9080198
Urista DV, Carrué DB, Otero I, Arrasate S, Quevedo-Tumailli VF, Gestal M, González-Díaz H, Munteanu CR. Prediction of Antimalarial Drug-Decorated Nanoparticle Delivery Systems with Random Forest Models. Biology. 2020; 9(8):198. https://doi.org/10.3390/biology9080198
Chicago/Turabian StyleUrista, Diana V., Diego B. Carrué, Iago Otero, Sonia Arrasate, Viviana F. Quevedo-Tumailli, Marcos Gestal, Humbert González-Díaz, and Cristian R. Munteanu. 2020. "Prediction of Antimalarial Drug-Decorated Nanoparticle Delivery Systems with Random Forest Models" Biology 9, no. 8: 198. https://doi.org/10.3390/biology9080198
APA StyleUrista, D. V., Carrué, D. B., Otero, I., Arrasate, S., Quevedo-Tumailli, V. F., Gestal, M., González-Díaz, H., & Munteanu, C. R. (2020). Prediction of Antimalarial Drug-Decorated Nanoparticle Delivery Systems with Random Forest Models. Biology, 9(8), 198. https://doi.org/10.3390/biology9080198