Article

Temperature Decreases Spread Parameters of the New Covid-19 Case Dynamics

by
Jacques Demongeot
1,*,
Yannis Flet-Berliac
2 and
Hervé Seligmann
1,3
1
Laboratory AGEIS EA 7407, Team Tools for e-Gnosis Medical & Labcom CNRS/UGA/OrangeLabs Telecom4Health, Faculty of Medicine, Université Grenoble Alpes, F-38700 La Tronche, France
2
Laboratory CRIStAL, UMR 9189, CNRS, Université de Lille, Campus Scientifique, Avenue Henri Poincaré, F-59655 Villeneuve d’Ascq, France
3
The National Natural History Collections, The Hebrew University of Jerusalem, Jerusalem 91404, Israel
*
Author to whom correspondence should be addressed.
Biology 2020, 9(5), 94; https://doi.org/10.3390/biology9050094
Submission received: 31 March 2020 / Revised: 24 April 2020 / Accepted: 30 April 2020 / Published: 3 May 2020
(This article belongs to the Special Issue Theories and Models on COVID-19 Epidemics)

Abstract

:
(1) Background: The virulence of coronavirus diseases due to viruses like SARS-CoV or MERS-CoV decreases in humid and hot weather. The putative temperature dependence of infectivity by the new coronavirus SARS-CoV-2 or covid-19 has a high predictive medical interest. (2) Methods: External temperature and new covid-19 cases in 21 countries and in the French administrative regions were collected from public data. Associations between epidemiological parameters of the new case dynamics and temperature were examined using an ARIMA model. (3) Results: We show that, in the first stages of the epidemic, the velocity of contagion decreases with country- or region-wise temperature. (4) Conclusions: Results indicate that high temperatures diminish initial contagion rates, but seasonal temperature effects at later stages of the epidemy remain questionable. Confinement policies and other eviction rules should account for climatological heterogeneities, in order to adapt the public health decisions to possible geographic or seasonal gradients.

1. Introduction

Two coronavirus pandemics occurred in the last 20 years, transmitted from animals to humans: (i) in 2002, the SARS-CoV virus provoked a severe acute respiratory syndrome (SARS) and spread from China, with more than 8000 cases and 774 deaths in 30 countries (about 10% mortality) [1] and (ii) in 2012, the MERS-CoV virus caused also a respiratory syndrome and spread from Saudi Arabia, with 1589 cases and 567 deaths in 26 countries (about 30% mortality) [1]. In 2019, the SARS-CoV-2 virus (called also covid-19) epidemic started in China in December in Wuhan (Hubei province) [2]. The SARS-CoV-2 and SARS-CoV genomes are very similar [3] and the spread of SARS-CoV is temperature-dependent [4]. Hence, SARS-CoV-2 is suspected, like other coronaviruses, to have a weather-dependent virulence. The changes in weather alone would not necessarily decrease numbers of confirmed cases during the whole epidemic, but warm and humid weather could make SARS-CoV-2 less transmissible and less stable, provoking a break in the chain of transmission, and hence diminishing the contagious force of the disease [5]. Ancient [1,4,5] studies, as well as characteristics of the covid-19 disease compared to past corona infections like the SARS one [3,6,7,8], suggest that the spread of covid-19 could diminish in warm weather, particularly at the start of the epidemic, and may have a low temperature threshold under which it could spread fastest. These seasonal changes could occur in exactly the same way as for other pathogens, like the common cold or influenza [9,10,11,12]. This phenomenon can be modelled and the deterministic as well as stochastic models [2,13,14,15,16,17,18,19,20,21,22,23,24,25] include potentially temperature-dependent parameters, like the contagion coefficient increasing with cold, dry weather because of faster evaporation of aerosol droplets. The present paper aims to identify such parameters from the covid-19 spread dynamics.
Section 2 describes how we collected information about the covid-19 spread since the beginning of March 2020. Then, we proposed two types of modelling in which parameters can depend on the temperature and we give a statistical method for studying the anti-correlation between the spread velocity and the external temperature. In Section 3, we give the results of the correlation analysis for all French administrative regions and for 21 countries suffering the covid-19 epidemic.

2. Materials and Methods

2.1. Epidemic Data Extraction

We used web sites giving world weather data (like https://www.weather-atlas.com or http://data.un.org/Data.aspx?d=CLINO&f=ElementCode%3A11). Analyses at country level used mean annual temperatures for that country (from https://en.wikipedia.org/wiki/List_of_countries_by_average_yearly_temperature), and mean daily temperatures for the first half of March in the administrative capital of each French administrative region.
Covid-19 spread data exist in databases such as www.who.int/emergencies/diseases/novel-coronavirus-2019, www.cdc.gov/coronavirus/2019-ncov, www.cia.gov/library/publicapublications/the-world-factbook/fields, www.worldometers.info/coronavirus, www.fr.statista.com/statistiques/1101324/morts-coronavirus-monde, www.santepubliquefrance.fr/recherche/#search=COVID-19%20:%20point%20epidemiologique&sort=date). These repositories are updated daily and offer free access to information concerning new cases, deaths and recovered cases, which is sufficient to build and assess mathematical models. Data for countries are from www.worldometers.info/coronavirus and for French administrative regions from www.statista.com/statistics/1101388/coronavirus-france-confirmed-cases. Data collection was constrained by the date of website accession—third week of March—and the availability of adequate data for specific countries at that date. This implies the inclusion of the first record with at least 100 cases after February 15, which excludes some countries for which the spread of the virus was more advanced at that period.
Figure 1 gives an example of data extracted from these databases. Epidemiological kinetics vary among countries, and could be due to differences in weather variables like temperature.

2.2. Modelling the Epidemic Spread with Temperature-Dependent Parameters

The classical epidemic modelling uses the continuous differential approach, which describes the infinitesimal change in the size of population of susceptible (S), infective (I) and recovering (R) individuals between times t and t + dt. This model explains the dynamics of epidemic spread, following the classical Bernoulli-d’Alembert-Ross equations [14]:
S/∂t = rSbSIk1S + vSS, ∂I/∂t = bSIk2Ik2Ik1I + vII, ∂R/∂t = k2Ik1R + vRR,
where r is a renewal coefficient (depending on natality and immigration), v’s are diffusion coefficients (depending on population displacements), b is the contagion coefficient, which can depend on temperature, and the constants k1 and k2 are, respectively, the natural death rate and the specific epidemic death rate. An example of this continuous differential approach, applied to the covid-19 spread, has been developed by P. Magal [2], and more sophisticated approaches would take into account more general demographic (age-classes), sociologic (socio-economic categories), geographic (latitude and altitude) and climatic (temperature and humidity) variations explaining the heterogeneity of the data between the regions of the same countries and between the countries of the same geo-climato-demographic cluster. Some parameter dependencies are described in [14,15,16], like the dependency of v on altitude, b on temperature and humidity and k’s on age. The applications described in [14,16] have been performed, respectively, on classical Black Death data from St Anthony’s Order and Mali malaria data from O.K. Doumbo.

2.3. Statistical Time Series Modelling

The statistical time series modelling has been introduced by N. Wiener for prediction and forecasting [26]. Its parametric approach assumes that the underlying stationary stochastic process of the covid-19 new daily cases N(t) can be described using a small number of parameters using the autoregressive ARIMA model N(t) = Σi=1,s a(i) N(i) + W(t), where W is a random residue whose variance is to minimize. The autocorrelation analysis is done by calculating the correlation A(k) between the N(t)’s and N(t − k)’s (t belonging to a moving time window) by using the formula:
A ( k ) = E [ N ( t ) E ( N ( t ) ) ] E [ N ( t k ) E ( N ( t k ) ) ] σ ( N ( t ) ) σ ( N ( t k ) ) ,
where E denotes the expectation and σ the standard deviation. The autocorrelation function A allows examining the serial dependence of the N(t)’s.

2.4. Statistical Analyses for French Administrative Regions and Selected Countries

Daily rates of new cases in French administrative regions and selected countries were correlated with mean temperatures in administrative capitals, using Pearson’s correlation coefficient r.

3. Results

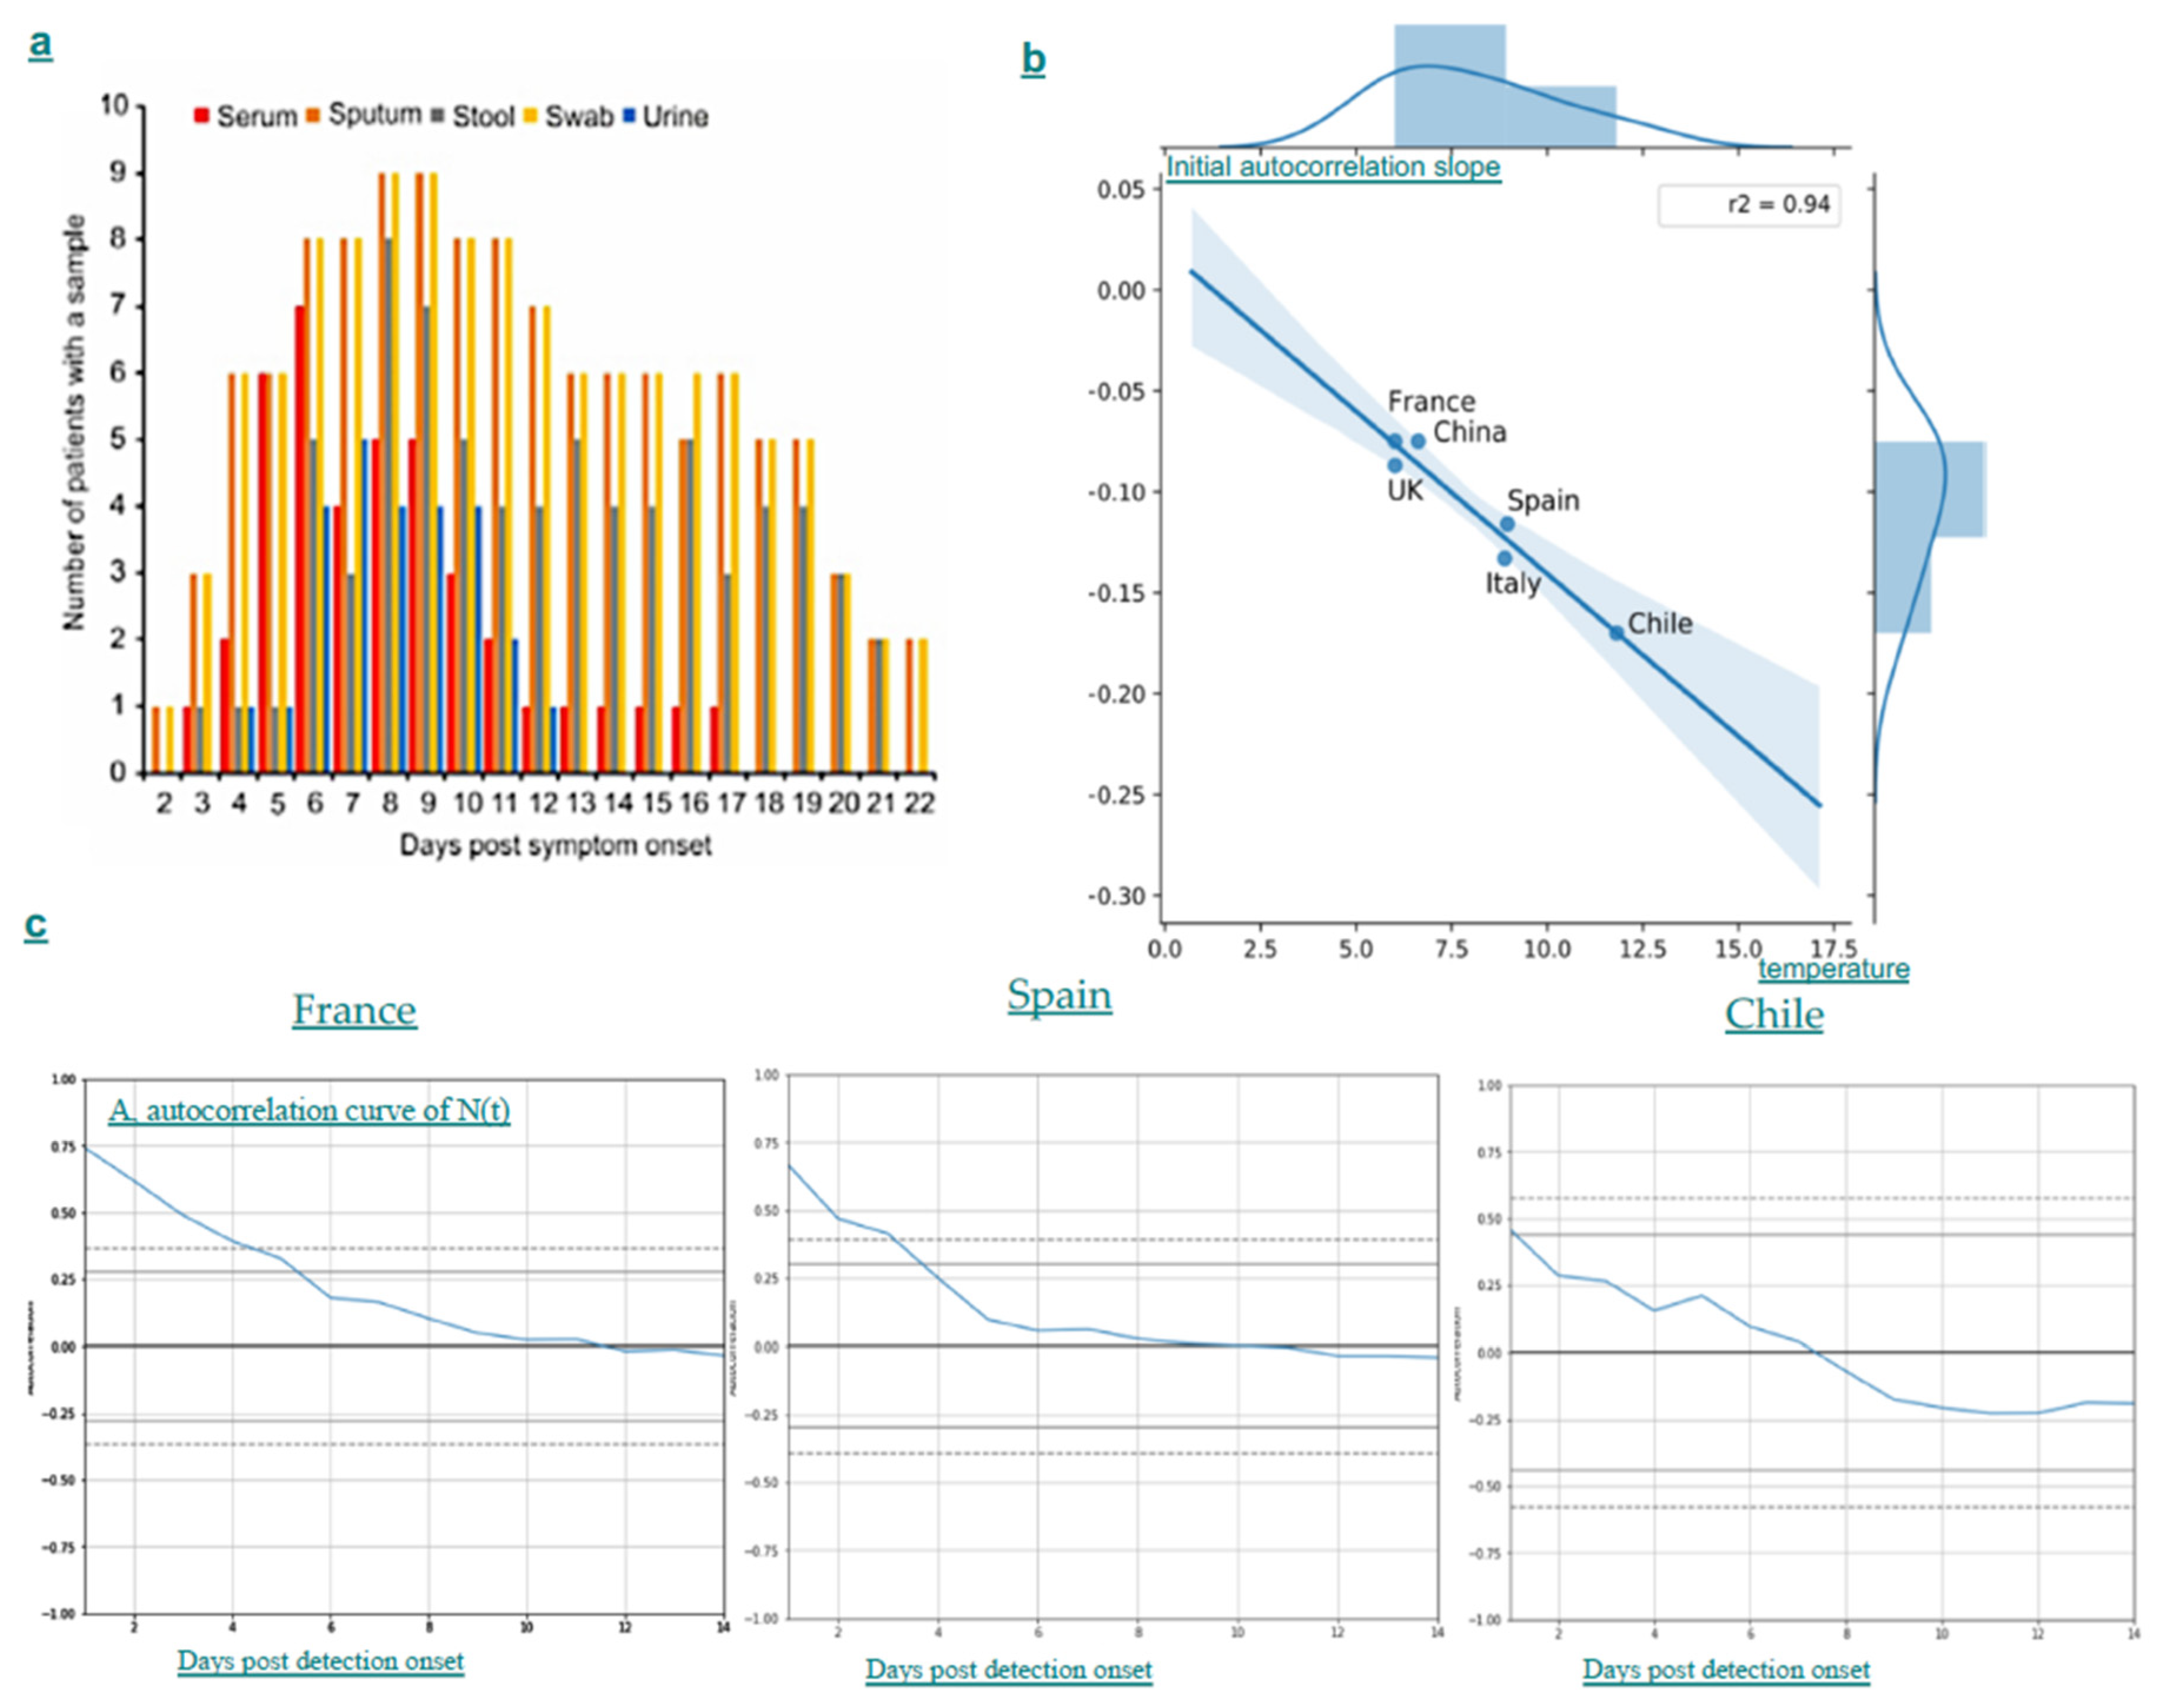
3.1. Temperature Decreases Initial Negative Autocorrelation Slope of Epidemic Spread in Five Countries

By using the classical ARIMA approach on the new cases’ time series in five countries with different weather (mild for France, Mediterranean for Italy, continental for Germany, oceanic for Chile and continental for China), we show that, for all countries, the regression minimizing the standard deviation (STD) of the residue W is of order 6 (Table 1), which is in agreement with the duration of the presence of virus in urine and blood after the mean incubation time of 6 days, which corresponds to the maximum of contagion for sputum, stool and swab (Figure 2a).
From the data of weather-atlas, we can calculate a mean temperature, obtained as the mean of the highest temperatures minus the mean of the lowest temperatures observed each day during February until 14 March 2020. The autocorrelation curves of the ARIMA regression have temperature-dependent shapes and the negative initial slope of their autocorrelation function decreases with the mean temperature (Figure 2b,c), reinforcing the plausibility of our hypothesis that the spread of covid-19 could diminish in warm weather, particularly at the start of the epidemic.

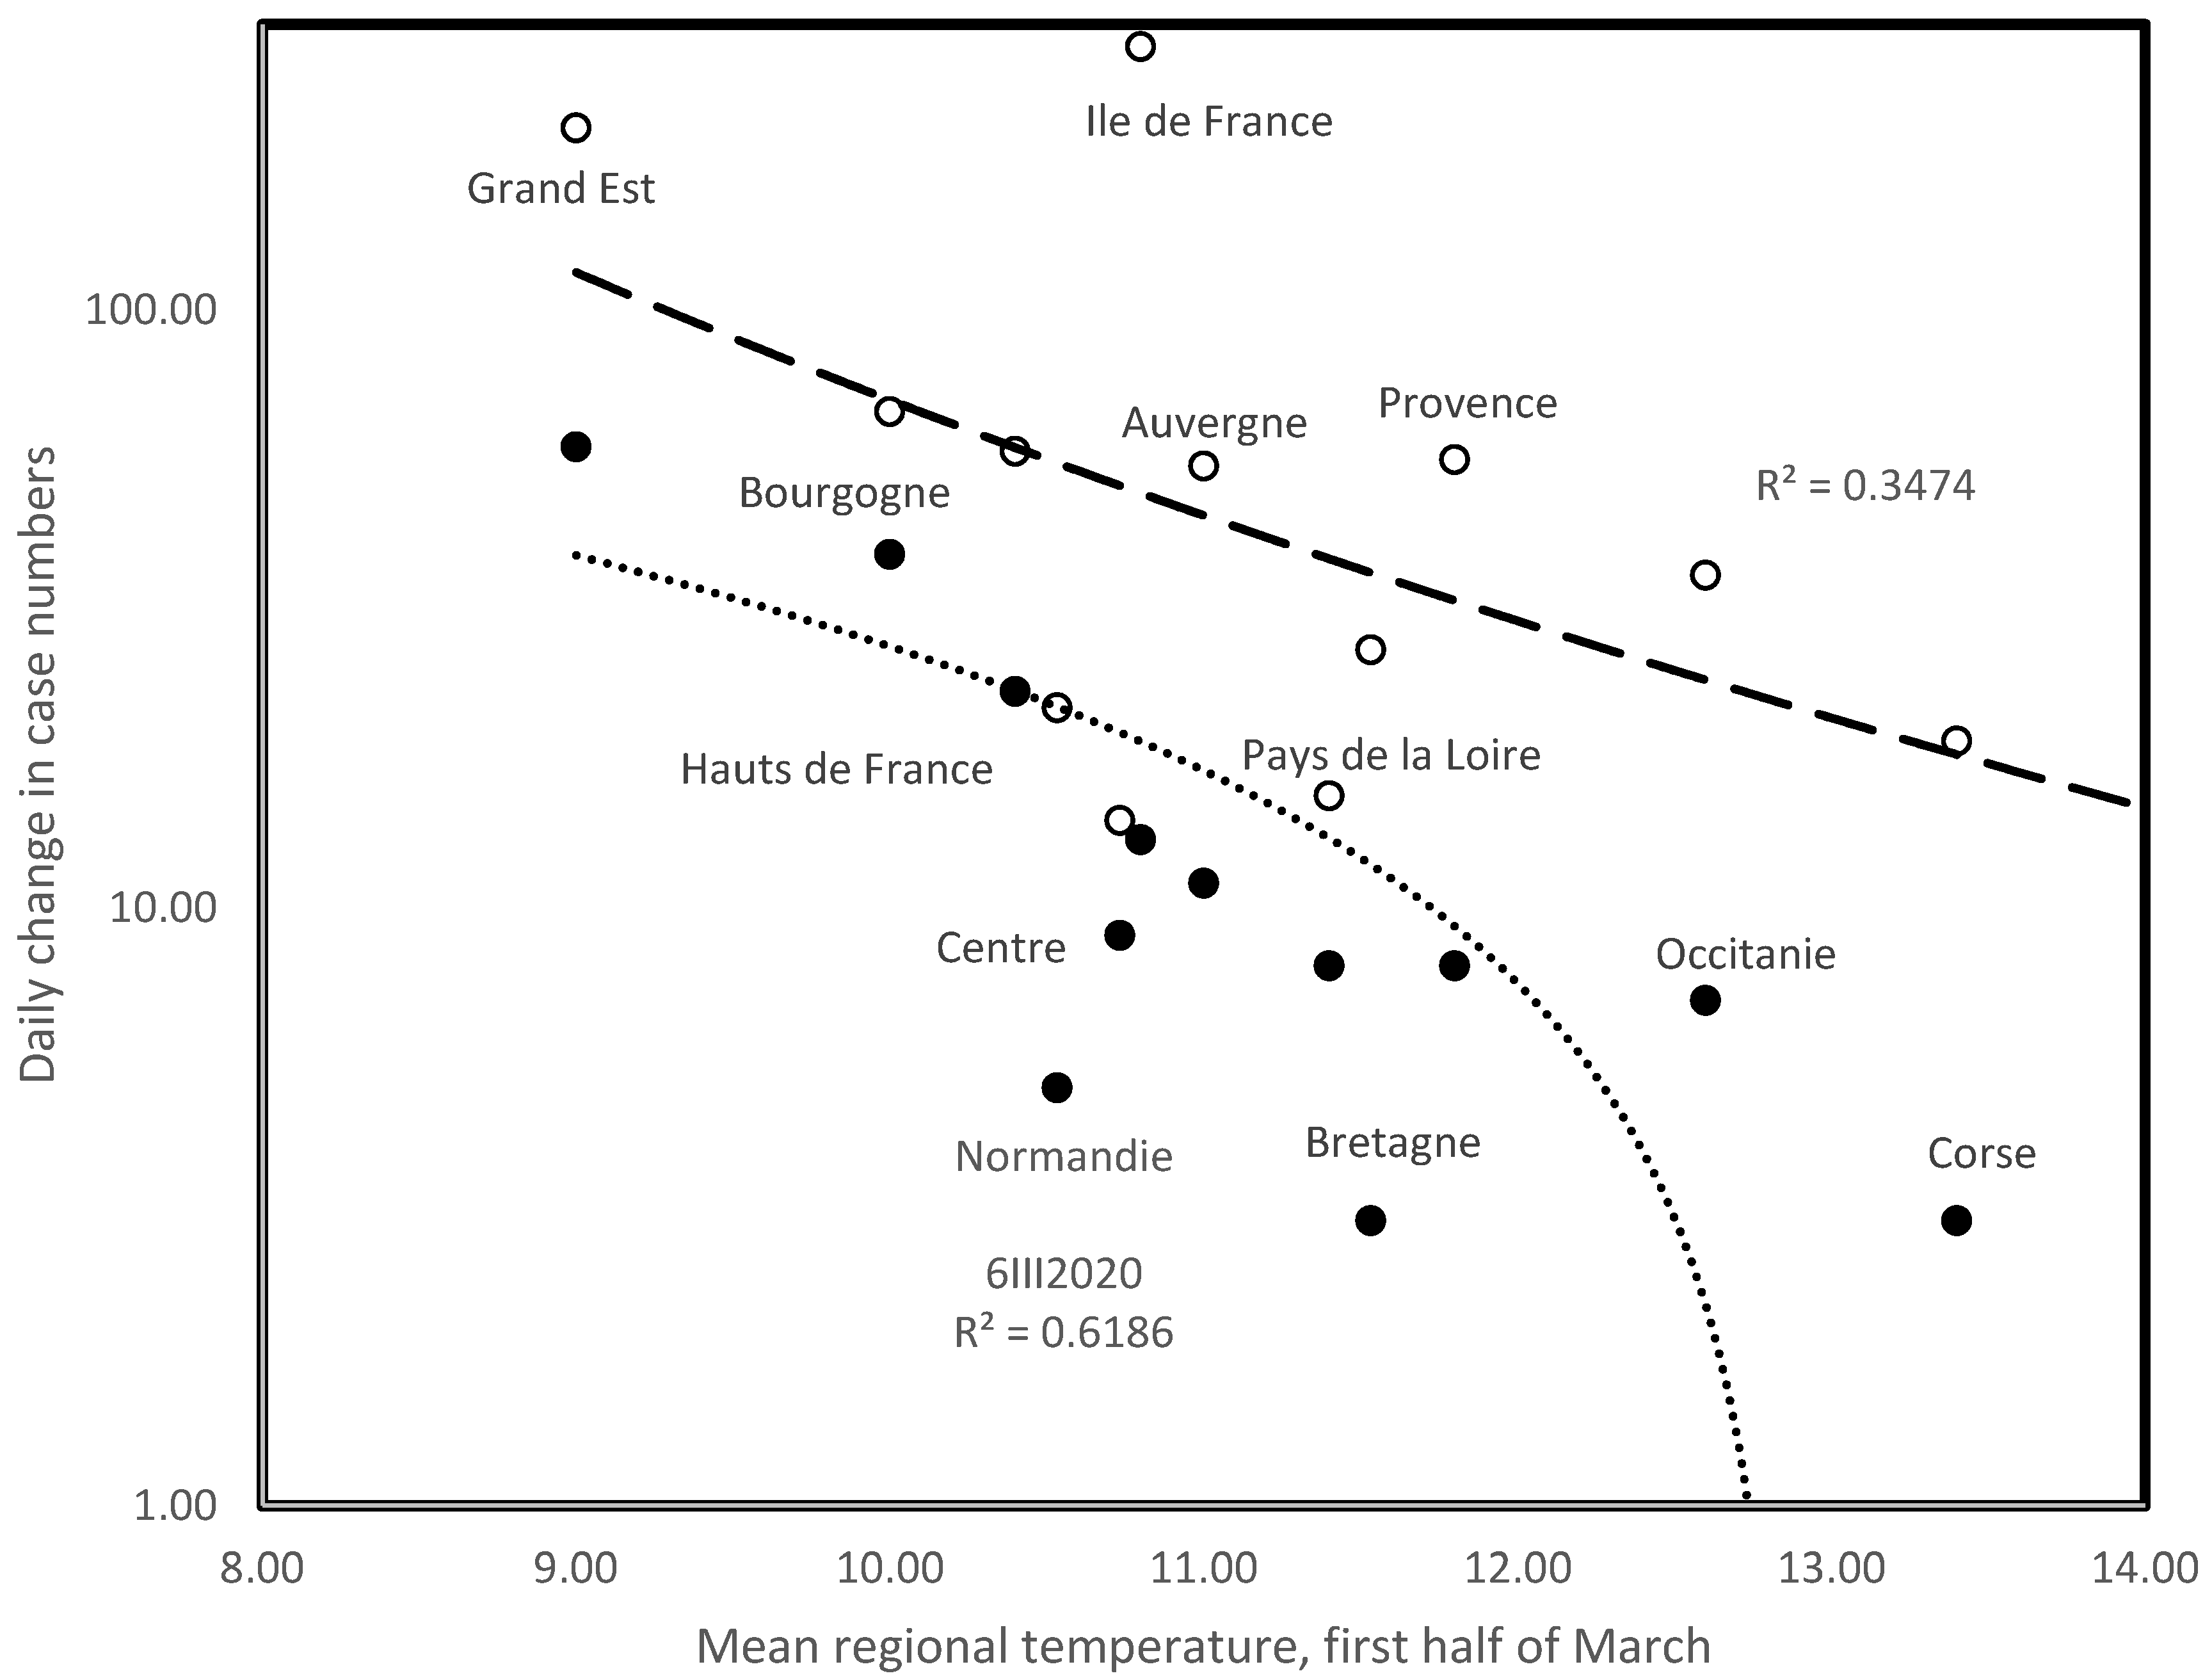
3.2. Temperature Decreases Regional Initial Rates of Epidemic Spread in France

Table 2 presents the mean temperature in the first half of March in the 16 administrative regions of metropolitan France, numbers of confirmed covid-19 cases on 4 March, and ulterior daily rates as compared to data from the previous publication date. The last row shows Pearson correlation coefficients between regional rates of infection and mean temperatures across the period. Correlations show a slower increase in infection rates in warmer regions. The strength of this tendency decreases towards the end of this short period of rapid increase. This suggests that temperature most affects the early phases of epidemic dynamics. Figure 3 presents correlation analyses for two dates, 6 and 15 March 2020. Note that Figure 3 includes R2, which is the square of the Pearson correlation coefficient R. These adjustments are along logarithmic and exponential models for 6 and 15 March, respectively. We give the best (highest R2) models for these dates among linear (y = a.T + b), logarithmic (y = a.ln(T) + b), exponential (ln(y) = a.T + b) and power (ln(y) = a.ln(T) + b) regression models.

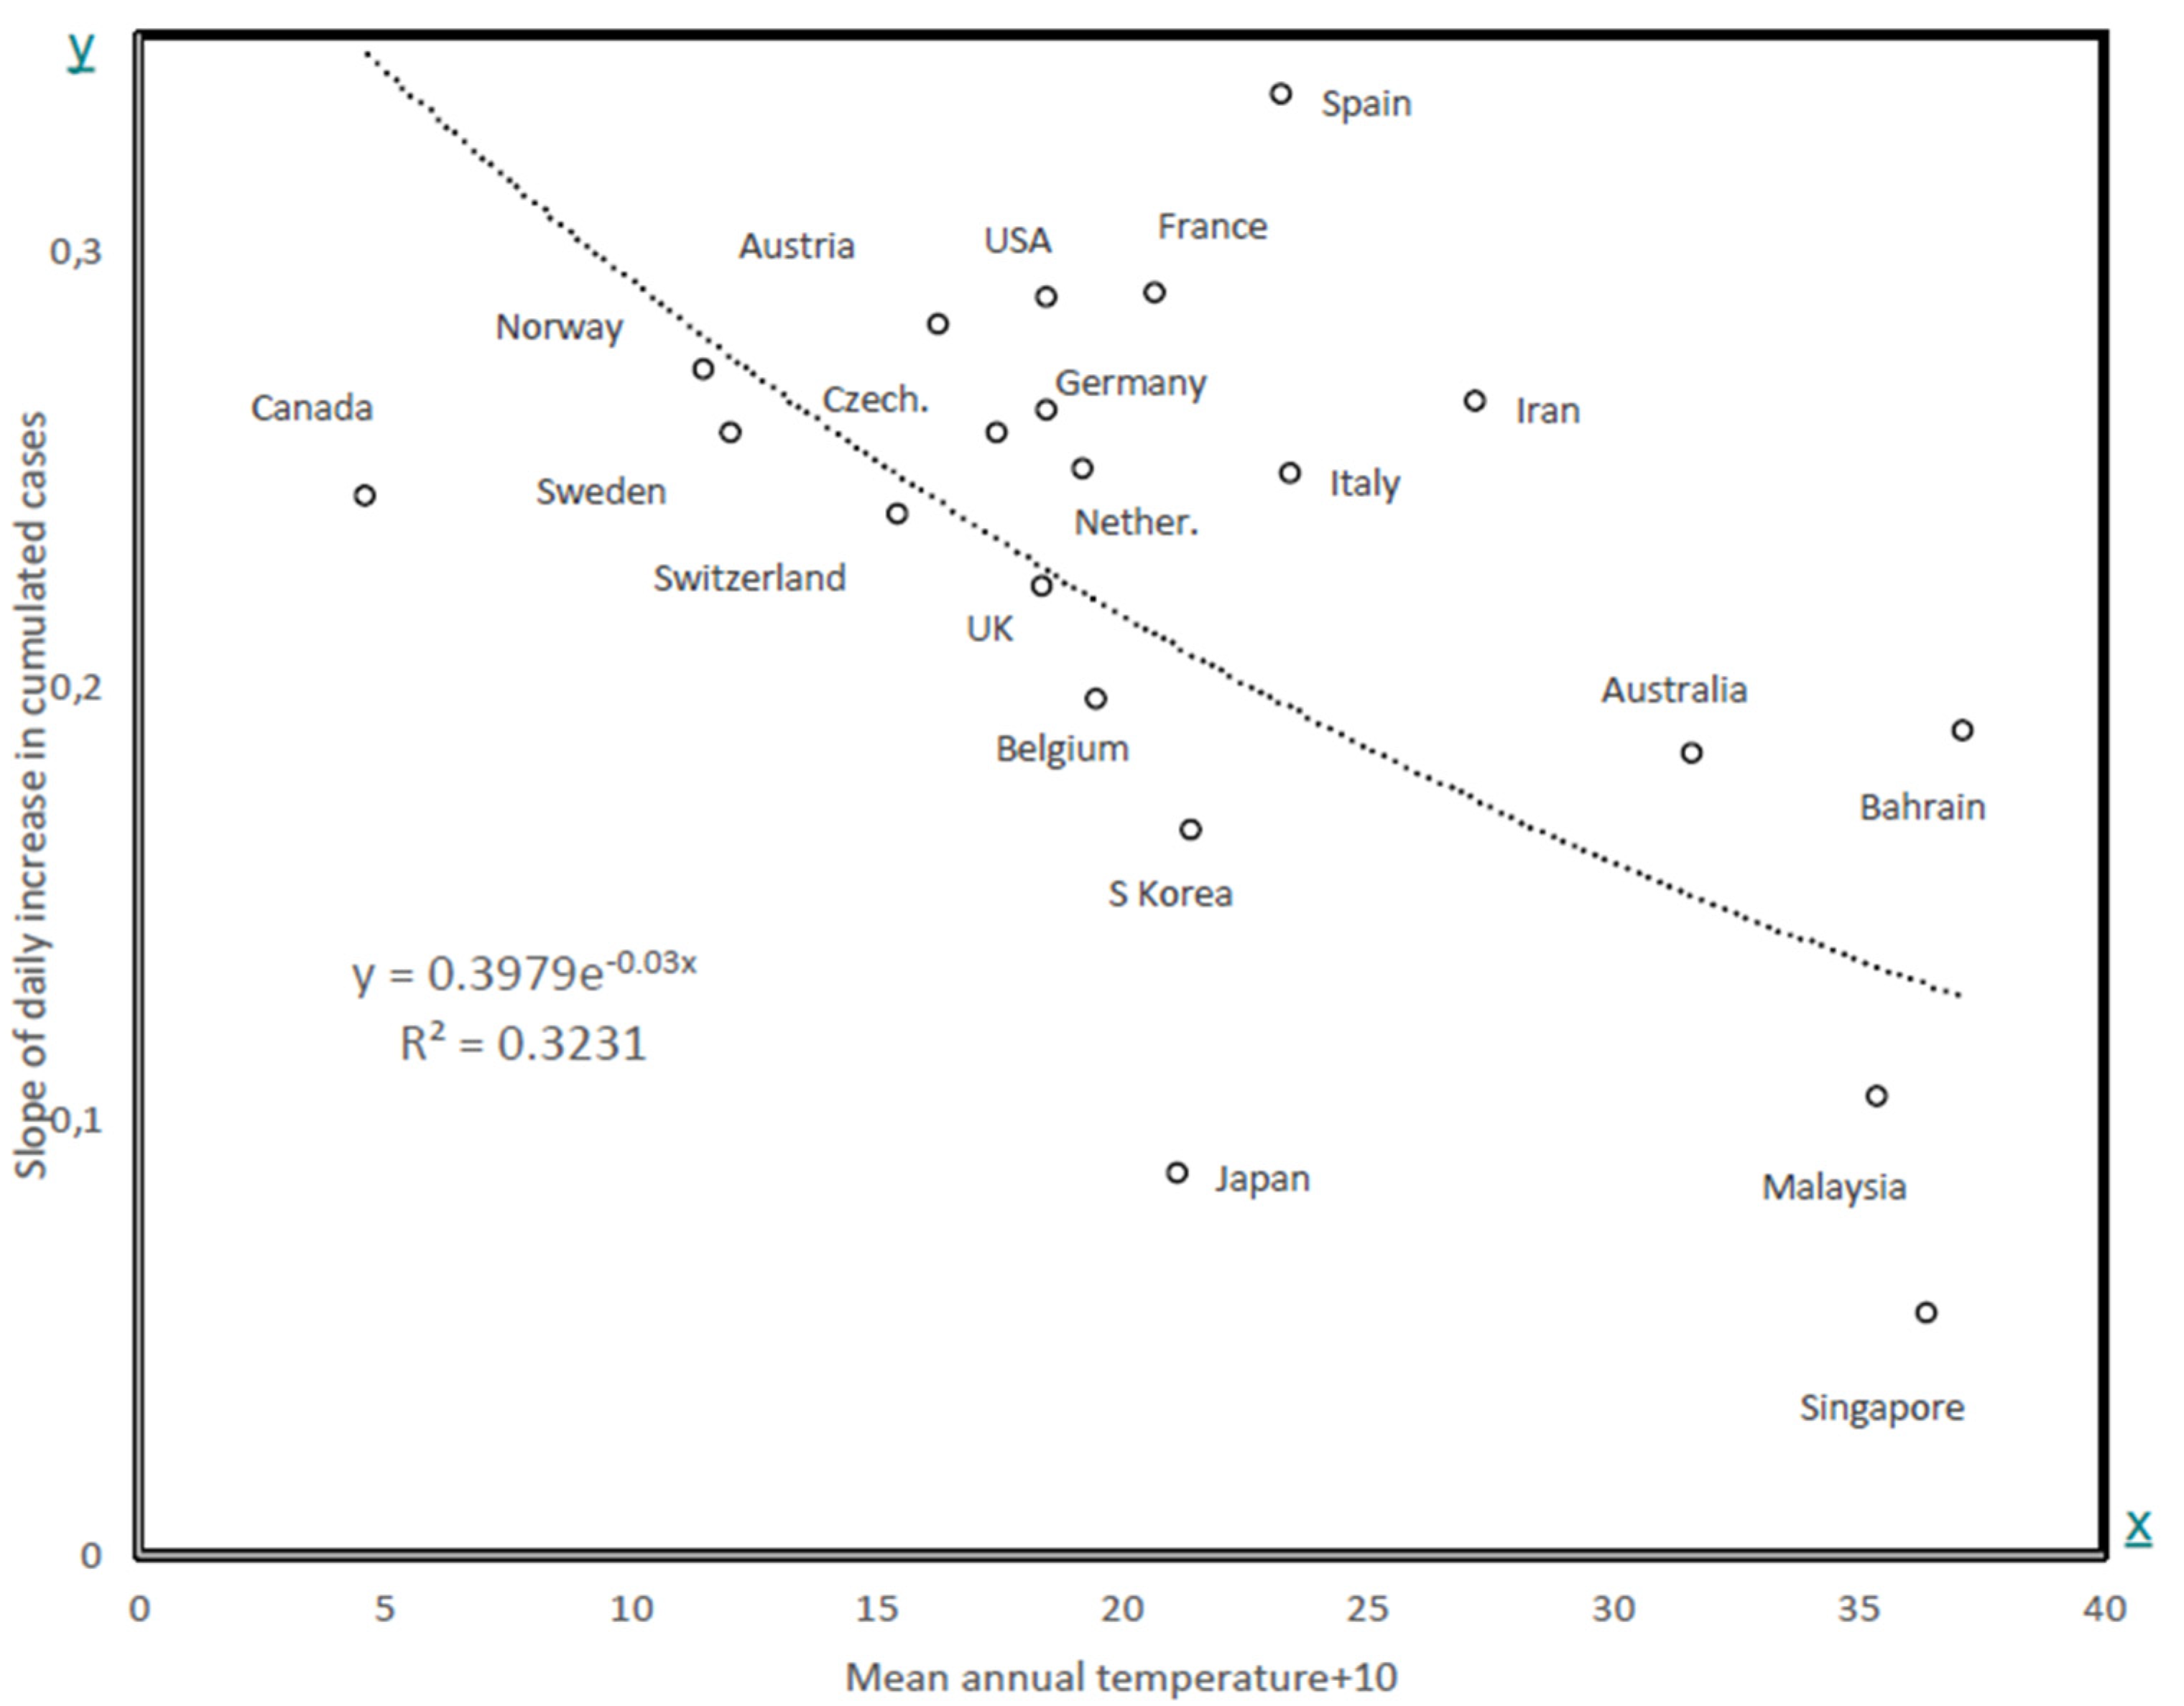
3.3. Temperature Decreases Country-Wise Initial Rates of Epidemic Spread

Table 3 presents the cumulative numbers of confirmed cases for countries with more than 100 cases in at least two days as of 14 March (last measure, besides for South Korea (10 March)). The constant and slope are for the exponential regression model to these data ln(N) = a × D + b, where D is the number of days since N crossed 100 confirmed cases in that country. Figure 4 shows the slope in the last column of Table 3 as a function of the mean annual temperature in that country. Slopes are lower and higher than expected by temperature for Canada and Spain, respectively. The causes for this might range from differences in containment policies and/or populational compliances, to other climatic factors (for example, humidity).

4. Discussion

A study (https://www.accuweather.com/en/health-wellness/coronavirus-expert-says-the-virus-will-burn-itself-out-in-about-6-months/679415) by J. Nicholls from the Sun Yat-sen University in Guangzhou, the capital of south China’s Guangdong province, has determined how the spread of the new coronavirus might be affected by changes in season and temperature.
We show in the present study that the negative initial slope of the autocorrelation curve related to the new daily cases N(t) of covid-19 spread and the duration of the positive autocorrelation period decreases when the weather temperature increases, which corresponds to a shorter duration of the period of contagiousness. The entropy of the distribution of daily R0’s during this period would decrease if the period becomes shorter, for the same overall R0. For example, if the daily R0’s tend to be the same (without peak), the entropy is maximum, equal to the logarithm of the number of contagious days. The decrease in the duration of the contagiousness period is considered favorable and corresponds to the "mitigation" of the contagion. The calculation of the entropy needs a precise estimation of the ARIMA coefficients a(i)’s in the development, N(t) = Σi=1,s a(i) N(i) + W(t), which is difficult during the transient start of the spread, due to the weak number of cases.
The two independent datasets, analysed at the level of French metropolitan administrative regions and of countries, show that temperature affects the increase in the number of cases at relatively local, as well as global, levels. The mechanisms by which temperature decreases the rates of detected cases are unknown. Higher temperatures might prevent the spread of droplets that transmit viruses, perhaps through faster evaporation. Other factors, like the decrease in the virus survival time in atmosphere probably also affect these rates, in particular at the level of the unexplained variation among countries shown in Figure 4. These results have to be considered with caution. They indicate that temperature affects early rates of spreading. It is unclear whether ulterior increases in seasonal temperatures will decrease rates [28,29,30,31]. Indeed, once a dynamic is set, temperature might not affect this dynamic anymore, or affect it only marginally.
Some papers on influenza show that if the warm weather period is followed by a cold season, the rebound of the epidemic could be severe, due to the loss of immune defense [8,15], and the present results have to serve as model for building a system of systematic surveillance along the future months of the covid-19 spread.

5. Conclusions

For more than fifty years, the relationship between weather and diseases has been studied [32]. Such studies are important for predicting viral disease spread, in particular if this leads to pandemics like in case of covid-19, in order to help decisions in public health policies at the world level.

Author Contributions

Conceptualization, J.D. and H.S.; methodology, J.D. and H.S.; validation, J.D. and H.S.; formal analysis, J.D. and H.S.; investigation, Y.F.-B. and H.S.; resources, J.D. and H.S.; data curation, Y.F.-B. and H.S.; writing—original draft preparation, J.D. and H.S.; writing—review and editing, J.D. and H.S.; visualization, H.S.; supervision, J.D. All authors have read and agreed to the published version of the manuscript.

Funding

This research received no external funding.

Conflicts of Interest

The authors declare no conflict of interest.

References

  1. Gong, S.R.; Bao, L.L. The battle against SARS and MERS coronaviruses: Reservoirs and Animal Models. Animal Model Exp. Med. 2018, 1, 125–133. [Google Scholar] [CrossRef] [PubMed] [Green Version]
  2. Liu, Z.; Magal, P.; Seydi, O.; Webb, G. Understanding Unreported Cases in the COVID-19 Epidemic Outbreak in Wuhan, China, and Importance of Major Public Health Interventions. Biology 2020, 9, 50. [Google Scholar] [CrossRef] [PubMed] [Green Version]
  3. Ahmed, S.F.; Quadeer, A.A.; McKay, M.R. Preliminary Identification of Potential Vaccine Targets for the COVID-19 Coronavirus (SARS-CoV-2) Based on SARS-CoV Immunological Studies. Viruses 2020, 12, 254. [Google Scholar] [CrossRef] [Green Version]
  4. Lin, K.; Fong, D.Y.T.; Zhu, B.; Karlberg, J. Environmental Factors on the SARS Epidemic: Air Temperature, Passage of Time and Multiplicative Effect of Hospital Infection. Epidemiol. Infect. 2006, 134, 223–230. [Google Scholar] [CrossRef] [Green Version]
  5. Chan, K.H.; Peiris, J.S.; Lam, S.Y.; Poon, L.L.; Yuen, K.Y.; Seto, W.H. The Effects of Temperature and Relative Humidity on the Viability of the SARS Coronavirus. Adv. Virol. 2011, 2011, 734690. [Google Scholar] [CrossRef] [PubMed]
  6. Duan, S.M.; Zhao, X.S.; Wen, R.F.; Huang, J.J.; Pi, G.H.; Zhang, S.X.; Han, J.; Bi, S.L.; Ruan, L.; Dong, X.P.; et al. Stability of SARS coronavirus in human specimens and environment and its sensitivity to heating and UV irradiation. Biomed. Environ. Sci. 2003, 16, 246–255. [Google Scholar]
  7. Yunoki, M.; Urayama, T.; Yamamoto, I.; Abe, S.; Ikuta, K. Heat sensitivity of a SARS-associated coronavirus introduced into plasma products. Vox Sang. 2004, 87, 302–303. [Google Scholar] [CrossRef]
  8. Guan, W.J.; Ni, Z.Y.; Hu, Y.; Liang, W.-H.; Ou, C.-Q.; He, J.-X.; Liu, L.; Shan, H.; Lei, C.-L.; Hui, D.S.C.; et al. Clinical Characteristics of Coronavirus Disease 2019 in China. N. Engl. J. Med. 2020. [Google Scholar] [CrossRef]
  9. Shinde, G.R.; Kalamkar, A.B.; Mahalle, P.N.; Dey, N.; Chaki, J.; Hassanien, A.B. Forecasting Models for Coronavirus (COVID-19): A Survey of the State-of-the-Art. SN Comput. Sci. TechRxiv Prepr. 2020. Available online: https://www.techrxiv.org/articles/Forecasting_Models_for_Coronavirus_COVID19_A_Survey_of_the_State-of-the-Art/12101547/1 (accessed on 30 April 2020). [CrossRef] [Green Version]
  10. Sajadi, M.M.; Habibzadeh, P.; Vintzileos, A.; Shokouhi, S.; Miralles-Wilhelm, F.; Amoroso, A. Temperature, humidity, and latitude analysis to predict potential spread and seasonality for COVID-19. SSRN Electron. J. 2020. Available online: https://papers.ssrn.com/sol3/papers.cfm?abstract_id=3550308 (accessed on 30 April 2020). [CrossRef]
  11. Towers, S.; Chowell, G.; Hameed, R.; Jastrebski, M.; Khan, M.; Meeks, J.; Mubayi, A.; Harris, G. Climate change & influenza: Likelihood of early and severe influenza seasons following warmer than average winters. PLoS Curr. 2013, 5. [Google Scholar] [CrossRef]
  12. Liu, Q.; Tan, Z.M.; Sun, J.; Hou, Y.; Fu, C.; Wu, Z. Changing rapid weather variability increases influenza epidemic risk in a warming climate. Environ. Res. Lett. 2020, 15, 044004. [Google Scholar] [CrossRef]
  13. Rhodes, C.J.; Demetrius, L. Evolutionary entropy determines invasion success in emergent epidemics. PLoS ONE 2010, 5, e12951. [Google Scholar] [CrossRef] [PubMed] [Green Version]
  14. Gaudart, J.; Ghassani, M.; Mintsa, J.; Rachdi, M.; Waku, J.; Demongeot, J. Demography and Diffusion in epidemics: Malaria and Black Death spread. Acta Biotheor. 2010, 58, 277–305. [Google Scholar] [CrossRef] [PubMed]
  15. Scarpino, S.V.; Petri, G. On the predictability of infectious disease outbreaks. Nat. Commun. 2019, 10, 898. [Google Scholar] [CrossRef] [Green Version]
  16. Gaudart, J.; Touré, O.; Dessay, N.; Dicko, A.L.; Ranque, S.; Forest, L.; Demongeot, J.; Doumbo, O.K. Modelling malaria incidence with environmental dependency in a locality of Sudanese savannah area, Mali. Malaria J. 2009, 8, 61. [Google Scholar] [CrossRef]
  17. Demongeot, J.; Gaudart, J.; Lontos, A.; Promayon, E.; Mintsa, J.; Rachdi, M. Least diffusion zones in morphogenesis and epidemiology. Int. J. Bifurc. Chaos 2012, 22, 1250028. [Google Scholar] [CrossRef] [Green Version]
  18. Demongeot, J.; Gaudart, J.; Mintsa, J.; Rachdi, M. Demography in epidemics modelling. Commun. Pure Appl. Anal. 2012, 11, 61–82. [Google Scholar] [CrossRef]
  19. Guttmann, A.; Ouchchane, L.; Li, X.; Perthus, I.; Gaudart, J.; Demongeot, J.; Boire, J.Y. Performance map of a cluster detection test using the extended power. Int. J. Health Geogr. 2013, 12, 47. [Google Scholar] [CrossRef] [Green Version]
  20. Demongeot, J.; Hansen, O.; Hessami, H.; Jannot, A.S.; Mintsa, J.; Rachdi, M.; Taramasco, C. Random modelling of contagious diseases. Acta Biotheor. 2013, 61, 141–172. [Google Scholar] [CrossRef]
  21. Demongeot, J.; Ghassani, M.; Rachdi, M.; Ouassou, I.; Taramasco, C. Archimedean Copula and Contagion Modeling in Epidemiology. Netw. Heterog. Media 2013, 8, 149–170. [Google Scholar] [CrossRef]
  22. Guttmann, A.; Li, X.; Gaudart, J.; Gerard, Y.; Demongeot, J.; Boire, J.Y.; Ouchchane, L. Spatial heterogeneity of type I error for local cluster detection tests. Int. J. Health Geogr. 2014, 13, 15. [Google Scholar] [CrossRef] [Green Version]
  23. Demongeot, J.; Demetrius, L. Complexity and Stability in Biological Systems. Int. J. Bifurc. Chaos 2015, 25, 40013. [Google Scholar] [CrossRef]
  24. Guttmann, A.; Li, X.; Feschet, F.; Gaudart, J.; Demongeot, J.; Boire, J.Y.; Ouchchane, L. Cluster detection tests in spatial epidemiology: A global indicator for performance assessment. PLoS ONE 2015, 10, e0130594. [Google Scholar] [CrossRef] [PubMed]
  25. Demongeot, J.; Jelassi, M.; Hazgui, H.; Ben Miled, S.; Bellamine Ben Saoud, N.; Taramasco, C. Biological Networks Entropies: Examples in Neural Memory Networks, Genetic Regulation Networks and Social Epidemic Networks. Entropy 2018, 20, 36. [Google Scholar] [CrossRef] [Green Version]
  26. Wiener, N. Extrapolation, Interpolation, and Smoothing of Stationary Time Series; The MIT Press: Cambridge, MA, USA, 1949. [Google Scholar]
  27. Wolfel, R.; Corman, V.M.; Guggemos, W.; Seilmaier, M.; Zange, S.; Müller, M.A.; Niemeyer, D.; Jones Kelly, T.C.; Vollmar, P.; Rothe, C. Virological assessment of hospitalized cases of coronavirus disease 2019. MedRciv 2020. [Google Scholar] [CrossRef] [Green Version]
  28. Oliveiros, B.; Caramelo, L.; Ferreira, N.C.; Caramelo, F. Role of temperature and humidity in the modulation of the doubling time of COVID-19 cases. MedRχiv 2020. [Google Scholar] [CrossRef] [Green Version]
  29. Araujo, M.B.; Naimi, B. Spread of SARS-CoV-2 Coronavirus likely to be constrained by climate. MedRχiv 2020. [Google Scholar] [CrossRef] [Green Version]
  30. Bukhari, Q.; Jameel, Y. Will Coronavirus Pandemic Diminish by Summer? MedRχiv 2020. [Google Scholar] [CrossRef]
  31. Bannister-Tyrrell, M.; Meyer, A.; Faverjon, C.; Cameron, A. Preliminary evidence that higher temperatures are associated with lower incidence of COVID-19, for cases reported globally up to 29th February 2020. MedRχiv 2020. [Google Scholar] [CrossRef]
  32. Faust, V.; Harlfinger, O.; Neuwirth, R. Weather and Disease. 3. Weather-dependent Diseases- Conclusion. Fortschr. Med. 1977, 95, 331–335. [Google Scholar] [PubMed]
Figure 1. Left: Start of covid-19 epidemic in countries with various climates. Right: Daily number of new cases from 25 January until 14 March 2020 in France.
Biology 09 00094 g001
Figure 2. (a) Virulence of covid-19 in liquids and secretions (from [27]); (b) Linear regression of negative initial autocorrelation slope on mean weather temperature of six countries, France, UK, Spain, Italy, China and Chile (Pearson correlation coefficient R = 0.97, one-tailed p = 0.001). (c) Autocorrelation function A for three countries, France, Spain and Chile showing during February until 14 March 2020 a decrease in the positive correlation duration and the negative initial slope of the auto-correlation curve when the mean temperature of the country increases.
Biology 09 00094 g002
Figure 3. Daily increase in confirmed COVID-19 cases for administrative regions of France on 6 March 2020 (filled symbols, dotted line, log regression model) and on 15 March 2020 (circles, interrupted line, exponential regression model).
Biology 09 00094 g003
Figure 4. Slope of exponential model fitted to data in Table 3 as a function of mean annual temperature in that country. The Pearson correlation coefficient is R = −0.568, one-tailed p = 0.0036.
Biology 09 00094 g004
Table 1. ARIMA length of regression of new covid-19 cases on ambient temperature and standard deviation of the residue R(t) for five countries, France, Italy, Germany, Chile and China. (using https://www.statsmodels.org/stable/generated/statsmodels.tsa.arima_model.ARIMA.html)
CountryARIMA (3,1,0)
Residual STD
ARIMA (4,1,0)
Residual STD
ARIMA (5,1,0)
Residual STD
ARIMA (6,1,0)
Residual STD
ARIMA (3,1,1)
Residual STD
France51.8546.8045.8341.2548.06
Italy252.72198.51 184.90230.10
Germany99.9899.9799.9695.5499.97
Chile1.992.00 1.78
China361.52344.30343.50342.61349.15
Table 2. Dependence of the covid-19 new cases on temperature across administrative regions of Figure 2. Columns are: 1. Administrative region; 2. Mean temperature in the first half of March; 3. Numbers of confirmed cases on 4th of March; 4–10. Daily rate in change in number of cases vs previous date. Last row is the Pearson correlation coefficient R of above data in that column with mean temperature. For column 3, the latter correlation is not with a rate, as the date of first infection in that region varies among regions. All R < −0.47615 and R < −0.63385 have p < 0.05 and p < 0.01, respectively, according to one-tailed tests. Results indicate that negative effects of temperature on infection rates are strongest at the beginning of regional epidemics.
French Regions 2020New Cases vs. Previous Day
Temp4III5III6III7III10III15III23III25III
Auvergne-Rhône-Alpes11.004915112749.054.8150.9181.5
Bourgogne-Franche-Comté10.0016233951−2.067.6110.8111.0
Bretagne11.532363814.327.034.056.5
Centre-Val de Loire10.7302951.014.034.0100.0
Corse14.13030212.314.69.915.5
Grand Est9.0038395911479.7201.4345.0611.5
Hauts de France10.40659237625.358.091.3242.0
Ile de France10.8055211315121.3275.6545.6724.5
Normandie10.5324509.721.645.488.5
Nouvelle-Aquitaine13.40533613.319.065.5118.0
Occitanie12.609271811.336.064.6157.5
Pays de la Loire11.4071824.315.423.137.5
Provence-Alpes-Côte d’Azur11.8013581224.056.2139.9208.5
Pearson Rx100 −48.95−68.34−74.73−65.17−34.3−48.1−43.5−43.8
Table 3. Slope of exponential model fitted to data in Table 2 as a function of mean annual temperature in that country. The Pearson correlation coefficient is R = −0.568, one-tailed p = 0.0036.
Country/Day1234567891011121314151617181920ConstSlope
Australia112122140197 88.1380.1832
Austria104112131182302361504 66.2440.2825
Bahrain109110189195210 88.7240.1884
Belgium109169200239267314314599 102.140.1963
Canada138176 108.20.2432
Czech Rep116150 89.7070.257
France100100191212282420613706111614021774226928603640 71.0190.2898
Germany129157196262534639795111211391296156723693062 106.460.2624
Iran141245388593978150123362922351347475823656671618042900010,07511,364 223.370.2641
Italy124229322400650888112816892036250230893858463658837375917210,14912,46215,11317,660169.950.2475
Japan105132144157164186210230239254268284317349408455488514568620107.470.0872
Malaysia117129129129197 100.720.1042
Netherlands128188265321382503614804 112.280.2485
Norway113147169192277489489750 79.0170.2716
S Korea10420434660276397712611766233731503736421248125328576662846767713473827513323.410.1664
Singapore102106108110110117130138150160166178187200 90.3770.0551
Spain11415119825737443058910241639214029654231 71.1260.335
Sweden137161203248326461620775 96.680.2572
Switzerland2092643323324916458581125 155.580.2388
UK118167210277323373460594802 103.550.2223
USA10812914821321321347269698712641678 64.1110.2882

