Simple Summary
Philasterides dicentrarchi is a free-living ciliate that causes high mortality in marine cultured fish, particularly flatfish, and in fish kept in aquaria. At present, there is still no clear picture of what makes this ciliate a fish pathogen and what makes fish resistant to this ciliate. In the present study, we used transcriptomic techniques to evaluate the interactions between P. dicentrarchi and turbot leucocytes during the early stages of infection. The findings enabled us to identify some parasite genes/proteins that may be involved in virulence and host resistance, some of which may be good candidates for inclusion in fish vaccines. Infected fish responded to infection by generating a very potent inflammatory response, indicating that the fish use all of the protective mechanisms available to prevent entry of the parasite. The findings also provide some valuable insight into how the acute inflammatory response occurs in fish.
Abstract
The present study analyses the interactions between Philasterides dicentrarchi (a ciliate parasite that causes high mortalities in cultured flatfish) and the peritoneal cells of the turbot Scophthalmus maximus during an experimental infection. The transcriptomic response was evaluated in the parasites and in the fish peritoneal cells, at 1, 2 and 4 h post-infection (hpi) in turbot injected intraperitoneally (ip) with 107 ciliates and at 12 and 48 hpi in turbot injected ip with 105 ciliates. Numerous genes were differentially expressed (DE) in P. dicentrarchi, relative to their expression in control ciliates (0 hpi): 407 (369 were up-regulated) at 1 hpi, 769 (415 were up-regulated) at 2 hpi and 507 (119 were up-regulated) at 4 hpi. Gene ontology (GO) analysis of the DE genes showed that the most representative categories of biological processes affected at 1, 2 and 4 hpi were biosynthetic processes, catabolic processes, biogenesis, proteolysis and transmembrane transport. Twelve genes of the ABC transporter family and eight genes of the leishmanolysin family were DE at 1, 2 and 4 hpi. Most of these genes were strongly up-regulated (UR), suggesting that they are involved in P. dicentrarchi infection. A third group of UR genes included several genes related to ribosome biogenesis, DNA transcription and RNA translation. However, expression of tubulins and tubulin associated proteins, such as kinesins or dyneins, which play key roles in ciliate division and movement, was down-regulated (DR). Similarly, genes that coded for lysosomal proteins or that participate in the cell cycle mitotic control, glycolysis, the Krebs cycle and/or in the electron transport chain were also DR. The transcriptomic analysis also revealed that in contrast to many parasites, which passively evade the host immune system, P. dicentrarchi strongly stimulated turbot peritoneal cells. Many genes related to inflammation were DE in peritoneal cells at 1, 2 and 4 hpi. However, the response was much lower at 12 hpi and almost disappeared completely at 48 hpi in fish that were able to kill P. dicentrarchi during the first few hpi. The genes that were DE at 1, 2 and 4 hpi were mainly related to the apoptotic process, the immune response, the Fc-epsilon receptor signalling pathway, the innate immune response, cell adhesion, cell surface receptors, the NF-kappaB signalling pathway and the MAPK cascade. Expression of toll-like receptors 2, 5 and 13 and of several components of NF-κB, MAPK and JAK/STAT signalling pathways was UR in the turbot peritoneal cells. Genes expressing chemokines and chemokine receptors, genes involved in prostaglandin and leukotriene synthesis, prostaglandins, leukotriene receptors, proinflammatory cytokines and genes involved in apoptosis were strongly UR during the first four hours of infection. However, expression of anti-inflammatory cytokines such as Il-10 and lipoxygenases with anti-inflammatory activity (i.e., arachidonate 15-lipoxygenase) were only UR at 12 and/or 48 hpi, indicating an anti-inflammatory state in these groups of fish. In conclusion, the present study shows the regulation of several genes in P. dicentrarchi during the early stages of infection, some of which probably play important roles in this process. The infection induced a potent acute inflammatory response, and many inflammatory genes were regulated in peritoneal cells, showing that the turbot uses all the protective mechanisms it has available to prevent the entry of the parasite.
1. Introduction
The subclass Scuticociliatia (Protozoa, Ciliophora) includes several families of free-living ciliates that are abundant in marine habitats. Some scuticociliate species, including P. dicentrarchi, have acquired the capacity to infect fish, causing high mortalities in some cultured fish species, including flatfish [1,2,3,4,5]. However, there is no clear picture of what makes this scuticociliate a fish pathogen. It is generally thought that P. dicentrarchi enters the fish through external lesions and then proliferates in the blood and in most internal organs where it causes important histopathological changes [1,3,6,7,8,9]. Although the mechanisms that P. dicentrarchi uses to invade fish tissues are not known, it has been suggested that during infection the ciliate can release proteases, which are considered virulence factors [10]. Ciliate proteases can destroy components of the turbot humoral immune response [11,12] and modify fish leukocyte functions [13,14], thus providing a mechanism for circumventing the fish immune system. In addition, P. dicentrarchi has developed other mechanisms that appear to be important in relation to parasitism. For example, it possesses mitochondria with two respiratory pathways: the cytochrome pathway, which exists in all aerobic organisms, and an alternative, cyanide-insensitive oxidase pathway, which enables the ciliate to survive and proliferate under normoxic and hypoxic conditions [15] and thus to become adapted to differences in oxygen levels in the host and seawater. In addition, P. dicentrarchi has potent antioxidant defence mechanisms that may be important during infection, including several superoxide dismutases that help the ciliate resist the reactive oxygen species released by the host [16]. Finally, it has been suggested that P. dicentrarchi can release its extrusome contents to create a protective barrier against soluble factors of the host immune system [17].
Several components of P. dicentrarchi stimulate fish leucocytes, thereby increasing respiratory burst, degranulation and the expression of pro-inflammatory cytokines. Despite the high level of stimulation, the toxic substances produced by the fish leucocytes do not seem to be sufficient to kill the parasite [11,18]. However, a turbot NK-lysin (an effector molecule of cytotoxic lymphocytes) has been reported to have very high antiparasitic activity, thus directly affecting the viability of P. dicentrarchi [19]. The innate humoral and adaptive immune responses appear to be crucial in defending the fish against this parasite. In this respect, the complement system plays a key role in the fish defence against this pathogen, as it displays potent antiparasitic activity, especially when activated by the classical pathway [11,20]. In addition to complement, the fish coagulation system also plays an important role in immobilizing and killing the parasite [21].
Little is known about how the fish immune system provides protection against parasites or even how it recognises the parasites (particularly ciliates) or which immune signalling pathways are stimulated. Pardo et al. [22,23] investigated how P. dicentrarchi stimulates the immune system of fish, by analysing the changes in gene expression in organs of the turbot immune system (spleen, liver and kidney) during a P. dicentrarchi infection. These researchers found that many genes regulating substances involved in the immune response, including chemokines, chemotaxins, complement, immunoglobulins, major histocompatibility complex, interferon, lectins, cytochrome P450 and lysozyme, were differentially expressed and that the response was strongest in the spleen at 1- and 3- days post-infection. Most transcriptomic studies of the immune response in fish infected with ciliates have been carried out with ectoparasites such as Cryptocaryon irritans and Ichthyophthirius multifiliis [24,25,26,27], usually with an infection time longer than 12 h. In addition, previous transcriptomic studies have analysed the response in either the parasite or in the cells of the fish immune system, but not in both. The scuticociliate P. dicentrarchi can overcome the external barriers of fish and proliferate in the blood and in internal organs, causing a systemic infection. The initial interaction between the ciliate and fish immune system may be crucial to the success of infection. In the present study, we used transcriptomic technologies to analyse the interactions between P. dicentrarchi and the turbot immune system during the very early stages of infection. Parasites were injected intraperitoneally and the transcriptomic response was evaluated in both fish cells and parasites found in the peritoneal cavity at several different times. This infection model enabled us to obtain sufficient numbers of host cells and parasites for the analysis.
2. Material and Methods
2.1. Fish and Ethical Statement
Healthy turbot, Scophthalmus maximus (L.), weighing about 50 g, were obtained from a local fish farm and maintained in 250 L tanks with recirculating and aerated seawater at 18 °C and fed daily with commercial pellets. All experimental protocols carried out in the present study followed the European legislation (Directive 2010/63/EU) and the Spanish legislative requirements related to the use of animals for experimentation (RD 53/2013) and were approved by the Institutional Animal Care and Use Committee of the University of Santiago de Compostela (Spain) (Ethic code: AGL2017-83577) on 01-02-2019. Before any experimental manipulation, fish were anaesthetized by immersion in a 100 mg/L solution of MS-222 (tricaine methane sulfonate; Sigma-Aldrich, Madrid, Spain) in seawater. At the end of the experiments, the fish were fully anaesthetized before being killed by pithing.
2.2. Parasites
Specimens of Philasterides dicentrarchi (isolate I1), obtained from experimentally infected turbot, were cultured as previously indicated [11]. Briefly, parasites were cultured at 18 °C in flasks containing L-15 Leibovitz medium with 10% heat-inactivated foetal bovine serum, lipids (lecithin and Tween 80), nucleosides and glucose. To prepare the parasites, the ciliates were collected from the flasks, centrifuged at 700× g for 5 min, washed twice in phosphate-buffered saline (PBS) and resuspended in the same buffer.
2.3. Experimental Infection with P. dicentrarchi
Immediately prior to the present study, and using the same groups of fish, we found that with an inoculum dose of 107 parasites per fish, a high percentage of the ciliates remained alive in the peritoneal cavity. However, with an inoculum dose of 105 parasites per fish, all the ciliates died in the peritoneal cavity. Both concentrations of parasites were used in the present study. The higher concentration (107 ciliates per fish) was used to investigate the gene expression in the parasites and in turbot peritoneal cells at 0, 1, 2, and 4 post-infection (hpi). The lower concentration was used to analyse the gene expression in turbot peritoneal cells at 12 and 48 hpi, comparing the response between fish injected with ciliates and fish injected with PBS. This ciliate concentration was selected because most fish cells would be engulfed and killed at 12 and 48 hpi if the higher concentrations were used.
Two parallel experiments were carried out to evaluate the changes in gene expression in P. dicentrarchi and turbot peritoneal cells during experimental infection. In one experiment, 36 fish were each injected intraperitoneally with 1 × 10⁷ ciliates (3 replicates of three fish each per time point were used; 0, 1, 2 and 4 hpi) (Table S1). Ciliates and peritoneal cells were obtained by washing the peritoneal cavity with 5 mL of PBS. The ciliates and peritoneal cells were then counted in a Neubauer counting chamber and concentrated by centrifugation (400× g, 10 min). The pellet thus obtained was then diluted in 1 mL of RNAlater solution and incubated overnight at 4 oC. The samples were diluted in cold PBS (50%) and concentrated by centrifugation at 12,000× g for 10 min. The pellets were then frozen in liquid nitrogen and sent on dry ice to Future Genomics Technologies (Leiden, The Netherlands) for analysis.
In the second experiment, 42 fish were injected with 1 × 10⁵ ciliates and 42 fish were injected with the corresponding volume of PBS (as controls) (Table S1). Three replicates of 7 fish each were analysed at each time point (12 and 48 hpi). The peritoneal cells were obtained and processed as described above.
In addition, a parallel experiment with the same groups of fish (3 fish per sampling time) and the same concentration of ciliates described above was used to validate the RNAseq.
2.4. RNA Extraction and RNAseq Analysis
Total RNA was extracted from samples preserved in RNAlater, by using the TissueRuptor homogenizer (Qiagen Iberia, Madrid, Spain) and the miRNeasy mini kit (Qiagen Iberia, Madrid, Spain) according to the manufacturer’s instructions. RNA was eluted in RNAse-free water and quantified on a total RNA 6000 Nano series II chip (Agilent, Santa Clara, CA, USA) in an Agilent Bioanalyzer 2100 device. Illumina RNAseq libraries (150–750 bp inserts) were prepared, from 2 mg total RNA, using the TruSeq stranded mRNA library prep kit according to the manufacturer’s instructions (Illumina Inc., San Diego, CA, USA). The quality of the RNAseq libraries was checked using a DNA 1000 chip (Agilent, Santa Clara, CA, USA) and a Bioanalyzer (Agilent 2100, Santa Clara, CA, USA). RNAseq libraries were sequenced on an Illumina HiSeq2500 sequencer, as 2 × 150 nucleotides paired-end reads, according to the manufacturer’s protocol. Image analysis and base calling were performed using the standard Illumina pipeline. The read sequences were deposited in the Sequence Read Archive (SRA) (http://www.ncbi.nlm.nih.gov/sra); BioProject accession number: PRJNA648859.
2.5. Raw Data Cleaning, De Novo Assembly, and Gene Annotation
CLC Genomics Workbench v. 10.0.1 (CLC Bio, Aarhus, Denmark) was used for filtration and assembly and to perform the RNAseq and statistical analyses. Prior to assembly, the raw data from each sample were trimmed to remove adapter sequences and low-quality reads (quality score limit 0.05). One de novo assembly was conducted for each challenge experiment (1 × 10⁷ ciliates/fish or 1 × 10⁵ ciliates / fish). Although the turbot genome is available [28], a de novo assembly strategy was applied to analyse the P. dicentrarchi transcriptome. Therefore, for each experiment, all the high-quality reads were assembled in a unique file using default parameters (mismatch cost = 2, insert cost = 3, minimum contig length = 200 bp, and similarity = 0.8). The contigs yielded by these assemblies were annotated with the Blast2GO program (https://www.blast2go.com/) against the UniProtKB/SwissProt database (http://UniProt.org), applying a cut-off E-value of 1 × 10⁻³.
2.6. RNAseq and Differential Gene Expression Analysis
The transcriptome database generated for each experiment was used as a reference for the RNAseq analysis. Expression levels were calculated as transcripts per million (TPM) values. Finally, a differential expression analysis test (a Robinson and Smyth’s Exact Test, which assumes a Negative Binomial distribution of the data and considers the overdispersion caused by biological variability) was used to identify the DE genes. In the first experiment, the parasites at time 0 h were considered control samples, and the following comparisons were conducted: 1 hpi vs. 0 hpi, 2 hpi vs. 0 hpi and 4 hpi vs. 0 hpi. In the second experiment, the samples obtained from the infected fish were compared with the samples from the turbot injected with PBS (controls) at the corresponding sampling points. Contigs showing a >2 fold change in the absolute value relative to the control group and a Bonferroni corrected p-value < 0.05 were considered DE genes.
The first experiment included a mixture of contigs belonging to the parasite and contigs belonging to turbot. Two strategies were used to differentiate the contigs: (1) the DE contigs were mapped against the turbot genome [28] and those contigs with a high identity value (above 85%) were considered of piscine origin; (2) the remaining contigs were analysed by multiple BLASTx alignment (https://blast.ncbi.nlm.nih.gov/Blast.cgi) and were identified as P. dicentrarchi or turbot contigs on the basis of the number of hits for the preferred annotation (invertebrates vs. vertebrates).
2.7. Gene Ontology (GO) Assignment and Enrichment Analysis
The GO term assignments of the contig lists were obtained from the Uniprot/Swissprot BLASTx results, with Blast2GO software [29]. GO categorization of the P. dicentrarchi DE contigs was conducted on the basis of the biological process terms at level 2. For enrichment analysis of the turbot DE contigs (for biological processes), a Fisher’s exact test was run with default values and an FDR cut-off of 0.05 was applied.
2.8. RNAseq Validation by qPCR
Transcript abundance in the samples was estimated by reverse transcription-quantitative PCR (qPCR). RNA was extracted from fish tissue with TRI Reagent® (Sigma-Aldrich, Madrid, Spain), according to the manufacturer’s instructions. The resulting RNA was dried, dissolved in RNase-free water and quantified in a NanoDrop ND-1000 (Thermo Fisher Scientific Inc., Wilmington, DE, USA) spectrophotometer. To prevent genomic DNA contamination, the total RNA was treated with DNAase I (Thermo Scientific, Surrey, UK). cDNA was synthesized using the cDNA synthesis kit (NZYTech, Lisboa, Portugal), with 1 μg of sample RNA. cDNA was amplified with a qPCR reaction mixture (NZYTech, Lisboa, Portugal) and 0.3 μM of each specific primer (Table S2). For each gene, primer efficiency was determined as indicated by [30]; the expression of each gene was determined in each fish, in triplicate. A total of 5 genes in P. dicentrarchi (cathepsin B, leishmanolysin 1589, leishmanolysin 17670, ABC transporter G family member 10 and ABC transporter G family member 11) and 5 genes in turbot (tumor necrosis factor alpha, cd11b, stat6, c-x-c motif chemokine ligand 8 and interleukin 1 beta) were used to validate the RNAseq. In P. dicentrarchi and turbot, respectively, two genes (β-actin and elongation factor 1-alpha (ef1α)) and three genes (β-actin, glyceraldehyde-3-phosphate dehydrogenase and ef1α) were tested as candidate housekeeping genes. Ef1-α was identified as the most stable in both cases and was therefore selected as the reference gene for qPCR analysis. The qPCR analysis was carried out as previously described [31]. Relative gene expression was quantified by the 2−ΔΔCt method [32] applied with software conforming to minimum information for publication of qRT-PCR experiments (MIQE) guidelines [33]. The results are presented as the normalized expression in experimental groups, divided by the normalized expression in the control group. The concordance between RNAseq and qPCR data was evaluated using Spearman’s correlation coefficient and the null hypothesis of no differences between both methods was checked by a Wilcoxon–Mann–Whitney U test. The critical value was adjusted to p ≤ 0.05, as described by [30].
2.9. Statistics
The values shown in the figures are means ± standard deviation (SD). Significant differences (p ≤ 0.05) were determined by analysis of variance (ANOVA) followed by Tukey–Kramer multiple comparisons test.
3. Results
3.1. RNAseq Analysis and Validation
In the first experiment, in which the fish were injected with 107 ciliates, about 2–2.5 × 10⁶ ciliates were recovered from each fish at all sampling times. The number of free peritoneal cells was between 2 and 3 × 10⁵ cells per fish at 0, 1 and 2 hpi and was slightly higher at 4 hpi (5 × 10⁵ cells) (Figure S1). At the time points considered (1, 2 and 4 hpi), the ciliates contained numerous engulfed peritoneal cells, particularly at 4 hpi (Figure S2). In the second experiment, no live ciliates were found in the peritoneal cavity of turbot at the sampling times (12 and 48 hpi).
Two of the replicates, corresponding to “ciliates 4 h, replicate 1” and “ciliates 4 h, replicate 2” did not produce sufficient Illumina RNAseq library for a proper run. These samples were therefore excluded from further analysis. A total of 357.3 million reads were obtained from the 22 libraries, and the number of reads obtained per sample was between 11.8 and 22.1 million, with a mean value of 16.2 million reads per library. Samples obtained at 0, 1, 2 and 4 hpi were assembled and analysed separately from samples obtained at 12 and 48 hpi. In the former, 99,821 contigs with an N50 of ~1 kb and an average length of 691 bp were obtained, and of these, 34,034 (34.1%) contigs were successfully annotated. The numbers of differentially expressed (DE) contigs (Bonferroni ≤ 0.05; FC ≥ 2), relative to the 0 h samples, were 3101, 4376 and 3499 at 1, 2 and 4 hpi respectively. About 65% of the DE contigs were annotated, and 407, 769 and 507 of these contigs were DE in P. dicentrarchi at 1, 2, 4 hpi (File S1) and the others (1627, 2067 and 1822) were DE in turbot peritoneal cells (File S2), respectively. In the samples obtained at 12 and 48 hpi, in which fish injected with ciliates were compared with fish injected with PBS, 167,321 contigs with an N50 of ~1.1 kb and an average length of 740 bp were obtained; of these, 31,238 (18.87%) contigs were successfully annotated. The numbers of DE contigs (Bonferroni ≤ 0.05; FC ≥ 2) in peritoneal cells of fish injected with P. dicentrarchi, relative to fish injected with PBS, were 464 (370 up-regulated) at 12 hpi and 57 (15 up-regulated) at 48 hpi (File S3). In this experiment, about 61% of the DE contigs were annotated against the UniProtKB/SwissProt database.
The expression of five genes in P. dicentrarchi and five genes in turbot peritoneal cells was evaluated by qPCR (Figure S3), to validate the findings of the RNAseq experiment. The RNAseq and qPCR values were strongly correlated for P. dicentrarchi (Spearman’s correlation ρ = 0.885) and turbot peritoneal cells (Spearman’s correlation ρ = 0.846).
3.2. Changes in Gene Expression in P. dicentrarchi during an Experimental Infection
In order to identify which parasite genes may be important during the early stages of infection and which may play a role in virulence or in resistance against the fish immune response, the changes in gene expression in the scuticociliate were analysed during infection. Differential expression of 407 (369 up-regulated (UR)), 769 (415 UR) and 507 (119 UR) genes was observed at 1, 2 and 4 hpi, respectively.
GO analysis was carried out to explore the biological processes that were best represented during infection (Figure 1). Five categories were well represented at 1 and 2 hpi, including biosynthetic processes, catabolic processes, biogenesis, proteolysis and transmembrane transport, with a similar distribution at both times. At 4 hpi, there was a substantial increase in the percentage of genes involved in catabolic processes and proteolysis (Figure 1).
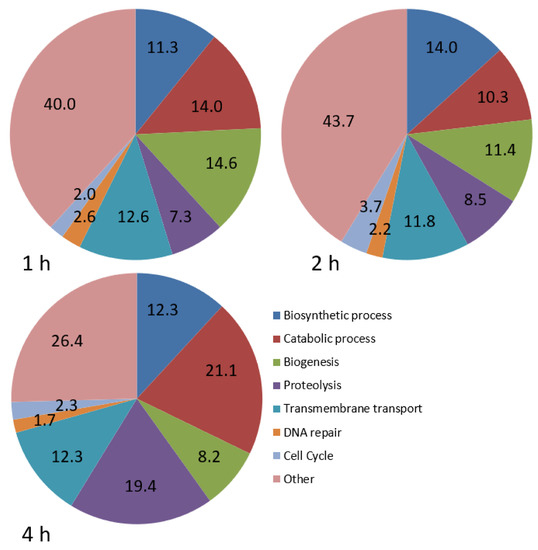
Figure 1.
Pie charts showing the proportion (%) of differentially expressed genes involved in various biological processes in P. dicentrarchi at 1, 2 and 4 hpi, relative to the number at 0 h.
The most strongly regulated genes in P. dicentrachi during infection were those related to the ATP-Binding Cassette (ABC) transporter gene family, which included 12 DE genes (Table 1). Of these, ABC transporter G family member 10 (abcg10) was strongly UR at 1, 2 and 4 hpi. Other genes that were UR at the three sampling times were abca4 and abcb4. Six genes were DE only at 1 and 2 hpi, including three members of the G family, with abcg14 and abcg11 being strongly UR. Overall, the highest expression of ABC transporter family genes was found at 1 hpi. Finally, abca3 and abcb1 were down-regulated (DR) at 4 or at 2 and 4 hpi, respectively (Table 1).

Table 1.
Heat map showing a group of differentially expressed (DE) genes in P. dicentrarchi, including ABC transporters, leishmanolysins and genes related to microtubules and to lysosomes, at 1, 2 and 4 hpi. Results are expressed as mean expression ratios of groups 1, 2 and 4 hpi vs. 0 h. Red indicates increased gene expression levels; green indicates decreased levels.
Several leishmanolysin-like genes were also DE. Four genes of that family were UR and two genes were DR (Table 1). As P. dicentrarchi proteases are considered virulence factors, we were interested in determining how the genes of lysosomal enzymes would behave during the early stages of infection. The expression of several cathepsins, especially ctsb, ctsl and ctsd, was DR at 2 and 4 hpi (Table 1). In addition, several other genes that coded for lysosomal proteins, such as lysosomal acid phosphatase and lysosomal alpha-mannosidase were also DR at 2 and 4 hpi (Table 1).
Tubulins and tubulin associated proteins, such as kinesins and dyneins, play key roles in, e.g., ciliate division and movement. Apart from kinesin family member 1, expression of alpha and beta tubulins and many kinesins and dyneins (including the outer dynein arm 1 gene, which is required for ciliary motion) was DR at 2 and 4 hpi (Table 1).
Ribosome synthesis plays a central role in regulating cell growth [34]. Many genes involved in ribosome biogenesis, DNA transcription and RNA translation were UR (Table 2). The strongest regulation occurred in the gene regulator of rDNA transcription 15. For most genes, UR occurred at 1, 2, and 4 hpi, peaking at 2 hpi (Table 2).
Table 2.
Heat map showing a group of DE genes in P. dicentrarchi, including genes related to ribosome biogenesis, DNA transcription, cell cycle, metabolism, mitochondrial respiratory chain and detoxification, at 1, 2 and 4 hpi. Results are expressed as mean expression ratios of groups 1, 2, and 4 hpi vs. 0 h. Red indicates increased gene expression levels; green indicates decreased levels.
Analysis of the genes involved in the cell cycle showed that the cyclin-dependent kinase 1 (cdk1) gene, which is involved in mitotic control, was DR. Similarly, cyclin-B2-3 and cyclin-dependent kinase regulatory subunit 2, which participate in the cell cycle, were also DR. By contrast, cyclin-dependent kinase 2 (cdk2), which participates in G1-S transition and the DNA damage response, was strongly UR at 1, 2 and 4 hpi (Table 2).
Genes involved in glycolysis, such as triose-phosphate isomerase, or in the Krebs cycle, such as isocitrate dehydrogenase, citrate synthase and acetyl-coenzyme A synthetase, and components of the electron transport chain, such as mitochondrial cytochrome c, were DR at 2 and 4 hpi. Other genes involved in the mitochondrial electron transport chain, such as cytochrome c oxidase subunit 1 and 2, were also DR at 2 and 1 hpi, respectively (Table 2). Finally, genes coding for enzymes of the microsomal compartment possibly involved in detoxification processes were also DR, including several cytochrome p450 (cyp3a19, cyp4b1, cyp4e3) and glutathione S-transferase 2 and 3 genes (Table 2).
3.3. P. dicentrarchi Generates an Intense Inflammatory Response in Turbot during the Aarly Stages of Infection
We observed intense regulation of many genes of peritoneal cells at 1, 2 and 4 hpi. The response was much lower at 12 hpi and almost disappeared completely at 48 hpi in those fish that were able to kill P. dicentrarchi during the first few hours after injection. To analyse their function, DE genes were subjected to gene ontology and enrichment analysis for biological processes, molecular function and cellular components. The proportion of genes involved in different biological processes was very similar across groups at 1, 2 and 4 hpi (Figure 2). DEGs at 1, 2 and 4 hpi were associated with the apoptotic process (between 7.9 and 8.4%), inflammatory response (between 4.3 and 4.8%), immune response (3.4 to 5.8%), Fc-epsilon receptor signalling pathway (4.3 to 4.6%), innate immune response (3.5 to 3.6%), cell adhesion (3.3 to 3.8%), phagocytosis (2.8 to 3.1%) and the cell surface receptor signalling pathway (2.5–2.7%) (Figure 2). Many genes of signalling pathways or cascades were also DE, such as those involved in the MAPK cascade (3.6 to 3.8%), the NIK/NF-kappaB signalling pathway (1.7 to 1.9%) and the I-kappaB kinase/NF-kappaB signalling pathway (1 to 1.4%). However, the proportion of genes involved in the defence response to bacterium (2.3 to 2.9%) was higher than the number of genes involved in the defence response to protozoan (0.5 to 0.6%) (Figure 2).
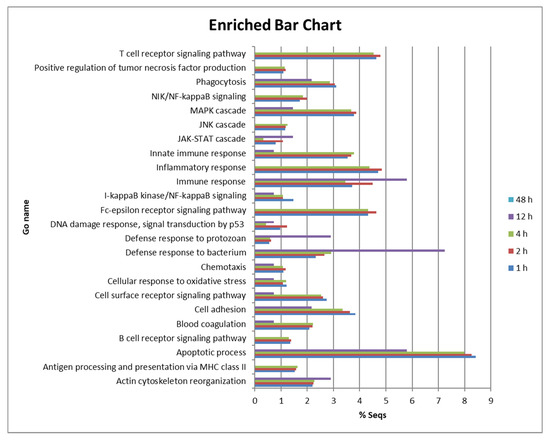
Figure 2.
Bar chart showing the proportion (%) of DE genes involved in various biological processes in turbot peritoneal cells at 1, 2 and 4 hpi.
Injection of ciliates into the peritoneal cavity generated a very potent inflammatory response in turbot, with the peritoneal cells expressing genes related to this response, even though many of them were already phagocytosed by the ciliate. One of the first events that occur during the host response to pathogens is recognition by host pattern recognition receptors. In peritoneal cells, toll-like receptor (tlr) 2 was UR at 1 and 2 hpi, tlr13 was UR at 1, 2, 4 and 12 hpi, and tlr5 was UR at 2, 4 and 12 hpi. Of these three genes, tlr5 was the most strongly regulated (Table 3). Adaptor myd88, which is involved in almost all TLRs signalling pathways, was UR. Other genes that were DE included interleukin-1 receptor-associated kinase 4 (irak4), several other components of the NF-κB pathway, including nuclear factor nf-kappa-b p100 subunit (nfkb2) or nf-kappa-b inhibitor alpha (nfkbia) or map kinase kinase kinase 14 (map3k14). In addition, several components of the MAPK and JAK/STAT pathways were also DE (Table 3). Except for mapk6, which was also UR at 12 hpi, the other components of the MAPK pathway were differentially expressed at 1, 2 and 4 hpi, and most of them peaked at 4 hpi. In the genes related to the JAK/STAT pathway, stat1, stat3, stat4 and stat6 or jak1 and jak3 were UR at 1, 2 and 4 hpi, peaking at 4 hpi. However, negative regulators of the pathway, socs1 and socs3, were also UR at 1, 2, 4 and 12 hpi (Table 3).
Table 3.
Heat map showing a group of DE genes in turbot peritoneal cells at 1, 2, 4 and 12 hpi, including genes coding for toll-like receptors and genes involved in different signalling pathways. Results are expressed as mean expression ratios of groups 1, 2 and 4 hpi vs. 0 h, or 12 hpi vs. phosphate-buffered saline (PBS). There were no DE genes at 48 hpi. Red indicates increased gene expression levels; green indicates decreased levels.
During infection by P. dicentrarchi, several chemokines were DE, including c-x-c motif chemokine ligand 8 (cxcl8) and c-c motif chemokines (ccl) 11, 3, 4, 2 and 20. Cxcl8 was strongly expressed at 1, 2 and 4 hpi, but was DR at 48 hpi, and ccl20 was only UR at 2 hpi. In addition, several chemokine receptors were also UR, including c-x-c chemokine receptor type 4, 1, 3, 3-2, and 2 and chemokine-like receptor 1 (cmklr1). Cxcr4 was most strongly expressed at 1, 2 and 4 hpi, and cxcr1 and cmklr1 were UR at 1, 2, 4 and 12 hpi (Table 4).
Table 4.
Heat map showing a group of DE genes in turbot peritoneal cells at 1, 2, 4, 12 and 48 hpi, including several genes coding for chemokines, chemokine receptors and enzymes involved in prostaglandin synthesis. Results are expressed as mean expression ratios of groups 1, 2 and 4 hpi vs. 0 h, or 12 and 48 hpi vs. PBS. Red indicates increased gene expression levels; green indicates decreased levels.
The genes prostaglandin g h synthase 2 and prostaglandin e synthase 3, which code for enzymes involved in the synthesis of prostaglandin E2, were up-regulated, the former at 1, 2 and 4 hpi, and the latter at 1 hpi (Table 4). Genes coding for enzymes involved in the synthesis of leukotrienes, i.e., 12s-lipoxygenase and leukotriene a-4 hydrolase, were UR at 1, 2 and 4 hpi. Positive differential expression of prostaglandin and leukotriene receptors, i.e., leukotriene b4 receptor 1 and prostaglandin i2 receptor, was also observed. Finally, arachidonate 5-lipoxygenase was only UR at 12 and 48 hpi and arachidonate 15-lipoxygenase only at 48 hpi (Table 4).
Several interleukins (IL) and IL receptors were also DE during P. dicentrarchi infection (Table 5). For most of these, the response peaked at 4 hpi. The pro-inflammatory il1β was strongly UR at 1, 2 and 4 hpi and, similarly to cxcl8, was DR at 48 hpi. Other interleukins that were DE at 1, 2 and 4 hpi included il16, il27β and myeloid-derived growth factor (also il27). However, il10 was only UR at 12 hpi and il12β was UR at 12 and 48 hpi. Numerous IL receptors were also UR, including il6ra, il6rb, il22r2, il1r1, il1r2, il10r1, il3b2, il7ra, il2rb, il2rg and il31r. Of these, il6ra, il22r2 and il1r2 were most strongly regulated. In addition, il1r1, il1r2, il10r1 and il3b2 were DE at 12 hpi (Table 5).
Table 5.
Heat map showing a group of DE genes in turbot peritoneal cells at 1, 2, 4, 12 and 48 hpi, including genes coding for interleukins, interleukin receptors, genes of the tumour necrosis factor (TNF) family and genes involved in different signalling pathways. Results are expressed as mean expression ratios of groups 1, 2 and 4 hpi vs. 0 h, or 12 and 48 hpi vs. PBS. Red indicates increased gene expression levels; green indicates decreased levels.
Among all the cytokines, up-regulation was strongest in the pro-inflammatory cytokine tumour necrosis factor-alpha (tnfa) at 2 and 4 hpi, peaking at 4 hpi. Many other genes related to TNF, including TNF receptors, were also differentially expressed, including tnf alpha-induced protein 8 like 2, tnf ligand superfamily member 6, tnf superfamily member 13b, tnf receptor superfamily member 26, tnf alpha-induced 2, tnf receptor superfamily member 1b, tnf receptor-associated factor 2, tnf receptor superfamily member 5 and tnf receptor superfamily member 11b. In almost all cases, expression of TNF and TNF-related genes peaked at 4 hpi (Table 5).
Another group of genes that were DE, but at a much lower level than the previously mentioned genes, was the group of interferon (IFN) related genes, including several interferon regulatory factors and other IFN related genes. Most of these were up-regulated at 1, 2 and 4 hpi, but some of them were also up-regulated 12 h after intraperitoneal injection. Among this group of genes, interferon-double-stranded rna-activated kinase and interferon-induced 44-like were the most strongly regulated (Table 6).
Table 6.
Heat map showing a group of DE genes in turbot peritoneal cells at 1, 2, 4 and 12 hpi, including several interferon regulatory factor genes. Results are expressed as mean expression ratios of groups 1, 2 and 4 hpi vs. 0 h, or 12 hpi vs. PBS. There were no DE genes at 48 hpi. Red indicates increased gene expression levels; green indicates decreased levels.
Several genes associated with cell death were DE at 1, 2 and 4 hpi, but many were also DE at 12 hpi (Table 7). Some members of the bcl-2 gene family, which are regulators of cell apoptosis, were strongly UR at 1, 2 and 4 hpi, including apoptosis facilitator bcl-2 14, bcl2 associated agonist of cell death, apoptosis regulator bax. Other DE genes were involved in processes that occurred during apoptosis, such as DNA fragmentation, including dna fragmentation factor subunit beta, or the extrinsic pathway of apoptosis, including fas cell surface death receptor and fas-associated death domain, which are associated with Fas ligand cell death. We also observed up-regulation of caspases, such as caspase 3 and 8, which were UR at 2 and 4 hpi or at 12 hpi, respectively (Table 7). Finally, several apoptotic regulator genes were also differentially expressed, including programmed cell death 1 ligand 1 and programmed cell death 4, 6 and 10.
Table 7.
Heat map showing a group of DE genes in turbot peritoneal cells at 1, 2, 4 and 12 hpi, including many genes involved in cell death. Results are expressed as mean expression ratios of groups 1, 2 and 4 hpi vs. 0 h, or 12 hpi vs. PBS. There were no DE genes at 48 hpi. Red indicates increased gene expression levels; green indicates decreased levels.
Several genes related to T and B lymphocytes or other immune cells were DE (Table 8). Up-regulation of components of IgM and IgD was observed at 1, 2 and 4 hpi, such as immunoglobulin heavy constant mu and immunoglobulin delta heavy chain, and several genes involved in B cell development and function in mammals, including b-cell antigen receptor complex-associated alpha chain and b-cell receptor cd22. Several genes associated with cytotoxic T lymphocytes and natural killer cells, such as granzyme a, granzyme b and perforin-1, were also UR. (Table 8). In addition, genes that are expressed by activated B and T lymphocytes in mammals, but that are also markers of dendritic cells, e.g., cd83 antigen, were also UR (Table 8). Finally, genes that can be expressed in mast cells, such as high-affinity immunoglobulin epsilon receptor subunit gamma and mast cell protease 1a, were DE at 1, 2 and 4 hpi.
Table 8.
Heat map showing a group of DE genes in turbot peritoneal cells at 1, 2, 4 and 12 hpi, including several genes related to B cells and cytotoxic T cells. Results are expressed as mean expression ratios of groups 1, 2 and 4 hpi vs. 0 h, or 12 hpi vs. PBS. There were no DE genes at 48 hpi. Red indicates increased gene expression levels; green indicates decreased levels.
Several genes related to the complement and the coagulation systems were DE. Some components of the complement system, including complement c1q subcomponent subunit b, complement c1s subcomponent, complement factor d, complement factor h, c3 and c4 were UR at 1, 2 or 4 hpi, depending on the gene. Similarly, some components of the coagulation system were also DE at 1, 2 and 4 hpi, including coagulation factor VIII, coagulation factor XIII a chain and tissue factor pathway inhibitor. However, tissue factor was only UR at 12 hpi (Table 9).
Table 9.
Heat map showing a group of DE genes in turbot peritoneal cells at 1, 2, 4 and 12 hpi, including complement and coagulation related genes. Results are expressed as mean expression ratios of groups 1, 2 and 4 hpi vs. 0 h, or 12 hpi vs. PBS. There were no DE genes at 48 hpi. Red indicates increased gene expression levels; green indicates decreased levels.
4. Discussion
In the present study, we evaluated gene expression in the ciliate parasite P. dicentrarchi at 1, 2 and 4 hpi, relative to the gene expression in samples processed at 0 h, during experimental infection in the turbot S. maximus, to identify the genes participating in this process, including those potentially involved in virulence or in resistance to the host immune system. The most strongly regulated genes in P. dicentrarchi during infection were the ABC transporters, which were mainly UR. Protozoan ABC transporters are involved in nutrient transport but they also protect cells from both internally produced and exogenous toxins, and some have been associated with antiparasitic drug resistance as well virulence and oxidative stress [35,36,37]. These transporters are very abundant in ciliates, and 165 ABC transporter genes were identified in the macronuclear genome of the ciliate Tetrahymena thermophila [38]. In the present study, the P. dicentrarchi ABC transporter G family genes showed a strong, early response during infection, indicating that some ABC transporters are very important in this process. It is not known whether they are involved in ciliate resistance against the attack of fish immune system or whether they have other roles in infection.
Very few free-living ciliate species can invade the fish, resist attack by the immune system and cause systemic infection. However, P. dicentrarchi is capable of infecting cultured fish and causing massive mortalities. Thus, the ciliates must be able to resist the attack from the fish immune system and also to destroy fish tissue, for which proteases may be important. In the present study, we observed an increase in the expression of several genes of the leishmanolysin family, which are membrane-bound metalloproteases capable of degrading and cleaving many biological molecules [39]. Leishmanolysin GP63 is a major surface protein and is considered one of the main virulence factors in the human pathogen Leishmania [40]. GP63 degrades a large number of proteins, including complement [41], and down-regulation of gene expression makes the parasites more susceptible to complement-mediated lysis [42]. The complement system is considered important in defence against P. dicentrarchi [11,20], and although complement levels are lowered in the serum of infected turbot [12], it is not known whether leishmanolysins participate in the process. Our results agree with those obtained in previous studies, which reported high level of leishmanolysin expression in a P. dicentrarchi isolate (I1) obtained from turbot infections [43], and UR of several leishmanolysin genes in Miamiensis avidus fed a cell line [44], suggesting that these molecules play a role in cell degradation. Thus, although the role of each regulated leishmanolysin gene in the success of P. dicentrachi infection remains to be established, it appears that leishmanolysins are probably involved in ciliate virulence.
Ciliate proteases, other than leishmanolysins, are considered virulence factors in P. dicentrarchi [10,12,13,14]. However, several members of the cathepsin family were DR during the early stages of P. dicentrarchi infection. Interestingly, other genes whose proteins are also located in the lysosome were also DR. Because some ciliates contained phagocytosed turbot cells, release of lysosomal enzymes probably occurred during the early stages of infection. However, the expression of several cathepsin genes also did not increase in the scuticociliate Anophryoides haemophila during an infection in American lobster [45]. Although the expression of these genes will probably be enhanced at later stages in order to degrade the endocytosed material, the expression of these enzymes may be delayed during infection due to other priorities of the cells.
Many genes associated with rDNA transcription, ribosome biogenesis or rRNA synthesis were UR in P. dicentrarchi during the early stages of infection, indicating a focus on ribosome production and protein synthesis in the ciliate. However, except for kinesin family member 1, the tubulin alpha and beta genes and genes coding for several dyneins and kinesins were DR in P. dicentrarchi during infection at 2 and/or 4 hpi. Tubulins and the associated motor proteins play many roles in eukaryotic cells, and particularly in ciliates, including cell division or cell movement. Genes involved in cell division, such as cyclin-dependent kinase 1 (cdk1) and cyclin B, were also DR in P. dicentrarchi during infection. Cdk1 is a key protein that regulates mitotic entry and spindle assembly and its activation depends on cyclin B [46]. Our findings suggest that cell division is not activated during the early stages of infection. However, other genes associated with the cell cycle, such as cdk2, were strongly UR. Cdk2 activation leads to DNA replication in the cell, and it is also involved in DNA damage and the DNA repair response [47]. Some ciliates probably suffered DNA damage because of attack from the turbot immune system, thus explaining the increase in cdk2 expression. Several genes involved in glycolysis, the tricarboxylic acid (TCA) cycle and the mitochondrial respiratory chain were DR at 2 and (particularly) 4 hpi. If the P. dicentrarchi mitochondrial genome is similar to that of Tetrahymena pyriformis and Paramecium aurelia [48], the genes of the respiratory chain will be located in the mitochondrial genome, while those of the TCA cycle and glycolysis will be located in the nucleus. Unfortunately, little is known about how the expression of these genes is regulated in ciliates during infection. Many ciliate mitochondria may be altered because of interactions between the ciliate and the fish immune system. Previous studies have shown that turbot phagocytes are strongly stimulated by contact with P. dicentrarchi, releasing a high amount of reactive oxygen species (ROS) [11]. Leucocytes do not seem to produce sufficiently high concentrations of toxic substances to kill the parasite, but some ciliate components may be affected, as an increase in ROS levels is associated with alterations in the P. dicentrachi mitochondria [49]. Due to retrograde regulation, mitochondrial dysfunctions may affect the expression of enzymes involved in the TCA cycle, as observed in cells in other organisms [50], thus explaining the DR of these genes.
The present study shows that intraperitoneal injection of turbot with P. dicentrarchi induced an acute inflammatory response and enhanced the expression of genes involved in inflammatory pathways, inflammatory cytokines or genes coding for enzymes involved in the synthesis of prostaglandins and leukotrienes. Recruitment of inflammatory cells, which is part of the inflammatory response [51], was not evaluated in the present study but has been demonstrated in previous studies [21]. Recognition of the pathogen by pattern recognition receptors is an important event in the inflammatory process. High levels of expression of tlr5 and, to a lesser extent, of tlr13 and tlr2, occurred in turbot peritoneal cells although tlr2 and tlr13 expression began earlier. Tlr2 expression increased in some organs of channel catfish (Ictalurus punctatus) and orange-spotted grouper (Epinephelus coioides) during infection with the ciliate ectoparasites I. multifiliis and C. irritans respectively [24,52,53]. Studies in mammals have shown that glycosylphosphatidylinositol (GPI) is a potent activator of TLR2 in several protozoan parasites and that GPI is recognised by this receptor [54,55]. It has also been suggested that TLR2 mediates activation of the MAPK and NF-κB pathways [56]. An increase in the expression of genes involved in these pathways was also observed in the present study, indicating that turbot TLR2 is activated during P. dicentrarchi infection and that it may be important in the recognition of some ciliate molecules. However, because P. dicentrarchi causes extensive damage in tissues and TLR2 can also be activated by several damage-associated molecular patterns [57], an increase in the expression of this receptor associated with any of these molecules cannot be ruled out. Expression of tlr13 and particularly tlr5 was strongly enhanced in turbot peritoneal cells, peaking at 4 hpi and lasting until at least 12 hpi. TLR13 is located in endolysosomes and recognises bacterial 23s ribosomal RNA in mice, while TLR5 is located at the plasma membrane and recognises bacterial flagellin [58]. Although TRL13 has been associated with the resistance of some insects to parasites [59], it is not known whether it plays a role in fish parasite infections. Fish tlr5 was also strongly up-regulated in some tissues of E. coioides and in the Tibetan highland fish (Gymnocypris przewalskii) in response to infection with the ciliates C. irritans [24,60] and I. multifiliis [61] respectively, although, as far as we know, no particular role for this receptor in parasite recognition has been reported. The UR of tlr5 found in the present study may be a consequence of prior stimulation of other cell receptors. In this respect, we cannot rule out unspecific stimulation of TLRs generated by a substance released by the parasite or even by a mechanical effect generated by the contact between the parasite membrane (which is moving all the time due to the movement of the cilia) and the leukocyte membranes.
Regarding the stimulation of inflammatory pathways, many components of NF-κB, MAPK and JAK/STAT pathways were UR. Some of those genes, such as myd88, which was UR at 1, 2 and 4 hpi, have a positive effect on the pathways; however, others, such as nfkbia, socs1 and socs3, which were UR at 1, 2, 4 and 12 hpi, exert a negative effect in order to limit the inflammatory response [62]. NF-κB, MAPK and JAK/STAT are involved in inflammatory processes, inducing expression of genes that regulate the inflammatory response, although they can also participate in other processes [63,64,65]. Several chemokines and their receptors were UR in turbot peritoneal cells during P. dicentrarchi infection. Among these, the strongest regulation was found in cxcl8 and their receptors cxcr1 and cxcr2, which can be expressed by several types of leukocytes, especially neutrophils; cxcl8 expression has been associated with neutrophil recruitment [66]. This chemokine also induces chemotaxis of neutrophils and, to a lesser extent, lymphocytes and macrophages in turbot [24,67]. These results support those demonstrating intense migration of neutrophils to the turbot peritoneal cavity during P. dicentrarchi infection [21]. Several interleukins and their receptors, as well as several members of the TNF family and their receptors, were also strongly UR in turbot peritoneal cells, particularly the proinflammatory cytokines IL1b and TNFa. These and other inflammatory cytokines are produced by leukocytes, due to TLR stimulation, and promote inflammation [58]. In addition, molecules such as TNFa can modulate multiple signalling pathways, some of which are related to the immune response during inflammation and also other responses, such as cell death [68]. The role of both IL1b and TNFa in regulating the inflammatory response is well conserved in fish [69]. Several other interleukins, interleukin receptors and members of the TNF superfamily that participate in the regulation of the inflammatory response are also strongly expressed in turbot peritoneal cells, including il27b, il6ra, il6rb, il22r2, il3b2, il3b2, tnfaip8l2b, tnfaip2 and others, some of which, such as tnfaip8l2b, are negative regulators of the immune response [70], indicating the complexity of the response generated. Some of the interleukin genes such as il10 and il10r were UR at 12 hpi and at 1, 2, 4 and 12 hpi, respectively. IL10 displays potent anti-inflammatory and regulatory activity in most immune processes during infection [71], suggesting an anti-inflammatory state in fish capable of controlling the infection. Increased expression of il12b was observed at 12 and 48 hpi, although to a lower extent than for il10. However, there was no increase in the expression of the complementary subunit or the receptors. In mammals, IL12B is secreted by phagocytic cells and acts on T and NK cells, inducing IFN-γ production and generating a proinflammatory state [72]. An increase in IFN-γ has been observed in leukocytes of other flatfish species stimulated with recombinant Il12 [73]. However, ifn-γ expression did not increase in turbot peritoneal leukocytes in the present study, suggesting that in this case, an increase in il12b expression will not generate a proinflammatory state.
Several genes of the interferon family were UR, although to a much lesser extent than those related to other cytokines. Interferon-induced double-stranded RNA-activated kinase was one of the genes in which DE was highest, being up-regulated at 1, 2, 4 and 12 hpi. This gene is a key component of host innate immunity that restricts viral replication and propagation but also participates in the stress response, being crucial for cell survival and proliferation, functions that are beyond the viral response [74]. Most of the other DE genes were interferon regulatory factors (IRFs). Some of these factors are involved in TLR signalling pathways, inducing the expression of type 1 ifn or proinflammatory cytokine genes [75]. IRFs have been shown to play several roles in parasite infection, particularly irf8, which appeared UR at 1, 2, 4 and 12 hpi in turbot peritoneal cells during P. dicentrarchi infection and which regulates the production of proinflammatory cytokines during malarial infections [76]. However, IRFs are also involved in differentiation and apoptosis of immune cells in mammals [75] and in fish [77]. All of these events seem to occur in the turbot peritoneal cavity, and different IRFs may participate in any of them.
Many genes associated with apoptosis were highly UR in turbot peritoneal cells during initial infection with P. dicentrachi. Regulation of most genes occurred at 1, 2, 4 hpi, peaking at 4 hpi, as well as at 12 hpi in some. Previous studies have shown that P. dicentrarchi proteases induce apoptosis in turbot cells [14]. However, increased expression of genes related to apoptosis or in the number of apoptotic cells in turbot peritoneal cells after injection with other stimuli have also been observed [31,78]. Other studies have also shown that large numbers of neutrophils migrate to the peritoneal cavity after injection of P. dicentrarchi [21] and many of these cells seem to initiate the expression of genes leading to apoptosis. In later stages, these cells can be phagocytosed by macrophages, contributing to the resolution of inflammation [79]. On the basis of these findings, it appears that most of the gene expression associated with apoptosis in turbot peritoneal cells occurs in neutrophils. However, it has been shown that other stimuli also cause apoptosis in fish peritoneal macrophages [80], indicating that other cell types may also be involved in this process.
Increased expression of several T and B lymphocyte related genes was also observed in the turbot peritoneal cells. Thus, e.g., igm and igd heavy chains, cd79a and cd22, which are expressed in B lymphocytes, were UR. This regulation may be related to the recruitment of B cells to the peritoneal cavity, as shown in other fish species after injection with different stimuli [81]. Several genes related to cytotoxicity were also DE. Granzyme A was UR at 1, 2 and 4 hpi and granzyme b and perforin-1 were UR only at 1 hpi. These genes are produced by cytotoxic lymphocytes in mammals and fish [82,83]. Information about how these molecules interact with parasites in fish is scarce. However, in mammals, it has been observed that in addition to killing parasite-infected cells, these cytotoxic granule effectors can kill parasites [84]. It is not known whether these molecules can kill P. dicentrarchi. However, a turbot NK-lysin, an effector molecule of cytotoxic T lymphocytes and NK-cells, has been shown to be toxic for P. dicentrarchi, although infection did not clearly affect mRNA expression [19]. On the basis of these observations, these molecules from cytotoxic cells appear highly likely to play a role in P. dicentrarchi infection.
Finally, several genes related to the coagulation and the complement systems were also DE in turbot during P. dicentrarchi infection. Several complement genes have been found to be expressed in immune organs of turbot during a P. dicentrarchi infection [23], as well as locally in E. coioides infected with the ciliate C. irritans [24] and also in the skin or liver of common carp (Cyprinus carpio) infected with I. multifiliis [85]. The findings of the present study are consistent with the aforementioned findings in suggesting that peritoneal cells express complement and that the expression is regulated during infection. Similar observations have been made for genes involved in coagulation. Both the complement and the coagulation systems play important roles in defending turbot against P. dicentrarchi [20,21], and the complement or coagulation proteins released by leukocytes at the site of infection may represent an important additional source of these molecules.
How does the immune response generated by P. dicentrarchi in turbot compare with that induced by other parasites in fish? The immune response induced in fish by different parasites varies widely. Thus, some parasites do not elicit a host response, while others induce a more or less intense inflammatory response [86,87]. Previous transcriptomic studies carried out in fish infected with ciliate parasites have shown that these parasites usually generate an inflammatory response. However, the sampling times were longer than used in the present study, and the responses are therefore not necessarily comparable. Transcriptomic analysis, involving a microarray enriched in immune genes, of spleen, kidney and liver of turbot infected with P. dicentrarchi, revealed strong up-regulation of many immune response genes [22,23] at 1 dpi, but a less intense response than observed in turbot peritoneal cavity in the present study. Sampling times after experimental infection with ciliates were 12 h [88], 24 h [25] or 3 dpi [24] in fish infected experimentally with C. irritans. In the ectoparasite I. multifiliis, sampling was conducted 2 dpi [61] or 8 dpi [27]. However, regardless of the differences between the sampling times in the present and previous studies, ectoparasite ciliates such as C. irritants also induced a potent inflammatory response on the skin of infected fish, with up-regulation of genes involved in innate immunity, genes coding for TLRs, TLR signalling pathways, chemokines and chemokine receptors and genes associated with complement activation [24]. Similarly, I. multifiliis generated a massive immune response in the gills of rainbow trout (Oncorhynchus mykiss) [27].
5. Conclusions
In conclusion, many genes of the ABC transporter and leishmanolysin gene families were strongly regulated in the ciliate parasite P. dicentrarchi during the early stages of infection in turbot, suggesting that they play an important role in this process. During infection, the ciliate generated a very high inflammatory response at the site of injection, with the regulation of most of the genes known to be involved in the inflammatory response in mammals, indicating that turbot use all the protective mechanisms they have available to prevent entry of the parasite. The findings also provide some valuable insight into how the acute inflammatory response occurs in fish.
Supplementary Materials
The following are available online at https://www.mdpi.com/2079-7737/9/10/337/s1, Figure S1: Number of turbot cells and ciliates in the peritoneal cavity, Figure S2: Micrographs of ciliates at different stages of infection, Figure S3: qPCR validation of RNA-seq findings, File S1: Excel file showing the contigs that were DE in P. dicentrarchi at 1, 2, 4 hpi, the fold change, p-value, and the gene names, File S2: Excel file showing the contigs that were DE in turbot peritoneal cells at 1, 2, 4 hpi, the fold change, p-value, and the gene names, File S3: Excel file showing the contigs that were DE in turbot peritoneal cells at 12 and 48 hpi, the fold change, p-value, and the gene names, Table S1: Sample information, Table S2: Primer sequences used in the qPCR analysis.
Author Contributions
Conceptualization, J.M.L. and J.L.; Data curation, P.P. and A.F.; Formal analysis, P.P., A.F., B.N. and R.P.H.D.; Investigation, A.V.; Methodology, R.P.H.D. Resources, J.M.L. and J.L.; Software, P.P., A.F. and B.N.; Supervision, J.L.; Writing—original draft, J.L.; Writing—review & editing, J.M.L., P.P., A.F., A.V. and R.P.H.D. All authors have read and agreed to the published version of the manuscript.
Funding
This study was financially supported by grant AGL2017-83577-R awarded by the Ministerio de Economía y Competitividad (Spain) and Fondo Europeo de Desarrollo Regional -FEDER- (European Union), by grant ED431C2017/31 from the Xunta de Galicia (Spain), and by PARAFISHCONTROL project, via funding from the European Union’s Horizon 2020 research and innovation programme under grant agreement no. 634429. This publication only reflects the views of the authors, and the European Commission cannot be held responsible for any use which may be made of the information contained herein.
Acknowledgments
We thank I. Folgueira and A.P. De Felipe for helping in ciliate culture.
Conflicts of Interest
The authors declare no conflict of interest.
References
- Iglesias, R.; Paramá, A.; Alvarez, M.F.; Leiro, J.; Fernández, J.; Sanmartín, M.L. Philasterides dicentrarchi (Ciliophora, Scuticociliatida) as the causative agent of scuticociliatosis in farmed turbot Scophthalmus maximus in Galicia (NW Spain). Dis. Aquat. Organ. 2001, 46, 47–55. [Google Scholar] [CrossRef] [PubMed]
- Kim, S.M.; Cho, J.B.; Kim, S.K.; Nam, Y.K.; Kim, K.H. Occurrence of scuticociliatosis in olive flounder Paralichthys olivaceus by Philasterides dicentrarchi (Ciliophora: Scuticociliatida). Dis. Aquat. Organ. 2004, 62, 233–238. [Google Scholar] [CrossRef] [PubMed]
- Rossteuscher, S.; Wenker, C.; Jermann, T.; Wahli, T.; Oldenberg, E.; Schmidt-Posthaus, H. Severe scuticociliate (Philasterides dicentrarchi) infection in a population of sea dragons (Phycodurus eques and Phyllopteryx taeniolatus). Vet. Pathol. 2008, 45, 546–550. [Google Scholar] [CrossRef] [PubMed]
- Shin, P.S.; Han, J.E.; Gómez, D.K.; Kim, J.H.; Choresca, C.H., Jr.; Jun, J.W.; Park, S.C. Identification of scuticociliate Philasterides dicentrarchi from Indo-Pacific seahorses Hippocampus kuda. Afr. J. Microbiol. Res. 2011, 5, 738–741. [Google Scholar]
- De Felipe, A.P.; Lamas, J.; Sueiro, R.A.; Folgueira, I.; Leiro, J.M. New data on flatfish scuticociliatosis reveal that Miamiensis avidus and Philasterides dicentrarchi are different species. Parasitology 2017, 144, 1394. [Google Scholar] [CrossRef]
- Dragesco, A.; Dragesco, J.; Coste, F.; Gasc, C.; Romestand, B.; Raymond, J.-C.; Bouix, G. Philasterides dicentrarchi, n. Sp., (Ciliophora, scuticociliatida), a histophagous opportunistic parasite of Dicentrarchus labrax (Linnaeus, 1758), a reared marine fish. Eur. J. Protistol. 1995, 31, 327–340. [Google Scholar] [CrossRef]
- Paramá, A.; Iglesias, R.; Álvarez, M.F.; Leiro, J.; Aja, C.; Sanmartín, M.L. Philasterides dicentrarchi (Ciliophora, Scuticociliatida): Experimental infection and possible routes of entry in farmed turbot (Scophthalmus maximus). Aquaculture 2003, 217, 73–80. [Google Scholar] [CrossRef]
- Jin, C.N.; Harikrishnan, R.; Moon, Y.G.; Kim, M.C.; Kim, J.S.; Balasundaram, C.; Azad, I.S.; Heo, M.S. Histopathological changes of Korea cultured olive flounder, Paralichthys olivaceus due to scuticociliatosis caused by histophagous scuticociliate, Philasterides dicentrarachi. Vet. Parasitol. 2009, 161, 292–301. [Google Scholar] [CrossRef]
- Harikrishnan, R.; Jin, C.N.; Kim, J.S.; Balasundaram, C.; Heo, M.S. Philasterides dicentrarchi, a histophagous ciliate causing scuticociliatosis in olive flounder, Philasterides dicentrarchi-histopathology investigations. Exp. Parasitol. 2012, 130, 239–245. [Google Scholar] [CrossRef]
- Paramá, A.; Iglesias, R.; Álvarez, M.F.; Leiro, J.; Ubeira, F.M.; Sanmartín, M.L. Cysteine proteinase activities in the fish pathogen Philasterides dicentrarchi (Ciliophora: Scuticociliatida). Parasitology 2004, 128, 541–548. [Google Scholar] [CrossRef]
- Piazzon, M.C.; Wiegertjes, G.F.; Leiro, J.; Lamas, J. Turbot resistance to Philasterides dicentrarchi is more dependent on humoral than on cellular immune responses. Fish Shellfish Immunol. 2011, 30, 1339–1347. [Google Scholar] [CrossRef] [PubMed]
- Piazzon, C.; Lamas, J.; Leiro, J.M. Role of scuticociliate proteinases in infection success in turbot, Psetta maxima (L.). Parasite Immunol. 2011, 33, 535–544. [Google Scholar] [CrossRef]
- Paramá, A.; Castro, R.; Arranz, J.A.; Sanmartín, M.L.; Lamas, J.; Leiro, J. Scuticociliate cysteine proteinases modulate turbot leucocyte functions. Fish Shellfish Immunol. 2007, 23, 945–956. [Google Scholar] [CrossRef] [PubMed]
- Paramá, A.; Castro, R.; Lamas, J.; Sanmartín, M.L.; Santamarina, M.T.; Leiro, J. Scuticociliate proteinases may modulate turbot immune response by inducing apoptosis in pronephric leucocytes. Int. J. Parasitol. 2007, 37, 87–95. [Google Scholar] [CrossRef] [PubMed]
- Mallo, N.; Lamas, J.; Leiro, J.M. Evidence of an alternative oxidase pathway for mitochondrial respiration in the scuticociliate Philasterides dicentrarchi. Protist 2013, 164, 824–836. [Google Scholar] [CrossRef]
- Folgueira, I.; Lamas, J.; de Felipe, A.P.; Sueiro, R.A.; Leiro, J.M. Identification and molecular characterization of superoxide dismutases isolated from a scuticociliate parasite: Physiological role in oxidative stress. Sci. Rep. 2019, 9, 13329. [Google Scholar] [CrossRef]
- Folgueira, I.; Lamas, J.; De Felipe, A.P.; Sueiro, R.A.; Leiro, J.M. Evidence for the role of extrusomes in evading attack by the host immune system in a scuticociliate parasite. Fish Shellfish Immunol. 2019, 92, 802–812. [Google Scholar] [CrossRef]
- Piazzon, M.C.; Leiro, J.; Lamas, J. Fish immunity to scuticociliate parasites. Dev. Comp. Immunol. 2013, 41, 248–256. [Google Scholar] [CrossRef]
- Lama, R.; Pereiro, P.; Costa, M.M.; Encinar, J.A.; Medina-Gali, R.M.; Pérez, L.; Lamas, J.; Leiro, J.; Figueras, A.; Novoa, B. Turbot (Scophthalmus maximus) Nk-lysin induces protection against the pathogenic parasite Philasterides dicentrarchi via membrane disruption. Fish Shellfish Immunol. 2018, 82, 190–199. [Google Scholar] [CrossRef]
- Leiro, J.; Piazzon, M.C.; Budiño, B.; Sanmartín, M.L.; Lamas, J. Complement-mediated killing of Philasterides dicentrarchi (Ciliophora) by turbot serum: Relative importance of alternative and classical pathways. Parasite Immunol. 2008, 30, 535–543. [Google Scholar] [CrossRef]
- Blanco-Abad, V.; Noia, M.; Valle, A.; Fontenla, F.; Folgueira, I.; de Felipe, A.P.; Pereiro, P.; Leiro, J.; Lamas, J. The coagulation system helps control infection caused by the ciliate parasite Philasterides dicentrarchi in the turbot Scophthalmus maximus (L.). Dev. Comp. Immunol. 2018, 87, 147–156. [Google Scholar] [CrossRef] [PubMed]
- Pardo, B.G.; Fernández, C.; Millán, A.; Bouza, C.; Vázquez-López, A.; Vera, M.; Álvarez-Dios, J.A.; Calaza, M.; Gómez-Tato, A.; Vázquez, M.; et al. Expressed sequence tags (ESTs) from immune tissues of turbot (Scophthalmus maximus) challenged with pathogens. BMC Vet. Res. 2008, 25, 4–37. [Google Scholar] [CrossRef] [PubMed]
- Pardo, B.G.; Millán, A.; Gómez-Tato, A.; Fernández, C.; Bouza, C.; Álvarez-Dios, J.A.; Cabaleiro, S.; Lamas, J.; Leiro, J.M.; Martínez, P. Gene expression profiles of spleen, liver, and head kidney in turbot (Scophthalmus maximus) along the infection process with Philasterides dicentrarchi using an immune-enriched oligo-microarray. Mar. Biotechnol. 2012, 14, 570–582. [Google Scholar] [CrossRef] [PubMed]
- Hu, Y.; Li, A.; Xu, Y.; Jiang, B.; Lu, G.; Luo, X. Transcriptomic variation of locally-infected skin of Epinephelus coioides reveals the mucosal immune mechanism against Cryptocaryon irritans. Fish Shellfish Immunol. 2017, 66, 398–410. [Google Scholar] [CrossRef]
- Yin, F.; Qian, D. Transcriptomic analysis reveals the key immune-related signalling pathways of Sebastiscus marmoratus in response to infection with the parasitic ciliate Cryptocaryon irritans. Parasites Vectors 2017, 10, 576. [Google Scholar] [CrossRef]
- Zhang, X.; Ding, L.; Yu, Y.; Kong, W.; Yin, Y.; Huang, Z.; Zhang, X.; Xu, Z. The Change of Teleost Skin Commensal Microbiota Is Associated with Skin Mucosal Transcriptomic Responses during Parasitic Infection by Ichthyophthirius multifillis. Front. Immunol. 2018, 9, 2972. [Google Scholar] [CrossRef]
- Syahputra, K.; Kania, P.W.; Al-Jubury, A.; Jafaar, R.M.; Dirks, R.P.; Buchmann, K. Transcriptomic analysis of immunity in rainbow trout (Oncorhynchus mykiss) gills infected by Ichthyophthirius multifiliis. Fish Shellfish Immunol. 2019, 86, 486–496. [Google Scholar] [CrossRef]
- Figueras, A.; Robledo, D.; Corvelo, A.; Hermida, M.; Pereiro, P.; Rubiolo, J.A.; Gómez-Garrido, J.; Carreté, L.; Bello, X.; Gut, M.; et al. Whole genome sequencing of turbot (Scophthalmus maximus; Pleuronectiformes): A fish adapted to demersal life. DNA Res. 2016, 23, 181–192. [Google Scholar] [CrossRef]
- Conesa, A.; Götz, S.; García-Gómez, J.M.; Terol, J.; Talón, M.; Robles, M. Blast2GO, a universal tool for annotation, visualization and analysis in functional genomics research. Bioinformatics 2005, 21, 3674–3676. [Google Scholar] [CrossRef]
- Millán, A.; Gómez-Tato, A.; Pardo, B.G.; Fernández, C.; Bouza, C.; Vera, M.; Alvarez-Dios, J.A.; Cabaleiro, S.; Lamas, J.; Lemos, M.L.; et al. Gene expression profiles of the spleen, liver, and head kidney in turbot (Scophthalmus maximus) along the infection process with Aeromonas salmonicida using an immune-enriched oligo-microarray. Mar. Biotechnol. 2011, 13, 1099–1114. [Google Scholar] [CrossRef]
- Fontenla, F.; Blanco-Abad, V.; Pardo, B.G.; Folgueira, I.; Noia, M.; Gómez-Tato, A.; Martínez, P.; Leiro, J.M.; Lamas, J. Vaccine-induced modulation of gene expression in turbot peritoneal cells. A microarray approach. Mol. Immunol. 2016, 75, 188–199. [Google Scholar] [CrossRef] [PubMed]
- Livak, K.J.; Schmittgen, T.D. Analysis of relative gene expression data using real-time quantitative PCR and the 2(-Delta Delta C(T)) Method. Methods 2001, 25, 402–408. [Google Scholar] [CrossRef] [PubMed]
- Bustin, S.A.; Benes, V.; Garson, J.A.; Hellemans, J.; Huggett, J.; Kubista, M.; Mueller, R.; Nolan, T.; Pfaffl, M.W.; Shipley, G.L.; et al. The MIQE guidelines: Minimum information for publication of quantitative real-time PCR experiments. Clin. Chem. 2009, 55, 611–622. [Google Scholar] [CrossRef]
- Rudra, D.; Warner, J.R. What better measure than ribosome synthesis? Genes Dev. 2004, 18, 2431–2436. [Google Scholar] [CrossRef] [PubMed]
- Sauvage, V.; Aubert, D.; Escotte-Binet, S.; Villena, I. The role of ATP-binding cassette (ABC) proteins in protozoan parasites. Mol. Biochem. Parasitol. 2009, 167, 81–94. [Google Scholar] [CrossRef] [PubMed]
- Kos, V.; Ford, R.C. The ATP-binding cassette family: A structural perspective. Cell. Mol. Life Sci. 2009, 66, 3111–3126. [Google Scholar] [CrossRef]
- Manzano, J.I.; Perea, A.; León-Guerrero, D.; Campos-Salinas, J.; Piacenza, L.; Castanys, S.; Gamarro, F. Leishmania LABCG1 and LABCG2 transporters are involved in virulence and oxidative stress: Functional linkage with autophagy. Parasites Vectors 2017, 10, 267. [Google Scholar] [CrossRef]
- Xiong, J.; Feng, L.; Yuan, D.; Fu, C.; Miao, W. Genome-wide identification and evolution of ATP-binding cassette transporters in the ciliate Tetrahymena thermophila: A case of functional divergence in a multigene family. BMC Evol. Biol. 2010, 10, 330. [Google Scholar] [CrossRef]
- Murase, L.S.; de Souza, J.V.P.; de Lima Neto, Q.A.; de Mello, T.F.P.; Cardoso, B.M.; Lera-Nonose, D.S.S.L.; Teixeira, J.J.V.; Lonardoni, M.V.C.; Demarchi, I.G. The role of metalloproteases in Leishmania species infection in the New World: A systematic review. Parasitology 2018, 145, 1499–1509. [Google Scholar] [CrossRef]
- Olivier, M.; Atayde, V.D.; Isnard, A.; Hassani, K.; Shio, M.T. Leishmania virulence factors: Focus on the metalloprotease GP63. Microbes Infect. 2012, 14, 1377–1389. [Google Scholar] [CrossRef]
- Brittingham, A.; Morrison, C.J.; McMaster, W.R.; McGwire, B.S.; Chang, K.P.; Mosser, D.M. Role of the Leishmania surface protease gp63 in complement fixation, cell adhesion, and resistance to complement-mediated lysis. J. Immunol. 1995, 155, 3102–3111. [Google Scholar] [CrossRef]
- Thiakaki, M.; Kolli, B.; Chang, K.P.; Soteriadou, K. Down-regulation of gp63 level in Leishmania amazonensis promastigotes reduces their infectivity in BALB/c mice. Microbes Infect. 2006, 8, 1455–1463. [Google Scholar] [CrossRef] [PubMed]
- Mallo, N.; De Felipe, A.P.; Folgueira, I.; Sueiro, R.A.; Lamas, J.; Leiro, J.M. Combined antiparasitic and anti-inflammatory effects of the natural polyphenol curcumin on turbot scuticociliatosis. J. Fish Dis. 2017, 40, 205–217. [Google Scholar] [CrossRef]
- Seo, J.S.; Jeon, E.J.; Jung, S.H.; Park, M.A.; Kim, J.W.; Kim, K.H.; Woo, S.H.; Lee, E.H. Molecular cloning and expression analysis of peptidase genes in the fish-pathogenic scuticociliate Miamiensis avidus. BMC Vet. Res. 2013, 9, 10. [Google Scholar] [CrossRef] [PubMed]
- Acorn, A.R.; Clark, K.F.; Jones, S.; Després, B.M.; Munro, S.; Cawthorn, R.J.; Greenwood, S.J. Analysis of expressed sequence tags (ESTs) and gene expression changes under different growth conditions for the ciliate Anophryoides haemophila, the causative agent of bumper car disease in the American lobster (Homarus americanus). J. Invertebr. Pathol. 2011, 107, 146–154. [Google Scholar] [CrossRef] [PubMed]
- Hayward, D.; Alfonso-Pérez, T.; Gruneberg, U. Orchestration of the spindle assembly checkpoint by CDK1-cyclin B1. FEBS Lett. 2019, 593, 2889–2907. [Google Scholar] [CrossRef] [PubMed]
- Liu, Q.; Gao, J.; Zhao, C.; Guo, Y.; Wang, S.; Shen, F.; Xing, X.; Luo, Y. To control or to be controlled? Dual roles of CDK2 in DNA damage and DNA damage response. DNA Repair 2020, 85, 102702. [Google Scholar] [CrossRef] [PubMed]
- Burger, G.; Zhu, Y.; Littlejohn, T.G.; Greenwood, S.J.; Schnare, M.N.; Lang, B.F.; Gray, M.W. Complete sequence of the mitochondrial genome of Tetrahymena pyriformis and comparison with Paramecium aurelia mitochondrial DNA. J. Mol. Biol. 2000, 297, 365–380. [Google Scholar] [CrossRef]
- Morais, P.; Piazzon, C.; Lamas, J.; Mallo, N.; Leiro, J.M. Effect of resveratrol on oxygen consumption by Philasterides dicentrarchi, a scuticociliate parasite of turbot. Protist 2013, 164, 206–217. [Google Scholar] [CrossRef]
- Liao, X.S.; Small, W.C.; Srere, P.A.; Butow, R.A. Intramitochondrial functions regulate nonmitochondrial citrate synthase (CIT2) expression in Saccharomyces cerevisiae. Mol. Cell Biol. 1991, 11, 38–46. [Google Scholar] [CrossRef] [PubMed]
- Chen, L.; Deng, H.; Cui, H.; Fang, J.; Zuo, Z.; Deng, J.; Li, Y.; Wang, X.; Zhao, L. Inflammatory responses and inflammation-associated diseases in organs. Oncotarget 2017, 9, 7204–7218. [Google Scholar] [CrossRef] [PubMed]
- Li, Y.W.; Luo, X.C.; Dan, X.M.; Huang, X.Z.; Qiao, W.; Zhong, Z.P.; Li, A.X. Orange-spotted grouper (Epinephelus coioides) TLR2, MyD88 and IL-1β involved in anti-Cryptocaryon irritans response. Fish Shellfish Immunol. 2011, 30, 1230–1240. [Google Scholar] [CrossRef] [PubMed]
- Zhao, F.; Li, Y.W.; Pan, H.J.; Shi, C.B.; Luo, X.C.; Li, A.X.; Wu, S.Q. Expression profiles of toll-like receptors in channel catfish (Ictalurus punctatus) after infection with Ichthyophthirius multifiliis. Fish Shellfish Immunol. 2013, 35, 993–997. [Google Scholar] [CrossRef] [PubMed]
- Campos, M.A.; Almeida, I.C.; Takeuchi, O.; Akira, S.; Valente, E.P.; Procópio, D.O.; Travassos, L.R.; Smith, J.A.; Golenbock, D.T.; Gazzinelli, R.T. Activation of Toll-like receptor-2 by glycosylphosphatidylinositol anchors from a protozoan parasite. J. Immunol. 2001, 167, 416–423. [Google Scholar] [CrossRef] [PubMed]
- Durai, P.; Govindaraj, R.G.; Choi, S. Structure and dynamic behavior of Toll-like receptor 2 subfamily triggered by malarial glycosylphosphatidylinositols of Plasmodium falciparum. FEBS J. 2013, 280, 6196–6212. [Google Scholar] [CrossRef] [PubMed]
- Li, L.; Li, X.; Gong, P.; Zhang, X.; Yang, Z.; Yang, J.; Li, J. Trichomonas vaginalis Induces Production of Proinflammatory Cytokines in Mouse Macrophages Through Activation of MAPK and NF-κB Pathways Partially Mediated by TLR2. Front. Microbiol. 2018, 9, 712. [Google Scholar] [CrossRef] [PubMed]
- Roh, J.S.; Sohn, D.H. Damage-Associated Molecular Patterns in Inflammatory Diseases. Immune Netw. 2018, 18, e27. [Google Scholar] [CrossRef]
- Vijay, K. Toll-like receptors in immunity and inflammatory diseases: Past, present, and future. Int. Immunopharmacol. 2018, 59, 391–412. [Google Scholar] [CrossRef]
- Zhong, D.; Pai, A.; Wang, M.H.; Keech, N.; Yan, G. Fine-scale analysis of parasite resistance genes in the red flour beetle, Tribolium castaneum. Genetics 2013, 195, 253–261. [Google Scholar] [CrossRef]
- Bai, J.S.; Li, Y.W.; Deng, Y.; Huang, Y.Q.; He, S.H.; Dai, J.; Zhao, S.Z.; Dan, X.M.; Luo, X.C. Molecular identification and expression analysis of TLR5M and TLR5S from orange-spotted grouper (Epinephelus coioides). Fish Shellfish Immunol. 2017, 63, 97–102. [Google Scholar] [CrossRef]
- Tian, F.; Tong, C.; Feng, C.; Wanghe, K.; Zhao, K. Transcriptomic profiling of Tibetan highland fish (Gymnocypris przewalskii) in response to the infection of parasite ciliate Ichthyophthirius multifiliis. Fish Shellfish Immunol. 2017, 70, 524–535. [Google Scholar] [CrossRef] [PubMed]
- Newton, K.; Dixit, V.M. Signaling in innate immunity and inflammation. Cold Spring Harb. Perspect. Biol. 2012, 4, a006049. [Google Scholar] [CrossRef] [PubMed]
- Lawrence, T. The Nuclear Factor NF-κB Pathway in Inflammation. Cold Spring Harb. Perspect. Biol. 2009, 1, a001651. [Google Scholar] [CrossRef] [PubMed]
- Kiu, H.; Nicholson, S.E. Biology and significance of the JAK/STAT signalling pathways. Growth Factors 2012, 30, 88–106. [Google Scholar] [CrossRef]
- Arthur, J.S.; Ley, S.C. Mitogen-activated protein kinases in innate immunity. Nat. Rev. Immunol. 2013, 13, 679–692. [Google Scholar] [CrossRef]
- Russo, R.C.; García, C.C.; Teixeira, M.M.; Amaral, F.A.; Kiu, H.; Nicholson, S.E. The CXCL8/IL-8 chemokine family and its receptors in inflammatory diseases. Expert Rev. Clin. Immunol. 2014, 10, 593–619. [Google Scholar] [CrossRef]
- Hu, Y.H.; Chen, L.; Sun, L. CXCL8 of Scophthalmus maximus: Expression, biological activity and immunoregulatory effect. Dev. Comp. Immunol. 2011, 35, 1032–1039. [Google Scholar] [CrossRef]
- Holbrook, J.; Lara-Reyna, S.; Jarosz-Griffiths, H.; McDermott, M. Tumour necrosis factor signalling in health and disease. F1000Research 2019, 8. [Google Scholar] [CrossRef]
- Zou, J.; Secombes, C.J. The Function of Fish Cytokines. Biology 2016, 5, 23. [Google Scholar] [CrossRef]
- Sun, H.; Gong, S.; Carmody, R.J.; Hilliard, A.; Li, L.; Sun, J.; Kong, L.; Xu, L.; Hilliard, B.; Hu, S.; et al. TIPE2, a negative regulator of innate and adaptive immunity that maintains immune homeostasis. Cell 2008, 133, 415–426. [Google Scholar] [CrossRef]
- Piazzon, M.C.; Lutfalla, G.; Forlenza, M. IL10, A Tale of an Evolutionarily Conserved Cytokine across Vertebrates. Crit. Rev. Immunol. 2016, 36, 99–129. [Google Scholar] [CrossRef]
- Zundler, S.; Neurath, M.F. Interleukin-12: Functional activities and implications for disease. Cytokine Growth Factor Rev. 2015, 26, 559–568. [Google Scholar] [CrossRef] [PubMed]
- Kim, D.; Lee, S.H.; Lee, H.; Kim, S.J.; Lee, K.H.; Song, S.K. Analyses of the gene structure and function of olive flounder (Paralichthys olivaceus) interleukin 12 (IL-12). Fish Shellfish Immunol. 2019, 92, 151–164. [Google Scholar] [CrossRef]
- Bou-Nader, C.; Gordon, J.M.; Henderson, F.E.; Zhang, J. The search for a PKR code-differential regulation of protein kinase R activity by diverse RNA and protein regulators. RNA 2019, 25, 539–556. [Google Scholar] [CrossRef] [PubMed]
- Zhao, G.N.; Jiang, D.S.; Li, H. Interferon regulatory factors: At the crossroads of immunity, metabolism, and disease. Biochim. Biophys. Acta 2015, 1852, 365–378. [Google Scholar] [CrossRef]
- Gun, S.Y.; Claser, C.; Tan, K.S.; Rénia, L. Interferons and interferon regulatory factors in malaria. Mediat. Inflamm. 2014, 2014, 243713. [Google Scholar] [CrossRef]
- Holland, J.W.; Karim, A.; Wang, T.; Alnabulsi, A.; Scott, J.; Collet, B.; Mughal, M.S.; Secombes, C.J.; Bird, S. Molecular cloning and characterization of interferon regulatory factors 4 and 8 (IRF-4 and IRF-8) in rainbow trout, Oncorhynchus mykiss. Fish Shellfish Immunol. 2010, 29, 157–166. [Google Scholar] [CrossRef]
- Noia, M.; Domínguez, B.; Leiro, J.; Blanco-Méndez, J.; Luzardo-Álvarez, A.; Lamas, J. Inflammatory responses and side effects generated by several adjuvant-containing vaccines in turbot. Fish Shellfish Immunol. 2014, 38, 244–254. [Google Scholar] [CrossRef] [PubMed]
- Havixbeck, J.J.; Rieger, A.M.; Wong, M.E.; Hodgkinson, J.W.; Barreda, D.R. Neutrophil contributions to the induction and regulation of the acute inflammatory response in teleost fish. J. Leukoc. Biol. 2016, 99, 241–252. [Google Scholar] [CrossRef] [PubMed]
- Costa-Ramos, C.; Vale, A.D.; Ludovico, P.; Dos Santos, N.M.; Silva, M.T. The bacterial exotoxin AIP56 induces fish macrophage and neutrophil apoptosis using mechanisms of the extrinsic and intrinsic pathways. Fish Shellfish Immunol. 2011, 30, 173–181. [Google Scholar] [CrossRef]
- Castro, R.; Abós, B.; González, L.; Granja, A.G.; Tafalla, C. Expansion and differentiation of IgM(+) B cells in the rainbow trout peritoneal cavity in response to different antigens. Dev. Comp. Immunol. 2017, 70, 119–127. [Google Scholar] [CrossRef]
- Voskoboinik, I.; Whisstock, J.C.; Trapani, J.A. Perforin and granzymes: Function, dysfunction and human pathology. Nat. Rev. Immunol. 2015, 15, 388–400. [Google Scholar] [CrossRef] [PubMed]
- Chaves-Pozo, E.; Valero, Y.; Lozano, M.T.; Rodríguez-Cerezo, P.; Miao, L.; Campo, V.; Esteban, M.A.; Cuesta, A. Fish Granzyme A Shows a Greater Role Than Granzyme B in Fish Innate Cell-Mediated Cytotoxicity. Front. Immunol. 2019, 10, 2579. [Google Scholar] [CrossRef] [PubMed]
- Dotiwala, F.; Mulik, S.; Polidoro, R.B.; Ansara, J.A.; Burleigh, B.A.; Walch, M.; Gazzinelli, R.T.; Lieberman, J. Killer lymphocytes use granulysin, perforin and granzymes to kill intracellular parasites. Nat. Med. 2016, 22, 210–216. [Google Scholar] [CrossRef]
- González, S.F.; Buchmann, K.; Nielsen, M.E. Complement expression in common carp (Cyprinus carpio L.) during infection with Ichthyophthirius multifiliis. Dev. Comp. Immunol. 2007, 31, 576–586. [Google Scholar] [CrossRef] [PubMed]
- Sitjà-Bobadilla, A. Living off a fish: A trade-off between parasites and the immune system. Fish Shellfish Immunol. 2008, 25, 358–372. [Google Scholar] [CrossRef]
- Gómez, D.; Bartholomew, J.; Sunyer, J.O. Biology and mucosal immunity to myxozoans. Dev. Comp. Immunol. 2014, 43, 243–256. [Google Scholar] [CrossRef]
- Jiang, B.; Du, J.J.; Li, Y.W.; Ma, P.; Hu, Y.Z.; Li, A.X. Transcriptome analysis provides insights into molecular immune mechanisms of rabbitfish, Siganus oramin against Cryptocaryon irritans infection. Fish Shellfish Immunol. 2019, 88, 111–116. [Google Scholar] [CrossRef]


Publisher’s Note: MDPI stays neutral with regard to jurisdictional claims in published maps and institutional affiliations. |
© 2020 by the authors. Licensee MDPI, Basel, Switzerland. This article is an open access article distributed under the terms and conditions of the Creative Commons Attribution (CC BY) license (http://creativecommons.org/licenses/by/4.0/).