A Transformer-Based Deep Diffusion Model for Bulk RNA-Seq Deconvolution
Simple Summary
Abstract
1. Introduction
2. Materials and Methods
2.1. Datasets and Preprocessing
- PBMC3k Dataset: Sourced from 10× Genomics, this dataset contains approximately 2700 cells. We annotated them into 8 major immune cell types based on the original study’s Louvain clustering: B cells, CD4+ T cells, CD8+ T cells, NK cells, CD14+ Monocytes, FCGR3A+ Monocytes, Dendritic cells, and Megakaryocytes.
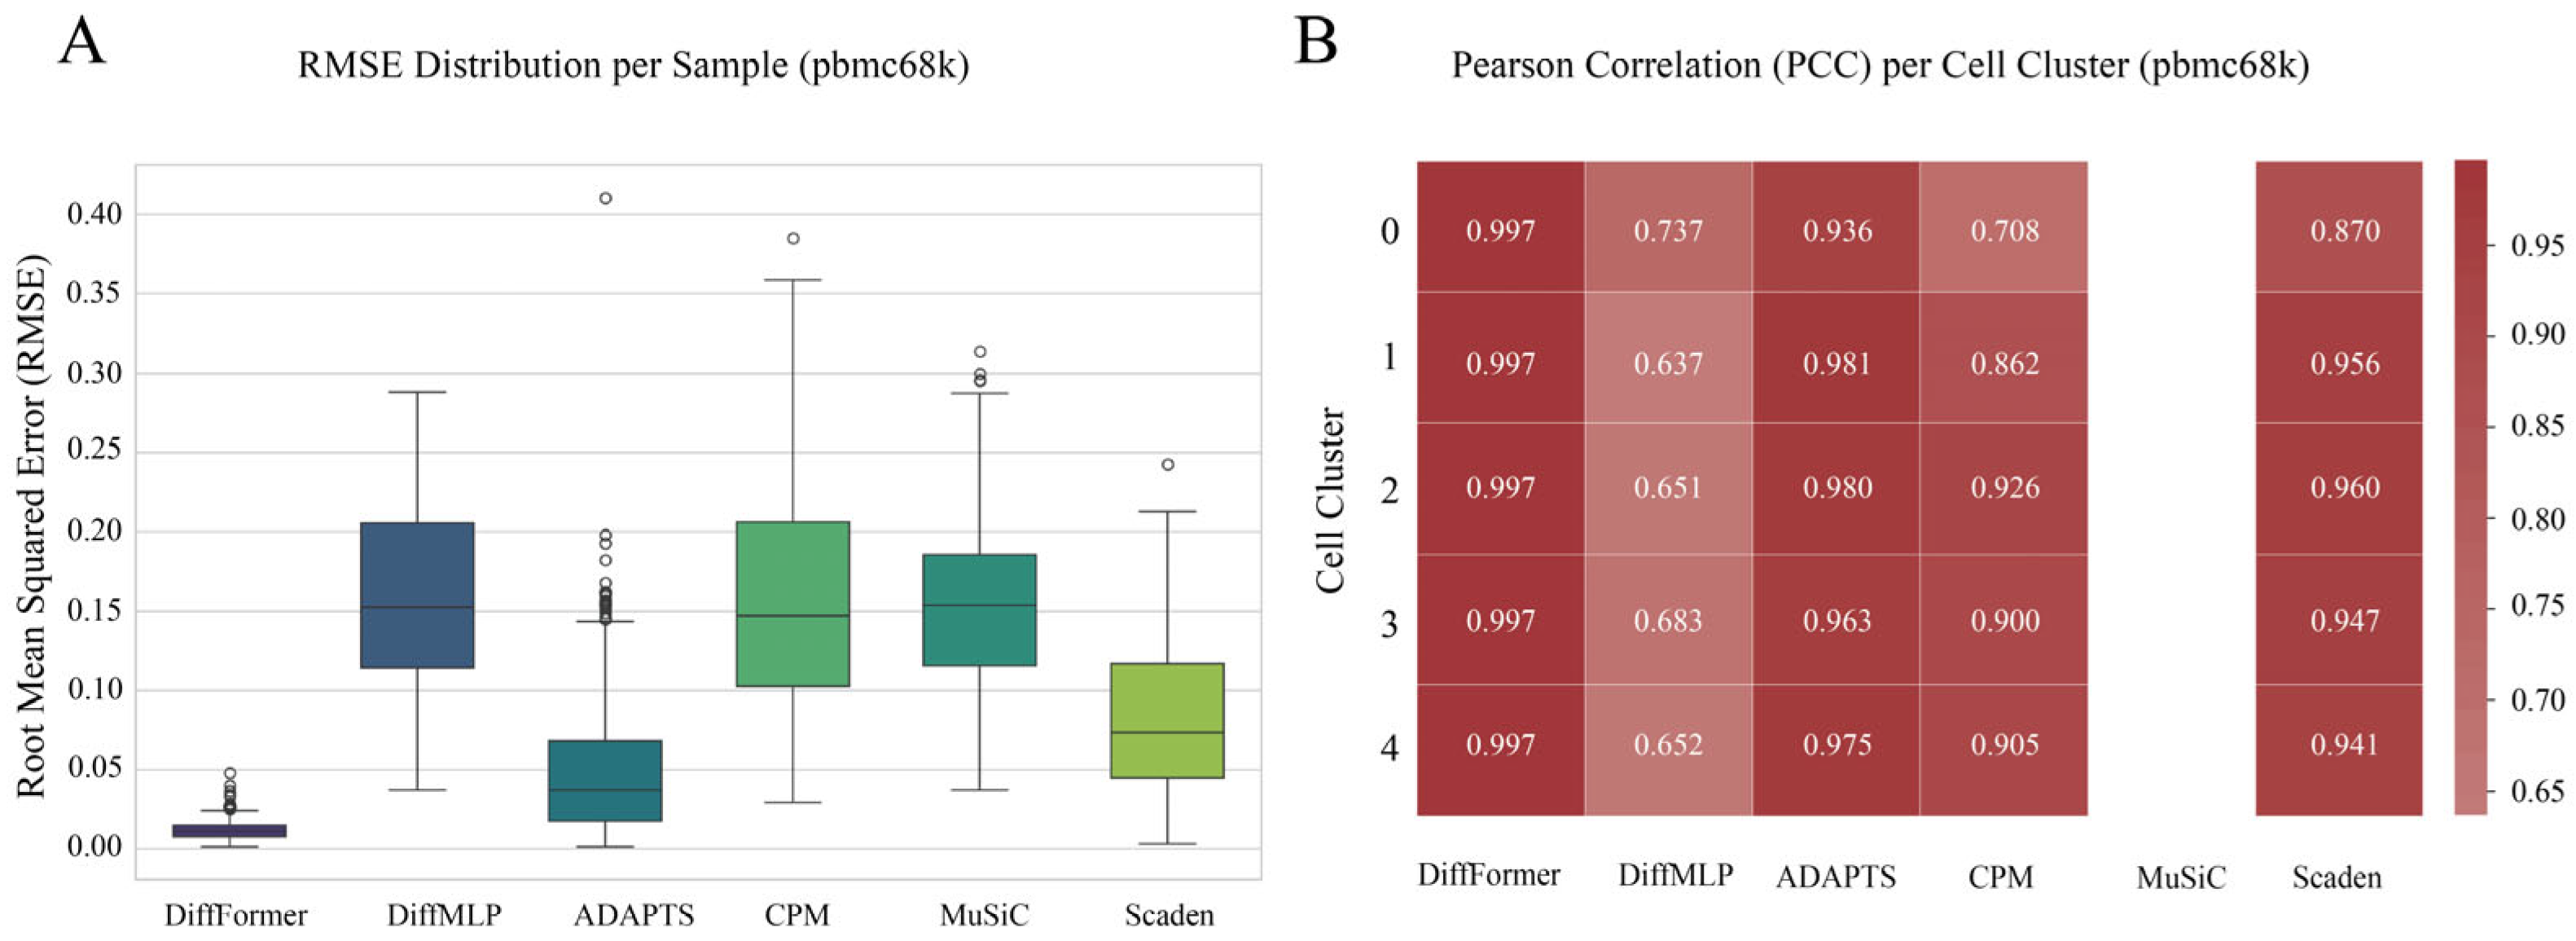
- PBMC68k Dataset: Also from 10× Genomics, this dataset includes about 68,000 cells. We used the pre-annotated 5 major cell clusters (Cell Cluster 0–4) as a reference.
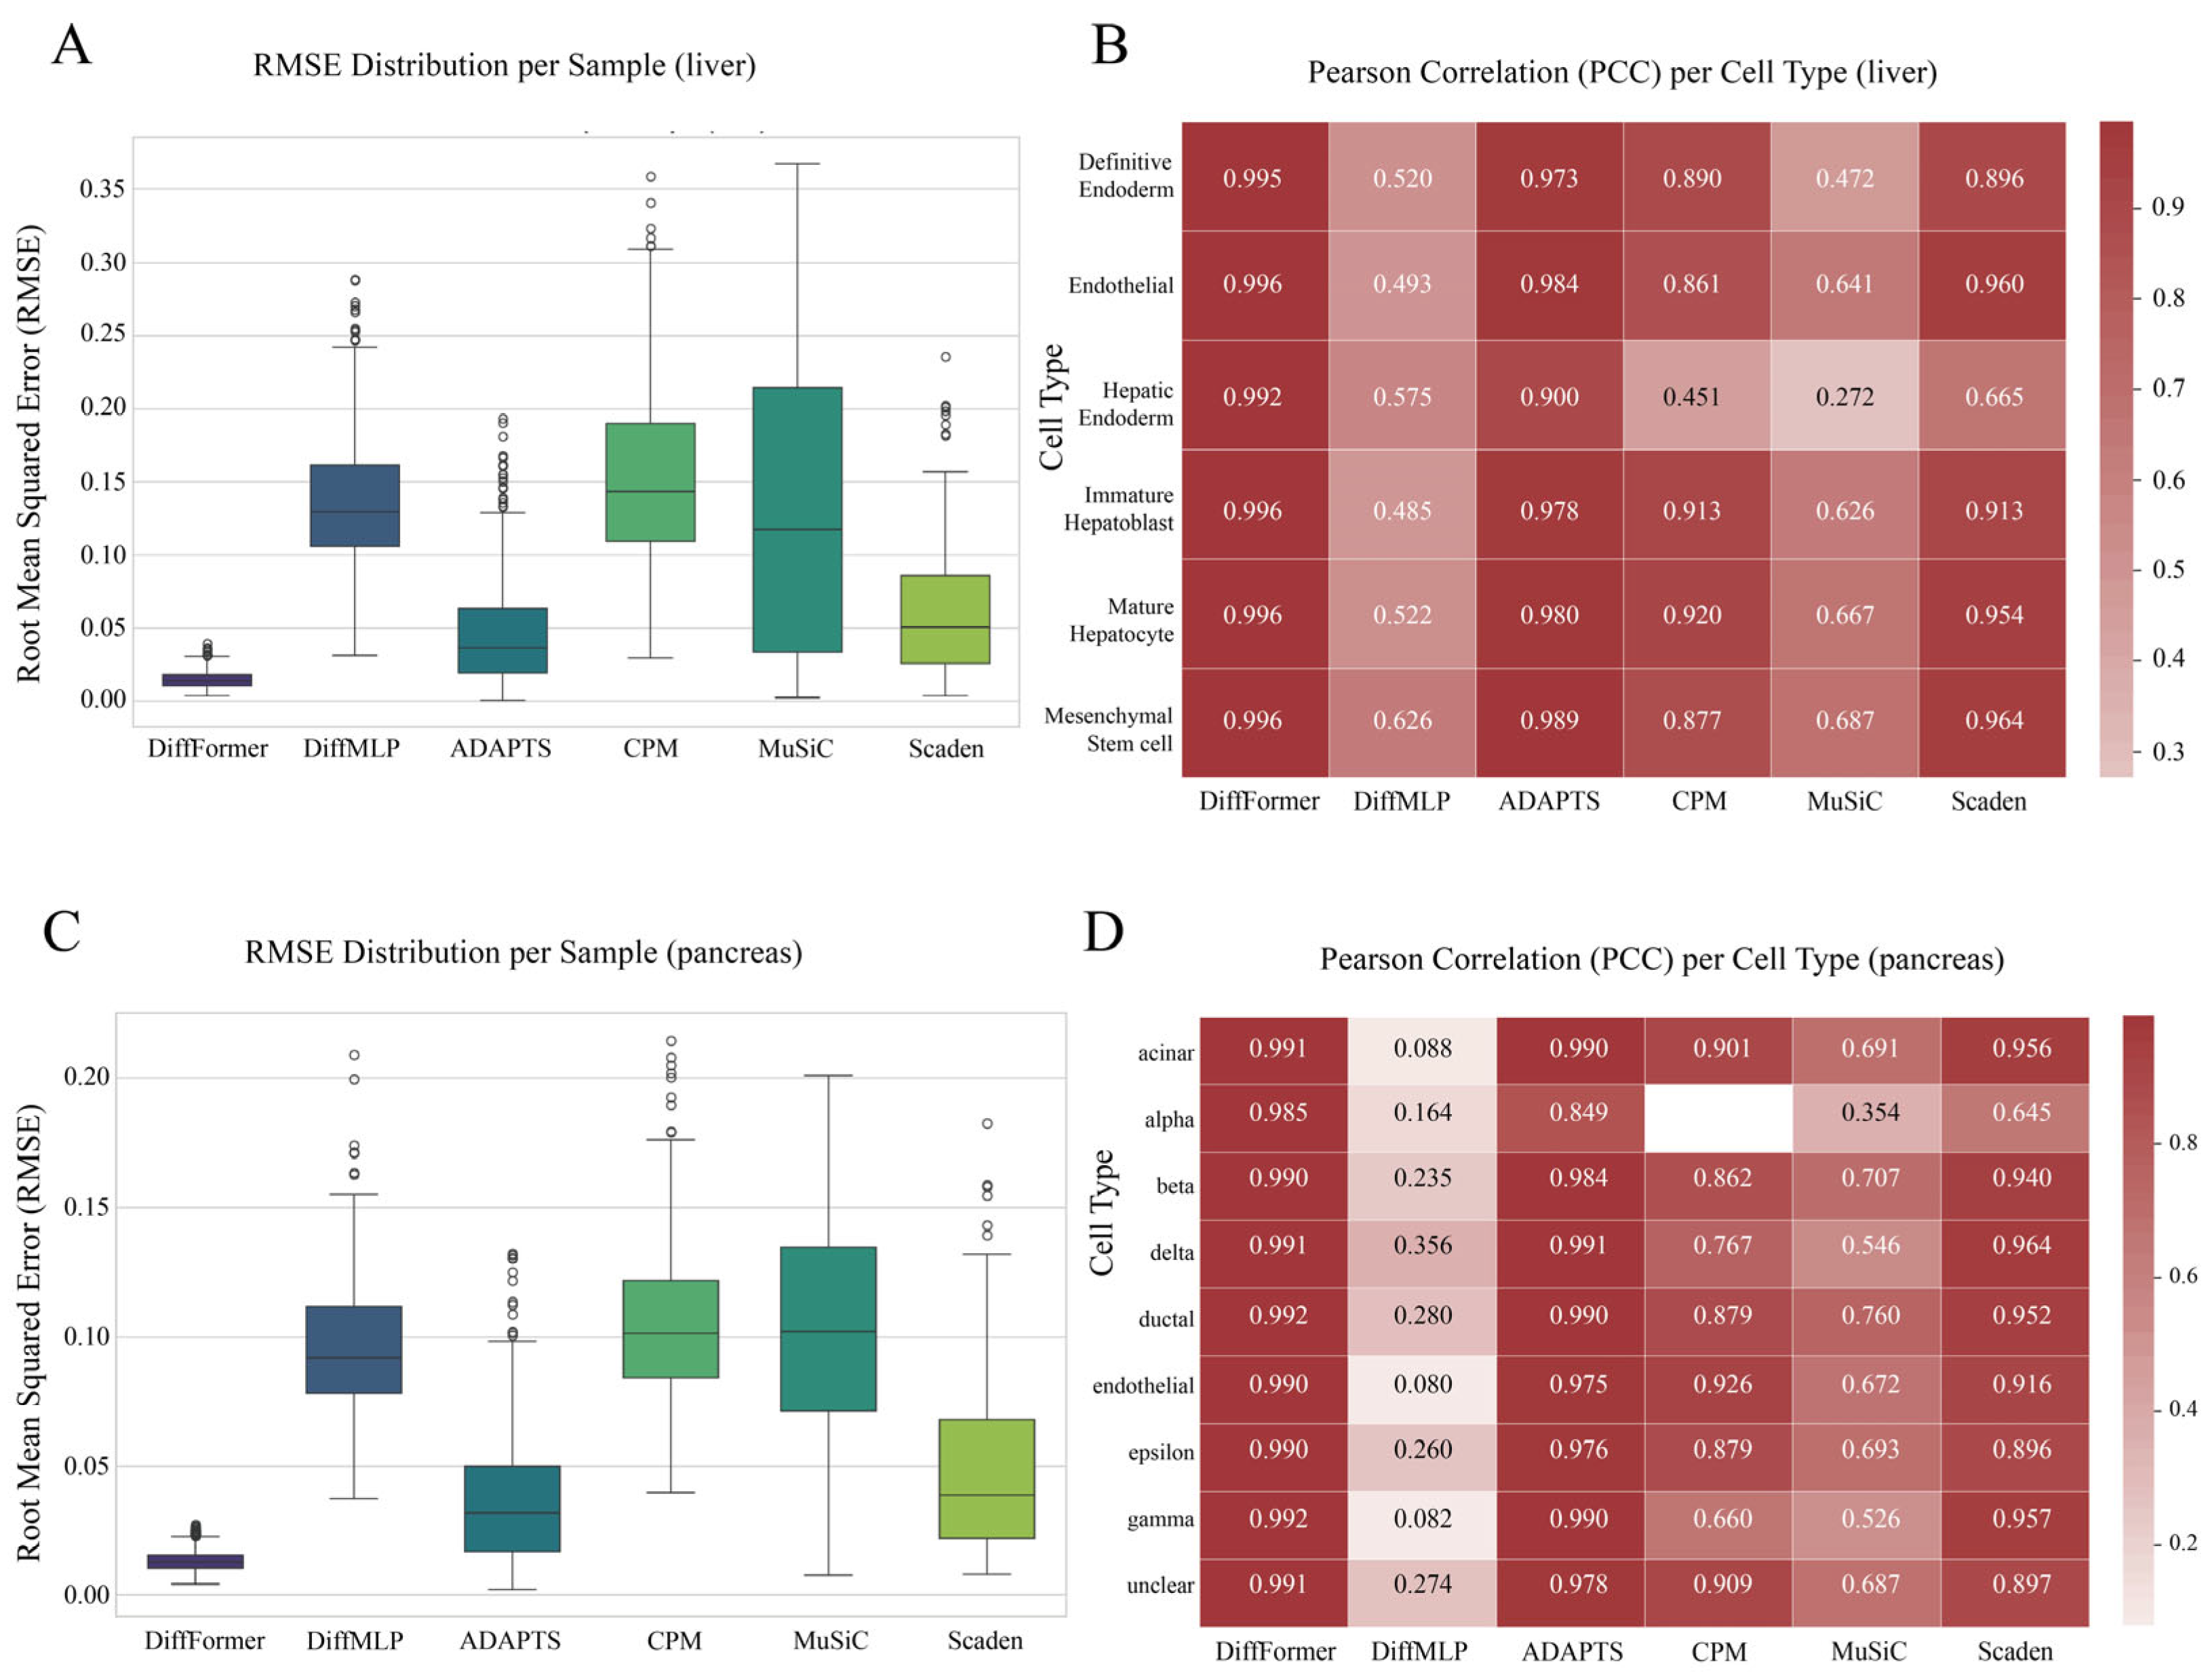
- Liver Dataset: This dataset originates from a study by Camp et al. (2017) [13], who performed scRNA-seq on human liver tissue. After our quality control, approximately 2100 cells were used for analysis, comprising 6 cell types: definitive endoderm, endothelial, hepatic endoderm, immature hepatoblast, mature hepatocyte, and mesenchymal stem cell.
- Pancreas Dataset: This dataset comes from a study by Muraro et al. (2016) on human pancreatic tissue [14]. After filtering low-quality cells, about 1900 cells were retained. Its cellular composition is more complex than the blood system, including 9 cell types: Alpha, Beta, Delta, Gamma, and Epsilon endocrine cells, as well as ductal, acinar, endothelial, and a small number of unclassified cells.
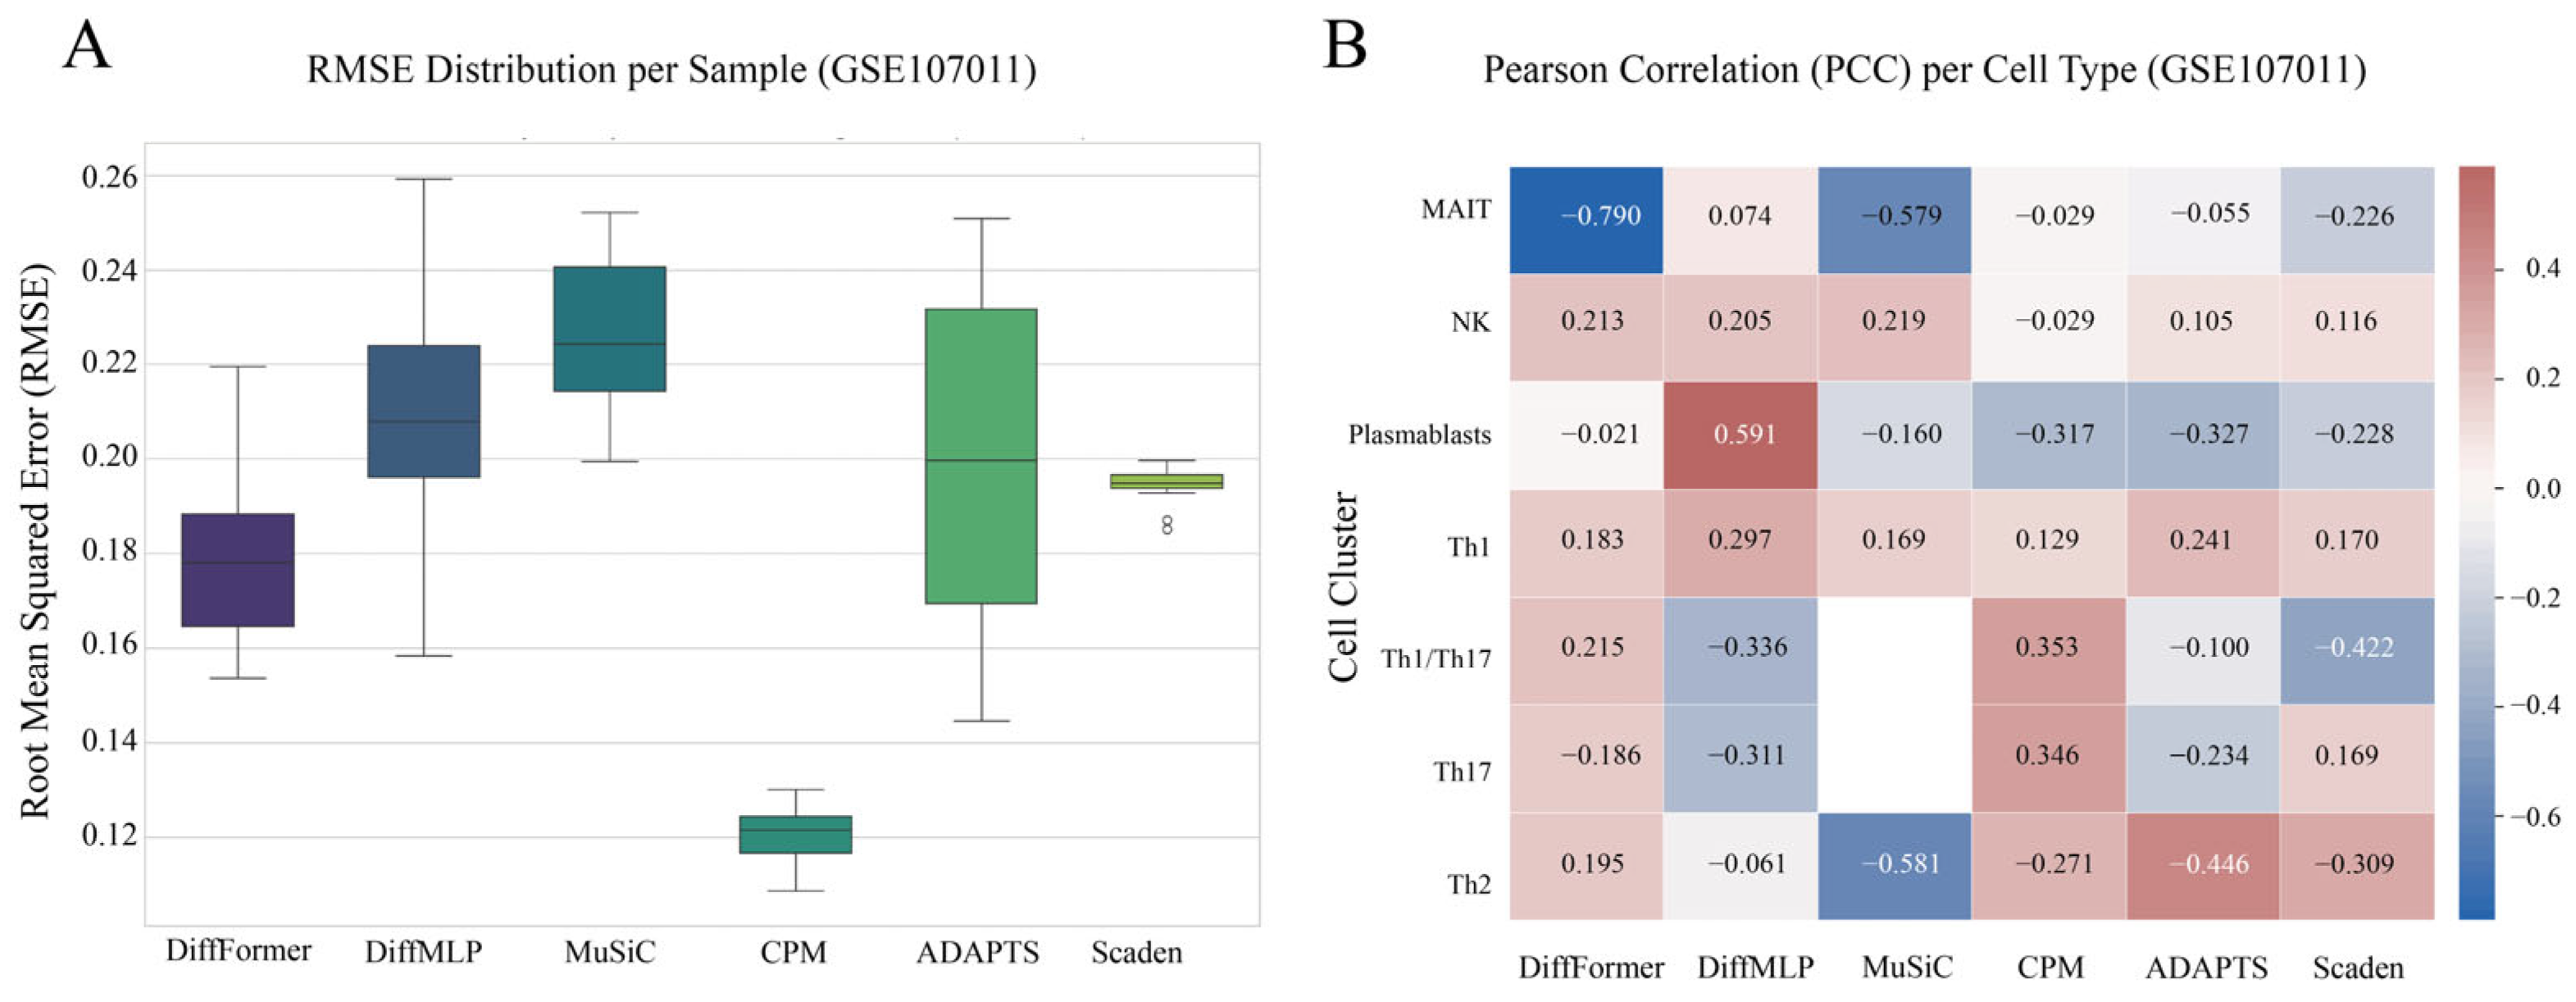
- GSE107011 Dataset: Used for final real-world validation, this gold-standard dataset is available from the Gene Expression Omnibus (GEO accession: GSE107011, https://www.ncbi.nlm.nih.gov/geo/query/acc.cgi?acc=GSE107011, accessed on 12 July 2025). It is unique in that it provides both bulk RNA-seq profiles from 12 healthy human PBMC samples and their corresponding true cell proportions, which were experimentally determined using fluorescence-activated cell sorting (FACS). The reference signature matrix was derived from the same study but from different donors, providing a realistic test case for model generalization.
- Quality Control (QC): Low-quality cells were filtered out based on having fewer than 200 or more than 5000 expressed genes, or a mitochondrial gene ratio exceeding 20%. Genes expressed in very few cells were also removed [15].
- Normalization and Transformation: Gene expression counts were normalized to counts per 10,000 (CP10k) and then log-transformed (log1p) [16].
- Feature Selection and Marker Gene Identification: For each dataset, we selected the top 2000 highly variable genes (HVGs) using Scanpy’s highly_variable_genes function with the following parameters: min_mean = 0.0125, max_mean = 3, min_disp = 0.5, which serve as discriminative markers that capture the most informative biological signal for distinguishing between cell types. The HVG selection process identifies genes with high variance across cells after controlling for mean expression, effectively capturing genes that are differentially expressed between cell types, including canonical cell-type markers (e.g., CD3D, CD3E for T cells; CD19, MS4A1 for B cells; CD68, LYZ for monocytes), traditional surface markers used for flow cytometry-based cell sorting, transcription factors specific to cell lineages (e.g., FOXP3 for regulatory T cells), functional genes related to cell-type-specific biological processes, and metabolic genes that reflect cell-type-specific energy requirements. For the final validation on the GSE107011 dataset, this was increased to 5000 HVGs to better capture biological signals and account for potential batch effects between reference and target data [17], providing greater robustness for real-world applications where reference-target domain shifts may occur.
2.2. Pseudo-Bulk Simulation
- Cell Composition: Each pseudo-bulk sample was composed of a fixed total of 2000 single cells.
- Proportion Generation: A random cell-type proportion vector was generated for each sample using a symmetric Dirichlet distribution with alpha = 1.0 for all cell types (i.e., Dir (α1, α2,…, αₙ) where αᵢ = 1.0 for all i). This corresponds to a uniform distribution over the probability simplex, ensuring that all possible cell type proportion combinations have equal prior probability. The choice of α = 1.0 was motivated by biological realism (capturing natural tissue variability without artificial biases), evaluation robustness (generating a balanced mix of sparse and uniform compositions across the full range of biologically plausible scenarios), and method comparison fairness (ensuring no deconvolution method gains unfair advantage from proportion distribution priors).
- Sample Generation: Cells were randomly sampled (with replacement) from the corresponding cell types according to the generated proportions. Their gene expression profiles were then averaged to create a pseudo-bulk RNA-seq sample.
- Dataset Scale: For each of the four datasets, 5000 training samples and 500 test samples were generated.
2.3. Model Architecture: From DiffMLP to DiffFormer
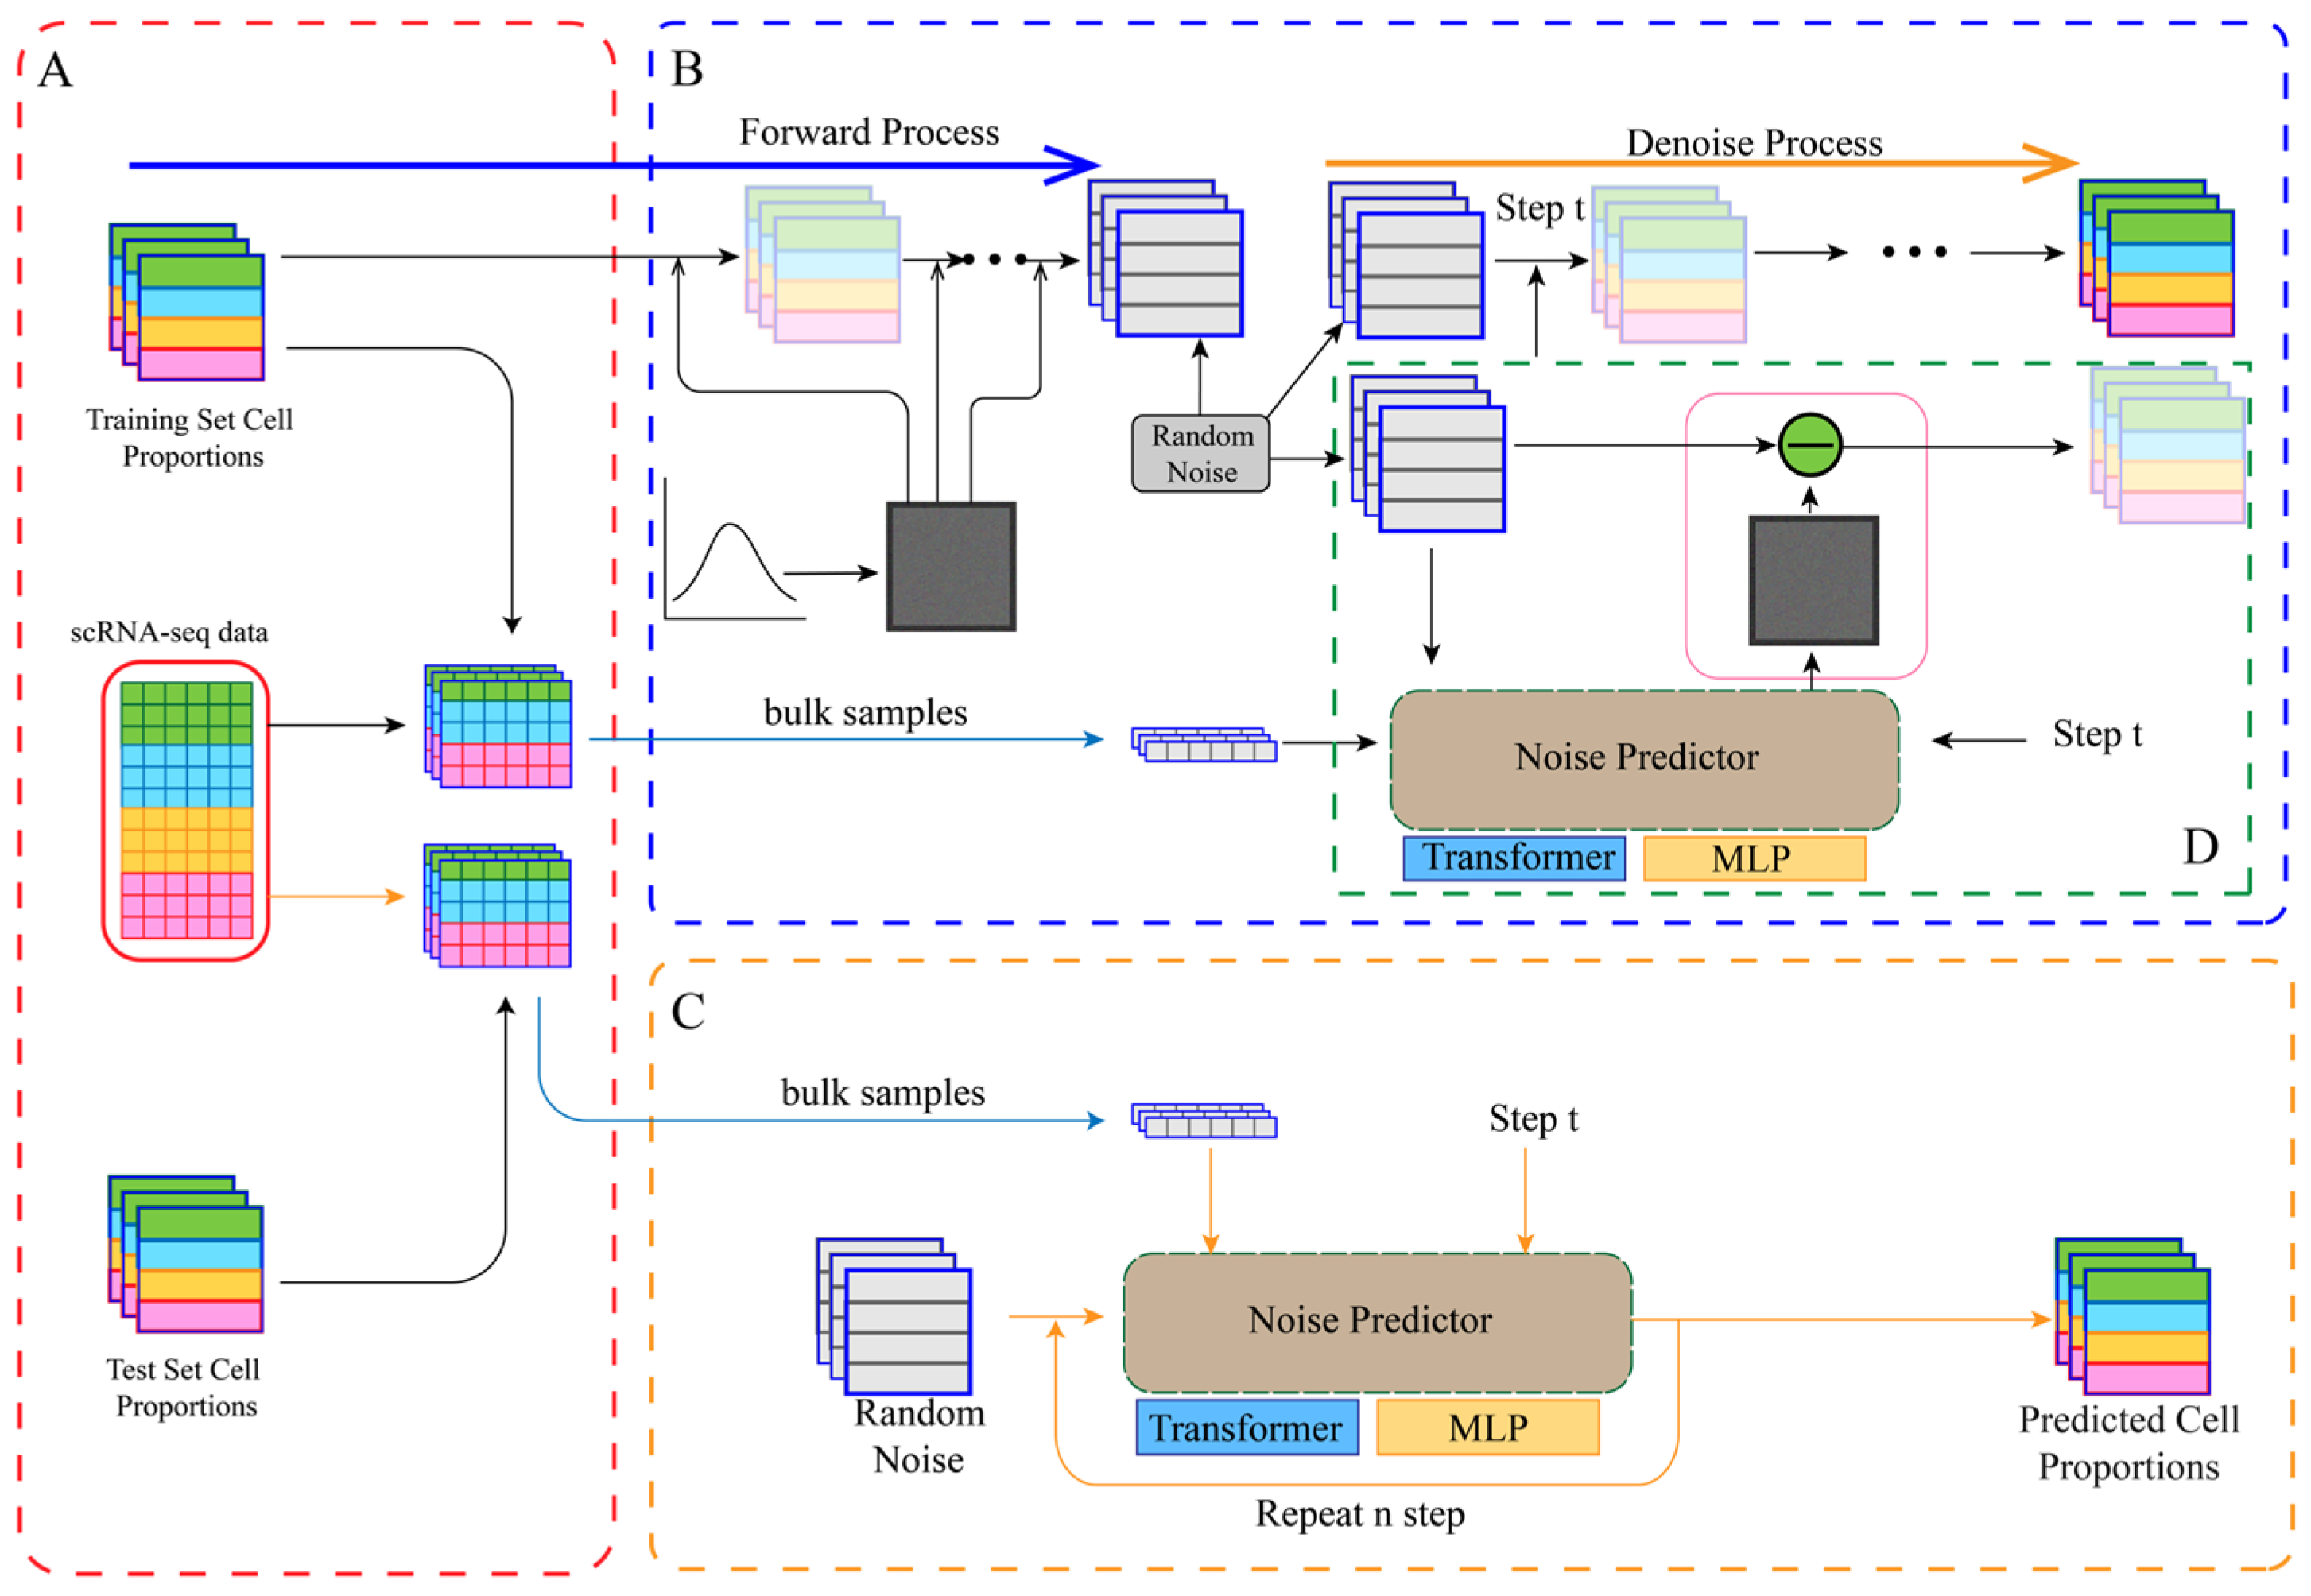
- Forward Process (Diffusion): Starting from a real cell proportion vector , Gaussian noise is gradually added over T = 1000 timesteps. The noising process at any timestep t follows a Markov chain, with the conditional probability distribution defined aswhere is the noise variance at timestep t, following a linear schedule from to .
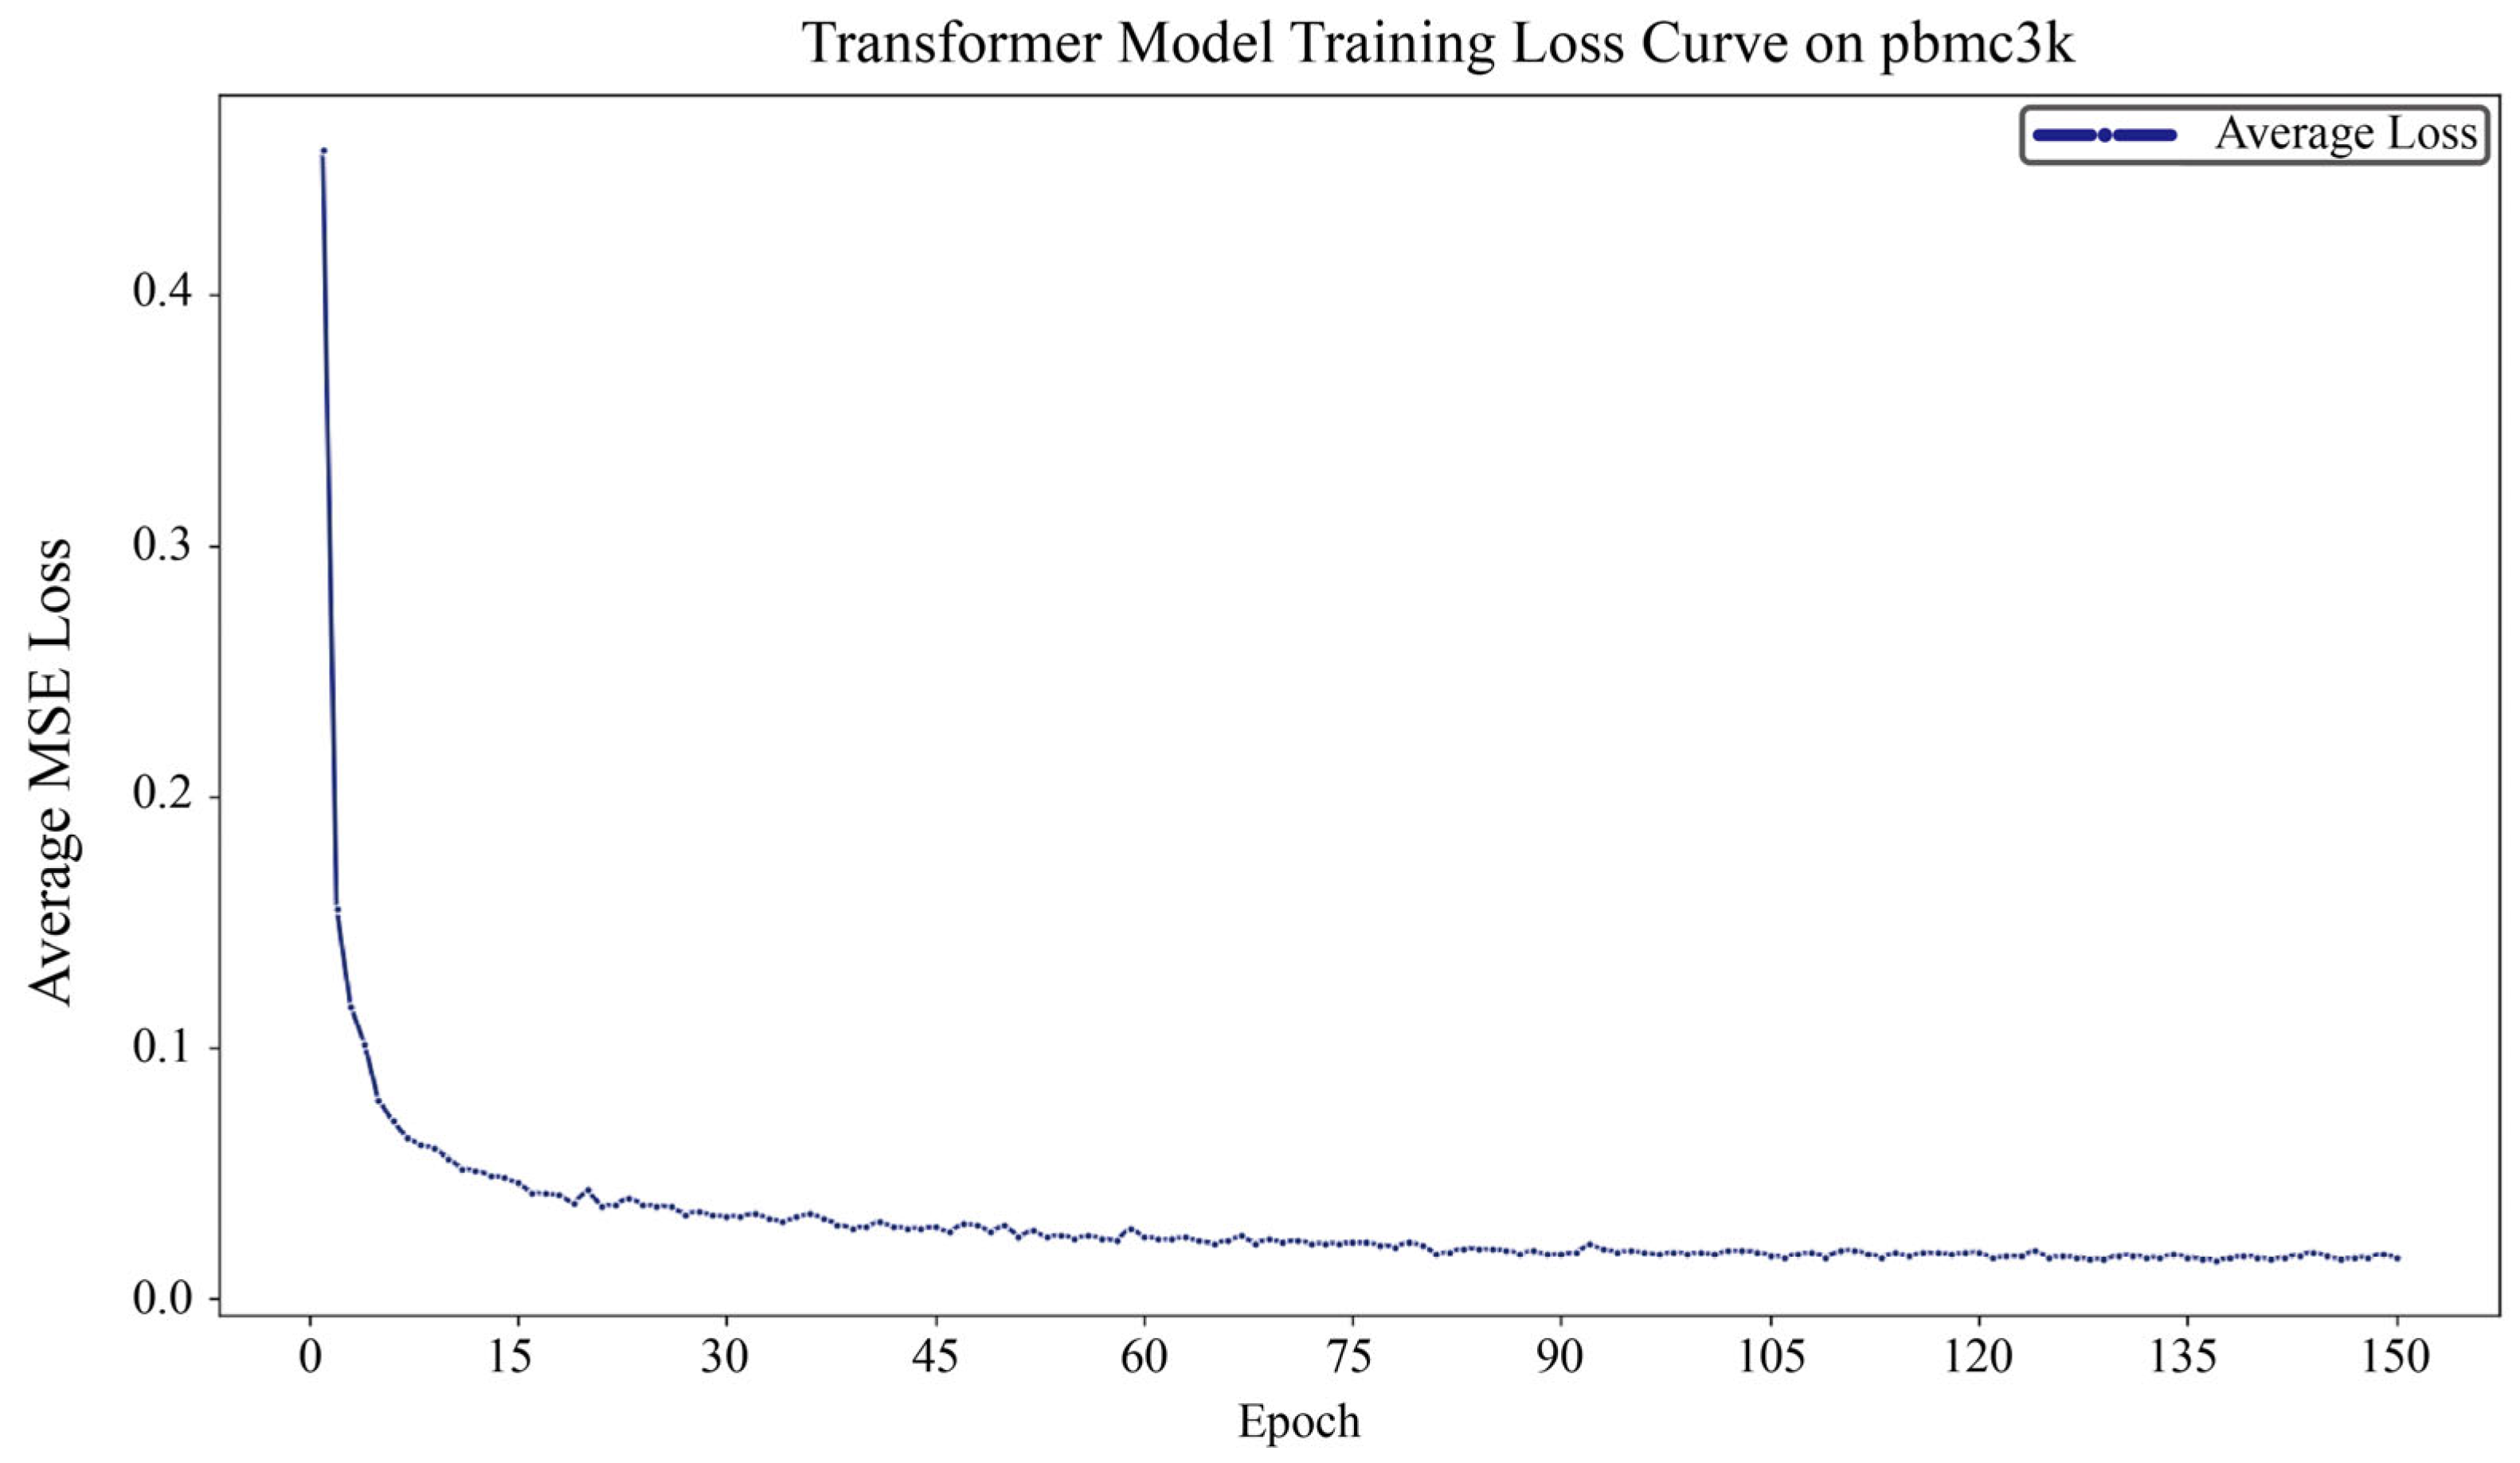
- Reverse Process (Denoising): A denoiser network is trained to predict the noise ε added to the noisy vector , given the timestep t and conditional information c (the bulk RNA-seq expression profile). The original cell proportions are recovered by iteratively subtracting the predicted noise from a pure Gaussian noise vector . The training objective is to minimize the mean squared error (MSE) between the predicted noise and the true noise, with the loss function defined as
- Input Embedding: The three inputs (, t, c) are independently embedded into a 128-dimensional feature space to unify their dimensions for the Transformer.
- Sequence Construction and Self-Attention: The three embedding vectors are structured as a sequence: [proportion_embedding, time_embedding, bulk_embedding]. This sequence is fed into a Transformer encoder with 3 layers and 4 attention heads. The self-attention mechanism dynamically computes importance weights between sequence elements, allowing for deep modeling of the complex dependencies between the different inputs.
- Output: The first token’s output from the Transformer, corresponding to the original proportion vector, is taken and projected back to the target dimension via a linear layer to predict the noise.
2.4. Existing Methods and Fair Comparison Protocol
- ADAPTS: A method based on robust linear regression [4].
- CPM: A popular method based on support vector regression [5].
- MuSiC: A weighted non-negative least squares method [6].
- Scaden: A deep-neural-network-based method for single-cell deconvolution that uses artificial training data to learn tissue composition.
2.5. Model Training and Evaluation
- Root Mean Square Error (RMSE): Measures the difference between predicted and true cell proportions. Lower values indicate higher accuracy [22].
2.6. Ethics Statement
3. Results
3.1. DiffFormer Demonstrates Consistent Superiority Across Datasets
3.2. Performance on the pbmc3k Dataset
3.3. Robustness Verification on the pbmc68k Dataset
3.4. Generalization Ability Validation on Liver and Pancreas Datasets
3.5. Validation on a Real-World Gold-Standard Dataset (GSE107011)
3.6. Statistical Significance Analysis
3.7. Detailed Analysis of Marker Genes and Biological Interpretation
4. Discussion
4.1. The Synergy of Architecture, Paradigm, and Framework in DiffFormer’s Success
4.2. Enabling New Avenues in Biomedical Research with High-Precision Deconvolution
4.3. Limitations and Future Directions
5. Conclusions
Author Contributions
Funding
Institutional Review Board Statement
Informed Consent Statement
Data Availability Statement
Acknowledgments
Conflicts of Interest
Appendix A
References
- Svensson, V.; Vento-Tormo, R.; Teichmann, S.A. Exponential Scaling of Single-Cell RNA-Seq in the Past Decade. Nat. Protoc. 2018, 13, 599–604. [Google Scholar] [CrossRef]
- Elosua-Bayes, M.; Nieto, P.; Mereu, E.; Gut, I.; Heyn, H. SPOTlight: Seeded NMF Regression to Deconvolute Spatial Transcriptomics Spots with Single-Cell Transcriptomes. Nucleic Acids Res. 2021, 49, e50. [Google Scholar] [CrossRef] [PubMed]
- Newman, A.M.; Liu, C.L.; Green, M.R.; Gentles, A.J.; Feng, W.; Xu, Y.; Hoang, C.D.; Diehn, M.; Alizadeh, A.A. Robust Enumeration of Cell Subsets from Tissue Expression Profiles. Nat. Methods 2015, 12, 453–457. [Google Scholar] [CrossRef] [PubMed]
- Danziger, S.A.; Gibbs, D.L.; Shmulevich, I.; McConnell, M.; Trotter, M.W.B.; Schmitz, F.; Reiss, D.J.; Ratushny, A.V. AdApTS: Automated Deconvolution Augmentation of Profiles for Tissue Specific Cells. PLoS ONE 2019, 14, e0224693. [Google Scholar] [CrossRef] [PubMed]
- Frishberg, A.; Peshes-Yaloz, N.; Cohn, O.; Rosentul, D.; Steuerman, Y.; Valadarsky, L.; Yankovitz, G.; Mandelboim, M.; Iraqi, F.A.; Amit, I.; et al. Cell Composition Analysis of Bulk Genomics Using Single-Cell Data. Nat. Methods 2019, 16, 327–332. [Google Scholar] [CrossRef]
- Wang, X.; Park, J.; Susztak, K.; Zhang, N.R.; Li, M. Bulk Tissue Cell Type Deconvolution with Multi-Subject Single-Cell Expression Reference. Nat. Commun. 2019, 10, 380. [Google Scholar] [CrossRef]
- Avila Cobos, F.; Alquicira-Hernandez, J.; Powell, J.E.; Mestdagh, P.; De Preter, K. Benchmarking of Cell Type Deconvolution Pipelines for Transcriptomics Data. Nat. Commun. 2020, 11, 5650. [Google Scholar] [CrossRef]
- Kleshchevnikov, V.; Shmatko, A.; Dann, E.; Aivazidis, A.; King, H.W.; Li, T.; Elmentaite, R.; Lomakin, A.; Kedlian, V.; Gayoso, A.; et al. Cell2location Maps Fine-Grained Cell Types in Spatial Transcriptomics. Nat. Biotechnol. 2022, 40, 661–671. [Google Scholar] [CrossRef]
- Gong, K.; Johnson, K.; El Fakhri, G.; Li, Q.; Pan, T. PET Image Denoising Based on Denoising Diffusion Probabilistic Model. Eur. J. Nucl. Med. Mol. Imaging 2024, 51, 358–368. [Google Scholar] [CrossRef]
- Vaswani, A.; Shazeer, N.; Parmar, N.; Uszkoreit, J.; Jones, L.; Gomez, A.N.; Kaiser, Ł.; Polosukhin, I. Attention Is All You Need. In Proceedings of the Advances in Neural Information Processing Systems, Long Beach, CA, USA, 4–9 December 2017; Volume 2017. [Google Scholar]
- Yamada, K.; Hamada, M. Prediction of RNA-Protein Interactions Using a Nucleotide Language Model. Bioinform. Adv. 2022, 2, vbac023. [Google Scholar] [CrossRef]
- Song, Y.; Zheng, S.; Li, L.; Zhang, X.; Zhang, X.; Huang, Z.; Chen, J.; Wang, R.; Zhao, H.; Chong, Y.; et al. Deep Learning Enables Accurate Diagnosis of Novel Coronavirus (COVID-19) with CT Images. IEEE/ACM Trans. Comput. Biol. Bioinform. 2021, 18, 2775–2780. [Google Scholar] [CrossRef]
- Camp, J.G.; Sekine, K.; Gerber, T.; Loeffler-Wirth, H.; Binder, H.; Gac, M.; Kanton, S.; Kageyama, J.; Damm, G.; Seehofer, D.; et al. Multilineage Communication Regulates Human Liver Bud Development from Pluripotency. Nature 2017, 546, 533–538. [Google Scholar] [CrossRef]
- Muraro, M.J.; Dharmadhikari, G.; Grün, D.; Groen, N.; Dielen, T.; Jansen, E.; van Gurp, L.; Engelse, M.A.; Carlotti, F.; de Koning, E.J.P.; et al. A Single-Cell Transcriptome Atlas of the Human Pancreas. Cell Syst. 2016, 3, 385–394.e3. [Google Scholar] [CrossRef] [PubMed]
- Villani, A.C.; Satija, R.; Reynolds, G.; Sarkizova, S.; Shekhar, K.; Fletcher, J.; Griesbeck, M.; Butler, A.; Zheng, S.; Lazo, S.; et al. Single-Cell RNA-Seq Reveals New Types of Human Blood Dendritic Cells, Monocytes, and Progenitors. Science 2017, 356, eaah4573. [Google Scholar] [CrossRef] [PubMed]
- Amezquita, R.A.; Lun, A.T.L.; Becht, E.; Carey, V.J.; Carpp, L.N.; Geistlinger, L.; Marini, F.; Rue-Albrecht, K.; Risso, D.; Soneson, C.; et al. Orchestrating Single-Cell Analysis with Bioconductor. Nat. Methods 2020, 17, 137–145. [Google Scholar] [CrossRef] [PubMed]
- Freytag, S.; Tian, L.; Lönnstedt, I.; Ng, M.; Bahlo, M. Comparison of Clustering Tools in R for Medium-Sized 10x Genomics Single-Cell RNA-Sequencing Data. F1000Res 2018, 7, 1297. [Google Scholar] [CrossRef]
- Dietrich, A.; Sturm, G.; Merotto, L.; Marini, F.; Finotello, F.; List, M. SimBu: Bias-Aware Simulation of Bulk RNA-Seq Data with Variable Cell-Type Composition. Bioinformatics 2022, 38, ii141–ii147. [Google Scholar] [CrossRef]
- Ho, J.; Jain, A.; Abbeel, P. Denoising Diffusion Probabilistic Models. In Proceedings of the Advances in Neural Information Processing Systems, Virtual, 6–12 December 2020; Volume 2020. [Google Scholar]
- Loshchilov, I.; Hutter, F. Decoupled Weight Decay Regularization. In Proceedings of the 7th International Conference on Learning Representations, ICLR 2019, New Orleans, LA, USA, 6–9 May 2019. [Google Scholar]
- Pullin, J.M.; McCarthy, D.J. A Comparison of Marker Gene Selection Methods for Single-Cell RNA Sequencing Data. Genome Biol. 2024, 25, 56. [Google Scholar] [CrossRef]
- Chai, T.; Draxler, R.R. Root Mean Square Error (RMSE) or Mean Absolute Error (MAE)?—Arguments against Avoiding RMSE in the Literature. Geosci. Model Dev. 2014, 7, 1247–1250. [Google Scholar] [CrossRef]
- Hauke, J.; Kossowski, T. Comparison of Values of Pearson’s and Spearman’s Correlation Coefficients on the Same Sets of Data. Quaest. Geogr. 2011, 30, 87–93. [Google Scholar] [CrossRef]
- Schober, P.; Schwarte, L.A. Correlation Coefficients: Appropriate Use and Interpretation. Anesth. Analg. 2018, 126, 1763–1768. [Google Scholar] [CrossRef]
- Hanahan, D.; Weinberg, R.A. Hallmarks of Cancer: The next Generation. Cell 2011, 144, 646–674. [Google Scholar] [CrossRef]
- Song, Y.; Sohl-Dickstein, J.; Kingma, D.P.; Kumar, A.; Ermon, S.; Poole, B. Score-Based Generative Modeling Through Stochastic Differential Equations. In Proceedings of the ICLR 2021-9th International Conference on Learning Representations, Virtual Event, 3–7 May 2021. [Google Scholar]
- Tumeh, P.C.; Harview, C.L.; Yearley, J.H.; Shintaku, I.P.; Taylor, E.J.M.; Robert, L.; Chmielowski, B.; Spasic, M.; Henry, G.; Ciobanu, V.; et al. PD-1 Blockade Induces Responses by Inhibiting Adaptive Immune Resistance. Nature 2014, 515, 568–571. [Google Scholar] [CrossRef] [PubMed]
- Yang, M.; Yang, Y.; Xie, C.; Ni, M.; Liu, J.; Yang, H.; Mu, F.; Wang, J. Contrastive Learning Enables Rapid Mapping to Multimodal Single-Cell Atlas of Multimillion Scale. Nat. Mach. Intell. 2022, 4, 696–709. [Google Scholar] [CrossRef]
- Luecken, M.D.; Theis, F.J. Current Best Practices in Single-cell RNA-seq Analysis: A Tutorial. Mol. Syst. Biol. 2019, 15, e8746. [Google Scholar] [CrossRef] [PubMed]
- Crowell, H.L.; Morillo Leonardo, S.X.; Soneson, C.; Robinson, M.D. The Shaky Foundations of Simulating Single-Cell RNA Sequencing Data. Genome Biol. 2023, 24, 62. [Google Scholar] [CrossRef]
- Tay, Y.; Dehghani, M.; Bahri, D.; Metzler, D. Efficient Transformers: A Survey. ACM Comput. Surv. 2023, 55, 1–28. [Google Scholar] [CrossRef]
- Nichol, A.; Dhariwal, P. Improved Denoising Diffusion Probabilistic Models. In Proceedings of the Machine Learning Research, Virtual, 13 December 2021; Volume 139. [Google Scholar]
- Premkumar, R.; Srinivasan, A.; Harini Devi, K.G.; M, D.; E, G.; Jadhav, P.; Futane, A.; Narayanamurthy, V. Single-Cell Classification, Analysis, and Its Application Using Deep Learning Techniques. BioSystems 2024, 237, 105142. [Google Scholar] [CrossRef]
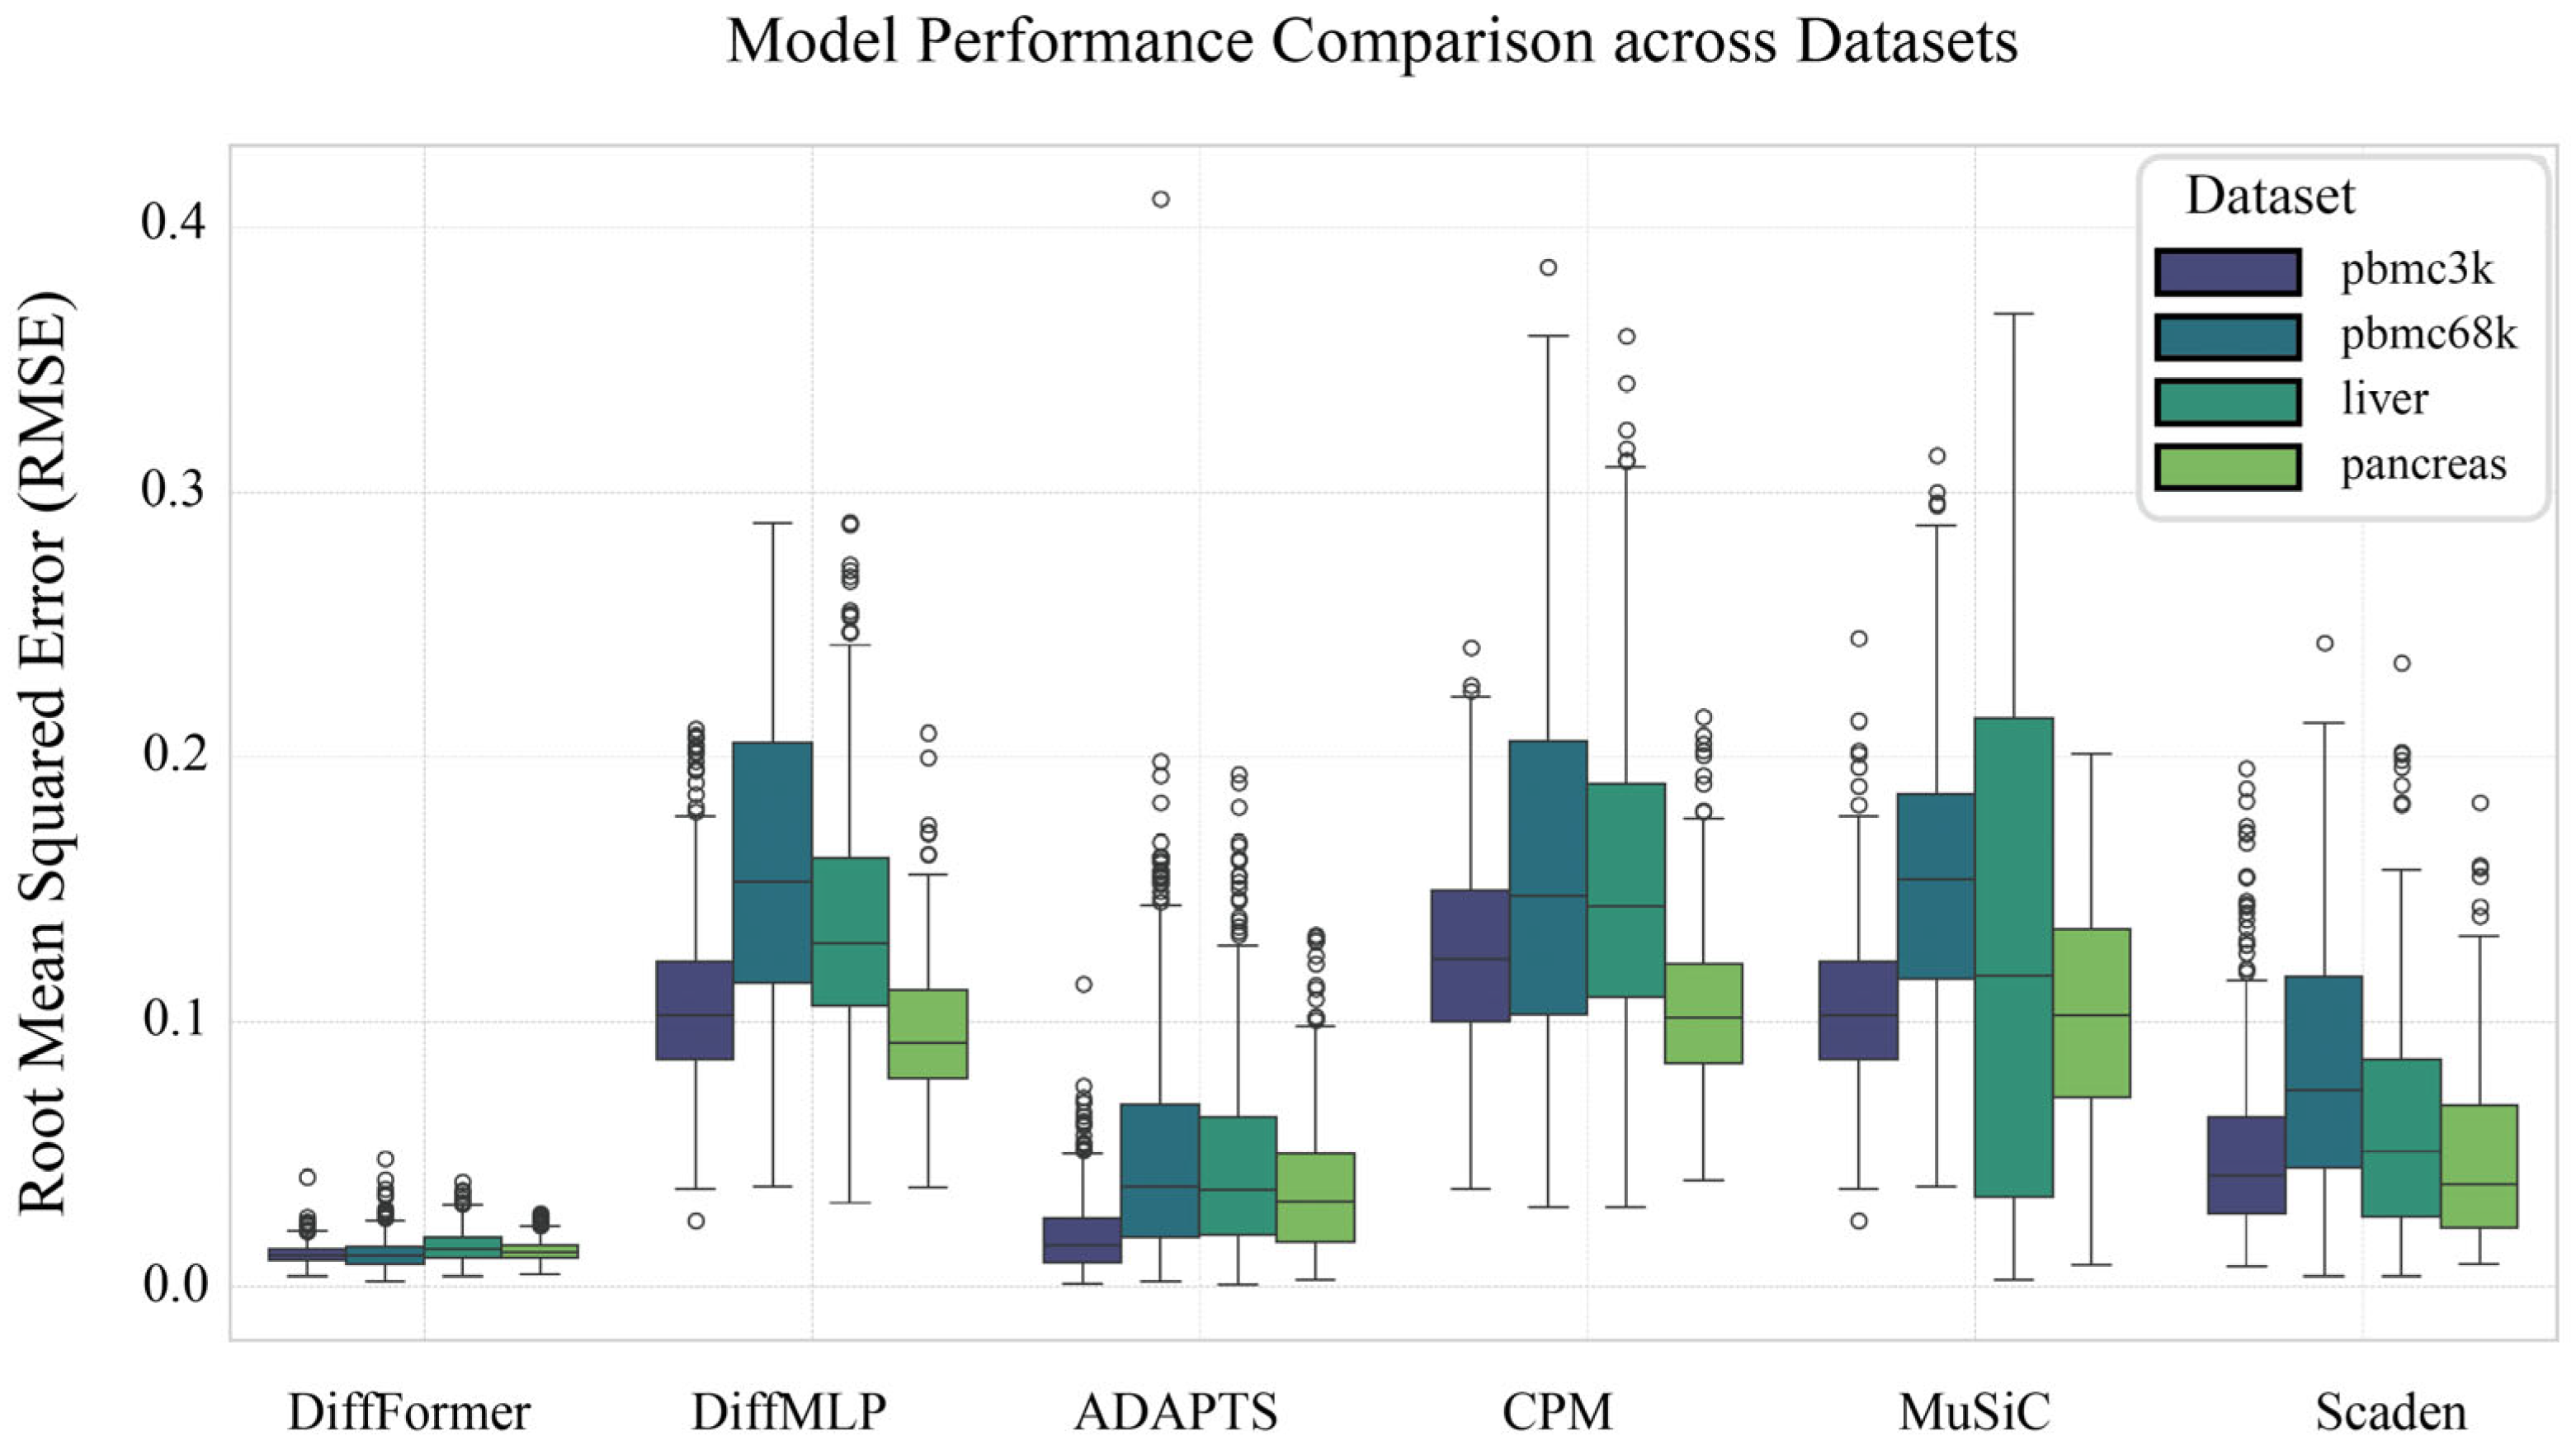
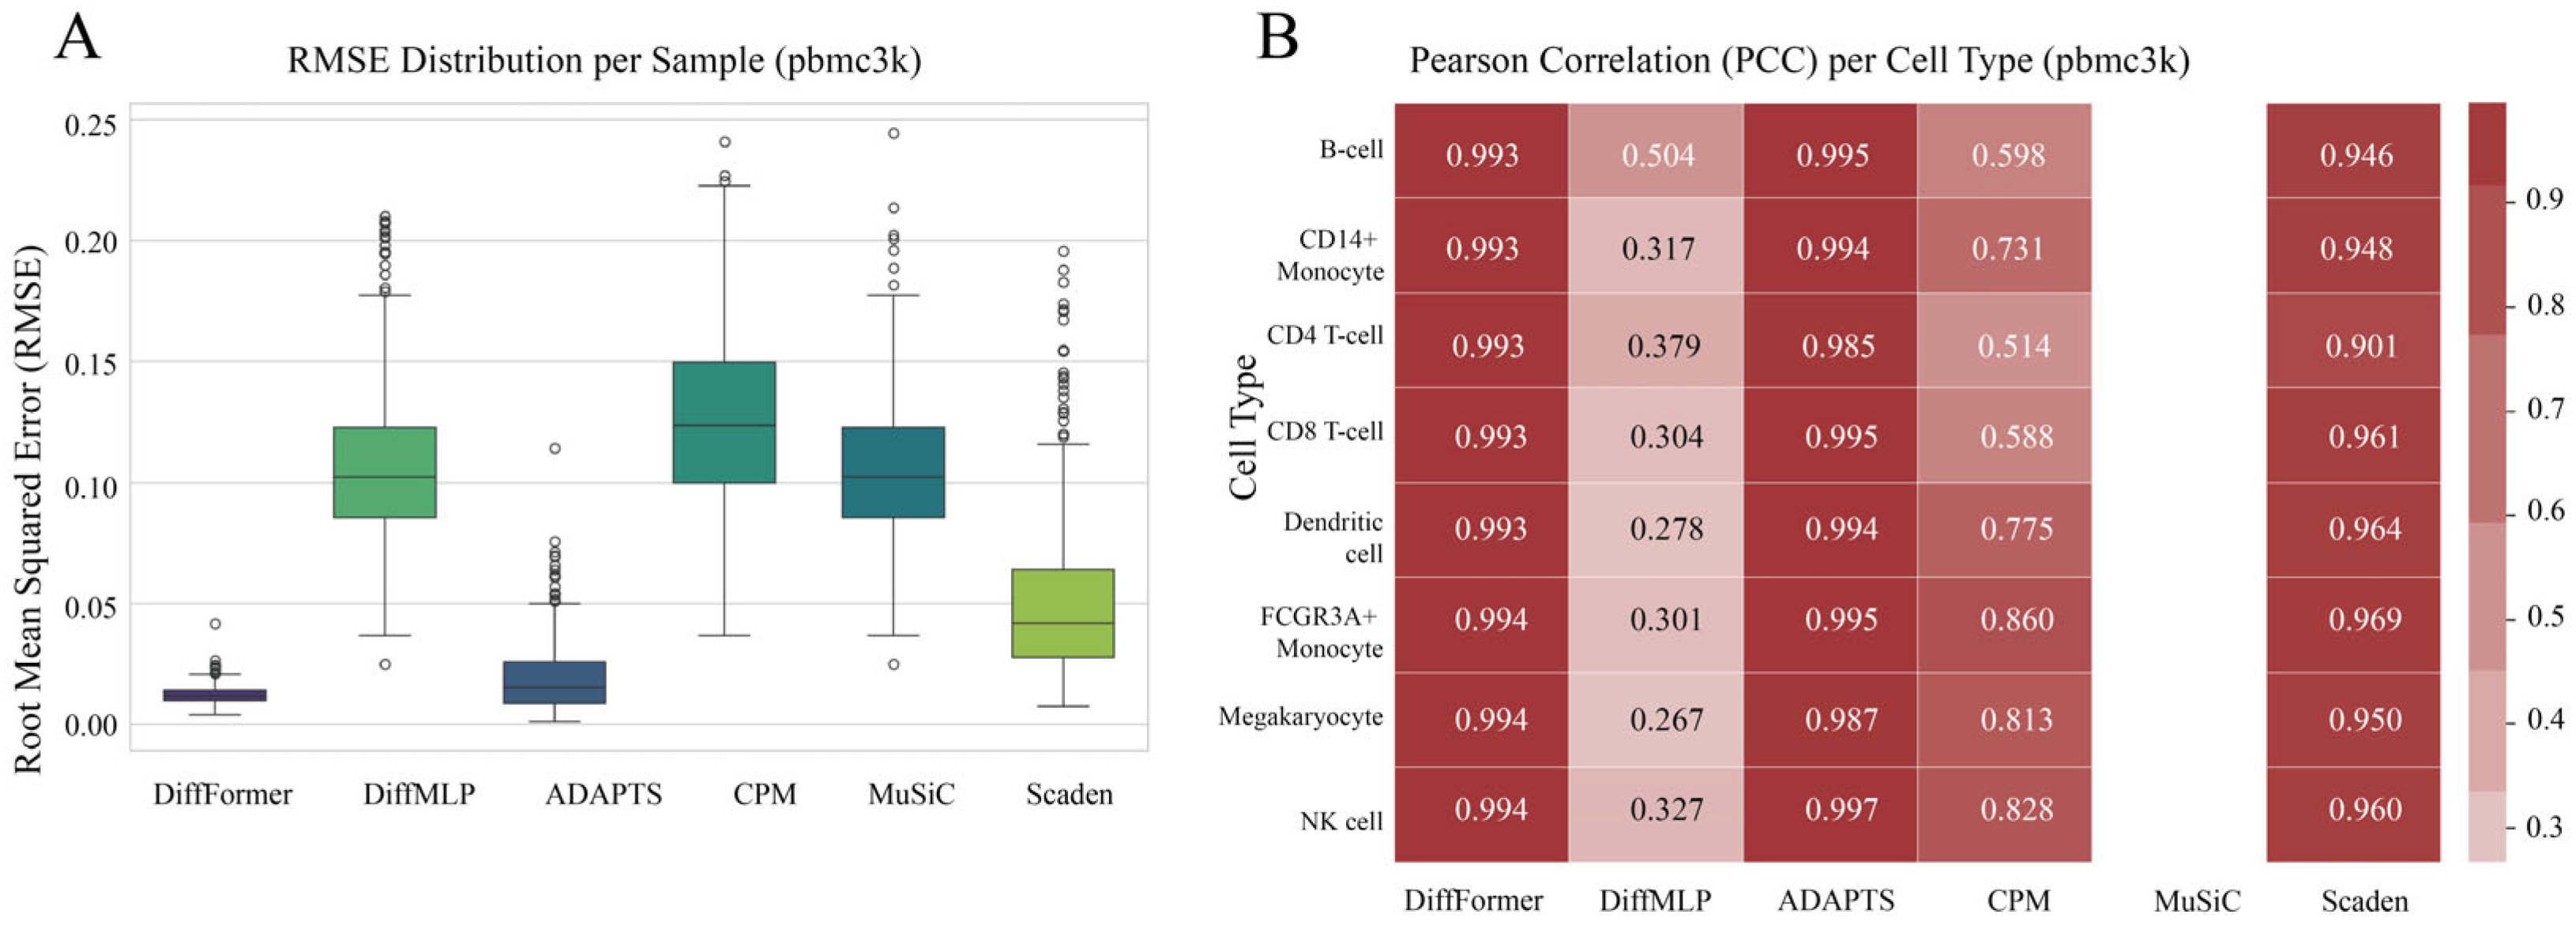
| Model | pbmc3k | pbmc68k | Liver | Pancreas |
|---|---|---|---|---|
| DiffFormer | 0.0120 | 0.0124 | 0.0149 | 0.0131 |
| DiffMLP | 0.1060 | 0.1594 | 0.1373 | 0.0953 |
| ADAPTS | 0.0188 | 0.0500 | 0.0463 | 0.0358 |
| CPM | 0.1259 | 0.1580 | 0.1532 | 0.1046 |
| MuSiC | 0.1054 | 0.1531 | 0.1276 | 0.1023 |
| Scaden | 0.0501 | 0.0818 | 0.0599 | 0.0481 |
| Model | Overall PCC | Overall RMSE | Notes on Stability |
|---|---|---|---|
| DiffFormer | 0.5746 | 0.1752 | Stable across all cell types |
| ADAPTS | 0.4615 | 0.2029 | Stable across all cell types |
| CPM | 0.3356 | 0.1207 | Failed on “Th17” (PCC = nan) |
| DiffMLP | −0.2217 | 0.2092 | Failed on “Th1” (PCC = nan) |
| MuSiC | −0.0508 | 0.2274 | Failed on “Th1/Th17”, “Th17” (PCC = nan) |
| Scaden | −0.1059 | 0.1944 | Failed on multiple cell types(PCC = nan) |
| Dataset | Sample Size | Comparison | p-Value | Cohen’s d |
|---|---|---|---|---|
| GSE107011 | n = 12 | DiffFormer vs. ADAPTS | p = 1.2 × 10⁻⁴ | d = 1.34 |
| GSE107011 | n = 12 | DiffFormer vs. CPM | p = 2.8 × 10⁻⁵ | d = 1.67 |
| GSE107011 | n = 12 | DiffFormer vs. MuSiC | p = 5.1 × 10⁻⁶ | d = 2.01 |
| GSE107011 | n = 12 | DiffFormer vs. Scaden | p = 3.7 × 10⁻⁵ | d = 1.58 |
| GSE107011 | n = 12 | DiffFormer vs. DiffMLP | p = 8.9 × 10⁻⁷ | d = 2.43 |
| PBMC3k | n = 500 | All pairwise comparisons | p < 1 × 10⁻¹⁰ | d > 1.2 |
| PBMC68k/Liver/Pancreas | n = 500 each | All pairwise comparisons | p < 1 × 10⁻¹⁰ | d > 1.0 |
Disclaimer/Publisher’s Note: The statements, opinions and data contained in all publications are solely those of the individual author(s) and contributor(s) and not of MDPI and/or the editor(s). MDPI and/or the editor(s) disclaim responsibility for any injury to people or property resulting from any ideas, methods, instructions or products referred to in the content. |
© 2025 by the authors. Licensee MDPI, Basel, Switzerland. This article is an open access article distributed under the terms and conditions of the Creative Commons Attribution (CC BY) license (https://creativecommons.org/licenses/by/4.0/).
Share and Cite
Liu, Y.; Sun, J.; Li, H.; Zhang, W.; Sheng, J.; Wang, G.; Wu, J. A Transformer-Based Deep Diffusion Model for Bulk RNA-Seq Deconvolution. Biology 2025, 14, 1150. https://doi.org/10.3390/biology14091150
Liu Y, Sun J, Li H, Zhang W, Sheng J, Wang G, Wu J. A Transformer-Based Deep Diffusion Model for Bulk RNA-Seq Deconvolution. Biology. 2025; 14(9):1150. https://doi.org/10.3390/biology14091150
Chicago/Turabian StyleLiu, Yunqing, Jinlei Sun, Huanli Li, Wenfei Zhang, Jinying Sheng, Guoqiang Wang, and Jianwei Wu. 2025. "A Transformer-Based Deep Diffusion Model for Bulk RNA-Seq Deconvolution" Biology 14, no. 9: 1150. https://doi.org/10.3390/biology14091150
APA StyleLiu, Y., Sun, J., Li, H., Zhang, W., Sheng, J., Wang, G., & Wu, J. (2025). A Transformer-Based Deep Diffusion Model for Bulk RNA-Seq Deconvolution. Biology, 14(9), 1150. https://doi.org/10.3390/biology14091150


