Article

Effects of Interspecific Competition on Habitat Shifts of Sardinops melanostictus (Temminck et Schlegel, 1846) and Scomber japonicus (Houttuyn, 1782) in the Northwest Pacific

1
Key Laboratory of Oceanic and Polar Fisheries, Ministry of Agriculture and Rural Affairs, P.R. China, East China Sea Fisheries Research Institute, Chinese Academy of Fishery Sciences, Shanghai 200090, China
2
College of Marine Living Resource Sciences and Management, Shanghai Ocean University, Shanghai 201306, China
3
College of Navigation and Ship Engineering, Dalian Ocean University, Dalian 116023, China
*
Author to whom correspondence should be addressed.
These authors contributed equally to this work.
Biology 2025, 14(8), 968; https://doi.org/10.3390/biology14080968 (registering DOI)
Submission received: 5 June 2025 / Revised: 18 July 2025 / Accepted: 21 July 2025 / Published: 1 August 2025
(This article belongs to the Special Issue Adaptation of Living Species to Environmental Stress)

Simple Summary

Japanese sardine (Sardinops melanostictus) and Chub mackerel (Scomber japonicus) in the Northwest Pacific have important biological interactions. This study uses 2017–2020 fisheries data and environmental parameters to build interspecific competition species distribution model (icSDM). Validation with 2021 data demonstrates that icSDM exhibit greater explanatory power compared to single-species suitable habitat model (ssSDM). Interspecific competition influences the habitat dynamics of the two species, enhancing the correlation in habitat changes, particularly in June, July, and October. There are stage-specific differences, with August and November showing the most. Competition benefits S. japonicus’ optimal habitat expansion more than S. melanostictus’, likely due to migratory and predatory differences.

Abstract

As economically important sympatric species in the Northwest Pacific, the Japanese sardine (Sardinops melanostictus) and Chub mackerel (Scomber japonicus) exhibit significant biological interactions. Understanding the impact of interspecies competition on their habitat dynamics can provide crucial insights for the sustainable development and management of these interconnected species resources. This study utilizes fisheries data of S. melanostictus and S. japonicus from the Northwest Pacific, collected from June to November between 2017 and 2020. We integrated various environmental parameters, including temperature at different depths (0, 50, 100, 150, and 200 m), eddy kinetic energy (EKE), sea surface height (SSH), chlorophyll-a concentration (Chl-a), and the oceanic Niño index (ONI), to construct interspecific competition species distribution model (icSDM) for both species. We validated these models by overlaying the predicted habitats with fisheries data from 2021 and performing cross-validation to assess the models’ reliability. Furthermore, we conducted correlation analyses of the habitats of these two species to evaluate the impact of interspecies relationships on their habitat dynamics. The results indicate that, compared to single-species habitat models, the interspecific competition species distribution model (icSDM) for these two species exhibit a significantly higher explanatory power, with R2 values increasing by up to 0.29; interspecific competition significantly influences the habitat dynamics of S. melanostictus and S. japonicus, strengthening the correlation between their habitat changes. This relationship exhibits a positive correlation at specific stages, with the highest correlations observed in June, July, and October, at 0.81, 0.80, and 0.88, respectively; interspecific competition also demonstrates stage-specific differences in its impact on the habitat dynamics of S. melanostictus and S. japonicus, with the most pronounced differences occurring in August and November. Compared to S. melanostictus, interspecific competition is more beneficial for the expansion of the optimal habitat (HIS ≥ 0.6) for S. japonicus and, to some extent, inhibits the habitat expansion of S. melanostictus. The variation in migratory routes and predatory interactions (with larger individuals of S. japonicus preying on smaller individuals of S. melanostictus) likely constitutes the primary factors contributing to these observed differences.

1. Introduction

Climate and environmental changes have altered the original distribution of marine species, resulting in the displacement of their suitable habitats as environmental conditions change [1]. In the northwestern Pacific, mesopelagic and epipelagic fish species exhibit substantial similarity in prey composition, along with interspecific biological interactions, which lead to a high degree of overlap and interlacing in the distribution of their optimal habitats [2]. Japanese sardine (S. melanostictus) and Chub mackerel (S. japonicus) are two major economic fish species in the Northwest Pacific, with highly similar habitat distributions. Moreover, environmental changes lead to significant shifts in their habitats. Research has found that the fishing grounds of S. melanostictus and S. japonicus, along with their Habitat Suitability Index (HSI), shift in response to environmental fluctuations. Seasonal distribution shifts were consistent, with northeastward movements in spring and autumn, and southwestward shifts in autumn and winter [3,4]. Additionally, according to statistical data from the North Pacific Fisheries Commission (NPFC), over the past decade, both S. melanostictus and S. japonicus have ranked among the top catches in the Northwest Pacific. Their annual production shows alternating trends. In 2018, for the first time in nearly 20 years, the annual production of Japanese sardine exceeded that of Chub mackerel, and this gap continues to widen [5]. The variability in small-scale environmental factors is the direct cause of annual differences in fishing grounds and habitats. Meanwhile, the large-scale climate fluctuations constitute the underlying factors responsible for the significant decadal-scale alternations in the resources of these two fish species [6,7]. Therefore, understanding the patterns of habitat suitability changes and the dynamic variations in habitat distribution of both species is crucial for the sustainable utilization and management of fisheries resources.
Currently, there has been extensive research on the suitable habitat distributions of S. melanostictus and S. japonicus in the Northwest Pacific [8,9,10]. Most studies have utilized Species Distribution Models (SDM) [11] to examine the relationship between environmental variables and species distribution. Since 2019, convolutional neural networks have been employed to identify the distribution of optimal habitat centers for S. japonicus within the primary fishing grounds (39° N–43° N, 149° E–154° E) [12]. A concentration distribution model reveals that S. melanostictus migrates northeast in June and southwest in August [9]. MaxEnt modeling of S. melanostictus and S. japonicus indicates that both species share similar optimal habitats during summer (39° N–42° N), and in autumn S. melanostictus concentrates between 39° N and 44° N, while S. japonicus is found between 40° N and 43° N. Key environmental factors influencing habitat dynamics include sea surface height (SSH), sea surface temperature (SST), and chlorophyll-a (Chl.a) [13]. Additionally, the classification tree model indicates that the habitat range of S. melanostictus is broader in June, expanding from September to November, while the suitable habitat area for S. japonicus decreases over time [12,14]. Previous studies have shown that, during the juvenile stage, S. melanostictus and S. japonicus occupy comparable trophic positions within the food web and exhibit highly similar feeding spectra, primarily composed of copepods and small shrimp species, suggesting a clear food-driven interspecific competition [10,11,12,13,14]. As they mature, S. japonicus, owing to its larger body size, expands its diet to include small fish, thereby reducing the intensity of direct competition with S. melanostictus. However, crustaceans and cephalopods remain the major dietary components for both species, indicating that trophic overlap and food-mediated competitive interactions persist even at the adult stage. Comparing multiple studies reveals a significant correlation in the habitat dynamics between S. melanostictus and S. japonicus. When their distribution positions are close, it promotes suitable habitat conditions for both species. Conversely, when their distribution positions are farther apart, it tends to inhibit the increase in habitat area for S. japonicus [15,16,17,18]. This suggests that the changes in suitable habitats for both species may be influenced by certain underlying non-biological environmental factors, causing the habitats of S. melanostictus or S. japonicus to change in response to changes in the habitats of associated species [19].
Many methods within Ecological Niche Modeling (ENM) [3] and Species Distribution Modeling (SDM)—including algorithms such as the Generalized Additive Model (GAM) [20], Habitat Suitability Index (HSI) [21], and Random Forest (RF) [22]—are used to identify the optimal non-biological environmental conditions for individual species. These approaches integrate variations in environmental factors with changes in suitable habitats, enabling the modeling of species’ habitat distributions. Integrating environmental data with fishery data offers a scientifically robust approach to identifying and predicting the optimal habitat distribution of individual species. The Random Forest (RF) method, in particular, provides a reliable and effective means for such habitat suitability modeling. Notably, the prediction performance of the Random Forest model has shown high accuracy, high explanatory power, and a high weight ratio across various fish species (such as S. japonicus [23,24], Thunnus alalunga (Bonnaterre, 1788) [25], etc.) However, modeling based solely on the relationship between non-biological environmental factors and yield lacks comprehensiveness and objectivity for studying habitat changes of associated species (such as S. melanostictus and S. japonicus). This approach overly emphasizes the response of habitat changes to non-biological factors while underestimating the dynamic correlation of biological interactions between the species [13,26], such as the impact of interspecies competition and predation relationships on habitat changes. In addition, a comprehensive analysis of 688 published studies revealed significant variability in the impacts of global change drivers on interactions among any type of organisms, both in terms of the magnitude of changes and the degree of directional shifts [27]. Interactions among organisms can influence species responses to non-biological environmental changes along environmental gradients. Similarly, changes in non-biological environments also affect the nature of biological interactions [28,29]. Therefore, it can be argued that the extent to which climate and environmental changes at different scales affect species habitat distribution is constrained by interactions among species. Ignoring these interactions would reduce the accuracy and comprehensiveness of predictions regarding species habitat distribution [11].
Therefore, leveraging fishery data and marine environmental data, this study employs the Habitat Suitability Index to characterize the biological competition between S. melanostictus and S. japonicus. By integrating medium- and large-scale environmental and climatic factors with competitive interactions between these species and embedding the biological parameters of S. melanostictus and S. japonicus into a Random Forest model, we develop a dynamic interspecific habitat model. This model aims to elucidate the cohabitation habitat dynamics of the species in the Northwest Pacific high seas, assess the correlation of their habitat distributions, and analyze the impact of interspecific competition on the correlation and divergence of their habitat distributions. The results provide a scientific basis for the rational development and management of these two pelagic species population resources.

2. Materials and Methods

2.1. Data Sources

2.1.1. Fisheries Data

The fisheries data in this study were sourced from fishing logs recorded by Chinese commercial light purse seine vessels. The study area mainly covers the range of 34° N–45° N and 144° E–163° E, and the temporal scope of this study spans the primary fishing season between June and November from 2017 to 2021. The date, latitude, longitude, catch (measured in tons), hauls, vessel length, and vessel ID were included in the logbook data, and the location data was grouped by 0.25° × 0.25° spatial extent. The sample sizes for modeling and validation of S. melanostictus and S. japonicus are shown in Table 1.
Each month, 30 individuals of S. melanostictus and S. japonicus were randomly sampled. Fork length and body weight were recorded for each specimen, and stomach content analysis was performed to characterize dietary composition and evaluate interspecific differences in feeding habits and growth patterns across months.

2.1.2. Environmental Data

Previous research has demonstrated that SSH, Chl-a, and SSS exert significant influence on the abundance and spatiotemporal distribution of S. melanostictus and S. japonicus populations [3,4,5]. Given that both species belong to small-to-medium-sized pelagic fish, distributed within the 0–200 m water column [30], different temperature gradients across various water depths (0 m, 50 m, 100 m, 150 m, and 200 m) were selected for analysis. Furthermore, both species are primarily distributed in the convergence zones of the Kuroshio Current and its associated subcurrents, where mesoscale eddies, oceanic fronts, and meanders of the Kuroshio extension can influence the migration of small-to-medium-sized pelagic fish [16]. Therefore, this study supplements environmental factors such as eddy kinetic energy (EKE) and El Niño-Southern Oscillation (ENSO, represented by the oceanic Niño index, ONI). Environmental data processing and map design in this study were conducted using ArcGIS 10.8 and MATLAB R2021b software. The spatial resolution and sources of environmental data are illustrated in Table 2:

2.2. Methods of Analysis

2.2.1. Constructing Single-Species Suitable Habitat Models (Single-Species SDM, ssSDM)

The HSI is employed to quantitatively characterize the suitability of growth conditions within a species’ distribution range. It enables a quantitative evaluation of the extent to which environmental factors affect the species in a specified area [31]. Fishing effort serves as a metric for validating model accuracy, effectively mitigating errors introduced by fishing gear, techniques, and anthropogenic factors [32]. Based on findings from previous research on the distribution of pelagic fish [23,25,33], the RF model stands out as the most effective SDM for fitting species distribution patterns. Optimal RF model performance is achieved with ntree set to 1000 and mtry set to 4. Therefore, this study employs the Random Forest model to construct single-species habitats for S. melanostictus and S. japonicus, with fishing effort used as a metric to validate the effectiveness of the model construction. The environmental data of S. melanostictus and S. japonicus in the Northwest Pacific from June to November 2017–2020 were matched with corresponding fishing data at specific sites. These matched fishery–environmental datasets were then inputted into a Random Forest model with ntree = 1000 and mtry = 4 to optimize the weighting of various environmental factors. Subsequently, optimal habitats, denoted as HSIss for S. melanostictus and HSIsj for S. japonicus, were constructed based on the model outputs. The procedural details are depicted in Figure 1.

2.2.2. Construction of the Interspecific Competition Species Distribution Model (icSDM)

Biological interactions can variably influence species responses to non-biological environmental changes along environmental gradients, thereby impacting species habitat dynamics [11,28,29]. Therefore, this study utilized environmental data from June to November during the years 2017 to 2020 in the Northwest Pacific region (145° E–163° E, 34° N–45° N) to input into the optimal models HSIss and HSIsj. These models were used to estimate the habitat suitability indices for S. melanostictus and S. japonicus across the entire study area, referred to as HSIss of regional and HSIsj of regional, respectively. These suitability indices were subsequently incorporated as biotic factors into the habitat suitability models for both species, enabling the construction of an interspecific relationship habitat model. This model was then employed to predict the suitable habitats for S. melanostictus and S. japonicus for the period from June to November 2021, referred to as HSIss of interspecific competition and HSIsj of interspecific competition, respectively. Incorporating the effort data of S. melanostictus and S. japonicus from June to November 2021 with the predicted suitable habitats derived from the interspecies relationship habitat models, HSIss, HSIsj, HSIss of interspecific competition, and HSIsj of interspecific competition were partitioned into training (80%) and testing (20%) datasets. This partitioning was performed for 100 iterations of leave-one-out cross-validation to assess the reliability of the icSDM for predicting the effectiveness of habitats for S. melanostictus and S. japonicus [23,25,33]. Details of this process are illustrated in Figure 1.

2.2.3. Building on the Framework of Interspecific Competition, the Temporal Variations in Suitable Habitats for Sardinops melanostictus and S. japonicus Were Analyzed Both on a Monthly and Annual Scale

This study partitioned the HSI, ranging from 0 to 1, for cohabitation of S. melanostictus and S. japonicus during June to November 2021. Based on the species’ suitability, the indices were classified into five intervals: 0 ≤ HIS < 0.2, 0.2 ≤ HSI < 0.4, 0.4 ≤ HSI < 0.6, 0.6 ≤ HSI < 0.8, and 0.8 ≤ HSI ≤ 1. Areas where HSI ≥ 0.6 were identified as the optimal habitats for both species [34,35]. Distribution maps of potential habitats for S. melanostictus and S. japonicus during June to November 2021, as well as for the period spanning 2017 to 2021, were generated using MATLAB software [7].

3. Results

3.1. Development of the icSDM for S. melanostictus and S. japonicus

Validation of the icSDM model developed in Section 2.2.2 was conducted using fisheries data of S. melanostictus and S. japonicus from June to November 2021. The resulting habitat distributions for both species are illustrated in Figure 2. The results showed that from June to November, areas with moderate fishing effort (20 day ≤ Effort < 40 days) for S. melanostictus and S. japonicus were predominantly concentrated in regions where HSI ≥ 0.6. Locations with the highest fishing effort (Effort ≥ 40 days) were generally in areas with the maximum HSI values. For S. melanostictus, 84% of the total fishing effort was in optimal habitats (HSI ≥ 0.6), while for S. japonicus, 78% of the total fishing effort was in these optimal habitats. Overall, the yield and fishing effort for S. melanostictus and S. japonicus were proportional to the HSI values across different HSI intervals. Thus, the icSDM models developed in this study for S. melanostictus and S. japonicus demonstrate a high capacity for accurately assessing and predicting their habitat conditions.

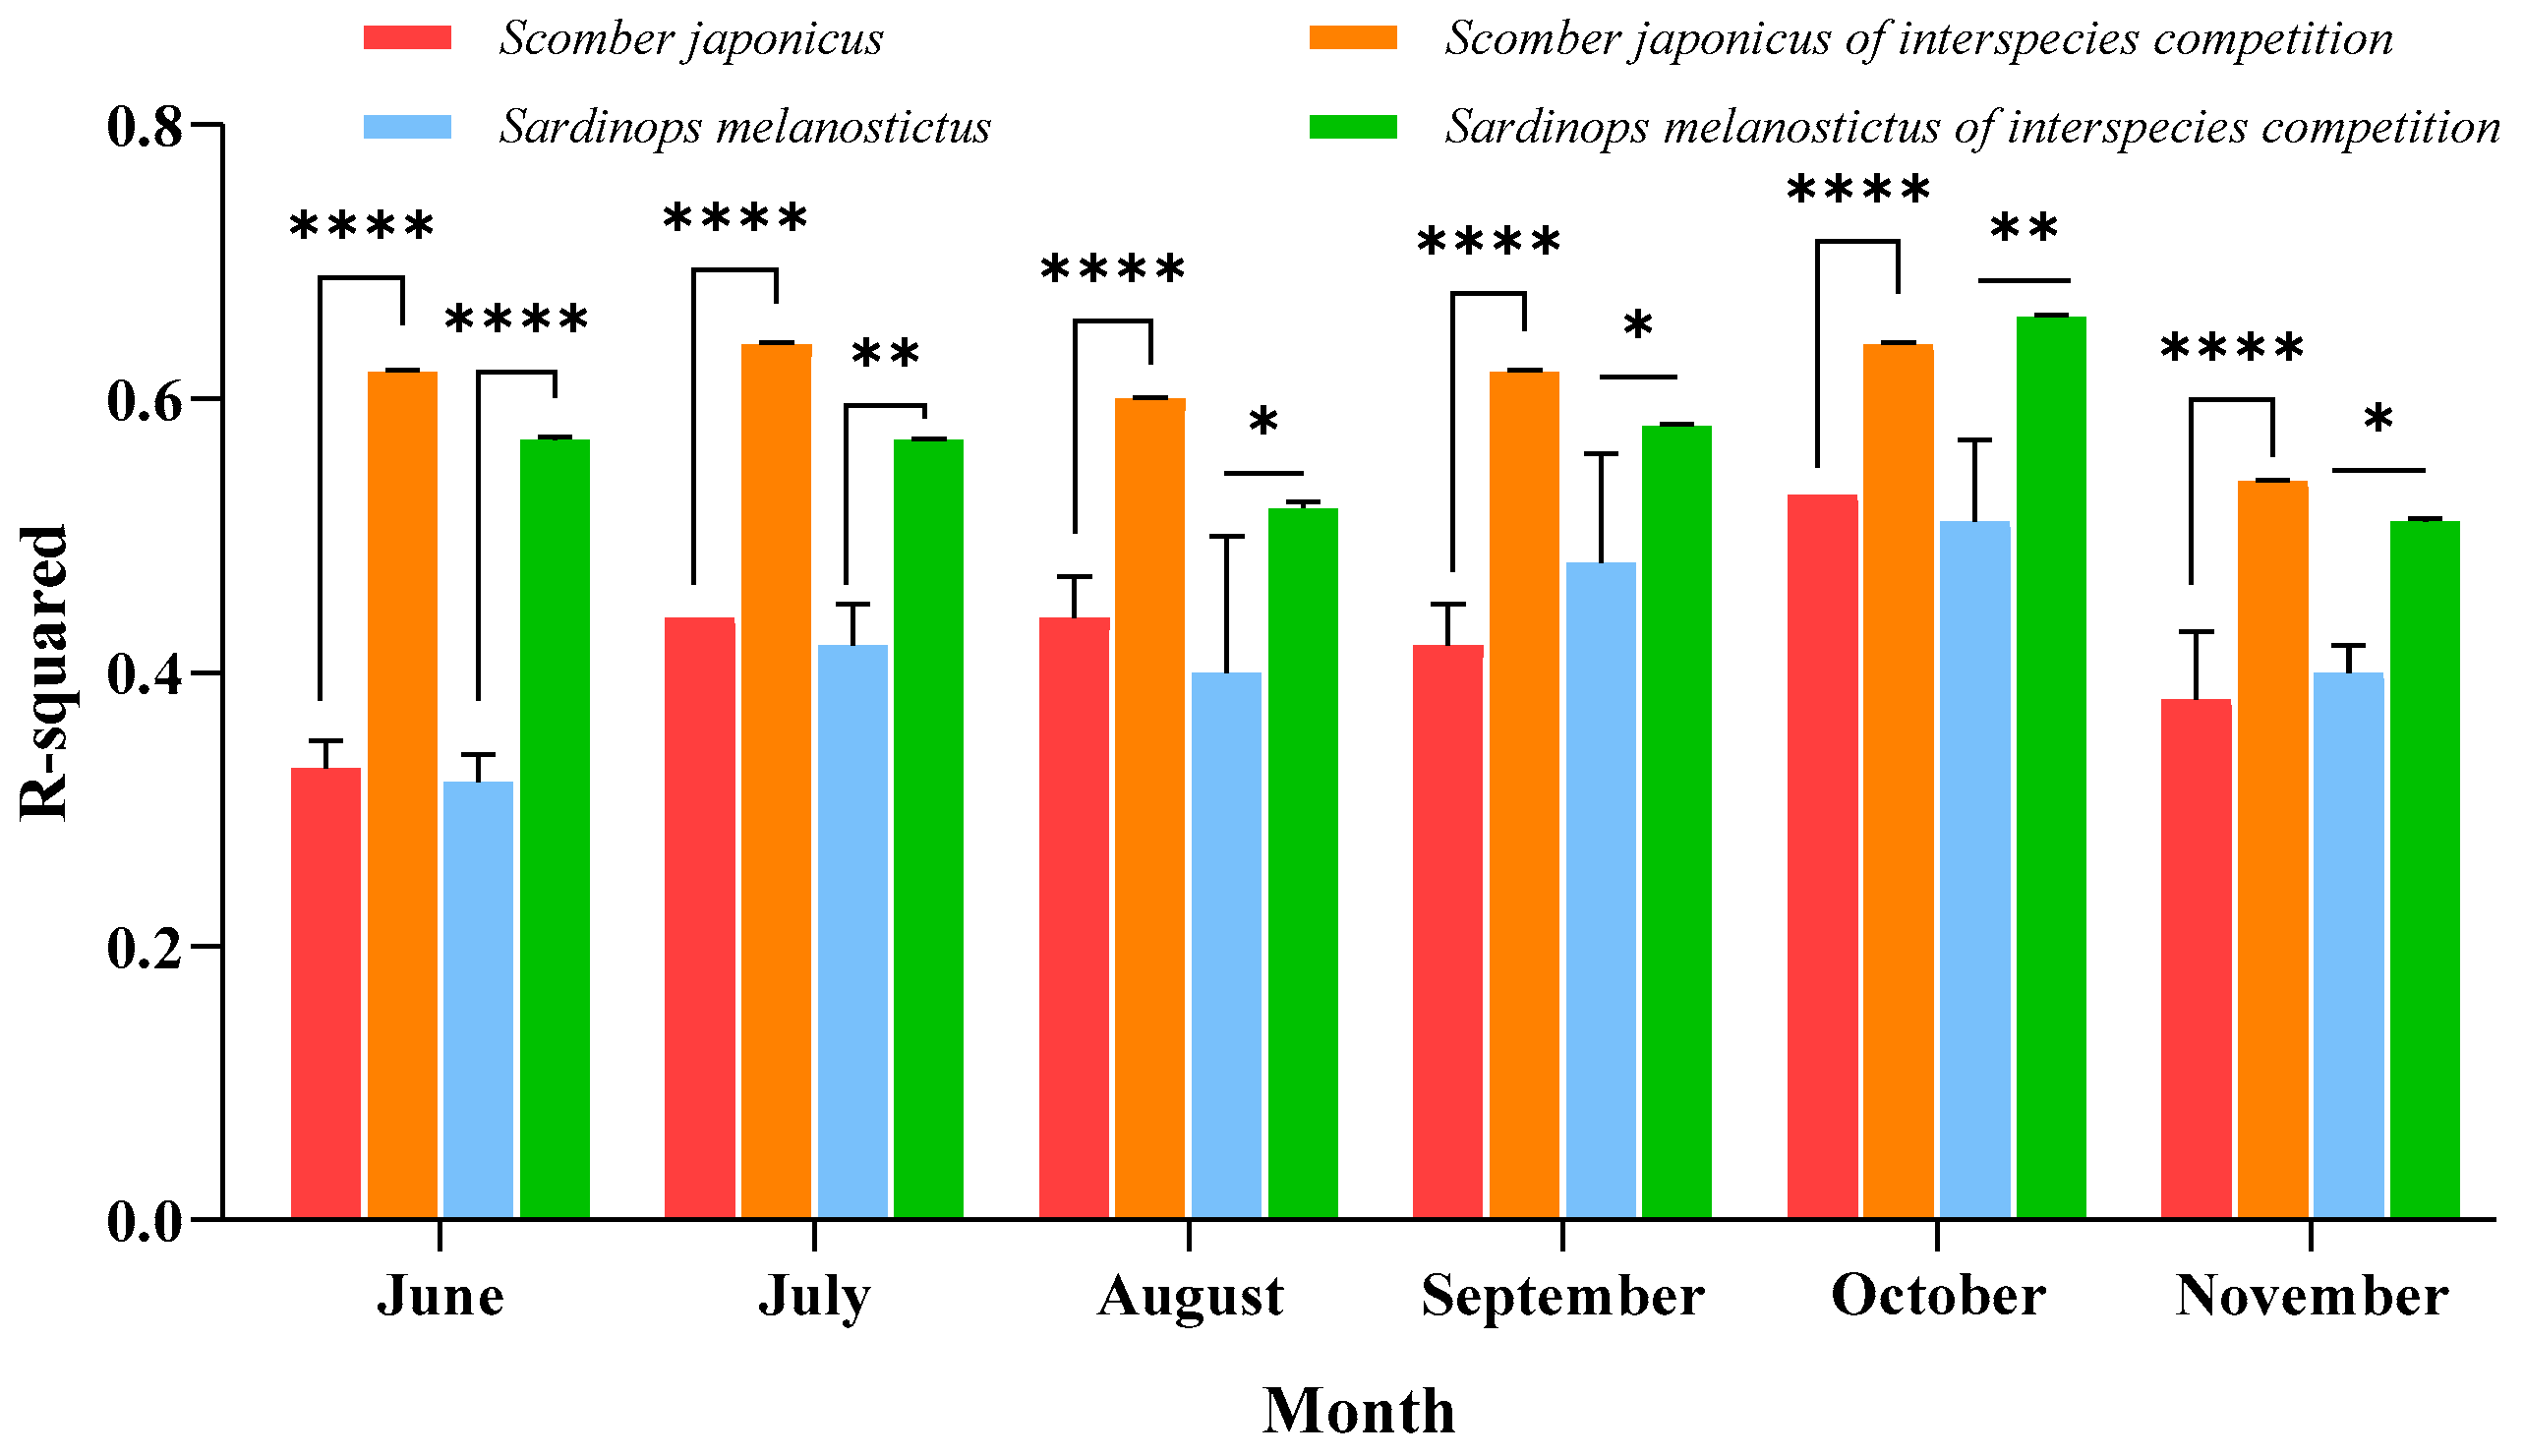
3.2. Validation of the Impact of Interspecific Competition on the Habitat Distribution of Both Species

Cross-validation of the interspecific competition habitat dynamic model (interspecific competition SDM, icSDM) was conducted and compared with the single-species SDM (ssSDM) models for S. melanostictus and S. japonicus. The results, presented in Figure 3, revealed that incorporating the habitat suitability of a single species (S. melanostictus or S. japonicus) as a biotic indicator to quantify interspecific competition into the habitat distribution model of the associated species (S. melanostictus and S. japonicus) significantly enhances the model’s fitting accuracy for both species. For S. melanostictus, the incorporation of S. japonicus distribution factors enhanced the explanatory power (R2) of the cross-validated models for each month, with increases ranging from 0.09 to 0.26. For S. japonicus, the inclusion of S. melanostictus distribution factors resulted in an improvement in the explanatory power (R2) of the monthly fitted models, with increases ranging from 0.11 to 0.29. In summary, the interspecific competition between S. melanostictus and S. japonicus significantly influences their habitat distribution.

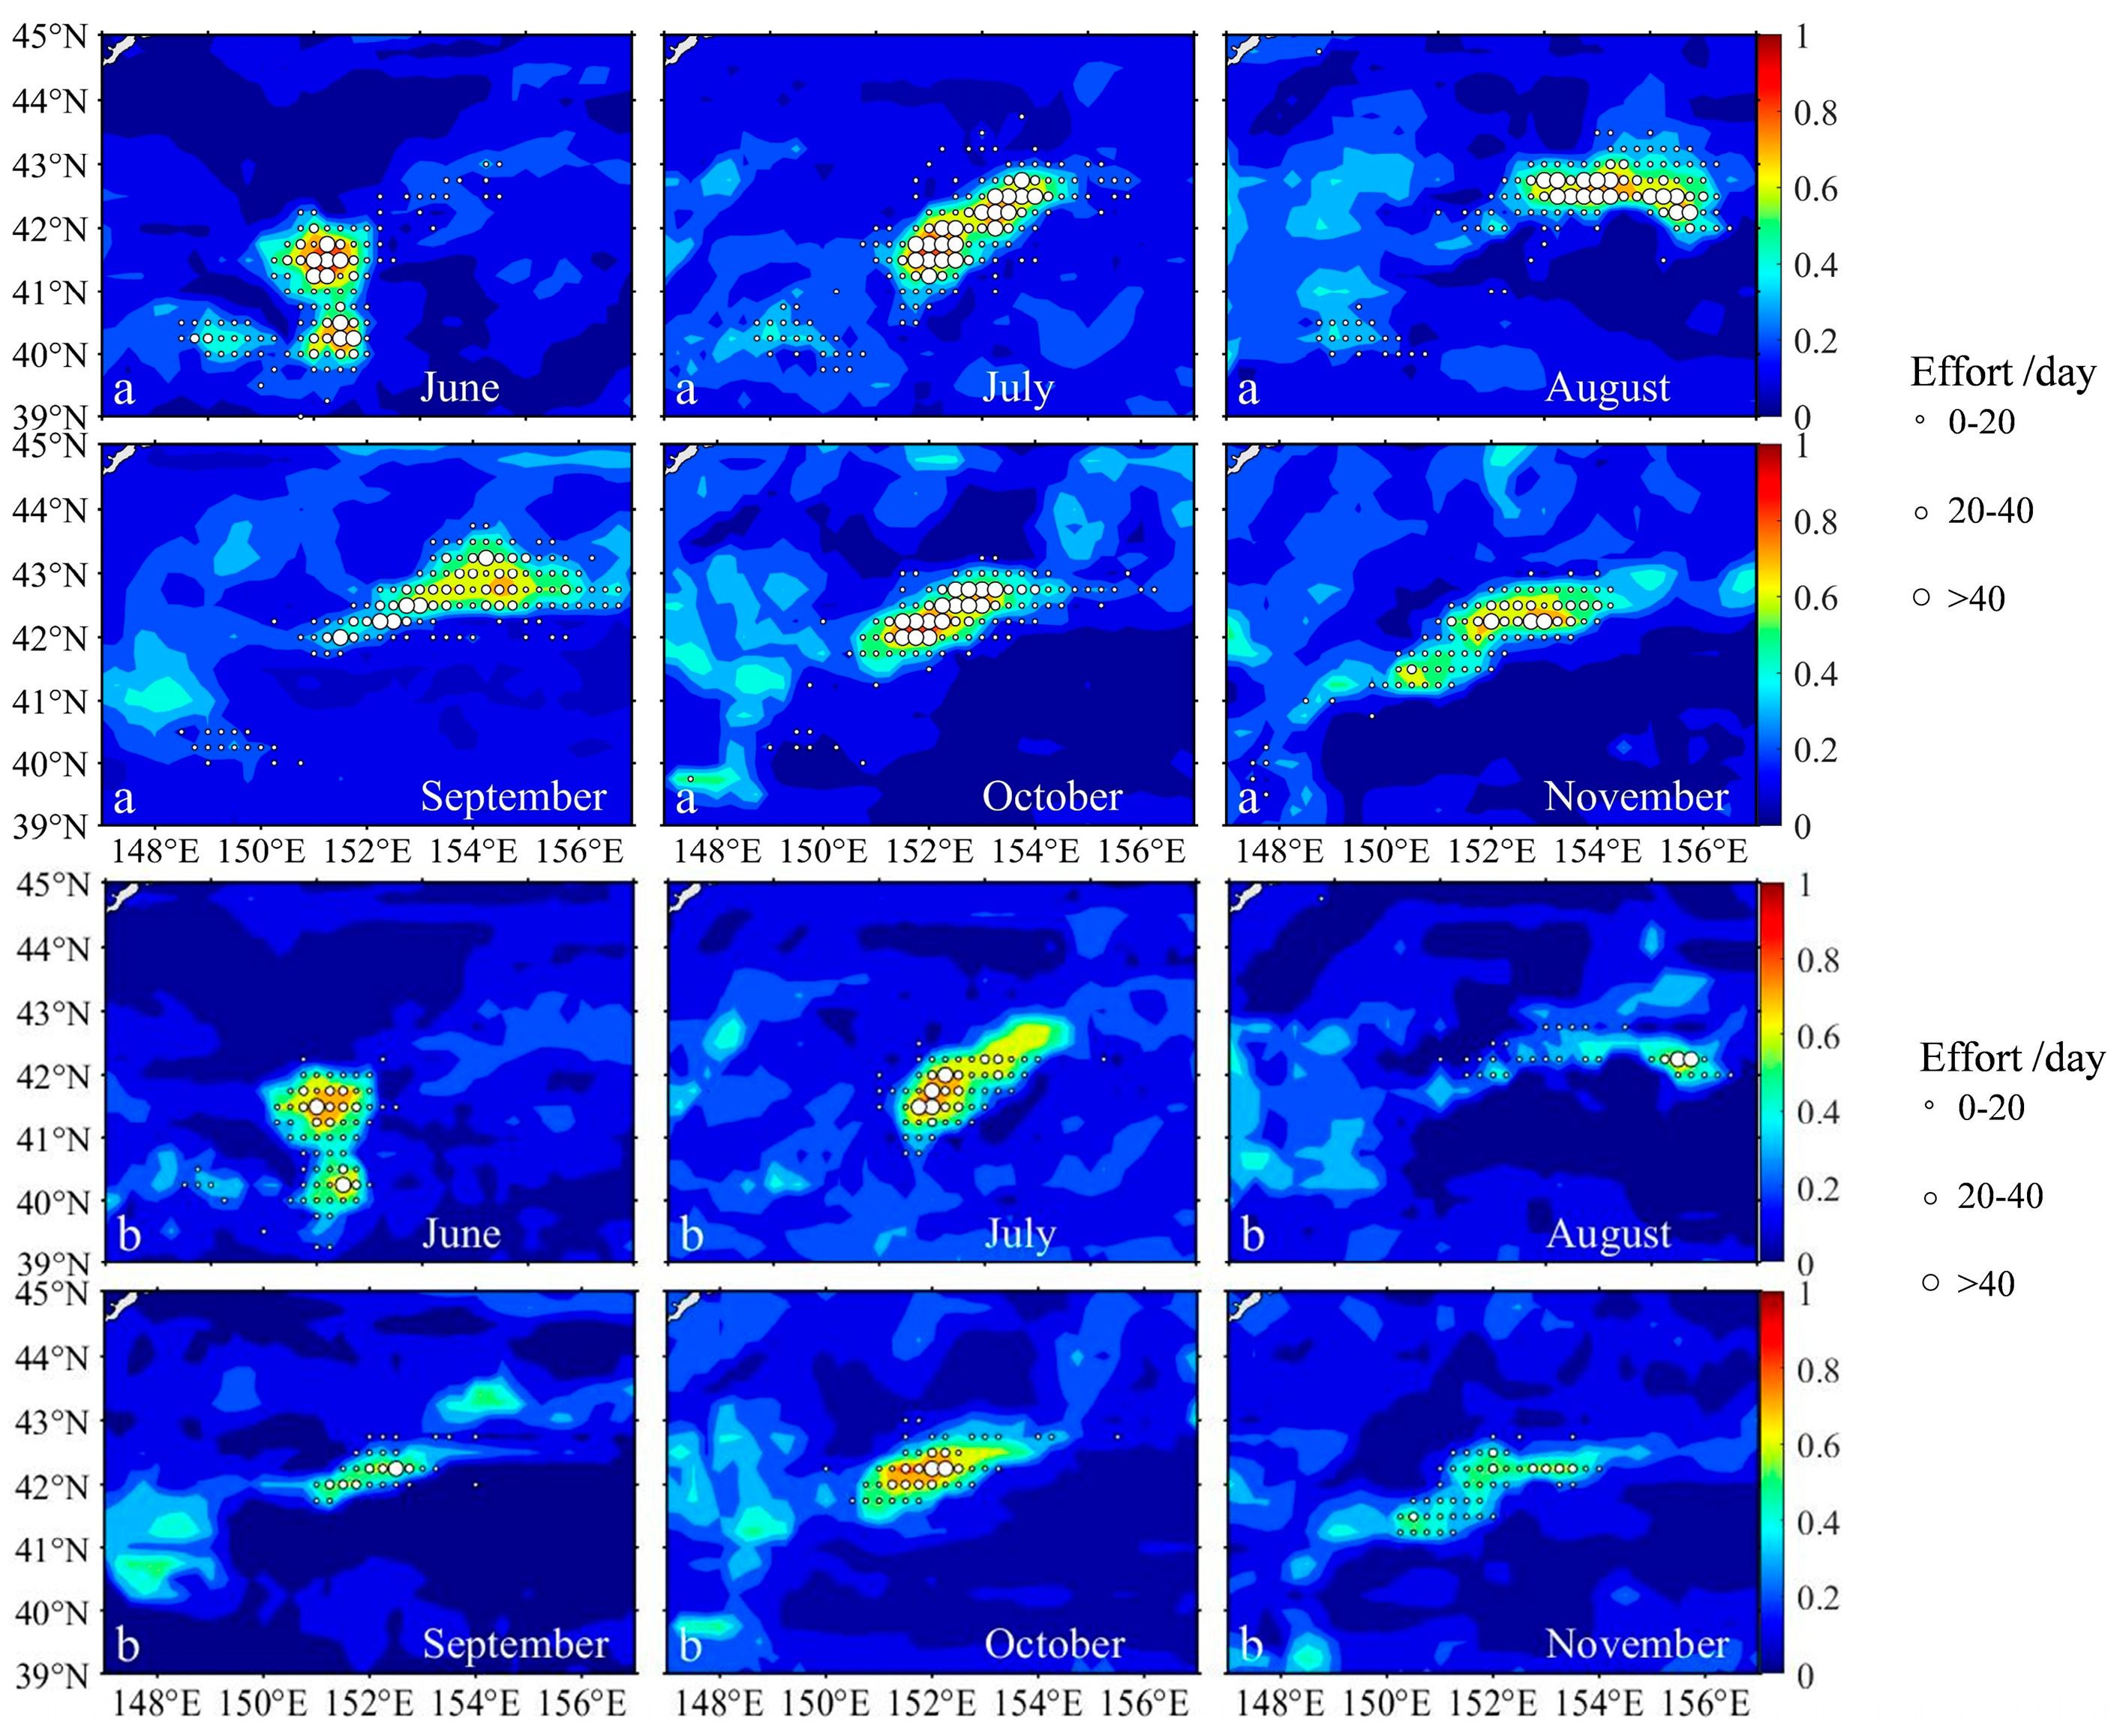
3.3. The Impact of Interspecific Competition on Habitat Dynamics in S. melanostictus and S. japonicus

The cohabitation habitat maps of S. melanostictus and S. japonicus from June to November 2021 are depicted in Figure 4. Overall, the cohabitation habitats of S. melanostictus and S. japonicus are primarily influenced by the distribution factors of S. melanostictus. Comparing the habitat distributions of both species (Figure 2) with their cohabitation habitats (Figure 4), monthly variations indicate minimal differences in habitat distribution during June, July, and October. The suitable habitats are predominantly concentrated in the region spanning 151° E–153° E and 40° N–43° N, where habitats with HSI ≥ 0.8 are consistently present. In August, September, and November, the cohabitation habitats of S. melanostictus and S. japonicus (Figure 4) show greater similarity with the suitable habitat distribution of S. melanostictus but exhibit notable differences from that of S. japonicus. The most significant disparities are evident in August and November, where S. japonicus’s suitable habitats are confined mainly to the area between 155° E–156° E and 41.5° N–42.5° N. In contrast, cohabitation habitats are distributed more broadly across the seas spanning 152.5° E–157° E and 41° N–43° N during these months. By November, the distribution of S. japonicus habitats (HSI ≥ 0.6) appears narrower compared to the cohabitation habitat distribution. Overall, the variations in optimal habitats for S. melanostictus and S. japonicus exhibit differential responses to factors influencing interspecific competition. The former demonstrates a positive correlation, whereas the latter demonstrates a negative correlation.

3.4. The Correlation Between Habitat Variations of Sardinops melanostictus and S. japonicus

Correlation analysis was conducted on the HSI of S. melanostictus in the Northwest Pacific region (145° E–163° E, 34° N–45° N) from June to November 2021 (Figure 5, s6, s7, s8, s9, s10, s11) and the corresponding HSI of S. japonicus in the same region (c6, c7, c8, c9, c10, c11). The results, as depicted in Figure 5, indicate a positive correlation between the predicted suitable habitats of S. melanostictus and S. japonicus incorporating interspecies competitive factors. In June, July, August, September, October, and November, there was a significant positive correlation (p < 0.05) in the distribution of suitable habitats between S. melanostictus and S. japonicus. Notably, the highest correlation was observed in October, suggesting that substantial changes in the habitat distribution of either S. melanostictus or S. japonicus are accompanied by corresponding shifts in the habitat of the associated species. The monthly changes in habitat distribution for S. melanostictus exhibit a weak positive correlation (maximum coefficient of 0.46). In contrast, the habitat distribution of S. japonicus shows a positive correlation across months, except for October and November (with a correlation coefficient of 0.49), which are generally lower than those observed for S. melanostictus. Additionally, the highest degrees of correlation in habitat distribution between the two species occurred in June (0.81), July (0.80), and October (0.88). In summary, there is a significant positive correlation in the distribution of suitable habitats for both S. melanostictus and S. japonicus. The interspecific competition between them is identified as one of the primary reasons contributing to this phenomenon.

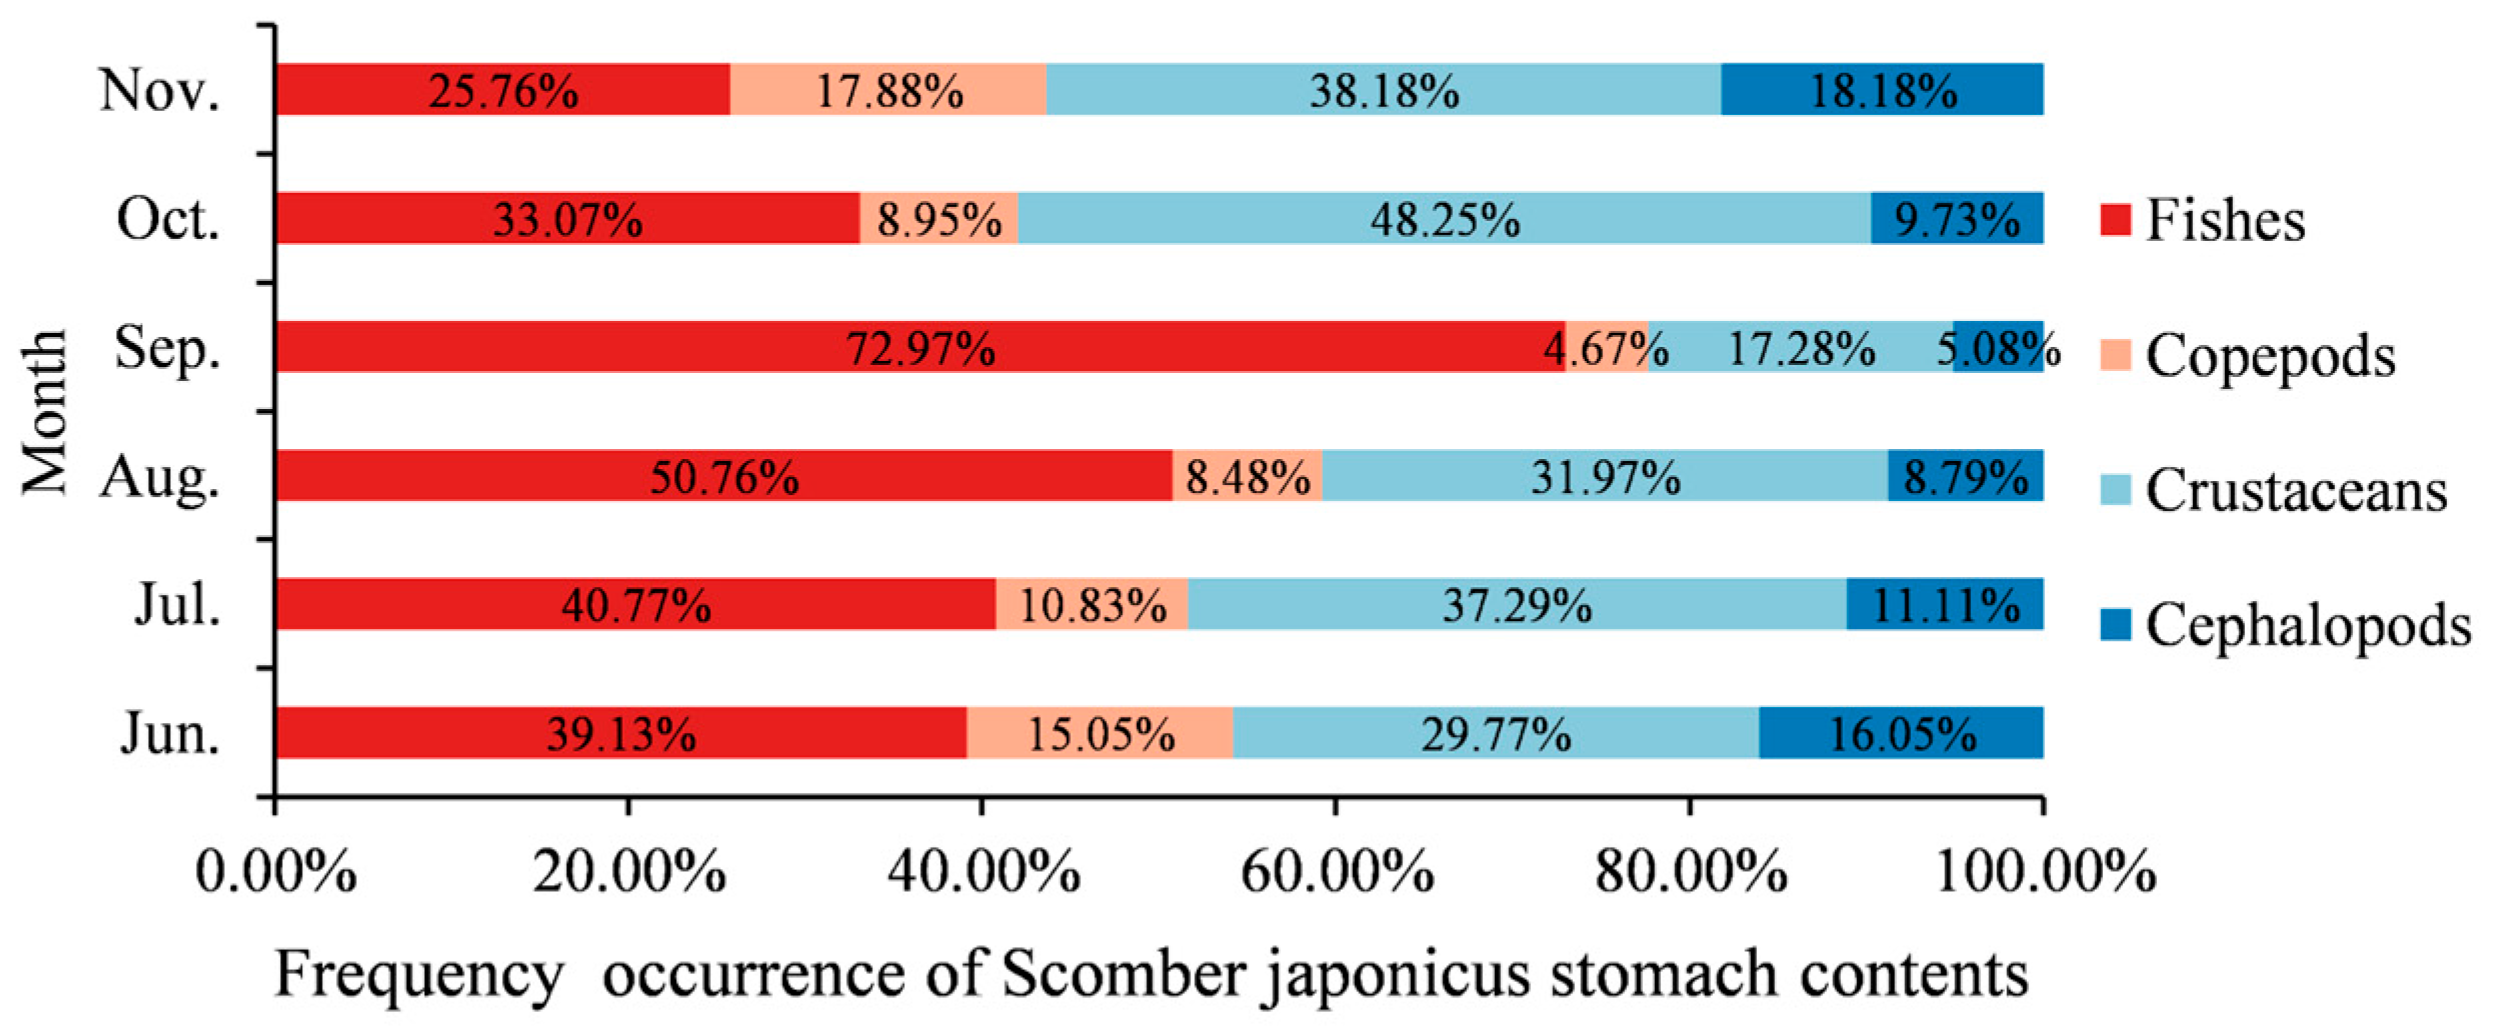
3.5. Fork Length, Body Weight, and Stomach Content Composition of Sardinops melanostictus and Scomber japonicus

In order to better understand the monthly differences in catch size, body weight, and feeding characteristics between the two populations, we analyzed information such as fork length, body weight, and bait composition from June to November. From 2017 to 2021, significant differences were observed in fork length and body weight between Japanese sardine and chub mackerel every year (Figure 6). The body weight and fork length of S. japonicus were consistently greater than those of S. melanostictus across all months, with the disparity generally increasing as the months advanced. Analysis of the stomach contents of S. japonicus indicated that the average proportion of fish prey was 0.44 across months, with a maximum value of 0.73 (Figure 7).

4. Discussion

4.1. Advantage Analysis of Establishing an icSDM

In the Northwest Pacific, the primary fishing grounds for S. melanostictus and S. japonicus are situated at the confluence of the Kuroshio warm current and the Oyashio cold current, characterized by complex water mass structures. The migratory behaviors and ecological habits of these two species exhibit a consistent response to environmental variations in this region, resulting in partial overlap of their fishing grounds [2,3,4]. Previous research has fitted the correlation between the fishing grounds or habitats of S. melanostictus and S. japonicus. For example, predictions using the maximum entropy model indicate that the potential cohabitation distribution of S. melanostictus and S. japonicus spans from 147° E to 157° E and 39° N to 44° N [2]. The optimal habitat model for S. melanostictus and S. japonicus, constructed using the arithmetic weighting method, demonstrates a significant dynamic relationship between their habitats [12]. Dai et al. (2017) [36] utilized GAM to fit the fishing ground characteristics of S. japonicus in the Northwest Pacific, identifying 39° N–43° N, 147° E–154° E as the primary fishing grounds for this species; Shi et al. (2023) [4] employed an integrated model to fit the potential fishing grounds of S. melanostictus, predicting a clear correspondence between the habitat and fishing grounds of this species. The outcomes of the aforementioned models demonstrate a relative alignment between predicted and observed values, consistent with the HSI ≥ 0.6 criterion typical of high-productivity zones. However, delineating clearly non-potential habitats (HSI ≥ 0.2) remains ambiguous. Moreover, the projected distribution range of optimal habitats notably exceeds that of actual fishing grounds. In this study, we assigned appropriate weights to interspecies competitive relationships between S. melanostictus and S. japonicus, utilizing a dynamic interspecies habitat model to delineate potential habitats. Our findings (Figure 1) reveal a notable spatial correspondence between the optimally fitted habitat regions and actual areas. The prediction accuracy for high-productivity zones (Effort ≥ 40 days) reaches 95%, with areas exhibiting minimal human fishing effort typically showing HSI values below 0.2 (Figure 1). Furthermore, our predictions demonstrate continuity without significant fragmentation, consistent with established patterns of species’ optimal habitat distribution [4]. Therefore, integrating interspecies biological interactions is inferred to be a crucial factor contributing to enhanced predictive model performance. Hence, this study comprehensively integrates environmental factors influencing habitat changes for S. melanostictus and S. japonicus, as well as interspecies competitive relationships between them, to construct an icSDM (Figure 1) that enhances both comprehensiveness and scientific rigor.

4.2. The Impact of Interspecies Competitive Relationships Between S. melanostictus and S. japonicus on Habitat Changes

4.2.1. The Significance of Interspecies Competitive Relationships in Driving Habitat Changes Among Associated Species

As small-to-medium-sized pelagic fish, S. melanostictus and S. japonicus share common responses to environmental changes, exhibiting similar habitat distribution areas. They occupy comparable trophic levels in the food chain, feeding on copepods and small shrimp, which underscores a food-driven biological competition between them [37,38]. The cross-validation results of the icSDM in this study, compared with single-species optimal habitat results, visually demonstrate the significant impact of interspecies competitive relationships on the habitat distribution of S. melanostictus and S. japonicus. This indicates that biological relationships between associated species directly influence their habitat distribution (Figure 3). Akia et al. (2021) [26] and Liu et al. (2023) [8], investigating the habitat of Scomberomorus niphonius in China’s coastal waters, incorporated the habitat distribution of the primary prey species S. japonicus. They observed that the northward shift in S. japonicus habitats is a key factor contributing to the annual contraction of S. niphonius habitats. Fuji et al. (2023) [2] investigated the distribution patterns of small pelagic fish in the Northwest Pacific, revealing that interspecific competition is the primary driver behind the staggered distribution changes observed in Cololabis saira, S. melanostictus, S. japonicus, and Engraulis japonicus. The study highlights that fluctuations in the habitat of one species induce corresponding shifts in the habitats of competing species, indicating a cascading effect in their spatial dynamics [39,40]. Habitat changes inevitably result in alterations in biomass. Over the past 30 years, the populations of S. melanostictus and S. japonicus have exhibited significant alternations. Yatsu (2019) [41] attributed these long-term dynamics primarily to large-scale climate oscillations, with short-term variations linked to fluctuations in SST. However, we propose that interspecific competition between these two species provides a complementary explanation for the observed short-term alternations in their populations. In summary, for S. melanostictus and S. japonicus, interspecific competition has intensified the correlation between their habitat changes.

4.2.2. Divergent Responses of Interspecific Competition to Habitat Changes for Both Species

The population sizes of S. melanostictus and S. japonicus are largely contingent upon recruitment rates, which are in turn governed by habitat environmental conditions. Within the framework of specific metabolic efficiencies and maternal effects, the influence of interspecific factors on habitat changes exhibits considerable variability and complexity [14,17,19,42]. The distribution of the cohabitation habitats of S.melanostictus and S. japonicus in August, September, and November (Figure 4) closely aligns with the distribution of suitable habitats for S. melanostictus (Figure 2) but differs markedly from those of S. japonicus (Figure 2). Furthermore, the yield changes between August and September exhibit slight variations, with S. melanostictus showing a decrease and S. japonicus an increase. Kamimura et al. (2021) [42] observed annual variations in S. japonicus resources, noting a trend where increased abundance of S. melanostictus coincided with decreased abundance of S. japonicus. This pattern reflects the alternating resource dynamics driven by interspecific competition between these species. Furthermore, research has revealed that from August to October, the fishing grounds of S. melanostictus and S. japonicus reach the easternmost part of the sea and subsequently begin a westward retreat. Notably, the centroid of S. melanostictus’ fishing grounds extends to 154.5° E, whereas that of S. japonicus reaches only 153° E [4,19,24]. The observed phenomena are likely due to the superior migratory abilities of S. melanostictus, which enable it to access more distant marine areas and expand its distribution eastward. In contrast, S. japonicus, influenced by the long-distance migrations of associated species, experiences reduced competition within cohabitation habitats, resulting in a temporary increase in productivity [6,8]. In addition, constrained by regional food availability and predation dynamics where larger S. japonicus prey on smaller S. melanostictus, habitats of S. japonicus expand concomitantly with the spread of fish prey (S. melanostictus) when crustacean densities decline in the area [8,43,44]. Thus, it is hypothesized that as cohabitation habitats enlarge alongside S. japonicus habitats, the latter’s presence increases due to heightened interspecific competition, thereby restraining the expansion of S. melanostictus habitats. During winter, warm temperate epipelagic fish migrate northward for overwintering and enter spawning grounds. Both S. melanostictus and S. japonicus move southwestward during this period. As they search for suitable spawning grounds, competition for food diminishes, leading to temporarily similar habitat changes [45,46,47]. This also corroborates our findings that, in November, the changes in cohabitation habitats and single-species habitats for both species exhibit consistent patterns. In summary, the migratory routes and seasonal spawning behaviors of S. melanostictus and S. japonicus are pivotal in driving the differential impacts of interspecific competition on their habitat changes.

4.2.3. The Effect of Predation and Being Preyed upon on the Interspecific Competitive Relationship Between the Two Species

Both S. japonicus and S. japonicus are schooling fish species that exhibit medium-to-long-distance migratory behavior, with overlapping feeding grounds and migration routes. Analysis of their mean fork length and body weight (Figure 6) revealed that S. japonicus consistently showed significantly greater body weight and fork length than Japanese sardine across all sampled months, with this size disparity progressively increasing with the arrival of autumn and winter (August-November). Analysis of the stomach contents and trophic level of S. japonicus revealed that the relative importance index (IRI) of S. melanostictus as prey was 12.34, with a weight percentage (w) of 36.04. (Tang et al., 2020 [48]). Individual size also significantly influences the trophic dynamics between the two species. In the stomach of large mackerel, we often find complete or undigested sardine, which proves that larger mackerel (probably above 20% individuals) will directly prey on sardines, especially in the autumn–winter (lately August-November) (Figure 7). But this phenomenon is rarely found in the stomachs of smaller individuals of S. japonicus with a fork length less than 210 mm. Both S. japonicus and S. melanostictus are schooling, mid-to-long-distance migratory fish, with overlapping feeding grounds and migration routes. When the size disparity becomes pronounced, the smaller S. melanostictus is preferentially preyed upon by the larger S. japonicus. Specifically, when the fork length difference exceeds 60 mm, a predator–prey relationship is established, particularly in S. japonicus individuals exceeding 220 mm in fork length. Moreover, S. japonicus exhibits a higher growth coefficient than S. melanostictus, and as S. japonicus grows, its predation pressure on S. melanostictus increases [41,42,49]. These findings support the optimal foraging theory, which posits that predators preferentially target larger prey, as the energy gained from consuming larger individuals outweighs the energy expended in capturing them, thereby maximizing net energy gain [50,51]. Furthermore, during the overwintering period, copepods, shrimp, and other prey serve as a shared energy source for both S. japonicus and S. melanostictus. This reduces the competitive pressure between the two species for common food resources, resulting in an expansion of the suitable habitat range for S. japonicus at the expense of S. melanostictus. Consequently, the suitable habitat for S. melanostictus is compressed, exhibiting seasonal fluctuations characterized by periodic expansions and contractions of habitat availability [20,38]. Overall, the predator–prey dynamics between S. japonicus and S. melanostictus, driven by substantial individual size differences, modulate their competitive interactions, ultimately influencing the temporal fluctuations in their habitat ranges.

4.3. Correlation Between Habitat Changes of Sardinops melanostictus and S. japonicus

According to the habitat correlation analysis conducted in this study from June to November 2021, there is a clear positive correlation between the habitat changes of S. melanostictus and S. japonicus (Figure 5). Typically, interspecies competition among two or more species for limited resources such as food, space, or water is expected to result in a negative correlation, where an increase in one species is often accompanied by a decrease in another. This contradicts the conclusion drawn in this study, which suggests a tendency towards positive correlation in the habitat changes of S. melanostictus and S. japonicus. There are four primary reasons for this speculation: (1) Spatial distribution and ecological niche differentiation. S. melanostictus and S. japonicus, as long-distance migratory fish species, have constrained spatial ranges. Interspecies competition likely induces spatial and ecological niche differentiation, enabling each species to occupy distinct niches within the same habitat and thereby mitigating direct competition [19,52,53]. (2) Resource allocation and adaptive evolution. Since the 1950s, S. melanostictus and S. japonicus have established defined fishing grounds in the northwest Pacific Ocean [45,54]. Simultaneously, a stable long-term feeding ground has formed in this region. Given their similar ecological behaviors, adaptive evolution in resource allocation may have fostered the development of strategies for adaptive coexistence, mitigating intense competition and facilitating their harmonious cohabitation within the same habitat [12,38]. (3) Phasic feeding relationships. When a larger proportion of larger individuals exists within the S. japonicus population, they intensify predation on S. melanostictus. Consequently, fluctuations in the population size of S. melanostictus can also impact the habitat dynamics of S. japonicus in response [8]. (4) Complex dynamics of communities. In theory, interspecies interactions can manifest in two distinct forms: higher-order interactions and intransitive competition. The former involves changing competition coefficients, while the latter regulates competition solely through density adjustments [55]. In the primary economic fishing grounds of the northwest Pacific Ocean, prominent pelagic species include Cololabis saira, S. japonicus, Engraulis japonicus, and Ommastrephes bartramii [56]. The interplay among these species can influence competition coefficients and population densities within the biological community [2,3,57,58,59], potentially resulting in correlated habitat changes for S. melanostictus and S. japonicus due to the presence of other species. Overall, the spatial distribution and ecological niche differentiation, resource allocation and adaptive evolution, phasic feeding relationships, and complex dynamics of the community likely result in a positive correlation in the habitat changes of S. melanostictus and S. japonicus.

5. Conclusions

This study constructs a dynamic model of interspecies habitat association based on the competitive relationship between S. melanostictus and S. japonicus. We analyze the correlation between their habitat changes and investigate the impact of interspecies competition on the distributional differences of their habitats. Our findings indicate that interspecies competition significantly influences the habitat dynamics of S. melanostictus and S. japonicus, strengthening the correlation between their habitat variations and leading to a positive relationship between the habitat changes of the two species. Meanwhile, the icSDM developed in this study yields habitat predictions for S. melanostictus and S. japonicus that more closely align with the ecological patterns of optimal habitat distribution compared to those generated by the ssSDM. It effectively mitigates potential habitat fragmentation caused by model predictions and significantly enhances prediction accuracy. The species examined in this study, S. melanostictus and S. japonicus, exhibit significant overlap in their distribution and have relatively similar ecological habits. Environmental fluctuations can induce variations in interspecies interactions and are the primary drivers of habitat changes. The common environmental factors may attenuate the influence of interspecies relationships on habitat distribution, introducing a degree of stochasticity to the study’s findings. Additionally, the biological interactions between different age groups of S. japonicus and S. melanostictus differ; smaller and medium-sized individuals primarily compete, while larger individuals engage in both predation and competition. Limitations in fisheries data prevent precise differentiation of these specific interspecies relationships, which introduces certain constraints to this study’s conclusions.
Therefore, future studies should incorporate individual-level data—such as stomach content composition, age classes, and the degree of spatial overlap in feeding grounds—of S. melanostictus and S. japonicus to further refine our understanding of interspecific relationships across different life stages. Assigning ecologically meaningful weights to competitive, predatory, and prey interactions will improve the realism of species interaction modeling. By integrating insights from fisheries oceanography and population ecology, the development of advanced Joint Species Distribution Models (JSDMs) will allow for a more comprehensive interpretation of habitat variation among sympatrically distributed species. This will ultimately provide a robust scientific basis for the sustainable exploitation and management of S. melanostictus and S. japonicus populations.

Author Contributions

Conceptualization, H.Z. (Heng Zhang) and S.L.; methodology, S.L. and H.Z. (Hanji Zhu); software, H.Z. (Hanji Zhu); validation, S.L., H.Z. (Hanji Zhu), and H.Z. (Heng Zhang); formal analysis, S.L., H.Z. (Hanji Zhu).; investigation, J.W., F.Z. and H.Z. (Heng Zhang); resources, J.W., F.Z.; data curation, S.L. and H.Z. (Hanji Zhu); writing—original draft preparation, S.L. and H.Z. (Hanji Zhu); writing—review and editing, S.L. and S.Z.; supervision, S.L. and H.Z. (Heng Zhang); project administration, S.Z. and H.Z. (Heng Zhang); funding acquisition, H.Z. (Heng Zhang) All authors have read and agreed to the published version of the manuscript.

Funding

This work was supported by grants from the Financially supported by the Program on the Survey of Pelagic Fishery Resources sponsored by the Ministry of Agriculture and Rural Affairs; Program on the Survey, Monitoring and Assessment of Global Fishery Resources (Comprehensive scientific survey of fisheries resources at the high seas) sponsored by the Ministry of Agriculture and Rural Affairs; National Science Foundation of China (32403030, 41876141); the Zhejiang ocean fishery resources exploration and capture project (CTZB-2022080076).

Institutional Review Board Statement

The data used in this study consist of recorded data from commercial fishing operations, along with vessel positioning data and marine environmental data, and no animal experiments were conducted.

Informed Consent Statement

Not applicable.

Data Availability Statement

All fisheries data supporting the findings of this study are included in this manuscript. However, these data are used under license from the Distant Squid Fisheries Sci-Tech Group (SHOU) and the East China Sea Fisheries Research Institute, and usage is only permitted by the authors, Distant Squid Fisheries Sci-Tech Group (SHOU), and the East China Sea Fisheries Research Institute upon reasonable request. All environmental data in this study are available from APDRC (http://apdrc.soest.hawaii.edu/las_ofes/v6/dataset?catitem=71 (accessed on accessed on 9 October 2023)), CMEMS (https://marine.copernicus.eu (accessed on 10 October 2023)), NOAA (https://origin.cpc.ncep.noaa.gov/products/analysis_monitoring/ensostuff/ONI_v5.php (accessed on 10 October 2023)).

Acknowledgments

We would like to acknowledge Zhang for his valuable guidance throughout this research, and we extend our gratitude to all authors for their contributions and support.

Conflicts of Interest

The authors declare no conflicts of interest.

References

  1. Klyashtorin, L.B. Long-term climate change and main commercial fish production in the Atlantic and Pacific. Fish. Res. 1998, 37, 115–125. [Google Scholar] [CrossRef]
  2. Fuji, T.; Nakayama, S.I.; Hashimoto, M.; Hashimoto, M.; Kamimura, Y.; Furuichi, S.; Oshima, K.; Suyama, S. Biological interactions potentially alter the large-scale distribution pattern of the small pelagic fish, Pacific saury Cololabis saira. Mar. Ecol. Prog. Ser. 2023, 704, 99–117. [Google Scholar] [CrossRef]
  3. Liu, S.H.; Tian, Y.J.; Liu, Y.; Alabia, I.D.; Cheng, J.H.; Ito, S. Development of a prey-predator species distribution model for a large piscivorous fish: A case study for Japanese Spanish mackerel Scomberomorus niphonius and Japanese anchovy Engraulis japonicus. Deep Sea Res. Part II Top. Stud. Oceanogr. 2023, 207, 105227. [Google Scholar] [CrossRef]
  4. Shi, Y.C.; Kang, B.; Fan, W.; Xu, L.L.; Zhang, S.M.; Cui, X.S.; Dai, Y. Spatio-Temporal Variations in the Potential Habitat Distribution of Pacific Sardine (Sardinops melanostictus) in the Northwest Pacific Ocean. Fishes 2023, 8, 86. [Google Scholar] [CrossRef]
  5. NPFC Secretariat. Summary Footprint of Chub Mackerel Fisheries; North Pacific Fisheries Commission: Tokyo, Japan, 2023; pp. 1–6. [Google Scholar]
  6. Nakayama, S.I.; Takasuka, A.; Ichinokawa, M.; Okamura, H. Climate change and interspecific interactions drive species alternations between anchovy and sardine in the western North Pacific: Detection of causality by convergent cross mapping. Fish. Oceanogr. 2018, 27, 312–322. [Google Scholar] [CrossRef]
  7. Yatsu, A.; Kawabata, A. Reconsidering Trans-Pacific “synchrony” in population fluctuations of sardines. Bull. Jpn. Soc. Fish. Oceanogr 2017, 81, 271–283. [Google Scholar]
  8. Liu, S.Y.; Zhang, H.; Yang, C.; Fang, Z. Differences in habitat distribution of Sardinops melanostictus and Scomber japonicus in the Northwest Pacific based on a maximum entropy model. J. Shanghai Ocean Univ. 2023, 32, 806–817. [Google Scholar]
  9. Shi, Y.S.; Zhang, X.M.; Yang, S.Y.; Dai, Y.; Cui, X.S.; Wu, Y.M.; Zhang, S.M.; Fan, W.; Han, H.B.; Zhang, H.; et al. Construction of CPUE standardization model and its simulation testing for chub mackerel (Scomber japonicus) in the Northwest Pacific Ocean. Ecol. Indic. 2023, 155, 111022. [Google Scholar] [CrossRef]
  10. Ma, S.Y.; Fu, C.H.; Li, J.C.; Sun, P.; Liu, Y.; Ye, Z.J.; Watanable, Y.; Tian, Y.G. Non-stationary effects of multiple drivers on the dynamics of Japanese sardine (Sardinops melanostictus, Clupeidae). Fish Fish. 2023, 24, 40–55. [Google Scholar] [CrossRef]
  11. Wisz, M.S.; Pottier, J.; Kissling, W.D.; Pellissier, L.; Lemoir, J. The role of biotic interactions in shaping distributions and realised assemblages of species: Implications for species distribution modelling. Biol. Rev. 2013, 88, 15–30. [Google Scholar] [CrossRef]
  12. Han, H.B.; Yang, C.; Jiang, B.H.; Shang, C.; Sun, Y.Y.; Zhao, X.Y.; Xiang, D.X.; Zhang, H.; Shi, Y.C. Construction of chub mackerel (Scomber japonicus) fishing ground prediction model in the northwestern Pacific Ocean based on deep learning and marine environmental variables. Mar. Pollut. Bull. 2023, 193, 115158. [Google Scholar] [CrossRef]
  13. Liu, S.Y.; Zhang, H.; Yang, C.; Fang, Z. Relationship between stock dynamics and environmental variability for Japanese sardine (Sardinops melanostictus) and chub mackerel (Scomber japonicus) in the Northwest Pacific Ocean: A review. J. Dalian Ocean Univ. 2023, 38, 357–368. [Google Scholar]
  14. Wang, Z.Q.; Ito, S.; Yabe, I.; Guo, C.Y. Development of a bioenergetics and population dynamics coupled model: A case study of chub mackerel. Front. Mar. Sci. 2023, 10, 1142899. [Google Scholar] [CrossRef]
  15. Chavez, F.P.; Ryan, J.; Lluch-Cota, S.E.; Ñiquen, C.M. From anchovies to sardines and back: Multidecadal change in the Pacific Ocean. Science 2003, 299, 217–221. [Google Scholar] [CrossRef] [PubMed]
  16. Oozeki, Y.; Carranza, M.Ñ.; Takasuka, A.; Dejo, P.A.; Kuroda, H.; Malagas, J.T.; Okunishi, T.; Espinoza, L.V.; Aguilar, D.G.; Okamura, H.; et al. Synchronous multi-species alternations between the northern Humboldt and Kuroshio Current systems. Deep Sea Res. Part II Top. Stud. Oceanogr. 2019, 159, 11–21. [Google Scholar] [CrossRef]
  17. Sogawa, S.; Hidaka, K.; Kamimura, Y.; Takahshi, M.; Saito, H.; Okazaki, Y.; Setou, T. Environmental characteristics of spawning and nursery grounds of Japanese sardine and mackerels in the Kuroshio and Kuroshio Extension area. Fish. Oceanogr. 2019, 28, 454–467. [Google Scholar] [CrossRef]
  18. Gkanasos, A.; Schismenou, E.; Tsiaras, K.; Somarakis, S.; Giannoulaki, M.; Sofianos, S. A three dimensional, full life cycle, anchovy and sardine model for the North Aegean Sea (Eastern Mediterranean): Validation, sensitivity and climatic scenario simulations. Medit. Mar. Sci. 2021, 22, 653–668. [Google Scholar] [CrossRef]
  19. Umezawa, Y.; Ono, Y.; Okunishi, T.; Yukami, R.; Kamimura, Y.; Yoshimizu, C.; Tayasu, I. Investigation of inter-annual variation in the feeding habits of Japanese sardine (Sardinops melanostictus) and mackerels (Scomber spp.) in the Western North Pacific based on bulk and amino acid stable isotopes. Front. Mar. Sci. 2023, 10, 1225923. [Google Scholar] [CrossRef]
  20. Bai, X.; Gao, L.; Choi, S. Exploring the Response of the Japanese Sardine (Sardinops melanostictus) Stock-Recruitment Relationship to Environmental Changes under Different Structural Models. Fishes 2022, 7, 276. [Google Scholar] [CrossRef]
  21. Yen, K.W.; Lu, H.J.; Chang, Y.; Lee, M.A. Using remote-sensing data to detect habitat suitability for yellowfin tuna in the Western and Central Pacific Ocean. Int. J. Remote Sens. 2012, 33, 7507–7522. [Google Scholar] [CrossRef]
  22. Pavlov, Y.L. Random Forests; Karelian Centre Russia Academy of Sciences: Petrozavodsk, Russia, 1997; Volume 45, pp. 5–32. [Google Scholar]
  23. Gao, F.; Chen, X.J.; Guan, W.J.; Li, G. A new model to forecast fishing ground of Scomber japonicus in the Yellow Sea and East China Sea. Acta Oceanol. Sin. 2016, 35, 74–81. [Google Scholar] [CrossRef]
  24. Cai, K.; Kindong, R.; Ma, Q.Y.; Tian, S.Q. Stock Assessment of Chub Mackerel (Scomber japonicus) in the Northwest Pacific Using a Multi-Model Approach. Fishes 2023, 8, 80. [Google Scholar] [CrossRef]
  25. Mondal, S.; Wang, Y.C.; Lee, M.A.; Weng, J.S.; Mondal, B.K. Ensemble three-dimensional habitat modeling of Indian Ocean immature albacore tuna (Thunnus alalunga) using remote sensing data. Remote Sens. 2022, 14, 5278. [Google Scholar] [CrossRef]
  26. Akia, S. Du Global au Local: Étude des Interactions Entre les Thons de la ZEE de la Cote d’Ivoire et le Reste du Stock de l’Atlantique Est à Partir des Données du Programme de Marquage AOTTP de l’ICCAT et de Quelques Indicateurs Biologiques. Doctoral Dissertation, Université Montpellier, Montpellier, France, 2021. [Google Scholar]
  27. Tylianakis, J.M.; Didham, R.K.; Bascompte, J.; Wardle, D.A. Global change and species interactions in terrestrial ecosystems. Ecol. Lett. 2008, 11, 1351–1363. [Google Scholar] [CrossRef]
  28. Brooker, R.W. Plant–plant interactions and environmental change. New Phytol. 2006, 171, 271–284. [Google Scholar] [CrossRef]
  29. Meier, E.S.; Edwards Jr, T.C.; Kienast, F.; Dobbertin, M.; Zimmermann, N.Z. Co-occurrence patterns of trees along macro-climatic gradients and their potential influence on the present and future distribution of Fagus sylvatica L. J. Biogeogr. 2011, 38, 371–382. [Google Scholar] [CrossRef]
  30. Bakun, A.; Broad, K. Environmental ‘loopholes’ and fish population dynamics: Comparative pattern recognition with focus on El Niño effects in the Pacific. Fish. Oceanogr. 2003, 12, 458–473. [Google Scholar] [CrossRef]
  31. Yu, W.; Guo, A.; Zhang, Y.; Chen, X.J.; Qian, W.G.; Li, Y.S. Climate-induced habitat suitability variations of chub mackerel Scomber japonicus in the East China Sea. Fish. Res. 2018, 207, 63–73. [Google Scholar] [CrossRef]
  32. Bordalo-Machado, P. Fishing effort analysis and its potential to evaluate stock size. Rev. Fish. Sci. 2006, 14, 369–393. [Google Scholar] [CrossRef]
  33. Yang, R.M.; Zhang, G.L.; Liu, F.; Lu, Y.Y.; Yang, F.; Yang, F.; Yang, M.; Zhao, Y.G.; Li, D.C. Comparison of boosted regression tree and random forest models for mapping topsoil organic carbon concentration in an alpine ecosystem. Ecol. Indic. 2016, 60, 870–878. [Google Scholar] [CrossRef]
  34. Xue, Y.; Guan, L.S.; Tanaka, K.; Li, Z.G.; Chen, Y.; Ren, Y.P. Evaluating effects of rescaling and weighting data on habitat suitability modeling. Fish. Res. 2017, 188, 84–94. [Google Scholar] [CrossRef]
  35. Sakamoto, T.; Takahashi, M.; Chung, M.T.; Rzewski, R.R.; Komatsu, K.; Shirai, K.; Ishimura, T.; Higuchi, T. Contrasting life-history responses to climate variability in eastern and western North Pacific sardine populations. Nat. Commun. 2022, 13, 5298. [Google Scholar] [CrossRef] [PubMed]
  36. Dai, S.W.; Tang, F.H.; Fan, W.; Zhang, H.; Cui, X.S.; Guo, G.G. Distribution of resource and environment characteristics of fishing ground of Scomber japonicas in the North Pacific high seas. Mar. Fish. 2017, 39, 372–382. [Google Scholar]
  37. Aono, T.; Sakamoto, T.; Ishimura, T.; Takahashi, M.; Yasuda, T.; Kitajima, S.; Nishida, K.; Matsuura, T.; Ikari, A.; Ito, S.I. Migration patterns of the Japanese sardine in the Sea of Japan by combining the microscale stable isotope analysis of otoliths and an ocean data assimilation model. Front. Mar. Sci. 2024, 11, 1394801. [Google Scholar] [CrossRef]
  38. Yang, C.; Han, H.B.; Zhang, H.; Shi, Y.C.; Su, B.; Jiang, P.W.; Xiang, D.; Sun, Y.Y.; Li, Y. Assessment and management recommendations for the status of Japanese sardine Sardinops melanostictus population in the Northwest Pacific. Ecol. Indic. 2023, 148, 110111. [Google Scholar] [CrossRef]
  39. Takasuka, A.; Kubota, H.; Oozeki, Y. Spawning overlap of anchovy and sardine in the western North Pacific. Mar. Ecol. Prog. Ser. 2008, 366, 231–244. [Google Scholar] [CrossRef]
  40. Kanamori, Y.; Takasuka, A.; Nishijima, S.; Okamura, H. Climate change shifts the spawning ground northward and extends the spawning period of chub mackerel in the western North Pacific. Mar. Ecol. Prog. Ser. 2019, 624, 155–166. [Google Scholar] [CrossRef]
  41. Yatsu, A. Review of population dynamics and management of small pelagic fishes around the Japanese Archipelago. Fish. Sci. 2019, 85, 611–639. [Google Scholar] [CrossRef]
  42. Kamimura, Y.; Taga, M.; Yukami, R.; Watanabe, C.; Furuichi, S. Intra-and inter-specific density dependence of body condition, growth, and habitat temperature in chub mackerel (Scomber japonicus). ICES J. Mar. Sci. 2021, 78, 3254–3264. [Google Scholar] [CrossRef]
  43. Wang, L.M.; Ma, S.Y.; Liu, Y.; Li, J.C.; Liu, S.G.; Lin, L.S.; Tian, Y.J. Fluctuations in the abundance of chub mackerel in relation to climatic/oceanic regime shifts in the northwest Pacific Ocean since the 1970s. J. Mar. Syst. 2022, 218, 103541. [Google Scholar] [CrossRef]
  44. Nishikawa, H.; Itoh, S.; Yasuda, I.; Komatsu, K. Overlap between suitable nursery grounds for Japanese anchovy (Engraulis japonicus) and Japanese sardine (Sardinops melanostictus) larvae. Aquaculture, Fish Fish. 2022, 2, 179–188. [Google Scholar] [CrossRef]
  45. Kuroda, H.; Saito, T.; Kaga, T.; Takasuka, A.; Kamimura, Y.; Furuichi, S.; Nakanowatari, T. Unconventional sea surface temperature regime around Japan in the 2000s–2010s: Potential influences on major fisheries resources. Front. Mar. Sci. 2020, 7, 574904. [Google Scholar] [CrossRef]
  46. Sarr, O.; Kindong, R.; Tian, S. Knowledge on the Biological and Fisheries Aspects of the Japanese Sardine, Sardinops melanostictus (Schlegel, 1846). J. Mar. Sci. Eng. 2021, 9, 1403. [Google Scholar] [CrossRef]
  47. Hong, J.B.; Kim, D.Y.; Kim, D.H. Stock Assessment of Chub Mackerel (Scomber japonicus) in the Northwest Pacific Ocean Based on Catch and Resilience Data. Sustainability 2022, 15, 358. [Google Scholar] [CrossRef]
  48. Tang, F.H.; Dai, S.W.; Fan, W.; Cui, X.S.; Zhang, H. Study on stomach composition and feeding level of Chub Mackerel in the Northwest Pacific. J. Agric. Sci. Technol. 2020, 22, 138–1148. [Google Scholar]
  49. Tzeng, T.D.; Haung, H.L.; Wang, D.; Yeh, S.Y. Genetic diversity and population expansion of the common mackerel (Scomber japonicus) off Taiwan. J. Fish. Soc. Taiwan 2007, 34, 237–245. [Google Scholar]
  50. Xue, Y.; Jin, X.S.; Zhang, B.; Lang, Z.L. Feeding habits of three sciaenid fishes in the Southern Yellow Sea. J. Fish. China 2005, 29, 178–187. [Google Scholar]
  51. Zhang, B. Feeding and varies with the change of body length of Cleisthenes herzensteini in the central of the Yellow Sea. Chin. J. Appl. Ecol. 2007, 18, 1849–1854. [Google Scholar]
  52. Bascompte, J. Mutualistic networks. Front. Ecol. Environ. 2009, 7, 429–436. [Google Scholar] [CrossRef]
  53. Schweiger, O.; Heikkinen, R.K.; Harpke, A.; Hickler, T.; Klotz, S.; Kudrna, O.; Kühn, L.; Pöyry, J.; Settele, J. Increasing range mismatching of interacting species under global change is related to their ecological characteristics. Glob. Ecol. Biogeogr. 2012, 21, 88–99. [Google Scholar] [CrossRef]
  54. Li, Y.S.; Pan, L.Z.; Chen, X.J. Effect of spawning ground location on the transport and growth of chub mackerel (Scomber japonicus) eggs and larvae in the East China Sea. Acta Oceanol. Sin. 2014, 34, 92–97. [Google Scholar] [CrossRef]
  55. Levine, J.M.; Bascompte, J.; Adler, P.B.; Allesina, S. Beyond pairwise mechanisms of species coexistence in complex communities. Nature 2017, 546, 56–64. [Google Scholar] [CrossRef]
  56. Bower, J.R.; Ichii, T. The red flying squid (Ommastrephes bartramii): A review of recent research and the fishery in Japan. Fish. Res. 2005, 76, 39–55. [Google Scholar] [CrossRef]
  57. Laird, R.A.; Schamp, B.S. Competitive intransitivity promotes species coexistence. Am. Nat. 2006, 168, 182–193. [Google Scholar] [CrossRef] [PubMed]
  58. Allesina, S.; Levine, J.M. A competitive network theory of species diversity. Proc. Natl. Acad. Sci. USA 2011, 108, 5638–5642. [Google Scholar] [CrossRef] [PubMed]
  59. Gallien, L.; Zimmermann, N.E.; Levine, J.M.; Adler, P.B. The effects of intransitive competition on coexistence. Ecol. Lett. 2017, 20, 791–800. [Google Scholar] [CrossRef] [PubMed]
Figure 1. The process for constructing interspecific competition species distribution models for S. melanostictus and S. japonicus.
Biology 14 00968 g001
Figure 2. The predicted Habitat Suitability Index by joint interspecific competition species distribution model (icSDM) overlain with fishing efforts of S. melanostictus (a) and S. japonicus (b) from June to November in 2021. Note: “Effort” refers to the total number of fishing days undertaken by all operating fishing vessels at the corresponding site. “a” represents S. melanostictus. “b” represents S. japonicus.
Biology 14 00968 g002
Figure 3. Fitting accuracy of ssSDMs and icSDMs models from June to November. Fitting accuracy of the ssSDM and icSDMs models for S. melanostictus and S. japonicus from June to November. Note: Different symbols above the bars denote the significant difference among groups at the same time point (* p < 0.05, ** p < 0.01, **** p < 0.0001).
Biology 14 00968 g003
Figure 4. The syntopic distributions habitat of S. melanostictus (a) and S. japonicus (b) from 2017 to 2021.
Biology 14 00968 g004
Figure 5. Correlation between the habitat (HSI) of S. melanostictus and S. japonicus from June to November in 2021.
Biology 14 00968 g005
Figure 6. Monthly changes in the mean fork length and weight of S. melanostictus and S. japonicus from June to November 2021. Note: different symbols above the bars denote the significant difference among groups at the same time point (**** p < 0.0001).
Biology 14 00968 g006
Figure 7. Monthly changes in the composition of stomach contents of S. japonicus.
Biology 14 00968 g007
Table 1. Fisheries data sample size used for constructing isSDMs during June to November from 2017 to 2021.
YearsSpeciesSamples
JuneJulyAugustSeptemberOctoberNovemberTotal
2017S. melanostictus164177172157150132952
S. japonicus124136106878878619
Overlap11212484878572564
2018S. melanostictus656732322824248
S. japonicus757740413388354
Overlap656730312824245
2019S. melanostictus432730131325151
S. japonicus422732131326153
Overlap42272991325145
2020S. melanostictus505143484148281
S. japonicus374534313748232
Overlap324534303746224
2021S. melanostictus1101311131259183653
S. japonicus705232294247272
Overlap705230294045266
Note: The samples are the sum of the number of operation sites in each month from 2017 to 2021. “Overlap” refers to the total number of sites where both S. melanostictus and S. japonicus catches occur.
Table 2. Description of environmental predictors and associated data sources for isSDMs model development.
Variable (unit)NameTime FrameSpatial ResolutionSourceData Acquisition
T_0 m (°C)Sea surface temperatureJune to November 2017–20210.25°APDRChttp://apdrc.soest.hawaii.edu/las_ofes/v6/dataset?catitem=71 (accessed on 9 October 2023)
T_50 m (°C)Sea 50 m depth temperature
T_100 m (°C)Sea 100 m depth temperature
T_150 m (°C)Sea 150 m depth temperature
T_200 m (°C)Sea 200 m depth temperature
SSH (m)Sea surface height
SSS (‰)Sea surface salinityCMEMShttps://marine.copernicus.eu (accessed on 10 October 2023)
Chl.a (mg m−3)Chlorophyll a
U (m s−1)X-direction
V (m s−1)Y-direction
EKE (m s−1)Eddy kinetic energy
SSTASea surface temperature anomalyNOAAhttps://origin.cpc.ncep.noaa.gov/products/analysis_monitoring/ensostuff/ONI_v5.php (accessed on 10 October 2023)
ONIOcean Nino index
Disclaimer/Publisher’s Note: The statements, opinions and data contained in all publications are solely those of the individual author(s) and contributor(s) and not of MDPI and/or the editor(s). MDPI and/or the editor(s) disclaim responsibility for any injury to people or property resulting from any ideas, methods, instructions or products referred to in the content.

