Article

Population Genetics of the Asian Buffalo Leech (Hirudinaria manillensis) in Southern China Based on Mitochondrial Protein-Coding Genes

1
School of Life Sciences, Key Laboratory of Jiangxi Province for Functional Biology and Pollution Control in Red Soil Regions, Jinggangshan University, Ji’an 343009, China
2
School of Agriculture and Life Sciences, Kunming University, Kunming 650214, China
3
College of Biological Resource and Food Engineering, Qujing Normal University, Qujing 655011, China
4
College of Life Sciences, Jiangxi Normal University, Nanchang 330022, China
*
Authors to whom correspondence should be addressed.
Biology 2025, 14(8), 926; https://doi.org/10.3390/biology14080926
Submission received: 13 June 2025 / Revised: 19 July 2025 / Accepted: 22 July 2025 / Published: 23 July 2025
(This article belongs to the Special Issue Genetic Variability within and between Populations)

Simple Summary

Leeches are important segmented worms valued for medical and pharmaceutical uses. In this study, we investigated the population genetics of the Asian buffalo leech (Hirudinaria manillensis) from southern China using mitochondrial markers. We obtained complete genetic sequences of 13 genes from 74 leeches collected at seven locations. We found that haplotype diversity goes up as the gene length increases, while nucleotide diversity displayed an alternating pattern of low and high values. High haplotype diversity coupled with low nucleotide diversity across all populations indicates a historical population bottleneck followed by rapid growth and mutation buildup. Further analysis revealed moderate genetic differentiation, resolving populations into three primary divergence clusters: the oldest (Yunnan), intermediate (Guangxi), and youngest (Guangdong and Hainan). When examining population size changes over time, we identified five phases: initial growth, prolonged stability, a sharp decline, rapid regrowth, and a subsequent decrease. These shifts correlated with historical climate changes—particularly ice ages—which significantly influenced leech population sizes. This study provides key genetic insights to help conserve and utilize H. manillensis resources.

Abstract

Leeches hold significant medical and pharmaceutical value for antithrombotic treatments, yet their genetic diversity patterns remain poorly understood. We performed population genetic analyses on seven Hirudinaria manillensis populations from southern China using mitochondrial protein-coding genes (MitPCGs). Complete sequences of all 13 MitPCGs were obtained from 74 individuals. Haplotype diversity exhibited a logarithmic relationship with the gene length (R2 = 0.858, p < 0.001), while nucleotide diversity showed a near-perfect alternating low-high pattern (Z = 2.938, p = 0.003). Concatenated sequence analyses indicated high haplotype diversity (>0.5) and low nucleotide diversity (<0.005) across all populations, suggesting a historical bottleneck followed by rapid expansion and mutation accumulation. The haplotype network, haplotype phylogenetics, and genetic structure analyses revealed moderate genetic differentiation across populations, dividing them into three clades: a basal Yunnan population (YNHH), sub-basal Guangxi populations (GXGG, GXLZ, and GXYL), and distal Guangdong/Hainan populations (GDMM, GDZJ, and HNDA). Analysis of historical population demography revealed five phases from ancient to recent times (P1–5): growth, prolonged stability, rapid decline, rapid growth, and secondary decline. These phases correlate strongly with past climatic events, demonstrating that glacial–interglacial cycles profoundly impacted the leech’s effective population size. This study provides a key scientific basis for H. manillensis resource conservation and utilization.

1. Introduction

Leeches belong to the phylum Annelida, class Hirudinea. There are about 680 species of leeches in the world, and about 100 species in China [1,2]. Many species feed on mammalian blood and secrete various anticoagulant substances with significant medical and pharmaceutical applications [3]. Since the 17th century, European countries have widely employed the European medicinal leech (Hirudo medicinalis) in leech therapy to treat various inflammatory conditions or to prevent arterial thrombosis after surgical procedures, thereby improving surgical success rates [4]. In China, leeches are traditional medicinal agents valued for blood-breaking and stasis-dispelling properties, as well as for promoting menstruation [5]. They serve as principal components in numerous formulas for treating cardiovascular and peripheral vascular diseases [6,7].
Historically, leech research has primarily focused on the identification and application of anticoagulant components (such as hirudin, antistasin, and destabilase), with less attention paid to other biological or ecological aspects. Population genetics is a branch of genetics that studies the distribution, dynamics, and driving mechanisms of genetic variation within biological populations [8]. Geographical landscapes and climatic events stand as fundamental forces sculpting the genetic nature of animal life across evolutionary time. Vast mountain ranges, sprawling oceans, and meandering river systems, or even merely physical distance, have long acted as natural boundaries for fragmenting populations and limiting gene flow [9]. Meanwhile, climatic upheavals, from the icy pulses of Quaternary glaciations to the gradual warming of recent epochs, have driven sweeping demographic shifts [10]. Together, these geographical and climatic drivers have shaped not merely local variations but the broader patterns of genetic adaptation and biodiversity that define life’s evolutionary journey.
Conducting population genetic studies on leeches helps elucidate the characteristics and formation mechanisms of their genetic diversity, ultimately benefiting the utilization and conservation of leech genetic resources. Due to challenges such as difficult sample collection, current population genetic research on leeches remains relatively scarce. In 2012, Bielecki and Polok analyzed genetic variations in three leeches, Erpobdella testacea, Glossiphonia complanata, and Hemiclepis marginata, using RAPD (random amplified polymorphic DNA) assays, and found their gene diversity fell within ranges recorded in variable invertebrates [11]. In 2016, using TRAP (target region amplified polymorphism) and SSR (simple sequence repeat) markers, Liu et al. conducted analyses of genetic structure and genetic diversity on three leech species, Hirudo nipponia, Poecilobdella manillensis, and Whitmania pigra [12]. They discovered that these leeches exhibited high genetic diversity at the species level but low genetic diversity at the population level. Notably, these amplified fragment length polymorphism (AFLP) markers typically provide data for only a limited number of loci, making them inadequate for supporting complex population structure analyses. Furthermore, the genetic loci corresponding to these molecular markers exhibit significant species specificity, hindering comparative studies of population genetic characteristics across different species.
Mitochondria are present in the vast majority of eukaryotic cells and contain a mitochondrial genome independent of nuclear chromosomes. The animal mitochondrial genome generally comprises 13 protein-coding genes (MitPCGs) [13]. Due to their unique evolutionary characteristics, these genes serve as ideal molecular markers for population genetic studies [14]. With the development of sequencing technology, the mitochondrial genomes of various leeches have been reported [15]. However, there are few examples of using mitochondrial genes in leech population genetics research. In 2020, Yue et al. used the mitochondrial CYTB gene to analyze the genetic populations of W. pigra across Jiangsu, China. They found that this species exhibited high genetic diversity, low genetic differentiation among populations, and relatively stable historical population dynamics [16]. Recently, Popa et al. used mitochondrial COI as well as 12S markers to document the distribution of Hirudo verbana in Romania. Their study revealed that this species is currently undergoing population dispersal, with wetland coverage and elevation as the primary ecological variables influencing its distribution [17].
The Asian buffalo leech (Hirudinaria manillensis) is the representative species of the genus Hirudinaria within the family Hirudinidae. It is primarily distributed across Southeast Asian countries, including China, the Philippines, Malaysia, and Vietnam, deriving its specific epithet from its type locality in the Philippines [2]. This leech feeds on the blood of mammals such as water buffaloes (Bubalus bubalis) and exhibits a significantly larger body size compared to common medicinal leeches (Hirudo spp.). Its antithrombotic activity markedly surpasses that of commonly used medicinal leech species from the genera Hirudo and Whitmania [18]. Consequently, H. manillensis has long been regarded as a crucial zoological source of antithrombotic agents, extensively utilized in treating cardiovascular diseases. Recent studies reveal that H. manillensis possesses over 70 antithrombotic-related genes, indicating substantial development potential [19]. In China, its distribution encompasses provinces including Guangdong, Guangxi, Hainan, and Fujian [2]. However, wild populations have experienced dramatic declines in recent years due to intensified harvesting and environmental degradation. Current understanding of the population genetic characteristics of H. manillensis remains limited, constraining research, utilization, and conservation efforts for this medicinal organism. This study conducted genome resequencing on seven H. manillensis populations from southern China. MitPCGs were extracted from all individuals to perform analyses of genetic diversity, haplotype variation, genetic structure, and historical population dynamics. These investigations systematically characterize the population genetics of H. manillensis while providing a scientific foundation for utilizing its genetic resources.

2. Materials and Methods

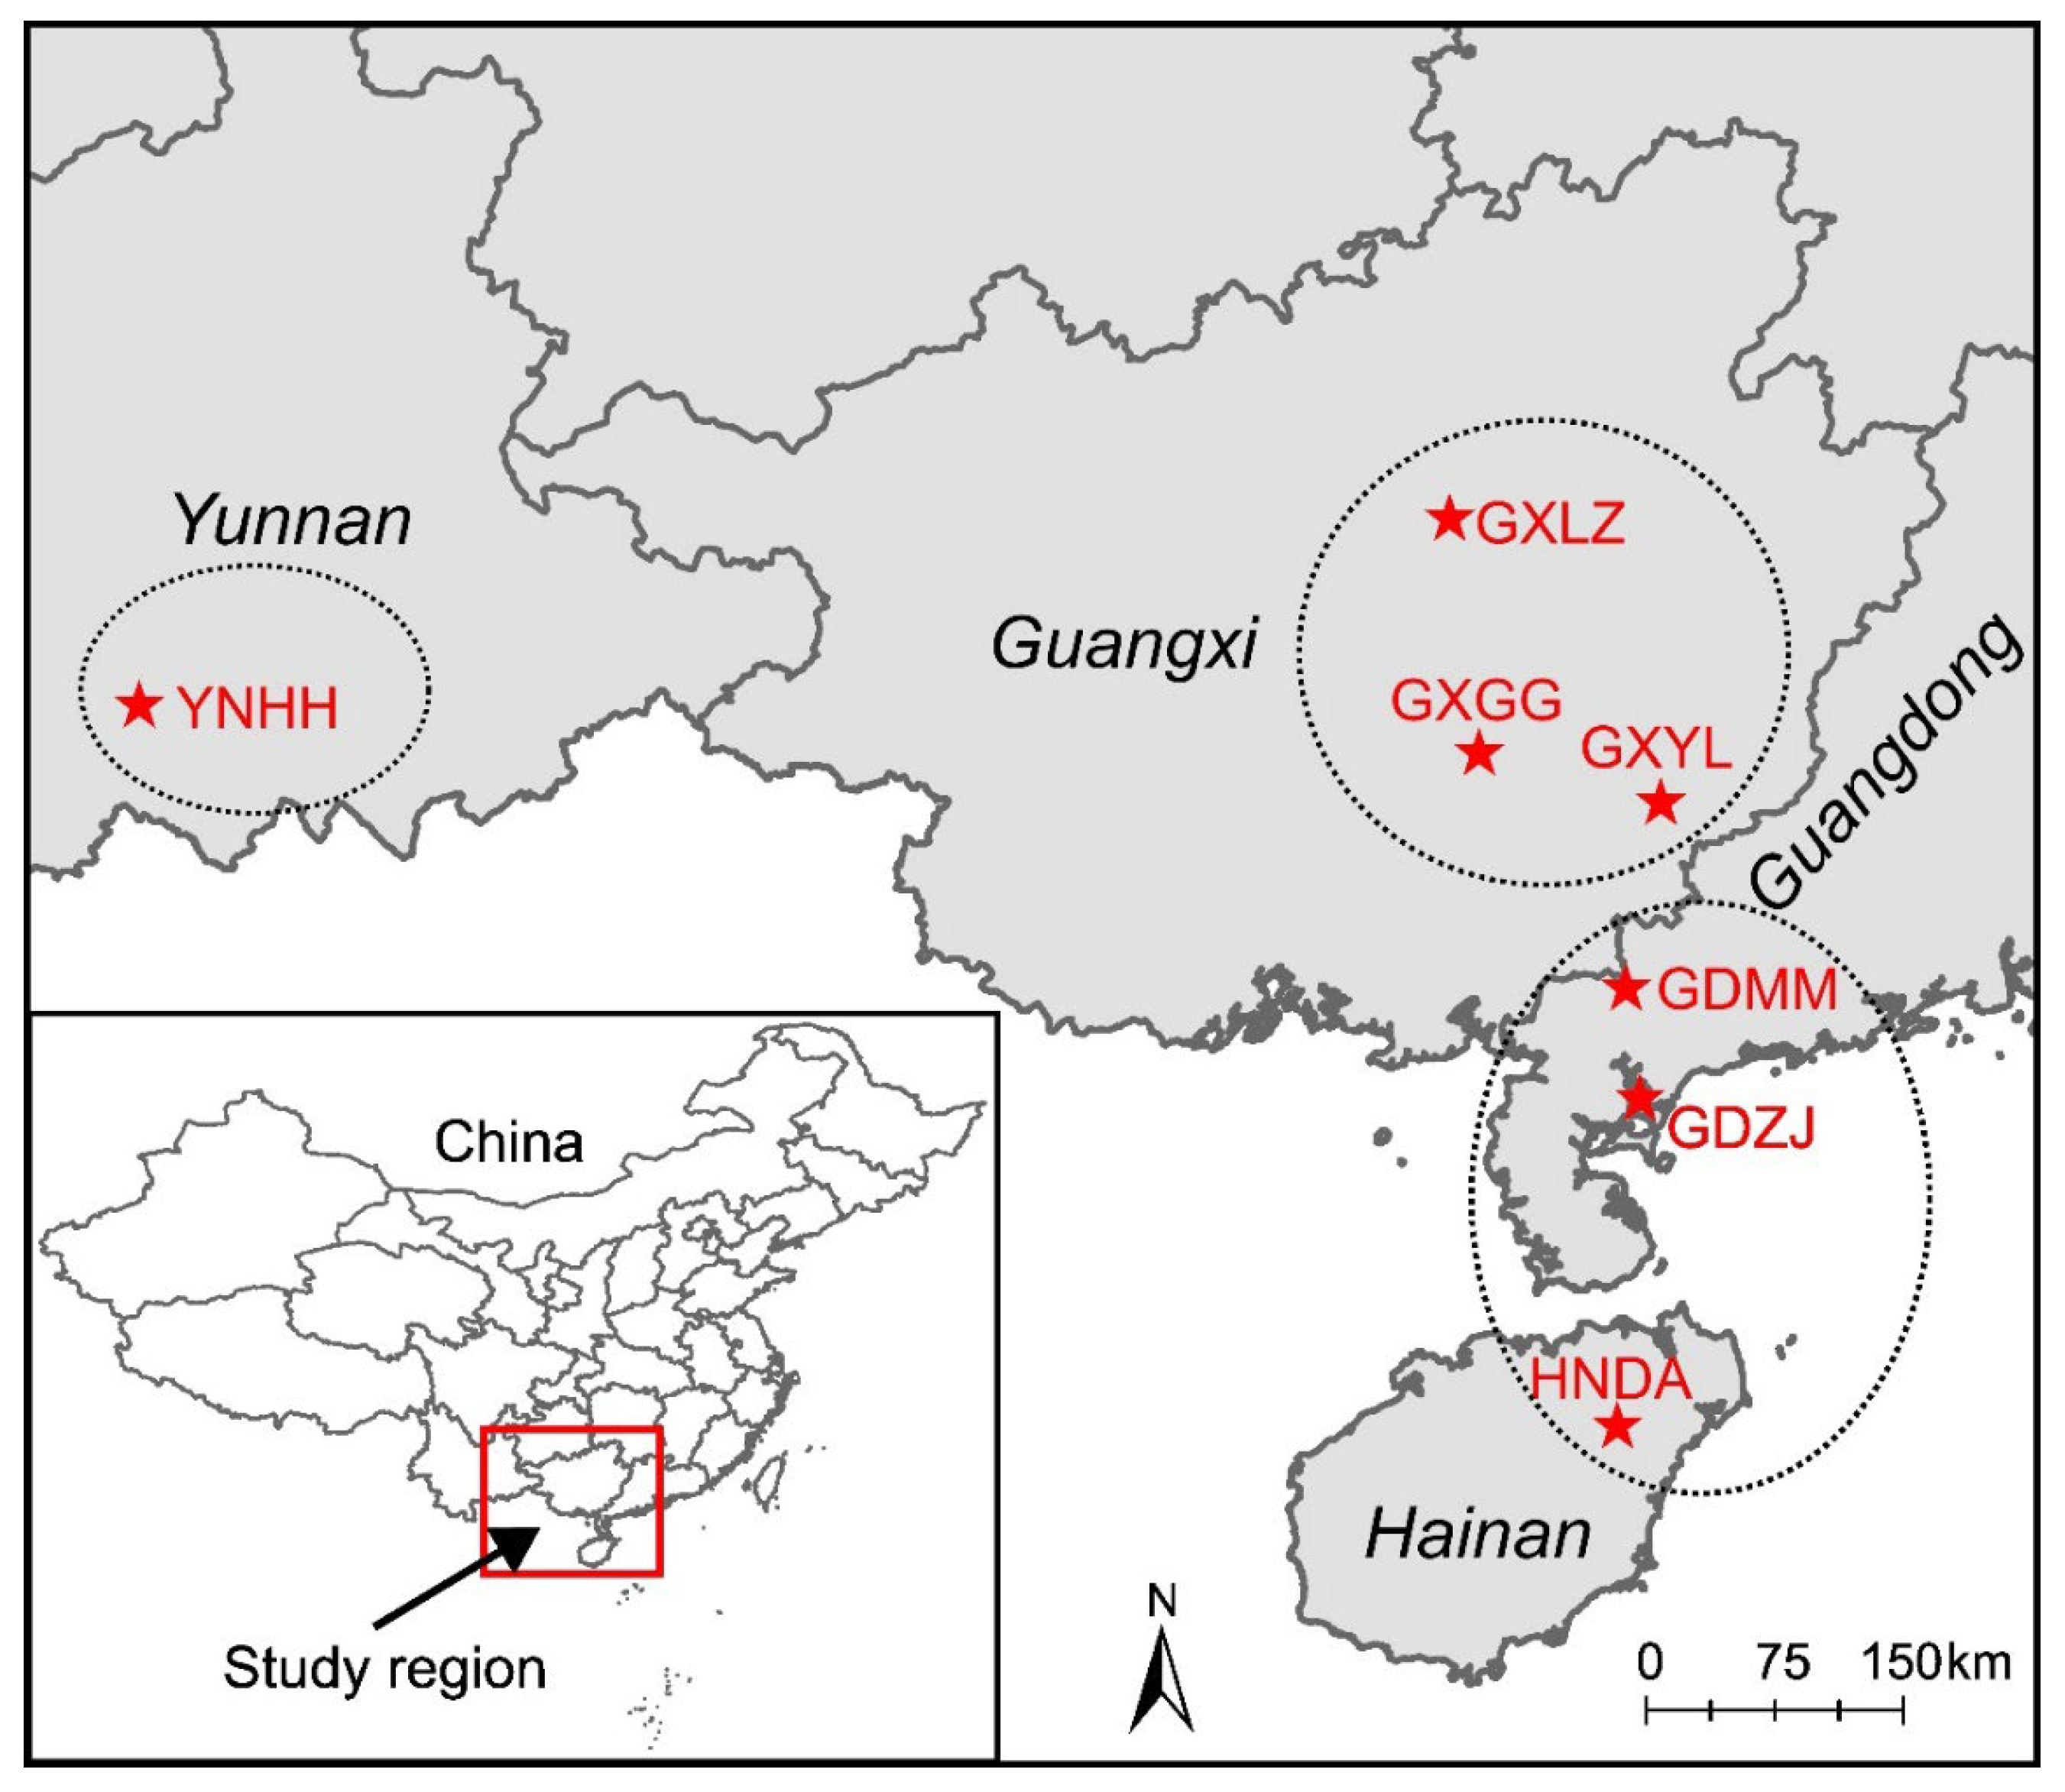
2.1. Sampling and Sequencing

Live specimens of H. manillensis were collected from seven populations across four provinces (Guangxi, Guangdong, Hainan, and Yunnan; see Table 1 and Figure 1) in June 2023. The specimens were identified morphologically according to the key table of Genus Hirudinaria in Fauna Sinica (Annelida Hirudinea) [2]. From each sampling site, 10–12 adult leeches were randomly selected. The anterior part of each specimen was excised, and total genomic DNA was extracted using the DNeasy Blood and Tissue Kit (QIAGEN, Düsseldorf, Germany). Qualified DNA extracts were used to construct ~350 bp libraries with Illumina-compatible reagents, followed by whole-genome resequencing (150 bp paired-end) on the BGISeq platform. Raw sequencing reads were processed with fastp v0.20.0 [20] to remove adapters and low-quality regions, generating clean reads for each sample that were subsequently used in downstream bioinformatic analyses.

2.2. MtPCGs Sequence Extraction

The clean reads from genome resequencing were de novo assembled using MEGAHIT v1.2.9 [21], generating contig sequence files for each sample. MtPCGs from the published H. manillensis mitochondrial genome (GenBank accession No. NC_023925.1) were served as bait sequences to retrieve homologous sequences from the unigenes files via BLAST v2.13.0+ [22]. Retrieved sequences were aligned using MEGA v11.0.13 [23], and homologous regions were extracted. Notably, due to high local variability in certain genes, some genomic reads failed to assemble despite being sequenced. For such cases, MIRAbait v4.9.6 [24] was used to extract homologous reads from the raw genomic data, followed by alignment and verification in MEGA.

2.3. Genetic Diversity Analysis

Coding sequences of each gene were merged into individual FASTA files. Multiple sequence alignment was performed using the “Align by MUSCLE” function in MEGA. DnaSP v6 [25] was employed to calculate the number of variable sites (VS), haplotype number (HN), haplotype diversity (Hd), and nucleotide diversity (Pi) for each gene. All MtPCGs were concatenated, and the same metrics were computed across different populations.

2.4. Network and Phylogenetic Analysis of Haplotypes

Concatenated MtPCGs were imported into HapSolutely v0.2.2 [26] to generate haplotype networks under the Fitchi model. All haplotype sequences were extracted from the concatenated using DnaSP. The MtPCGs of the closely related species Hirudinaria javanica were downloaded from GenBank (accession No. NC_061323.1). Using the concatenated MtPCGs of H. javanica as the outgroup, a maximum-likelihood phylogenetic tree was constructed with IQ-TREE v2.2.0 [27] with the best substitution model selected via ModelFinder (embedded in IQ-TREE) and 1000 bootstrap replicates. Resulting trees were visualized using FigTree v1.4.4 (http://tree.bio.ed.ac.uk/software/Figtree/, accessed on 10 April 2025) and edited in Inkscape v1.3 (https://inkscape.org, accessed on 10 April 2025).

2.5. Population Genetic Structure Analysis

The concatenated MtPCGs of all H. manillensis samples were used for structure analysis in STRUCTURE v2.3.4 [28] for K = 2 to K = 7. The parameters were the Length of the Burning Period = 5000, the Number of MCMC Reps after Burning = 50,000, and the Number of Iterations = 20. Results were summarized using structureHarvester [29], and Delta K values were calculated. Genetic structure plots were generated with the pophelper v2.3.1 R package [30]. AMOVA (Analyses of Molecular Variance) and pairwise genetic differentiations (FST values) of the populations were calculated using Arlequin v3.5 [31]. The number of permutations was set to be 1000, and the significance level was set to 0.05.

2.6. Population Dynamics

Population dynamics of H. manillensis were inferred using the Bayesian Skyline model in BEAST v1.10.4 [32]. First, the optimal nucleotide substitution model was determined by jModelTest v2.1.10 [33]. The alignment was then loaded into BEAUti v1.10.4 [32], and the following settings were used: Substitution Model, the best fit model from jModelTest; Base frequencies, Estimated; Clock Type, Uncorrelated relaxed lognormal clock (prior: fixed). Given the absence of estimated mitochondrial evolutionary rates for annelids, we used the “standard” mitochondrial substitution rate for invertebrates (1.15% substitutions per million years) [34,35].

3. Results

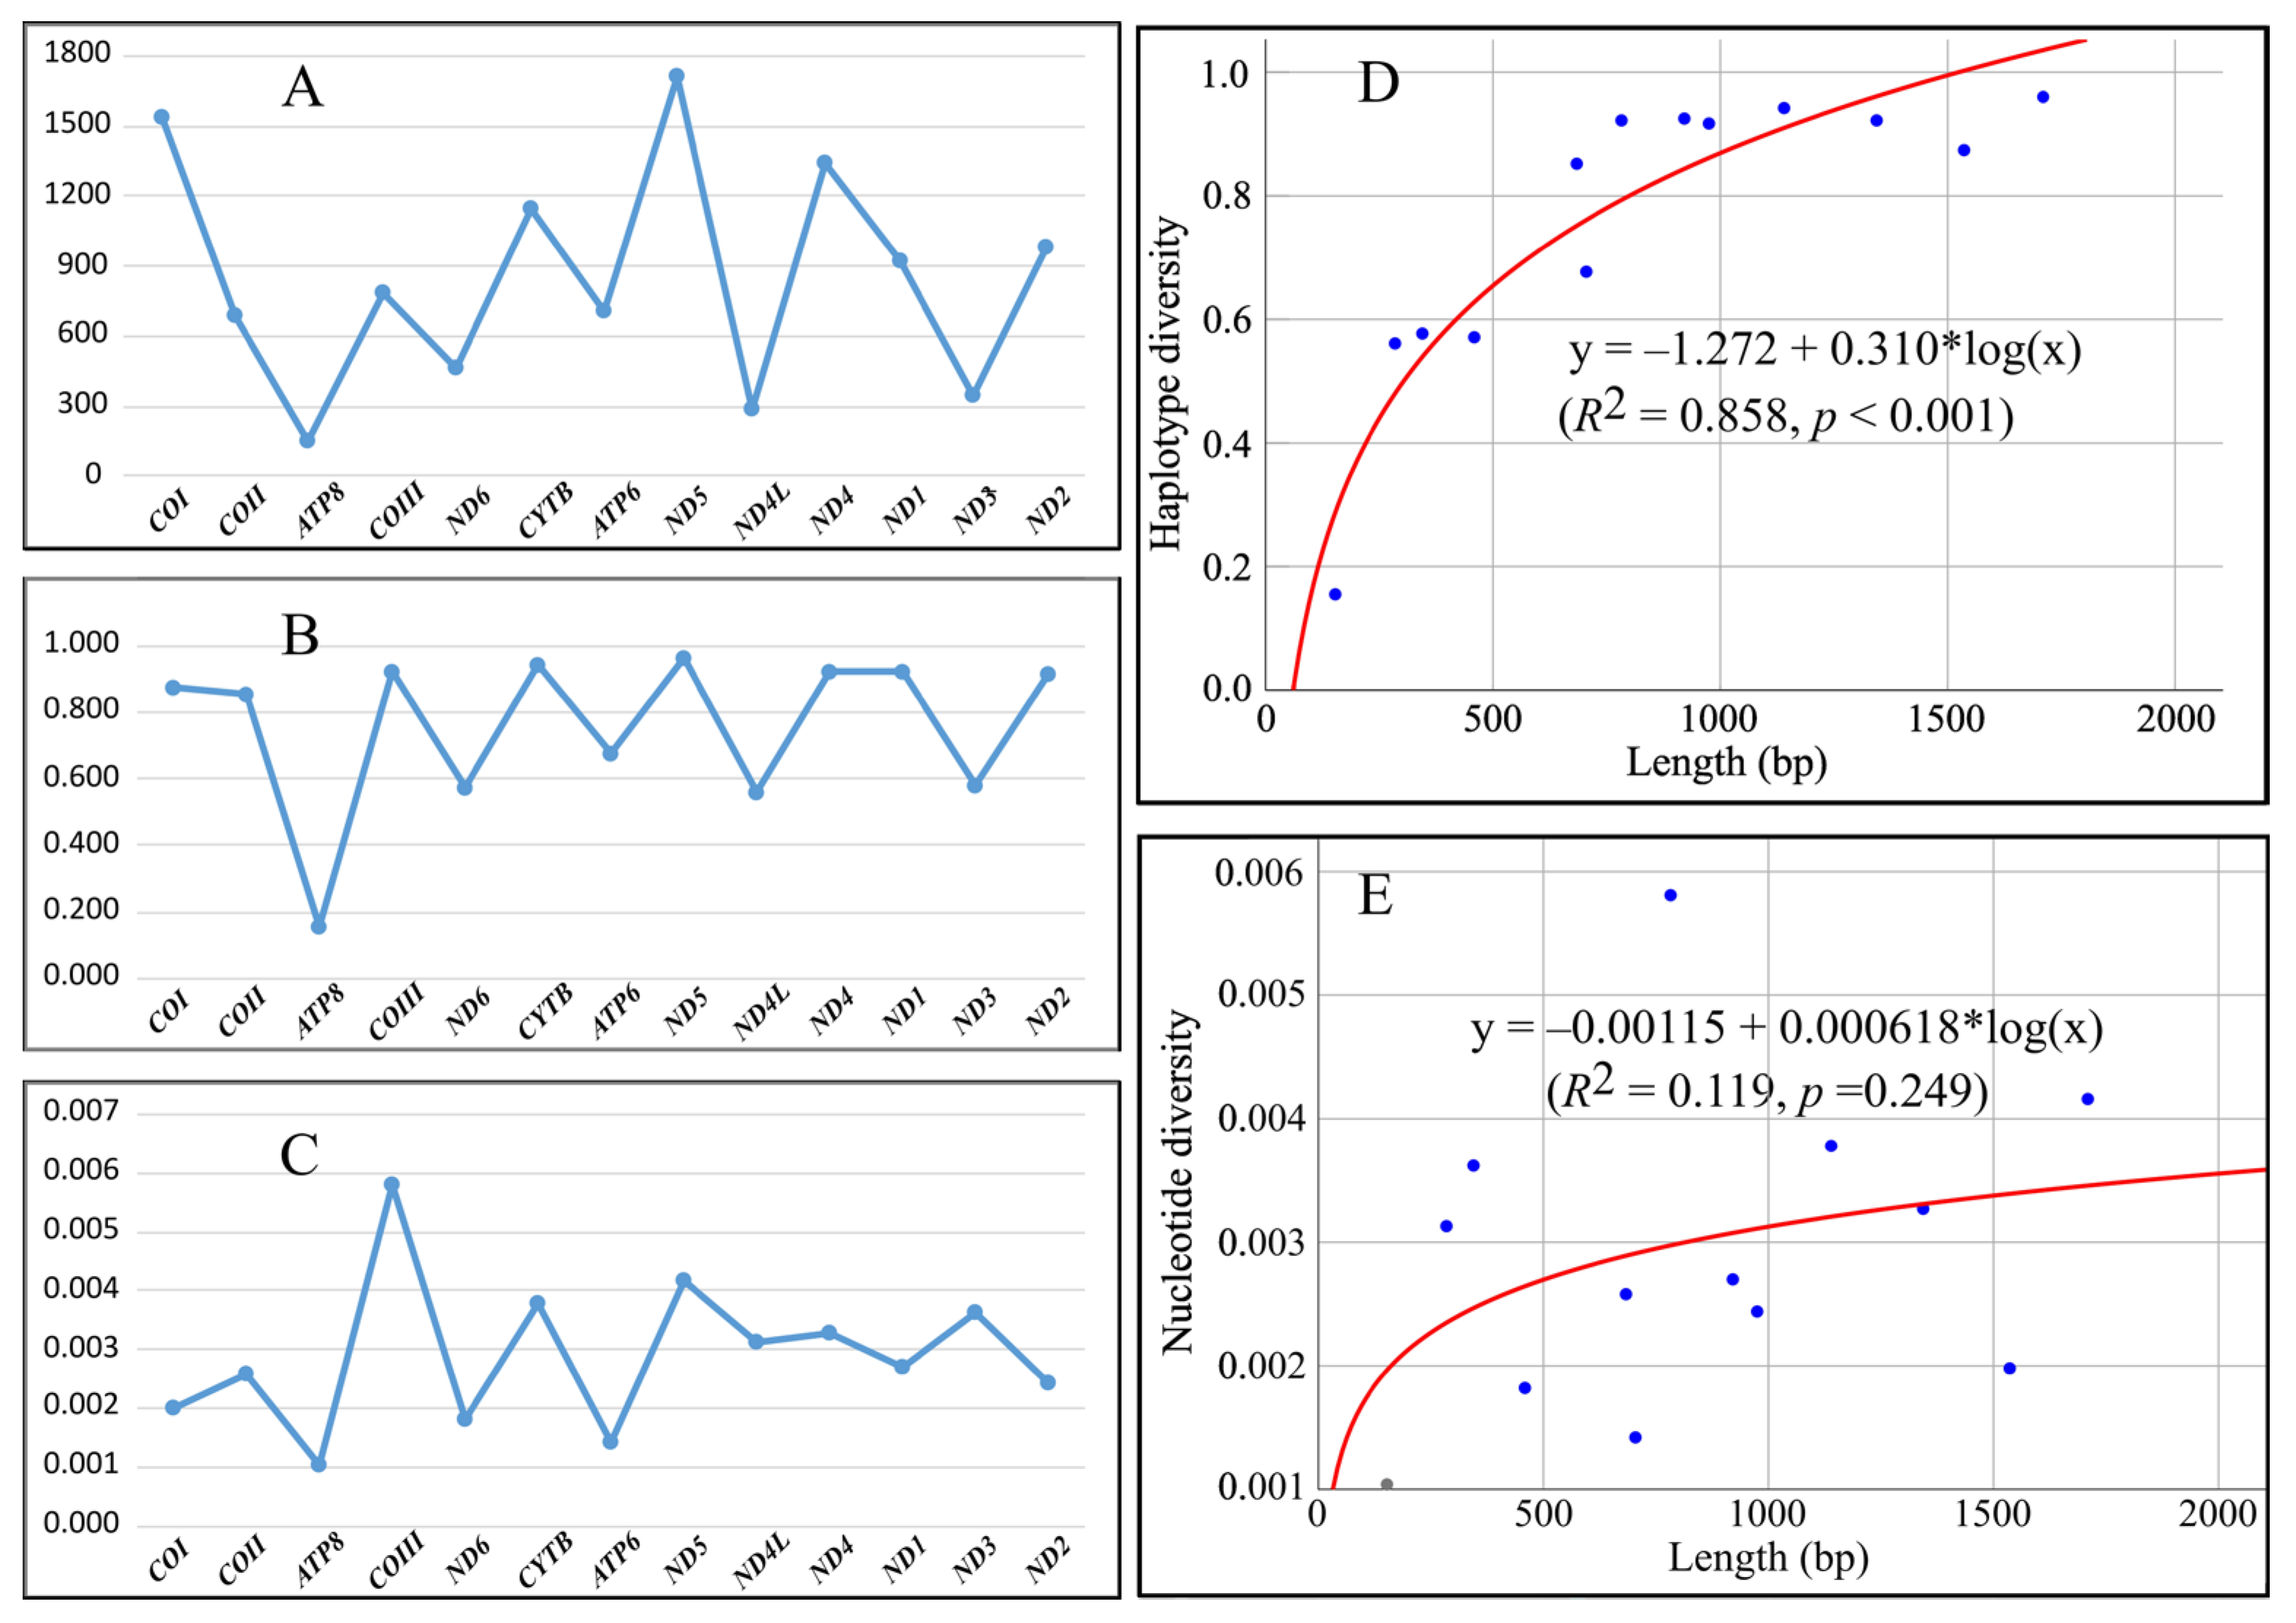
3.1. Sequence Variation in Different Genes

We obtained sequences of all MtPCGs from 74 samples across seven populations. Among these, ND5 was the longest gene (1710 bp), while ATP8 was the shortest (153 bp). The combined length of all 13 genes was 11,040 bp, with no insertion–deletion mutations detected. All sequence data have been deposited in Supplementary File S1. Alignment revealed substantial genetic variation: a total of 318 variable sites were identified, and each gene contained 3–66 variable sites and 4–36 haplotypes. Consistently, ND5 exhibited the highest number of variable sites and haplotypes, while ATP8 showed the lowest, indicating a strong influence of sequence length on variation. After length normalization, ND5 displayed the highest haplotype diversity, whereas ATP8 had the lowest. For nucleotide diversity, COIII ranked highest, followed by the longest gene, ND5, while the shortest, ATP8, remained the lowest (Table 2).
Interestingly, gene length, haplotype diversity, and nucleotide diversity exhibited periodic patterns (Figure 2A–C). After binarizing data (large values = 1, small values = 0), run tests showed near-significant (Z = 1.772, p = 0.076) deviation from randomness for gene length and haplotype diversity, while nucleotide diversity displayed highly significant deviation (Z = 2.938, p = 0.003), revealing a near-perfect “small-large-small-large” periodicity. Curve-fitting indicated that haplotype diversity followed a logarithmic relationship with the gene length (R2 = 0.858, p < 0.001), whereas nucleotide diversity showed a weak, non-significant correlation (R2 = 0.119, p > 0.05) (Figure 2D,E).

3.2. Population Genetic Diversity

Combining all MtPCGs, we calculated genetic diversity for the overall dataset and individual populations. A total of 61 haplotypes were identified. The overall haplotype diversity and nucleotide diversity were 0.989 and 0.00309, respectively. Population-specific analyses (Table 3) showed that all populations except YNHH had ≥ 59 variable sites, 9–10 haplotypes, Hd ≥ 0.970, and Pi ≥ 0.00180.

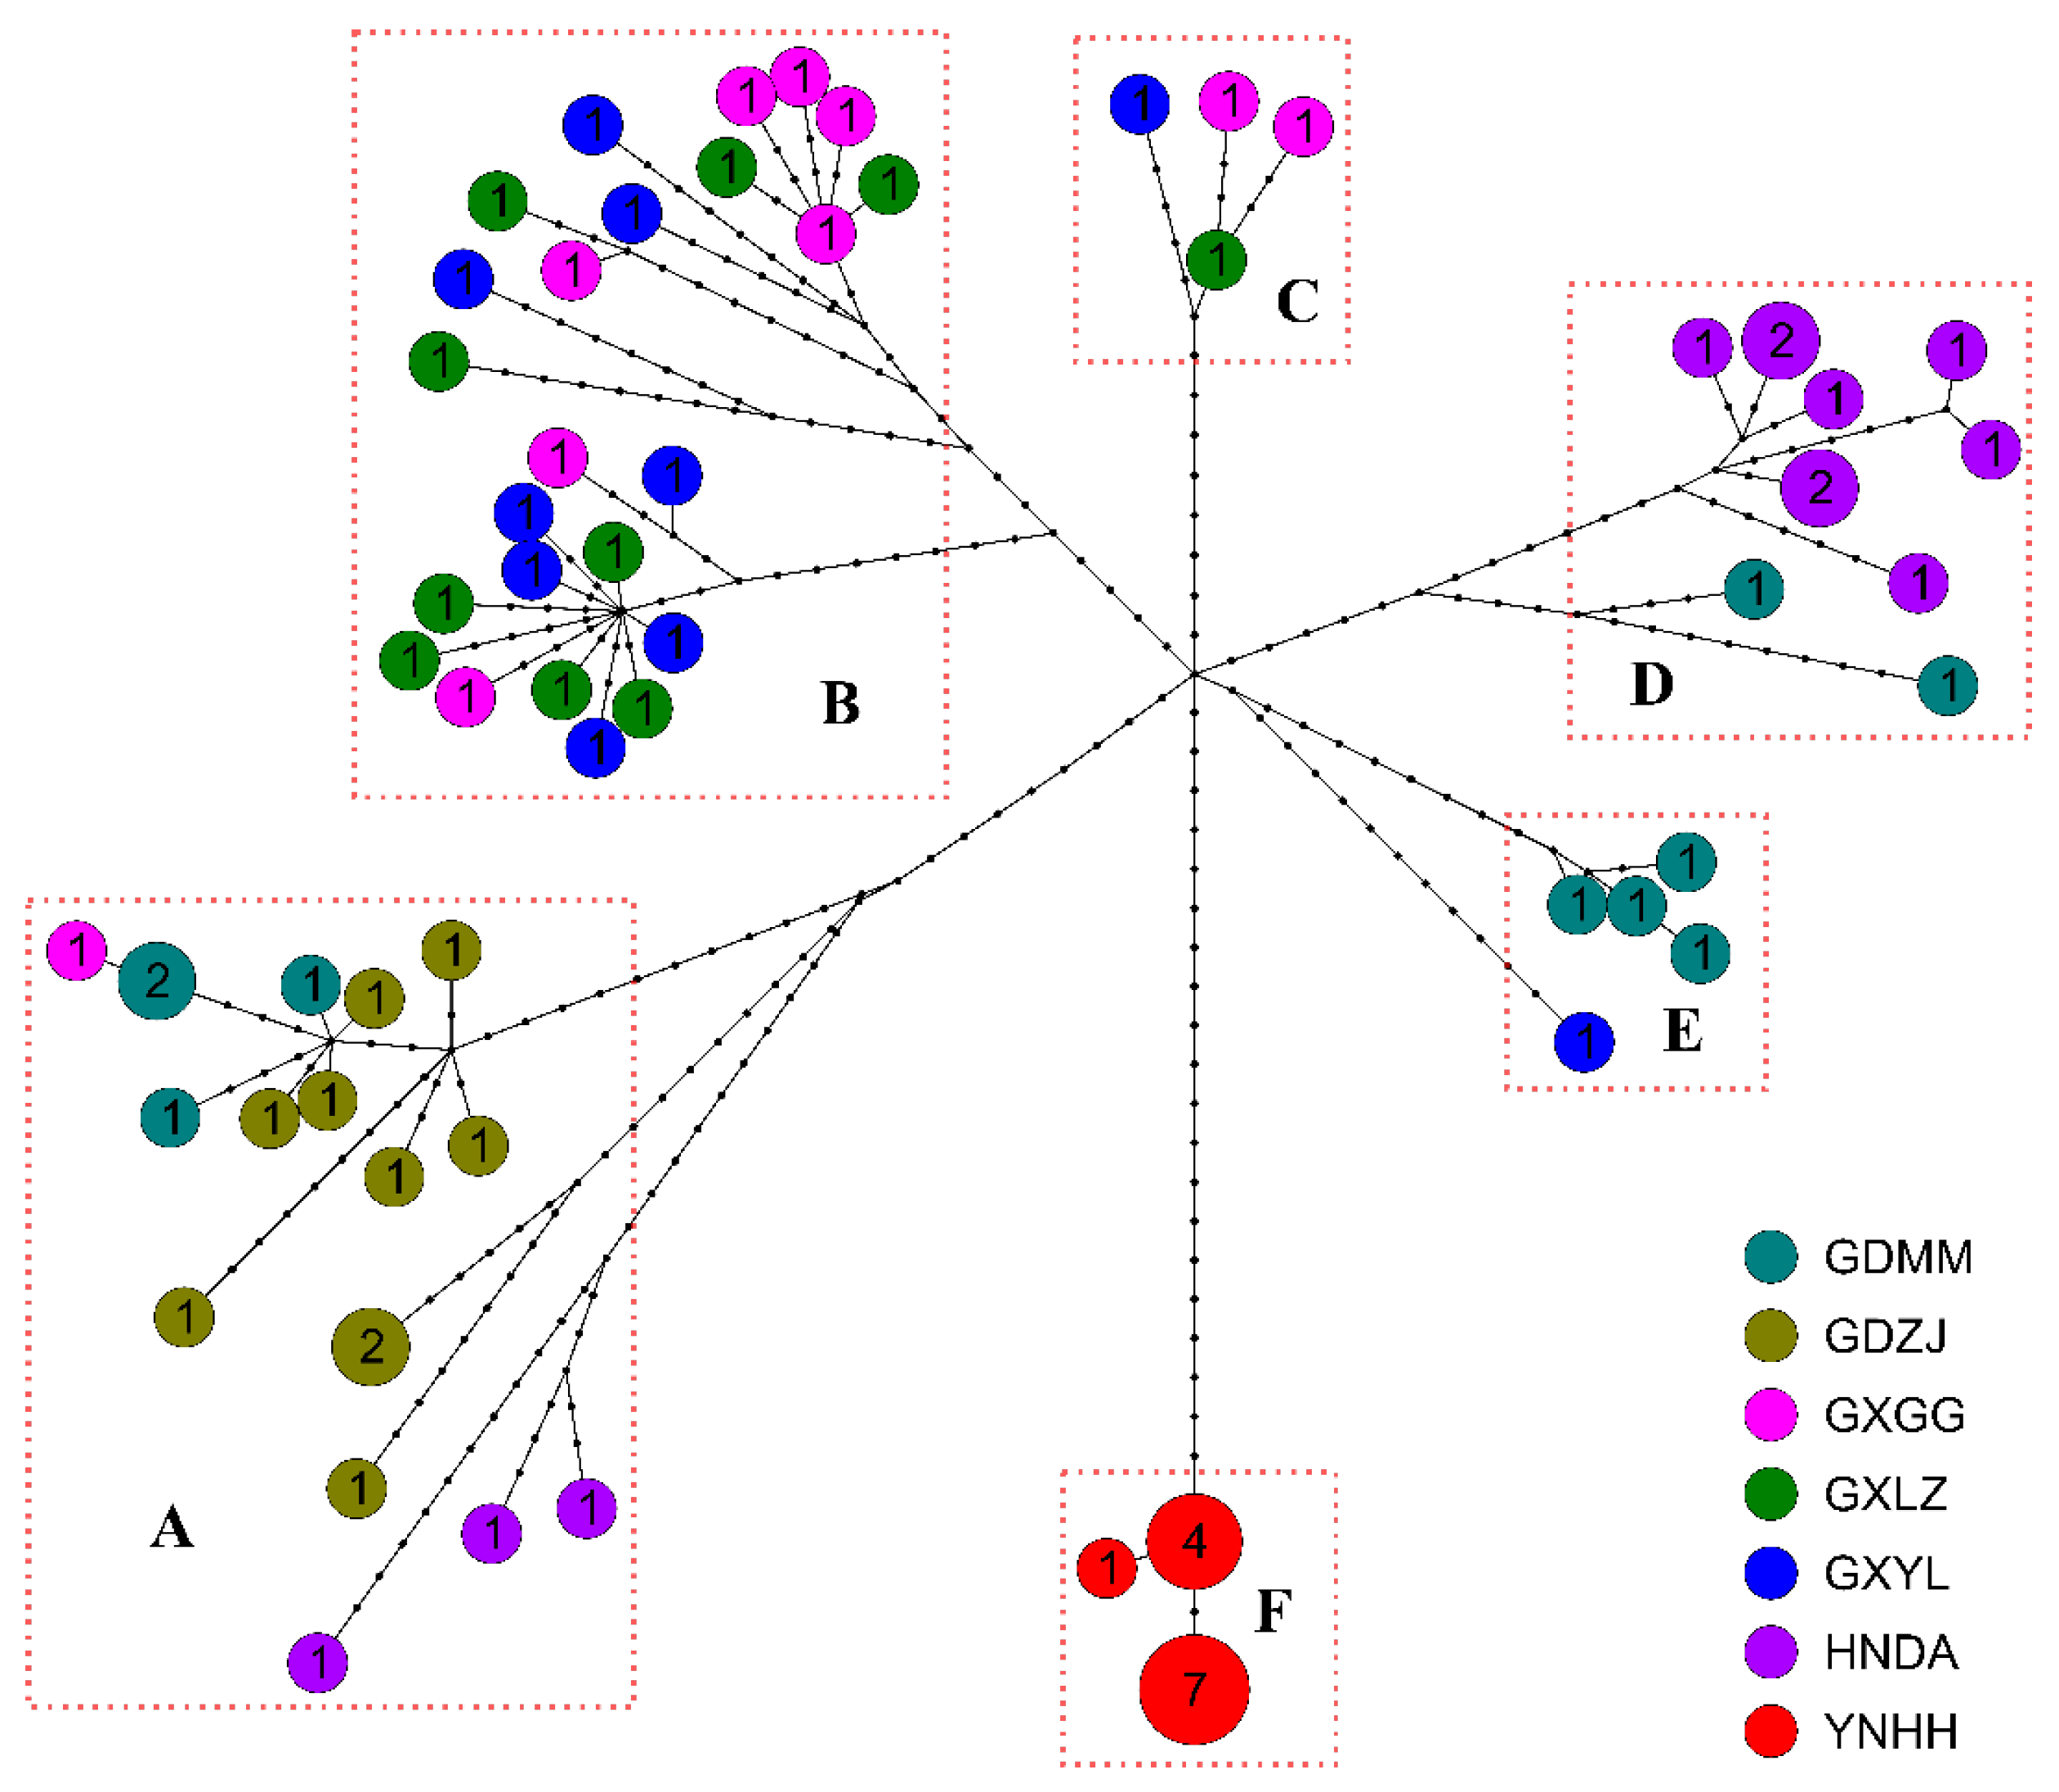
3.3. Haplotype Network Analysis

The haplotype network formed seven distinct branches (A–F) with a radial topology (Figure 3). Branch A predominantly comprised haplotypes from GDZJ, with partial contributions from GDMM, HNDA, and GXGG. Branch B included haplotypes from three Guangxi populations (GXYL, GXLZ, and GXGG). Branch C contained only four haplotypes but involved the same three Guangxi populations. Branch D combined GDMM and HNDA haplotypes. Branch E involved GDMM and GXYL. Branch F exclusively contained haplotypes from the YNHH population. Over 20 mutation steps were detected between each pair of branches, indicating a high degree of differentiation. Specifically, while the YNHH haplotypes were separated by more than 30 steps from those in other localities, only 1–2 mutation steps occurred within the YNHH branch (branch F).

3.4. Phylogenetic Analysis

Using H. javanica as the outgroup, phylogenetic analysis of H. manillensis haplotypes resolved four monophyletic clades (B1–B4). Clades B1–B3 received strong support (>90% bootstrap), while B4 had weak support (45%) (Figure 4). Clade B1 (basal position) consisted solely of three YNHH haplotypes. Clade B2 (sub-basal position) contained four haplotypes from Guangxi populations (GXYL, GXLZ, and GXGG). Sister clades B3 and B4 were recovered: B3 (similar to B2) included 24 Guangxi haplotypes (GXYL, GXLZ, and GXGG), while B4 comprised 29 haplotypes from GDMM, HNDA, and GXGG, plus one exception (haplotype H24 from GXGG).

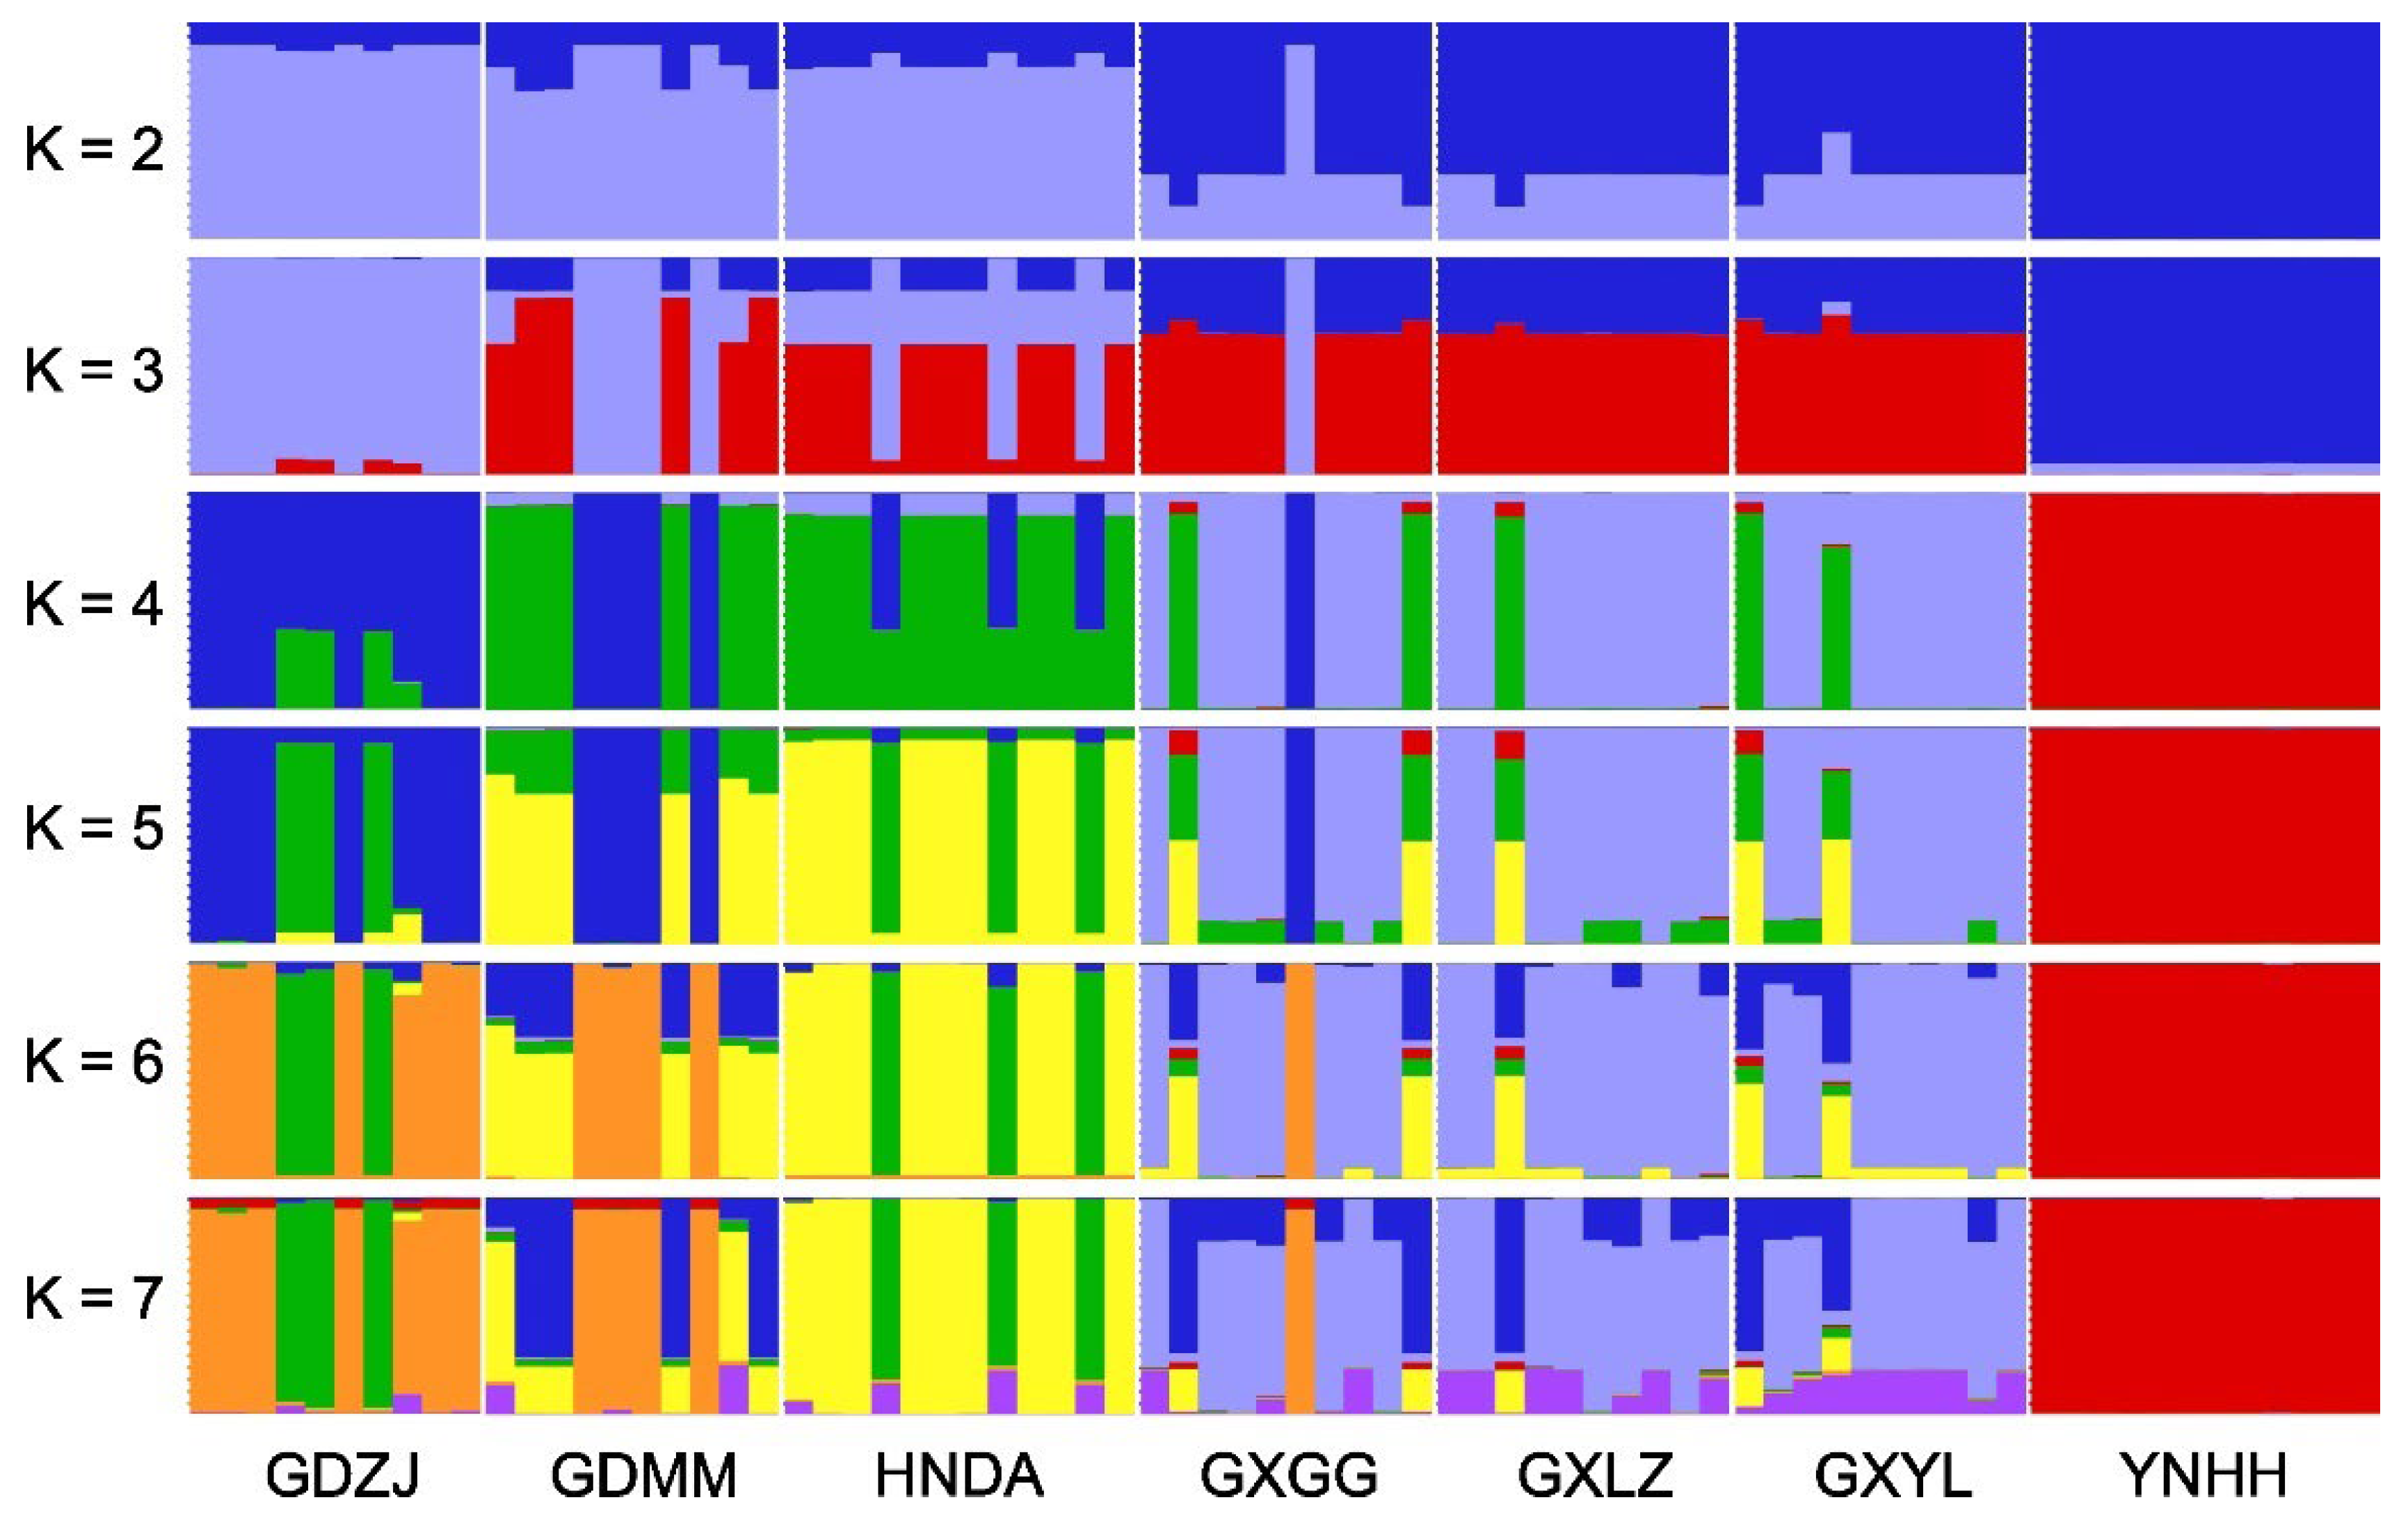
3.5. Genetic Structure and Genetic Differentiation

As shown in Figure 5, the STRUCTURE analysis revealed a turning point at K = 3 (Delta K = 2.309). Across all clustering strategies (K = 2–7), individuals from the YNHH population showed no shared genetic information with other populations, indicating distinct genetic characteristics. Meanwhile, the three populations from Guangxi Province (GXGG, GXLZ, and GXYL) consistently exhibited highly similar genetic compositions across all K-values, suggesting shared genetic backgrounds with minimal differentiation. At K = 2–3, populations GDZJ, GDMM, and HNDA displayed close genetic affinities, with GDZJ showing lower genetic complexity. At K ≥ 4, these three populations exhibited overlapping genetic features, implying limited differentiation.
AMOVA results indicated that 46.26% of the genetic variation occurred between populations, while 53.74% occurred within populations. Combined with the significant result (p < 0.001), this suggests moderate genetic differentiation among populations. Pairwise genetic differentiation analysis (Table 4) revealed significantly high FST values (>0.6) between YNHH and all other populations, confirming substantial divergence. Conversely, the three Guangxi populations (GXGG, GXLZ, and GXYL) showed negligible genetic differentiation (FST ≤ 0.010, p > 0.05). Populations GDZJ, GDMM, and HNDA showed significant but moderate differentiation (FST ≤ 0.5), consistent with limited divergence. These results align closely with the phylogenetic and STRUCTURE analysis. Collectively, the seven populations form three genetic clusters: a basal cluster (YNHH), a sub-basal cluster (GXGG, GXLZ, and GXYL), and a distal cluster (GDZJ, GDMM, and HNDA).

3.6. Historical Population Dynamics

Model selection identified HKY+I as the optimal model for reconstructing the historical demography of H. manillensis using coalescent theory. Based on climatic events, population dynamics (Figure 6) were divided into five phases (P1–P5): P1 (133–115 kya, kiloyear ago), population expansion, coinciding with the Eemian Interglacial (130–115 kya) [36], suggesting warm interglacial conditions drove sustained growth. P2 (115–26.5 kya), stabilization during the early-to-mid Last Glacial Period (110–26.5 kya) [37], where persistent cooling halted population growth. P3 (26–18 kya), a decline during the Last Glacial Maximum (LGM) during 26.5–19 or 24–17 kya [38,39], with abrupt cooling causing a sharp population reduction. P4 (19–7 kya), rapid expansion post-LGM, linked to climatic warming [38,39]. P5 (7 kya–present), rapid decline associated with gradual global cooling and intensified anthropogenic impacts after 7 kya [40].

4. Discussion

This study extracted all MtPCGs from 74 H. manillensis individuals across seven populations using genome resequencing and assembly, followed by population genetic analyses. Analysis of overall genetic variation revealed significant differences in variation levels among genes. Interestingly, both haplotype diversity and nucleotide diversity exhibited periodic fluctuations. Further investigation showed that the lengths of these 13 genes also followed periodic changes, with haplotype diversity demonstrating an almost perfect logarithmic increase relative to gene length, indicating gene length as a key determinant of haplotype diversity.
Haplotype diversity is defined as the probability that two randomly sampled sequences differ [41]. Theoretically, longer sequences increase the probability of divergence between two randomly selected sequences. Thus, the strong positive correlation between haplotype diversity and gene length aligns with expectations. Conversely, nucleotide diversity is defined as the average number of nucleotide differences per site in pairwise sequence comparisons [41], a metric inherently independent of sequence length. Consequently, the weak correlation between nucleotide diversity and gene length suggests uneven evolutionary rates among genes. Strikingly, the nucleotide diversity values of the 13 MtPCGs exhibited a near-perfect periodic pattern of alternating low and high values—a phenomenon unreported previously, warranting further investigation into its mechanism.
Analysis based on concatenated MtPCGs revealed haplotype diversity > 0.5 and nucleotide diversity < 0.005 across all populations. According to Grant and Bowen [42], this pattern indicates a “population bottleneck followed by rapid population growth and accumulation of mutations.” This aligns with historical demographic analyses, which confirm that H. manillensis experienced a short-term population decline during the Last Glacial Maximum, followed by rapid expansion. Our historical population dynamic reconstruction further details distinct phases: population growth (P1), prolonged stability (P2), rapid decline (P3), rapid growth (P4), and secondary decline (P5)—all closely correlated with historical climatic events. As blood-feeding organisms, their survival depends critically on host abundance. Glacial–interglacial cycles profoundly impacted faunal dynamics, inevitably influencing the leech’s effective population size [43]. This highlights blood-feeding animals as valuable models for studying species-environment historical interactions.
Haplotype network analysis revealed seven star-like haplogroups. While most comprised individuals from multiple populations, Group F consisted exclusively of YNHH specimens from Yunnan Province. Crucially, >30 mutation steps separated YNHH haplotypes from all other populations, whereas only 1–2 mutation steps occurred within this group, indicating marked genetic isolation in this population. Genetic structure analysis further indicated that YNHH was genetically distinct, three Guangxi populations (GXGG, GXLZ, and GXYL) were inseparable, and the remaining three (GDZJ, GDMM, and HNDA) showed minor differentiation. Integrating with haplotype network, phylogenetic, and genetic structure results, these populations could be placed into three groups: the earliest diverging Yunnan population (YNHH), intermediate Guangxi populations (GXGG, GXLZ, and GXYL), and most recent Guangdong/Hainan populations (GDMM, GDZJ, and HNDA) (Figure 1).
It should be noted that some nodes in the haplotype-based phylogenetic tree exhibited weak support (<75% bootstrap values, a common threshold in genetic studies). Additionally, AMOVA revealed that under half of the genetic variation occurred between populations. Together, these results indicate moderate genetic differentiation among H. manillensis populations, which appears directly influenced by geographical factors. For example, the isolation of the YNHH population is expected given its distant location, while haplotypes from the three Guangxi populations (GXGG, GXLZ, and GXYL) were closely related, likely due to their geographic proximity. Surprisingly, however, HNDA (Hainan Island) exhibited low genetic differentiation from mainland populations (GDZJ and GDMM). As freshwater organisms, H. manillensis cannot traverse the 20-km-wide Qiongzhou Strait [44] via swimming or marine fish parasitism. However, paleoclimate studies indicate a 130–150 m sea-level drop during the LGM [45], transforming the strait into land [46]. We propose that leeches dispersed to Hainan during this period. If confirmed, this would indicate that climatic events not only shaped historical population dynamics but also influenced genetic structure of H. manillensis.
As a crucial antithrombotic medicinal resource, geographic authenticity is a key quality indicator. Previous research revealed significant divergence in hirudin sequences and expression levels among populations [47]. Clarifying phylogenetic relationships is thus essential for authenticity evaluation. Haplotype-based phylogeny placed the YNHH population at the basal position, followed by divergence of Guangxi populations and later southern Guangdong/Hainan populations. Future work will compare antithrombotic protein activities across these regions to establish scientific authenticity criteria. Yunnan Province, China’s richest Hirudinaria diversity hotspot, harbors three previously reported species: H. javanica, H. similis, and H. yunnanensis [48]. Our study reports the first wild H. manillensis population in Yunnan, reinforcing this region’s status as a Hirudinaria diversity center. Given the basal position of YNHH, we hypothesize Yunnan as the origin of H. manillensis. Notably, YNHH showed lower genetic diversity and pronounced differentiation from other populations, warranting priority in conservation genetics efforts.
As noted above, H. manillensis is distributed across multiple Asian countries. However, due to the difficulty of sampling wild populations, this study was restricted to seven locations in southern China. The limited sample size and geographical scope may have resulted in an underestimation of the species’ genetic diversity. Future studies will expand sampling across a broader geographic range to better assess both its genetic diversity and population structure.

5. Conclusions

This study reveals significant genetic diversity patterns among different MitPCGs and among populations of H. manillensis across southern China. The haplotype diversity showed a logarithmic pattern with gene length, while nucleotide diversity displayed an alternating pattern of low and high values. The high haplotype diversity coupled with low nucleotide diversity indicates a historical population bottleneck followed by rapid expansion and mutation accumulation. Phylogenetic and genetic structure analyses delineate three distinct population groups: the ancient Yunnan lineage, intermediate Guangxi populations, and the more recently diverged Guangdong/Hainan group. Crucially, historical demographic reconstructions identify five population phases (growth, stability, decline, rapid growth, and later decline) that align closely with past climatic oscillations, particularly ice age cycles. These findings demonstrate that paleoclimate dynamics profoundly shaped the species’ population size and structure. This research provides essential genetic insights for the informed conservation and sustainable utilization of this medicinally valuable leech species.

Supplementary Materials

The following supporting information can be downloaded at https://www.mdpi.com/article/10.3390/biology14080926/s1, File S1: all MitPCGs of the 74 H. manillensis samples.

Author Contributions

Conceptualization, G.L., L.T. and F.Z.; Formal analysis, J.Y., W.Z. and L.T.; Funding acquisition, G.L., Z.H., H.C. and L.T.; Investigation, G.L., J.Y., W.Z., Z.H. and Z.L.; Methodology, G.L., J.Y., Z.L., H.C. and L.T.; Resources, G.L., Z.L., H.C. and Z.L.; Supervision, G.L., L.T. and F.Z.; Validation, G.L., L.T. and F.Z.; Visualization, G.L., Z.H., L.T. and F.Z.; Writing—original draft, G.L., J.Y. and F.Z.; Writing—review and editing, G.L., L.T. and F.Z.; Data curation, G.L., Z.H. and L.T.; Project administration, G.L., L.T. and F.Z. All authors have read and agreed to the published version of the manuscript.

Funding

This research was funded by the National Natural Science Foundation of China (No. 82260742 and 32460304), the Foundation of Yunnan International Joint Laboratory with South and Southeast Asia for the Integrated Development of Animal-derived Antithrombosis Chinese Medicine (No. 202503AP140025), and the Foundation of Key Laboratory of Jiangxi Province for Functional Biology and Pollution Control in Red Soil Regions (2023SSY02051).

Institutional Review Board Statement

Not applicable.

Informed Consent Statement

Not applicable.

Data Availability Statement

Data are contained within the article and Supplementary Files.

Conflicts of Interest

The authors declare no conflicts of interest.

Abbreviations

MitPCGsmitochondrial protein-coding genes
VSnumber of variable sites
HNnumber of haplotypes
Hdhaplotype diversity
Pinucleotide diversity
SDstandard deviation

References

  1. Sket, B.; Trontelj, P. Global diversity of leeches (Hirudinea) in freshwater. Hydrobiologia 2008, 595, 129–137. [Google Scholar] [CrossRef]
  2. Yang, T. Fauna Sinica (Annelida Hirudinea); Science Press: Beijing, China, 1996. [Google Scholar]
  3. Ma, C.J.; Li, X.; Chen, H. Research progress in the use of leeches for medical purposes. Tradit. Med. Res. 2021, 6, 56–69. [Google Scholar] [CrossRef]
  4. Sig, A.K.; Guney, M.; Uskudar Guclu, A.; Ozmen, E. Medicinal leech therapy—An overall perspective. Integr. Med. Res. 2017, 6, 337–343. [Google Scholar] [CrossRef] [PubMed]
  5. Guan, S.; Yuan, Z.; Zhou, Y.; Zhang, Y.; Ye, X.; Hu, B. Comparative studies on anti-thrombus and anti-coagulation effects of Hirudo of different species. Chin. J. Hosp. Pharm. 2012, 32, 1093–1096. [Google Scholar] [CrossRef]
  6. Wang, L. 300 Effective Prescriptions for Cardiovascular Diseases: A Collection of Effective Prescriptions in Various Clinical Departments; Science and Technology Literature Press: Beijing, China, 2000. [Google Scholar]
  7. Xu, S.; Wang, X. A Collection of Effective Formulas for Various Clinical Departments—400 Effective Formulas for Peripheral Vascular Diseases; Science and Technology Literature Press: Beijing, China, 2006. [Google Scholar]
  8. Gillespie, J.H. Population Genetics: A Concise Guide, 2nd ed.; Johns Hopkins University Press: Baltimore, MD, USA, 2004. [Google Scholar]
  9. Jensen, A.J.; Cove, M.V.; Goldstein, B.R.; Kays, R.; Mcshea, W.; Pacifici, K.; Rooney, B.; Kierepka, E.J.G.E. Geographic barriers but not life history traits shape the phylogeography of North American mammals. Glob. Ecol. Biogeogr. 2024, 33, e13875. [Google Scholar] [CrossRef]
  10. Li, Z.; Fan, H.; Liao, Z.; Wang, Y.; Wei, F. Global spatiotemporal patterns of demographic fluctuations in terrestrial vertebrates during the Late Pleistocene. Sci. Adv. 2025, 11, eadq3938. [Google Scholar] [CrossRef]
  11. Bielecki, A.; Polok, K. Genetic variation and species identification among selected leeches (Hirudinea) revealed by RAPD markers. Biologia 2012, 67, 721–730. [Google Scholar] [CrossRef]
  12. Liu, F.; Guo, Q.S.; Shi, H.Z.; Cheng, B.X.; Lu, Y.X.; Gou, L.; Wang, J.; Shen, W.B.; Yan, S.M.; Wu, M.J. Genetic variation in Whitmania pigra, Hirudo nipponica and Poecilobdella manillensis, three endemic and endangered species in China using SSR and TRAP markers. Gene 2016, 579, 172–182. [Google Scholar] [CrossRef]
  13. Struck, T.H.; Golombek, A.; Hoesel, C.; Dimitrov, D.; Elgetany, A.H. Mitochondrial genome evolution in annelida-A systematic study on conservative and variable gene orders and the factors influencing its evolution. Syst. Biol. 2023, 72, 925–945. [Google Scholar] [CrossRef]
  14. Sodhi, M.; Sobti, R.C.; Mukesh, M. Chapter 3—Mitochondrial DNA: A tool for elucidating molecular phylogenetics and population. In Advances in Animal Experimentation and Modeling; Sobti, R.C., Ed.; Academic Press: Cambridge, MA, USA, 2022; pp. 27–38. [Google Scholar]
  15. Jin, P.; Tian, Y.; Zang, E.; Zeng, L.; Zhang, Z.; Liu, J.; Shi, L. Complete mitochondrial DNA sequence of Alboglossiphonia lata Oka, 1910 (Rhynchobdellida: Glossiphoniidae) and its phylogenetic analysis. Mitochondrial DNA Part B 2024, 9, 652–656. [Google Scholar] [CrossRef]
  16. Yue, L.; Xiong, L.; Wang, S.; Wang, Q.; Wang, M.; Chen, H. Genetic diversity analysis of three populations of Whitmania pigra Whitman based on mitochondrial Cytb gene. J. Shanghai Ocean Univ. 2020, 29, 9–16. [Google Scholar] [CrossRef]
  17. Popa, O.P.; Ștefan, A.; Baltag, E.Ș.; Stratan, A.A.; Popa, L.O.; Surugiu, V. High genetic diversity of Hirudo verbana Carena, 1820 (Annelida: Hirudinea: Hirudinidae) in Romania confirms that the Balkans are refugia within refugium. Diversity 2024, 16, 726. [Google Scholar] [CrossRef]
  18. Zhang, B.; Wang, B.; Gong, Y.; Yu, X.; Lv, J. Anticoagulant active substances extraction and anti-thrombin activity analysis of several species of leeches. Acta Sci. Nat. Univ. Sunyatseni 2012, 51, 92–96. [Google Scholar]
  19. Liu, Z.; Zhao, F.; Huang, Z.; Hu, Q.; Meng, R.; Lin, Y.; Qi, J.; Lin, G. Revisiting the Asian buffalo leech (Hirudinaria manillensis) genome: Focus on antithrombotic genes and their corresponding proteins. Genes 2023, 14, 2068. [Google Scholar] [CrossRef] [PubMed]
  20. Chen, S.; Zhou, Y.; Chen, Y.; Gu, J. fastp: An ultra-fast all-in-one FASTQ preprocessor. Bioinformatics 2018, 34, i884–i890. [Google Scholar] [CrossRef]
  21. Li, D.; Liu, C.M.; Luo, R.; Sadakane, K.; Lam, T.W. MEGAHIT: An ultra-fast single-node solution for large and complex metagenomics assembly via succinct de Bruijn graph. Bioinformatics 2015, 31, 1674–1676. [Google Scholar] [CrossRef]
  22. Camacho, C.; Coulouris, G.; Avagyan, V.; Ma, N.; Papadopoulos, J.; Bealer, K.; Madden, T.L. BLAST+: Architecture and applications. BMC Bioinf. 2009, 10, 421. [Google Scholar] [CrossRef]
  23. Kumar, S.; Stecher, G.; Li, M.; Knyaz, C.; Tamura, K. MEGA X: Molecular evolutionary genetics analysis across computing platforms. Mol. Biol. Evol. 2018, 35, 1547–1549. [Google Scholar] [CrossRef]
  24. Chevreux, B.; Wetter, T.; Suhai, S. Genome sequence assembly using trace signals and additional aequence information. In Proceedings of the German Conference on Bioinformatics, Hannover, Germany, 4–6 October 1999. [Google Scholar]
  25. Rozas, J.; Ferrer-Mata, A.; Sánchez-DelBarrio, J.C.; Guirao-Rico, S.; Librado, P.; Ramos-Onsins, S.E.; Sánchez-Gracia, A. DnaSP 6: DNA sequence polymorphism analysis of large data sets. Mol. Biol. Evol. 2017, 34, 3299–3302. [Google Scholar] [CrossRef]
  26. Vences, M.; Patmanidis, S.; Schmidt, J.C.; Matschiner, M.; Miralles, A.; Renner, S.S. Hapsolutely: A user-friendly tool integrating haplotype phasing, network construction, and haploweb calculation. Bioinf. Adv. 2024, 4, vbae083. [Google Scholar] [CrossRef]
  27. Nguyen, L.T.; Schmidt, H.A.; von Haeseler, A.; Minh, B.Q. IQ-TREE: A fast and effective stochastic algorithm for estimating maximum-likelihood phylogenies. Mol. Biol. Evol. 2015, 32, 268–274. [Google Scholar] [CrossRef]
  28. Pritchard, J.K.; Stephens, M.; Donnelly, P. Inference of population structure using multilocus genotype data. Genetics 2000, 155, 945–959. [Google Scholar] [CrossRef] [PubMed]
  29. Earl, D.A.; von Holdt, B.M. STRUCTURE HARVESTER: A website and program for visualizing STRUCTURE output and implementing the Evanno method. Conserv. Genet. Resour. 2012, 4, 359–361. [Google Scholar] [CrossRef]
  30. Francis, R.M. pophelper: An R package and web app to analyse and visualize population structure. Mol. Ecol. Resour. 2017, 17, 27–32. [Google Scholar] [CrossRef]
  31. Excoffier, L.; Lischer, H.E. Arlequin suite ver 3.5: A new series of programs to perform population genetics analyses under Linux and Windows. Mol. Ecol. Resour. 2010, 10, 564–567. [Google Scholar] [CrossRef]
  32. Hill, V.; Baele, G. Bayesian estimation of past population dynamics in BEAST 1.10 using the skygrid coalescent model. Mol. Biol. Evol. 2019, 36, 2620–2628. [Google Scholar] [CrossRef]
  33. Posada, D. jModelTest: Phylogenetic model averaging. Mol. Biol. Evol. 2008, 25, 1253–1256. [Google Scholar] [CrossRef]
  34. Brower, A.V. Rapid morphological radiation and convergence among races of the butterfly Heliconius erato inferred from patterns of mitochondrial DNA evolution. Proc. Natl. Acad. Sci. USA 1994, 91, 6491–6495. [Google Scholar] [CrossRef]
  35. Pons, J.; Ribera, I.; Bertranpetit, J.; Balke, M. Nucleotide substitution rates for the full set of mitochondrial protein-coding genes in Coleoptera. Mol. Phylogenet. Evol. 2010, 56, 796–807. [Google Scholar] [CrossRef]
  36. NEEM Community Members. Eemian interglacial reconstructed from a Greenland folded ice core. Nature 2013, 493, 489–494. [Google Scholar] [CrossRef]
  37. McGee, D. Glacial-interglacial precipitation changes. Annu. Rev. Mar. Sci. 2020, 12, 525–557. [Google Scholar] [CrossRef]
  38. Clark, P.U.; Dyke, A.S.; Shakun, J.D.; Carlson, A.E.; Clark, J.; Wohlfarth, B.; Mitrovica, J.X.; Hostetler, S.W.; McCabe, A.M. The Last Glacial Maximum. Science 2009, 325, 710–714. [Google Scholar] [CrossRef] [PubMed]
  39. Osman, M.B.; Tierney, J.E.; Zhu, J.; Tardif, R.; Hakim, G.J.; King, J.; Poulsen, C.J. Globally resolved surface temperatures since the Last Glacial Maximum. Nature 2021, 599, 239–244. [Google Scholar] [CrossRef] [PubMed]
  40. Wang, S.; Li, Y.; Zhou, J.; Jiang, K.; Chen, J.; Ye, Z.; Xue, H.; Bu, W. The anthropogenic effect of land use on population genetics of Malcus inconspicuus. Evol. Appl. 2023, 16, 98–110. [Google Scholar] [CrossRef] [PubMed]
  41. Nei, M. Molecular Evolutionary Genetics; Columbia University Press: New York, NY, USA; Chichester, UK, 1987. [Google Scholar]
  42. Grant, W.A.S.; Bowen, B.W. Shallow population histories in deep evolutionary lineages of marine fishes: Insights from sardines and anchovies and lessons for conservation. J. Hered. 1998, 89, 415–426. [Google Scholar] [CrossRef]
  43. Losapio, G.; Lee, J.R.; Fraser, C.I.; Gillespie, M.A.K.; Kerr, N.R.; Zawierucha, K.; Hamilton, T.L.; Hotaling, S.; Kaufmann, R.; Kim, O.-S.; et al. Impacts of deglaciation on biodiversity and ecosystem function. Nat. Rev. Biodivers. 2025, 1, 371–385. [Google Scholar] [CrossRef]
  44. Zhu, H. Biogeographical evidences help revealing the origin of Hainan island. PLoS ONE 2016, 11, e0151941. [Google Scholar] [CrossRef]
  45. Lambeck, K.; Chappell, J. Sea level change through the last glacial cycle. Science 2001, 292, 679–686. [Google Scholar] [CrossRef]
  46. Wang, C.; Mo, W.; Hu, J.; Zhang, L.; Hu, D. Reconstruction of the Cenozoic paleocoastline and evolution of the Qiongzhou strait in the Beibu Gulf—Leizhou Peninsula—Hainan Island. Geol. Rev. 2024, 70, 2400–2410. [Google Scholar] [CrossRef]
  47. Zhao, F.; Tang, L.; He, B.; Liu, Z.; Wu, Q.; Huang, Z.; Lin, G. Intraspecific variation in the hirudin gene family of the Asian buffalo leech (Hirudinaria manillensis). J. Jinggangshan Univ. (Nat. Sci.) 2024, 45, 38–45. [Google Scholar] [CrossRef]
  48. Wang, D.; Tong, X.; Wang, B.; Guo, Q.; Yang, L.; Shen, F. The importance of the species and faunna studies on Hirudinea in Yunnan Province. J. Kunming Univ. 2009, 31, 49–51. [Google Scholar] [CrossRef]
Figure 1. Study region and geographic distributions of the Hirudinaria manillensis samples (the red stars indicate the seven sampling localities).
Biology 14 00926 g001
Figure 2. Gene length (A), haplotype diversity (B), and nucleotide diversity (C) of the 13 MitPCGs, and the lognormal regression of haplotype diversity (D) and nucleotide diversity (E) against gene length.
Biology 14 00926 g002
Figure 3. Haplotype network of the concatenated MitPCGs in H. manillensis samples (the number within each circle indicates the frequency of each haplotype; letters A–F denote seven distinct branches).
Biology 14 00926 g003
Figure 4. Phylogenetic relationships among the haplotypes (H01–H60) of the concatenated H. manillensis MitPCGs (B1–B4 denote four monophyletic clades; numbers beside each node represent percentages of bootstrap values).
Biology 14 00926 g004
Figure 5. Genetic structure patterns of the H. manillensis populations with different clustering strategies (K = 2–7).
Biology 14 00926 g005
Figure 6. Historical population dynamics based on the Bayesian Skyline model and all H. manillensis samples (kya means kiloyear ago).
Biology 14 00926 g006
Table 1. Basic information of Hirudinaria manillensis samplings.
LocalityCity, ProvinceLongitudeLatitudeSample Size
GDMMMaoming, Guangdong110.39321.82910
GDZJZhanjiang, Guangdong110.46321.25010
GXGGGuigang, Guangxi109.62023.06510
GXLZLiuzhou, Guangxi109.46524.30010
GXYLYulin, Guangxi110.57422.80510
HNDADingan, Hainan110.34819.52512
YNHHHonghe, Yunnan102.58023.31512
Table 2. Genetic variation in each mitochondrial protein-coding gene (MitPCG) of all H. manillensis samples.
GeneLengthVSHNHd ± SDPi ± SD
COI153634340.874 ± 0.0290.00198 ± 0.00015
COII68417190.852 ± 0.0290.00258 ± 0.00023
ATP8153340.155 ± 0.0560.00104 ± 0.00039
COIII78333250.922 ± 0.0140.00581 ± 0.00024
ND645914120.571 ± 0.0670.00182 ± 0.00031
CYTB114035310.942 ± 0.0130.00378 ± 0.00021
ATP670513150.677 ± 0.0540.00142 ± 0.00018
ND5171066360.960 ± 0.0100.00416 ± 0.00023
ND4L285990.561 ± 0.0640.00313 ± 0.00064
ND4134441290.922 ± 0.0170.00327 ± 0.00015
ND192120230.925 ± 0.0130.00270 ± 0.00012
ND3345870.577 ± 0.0580.00362 ± 0.00051
ND297525240.917 ± 0.0150.00244 ± 0.00015
Note: VS, number of variable sites; HN, number of haplotypes; Hd, haplotype diversity; Pi, nucleotide diversity.
Table 3. Genetic variation in the concatenated MitPCGs in each H. manillensis population.
PopulationVSHNHaplotypesHd ± SDPi ± SD
GDMM689H01–H090.978 ± 0.0540.00245 ± 0.00026
GDZJ599H10–H180.978 ± 0.0540.00180 ± 0.00035
GXGG9810H19–H281.000 ± 0.0450.00236 ± 0.00040
GXLZ7110H29–H381.000 ± 0.0450.00183 ± 0.00026
GXYL8810H39–H481.000 ± 0.0450.00214 ± 0.00030
HNDA7510H49–H580.970 ± 0.0440.00200 ± 0.00047
YNHH33H59–H610.591 ± 0.1080.00011 ± 0.00002
Total318610.989 ± 0.0060.00309 ± 0.00008
Table 4. Pairwise genetic differentiation (FST) of the H. manillensis populations.
PopulationGDMMGDZJGXGGGXLZGXYLHNDAYNHH
GDMM0.0080.009<0.001<0.001<0.001<0.001
GDZJ0.189<0.001<0.001<0.001<0.001<0.001
GXGG0.2150.4110.3090.345<0.001<0.001
GXLZ0.3420.5280.0100.980<0.001<0.001
GXYL0.2980.4900.0090.000<0.001<0.001
HNDA0.2790.4450.3510.4350.395<0.001
YNHH0.6750.7920.6670.7380.7000.725
Note: the dash (—) denotes omitted comparisons between identical populations, the below diagonal indicates the pairwise FST, and the upper diagonal indicates the p values of the differentiations.
Disclaimer/Publisher’s Note: The statements, opinions and data contained in all publications are solely those of the individual author(s) and contributor(s) and not of MDPI and/or the editor(s). MDPI and/or the editor(s) disclaim responsibility for any injury to people or property resulting from any ideas, methods, instructions or products referred to in the content.

