Article

The Role of MHC-II Diversity over Enclosure Design in Gut Microbiota Structuring of Captive Bengal Slow Lorises

1
Key Laboratory of Livestock and Poultry Multi-Omics, Ministry of Agriculture and Rural Affairs, College of Animal Science and Technology, Sichuan Agricultural University, Chengdu 610000, China
2
Farm Animal Germplasm Resources and Biotech Breeding Key Laboratory of Sichuan Province, College of Animal Science and Technology, Sichuan Agricultural University, Chengdu 610000, China
3
College of Life Science, Sichuan Agricultural University, Yaan 625000, China
4
Sichuan Ganzi Ecological Environment Monitoring Center, Ganzi 626700, China
5
Sichuan Minzu College, Ganzi 626700, China
*
Authors to whom correspondence should be addressed.
These authors contributed equally to this work.
Biology 2025, 14(8), 1094; https://doi.org/10.3390/biology14081094
Submission received: 15 July 2025 / Revised: 9 August 2025 / Accepted: 17 August 2025 / Published: 21 August 2025

Simple Summary

The Bengal slow loris is an endangered primate species, so the management of its captivity for rescue purposes is of great significance. Here, we explored the connection between MHC genetics and the intestinal microbiota of captive Bengal slow lorises. Based on genetic research findings, we discovered that although environmental regulation plays a significant role, the host genetic factors still have a dominant influence. This integrated genetic–microbial framework significantly advances conservation strategies for this endangered primate. When providing protection strategies for the captive population, combining genotype-targeted intervention measures with optimized captive breeding designs helps to enhance microbial diversity while balancing the risk of pathogens.

Abstract

The endangered Bengal slow loris (Nycticebus bengalensis) relies heavily on captive/rescue populations for conservation. This study investigated the critical link between Major Histocompatibility Complex (MHC) class II DRB1 exon 2 (DRB1e2) genetic variation and gut microbiota in 46 captive individuals, aiming to improve ex situ management. Using standardized conditions across three enclosure types, we characterized DRB1e2 polymorphism via targeted sequencing and analyzed fecal microbiota using 16S rRNA gene amplicon sequencing. Results demonstrated that high DRB1e2 polymorphism significantly reduced microbial community evenness. Specific genotypes showed distinct microbial associations: G9 strongly correlated with beneficial short-chain fatty acid producers like Fructobacillus, and G2 positively correlated with Bifidobacterium spp., while G2, G3, and G4 correlated negatively with Buchnera (a nutrient-provisioning symbiont). Genotypes and polymorphism collectively explained 9.77% of microbiota variation, exceeding the weaker (5.15%), though significant, influence of enclosure type on β-diversity. These findings reveal that host DRB1e2 variation is a primary driver shaping gut microbiota structure and taxon abundance in captive slow lorises, providing evidence for MHC-mediated host–microbe co-adaptation. This offers a genetically informed framework for optimizing conservation strategies, such as tailoring diets or probiotics to specific genotypes, to enhance gut health and population viability.

1. Introduction

The intricate symbiotic relationship between hosts and their gut microbiota represents a cornerstone of organismal biology, with profound implications for host metabolism, immune function, and overall fitness. Mounting evidence underscores that gut microbial communities are dynamically shaped by the interplay of environmental factors (e.g., diet, habitat) and host genetics [1,2,3]. Among genetic determinants, the Major Histocompatibility Complex (MHC) class II genes, particularly the hypervariable exon 2 region of the DRB locus (DRB1e2), play a pivotal role in adaptive immunity by presenting pathogen-derived peptides to CD4+ T cells [4,5]. This antigen presentation capability directly influences host immune responses and indirectly sculpts gut microbiota composition through selective pressure on microbial colonization and persistence—a phenomenon termed the “MHC-mediated microbiome sculpting hypothesis” [6,7].
Recent advances have illuminated the bidirectional co-evolution between MHC polymorphism and gut microbiota. High MHC diversity enhances the host’s capacity to recognize diverse microbial antigens, thereby promoting microbiota richness and stability while suppressing pathobiont expansion [8,9]. For instance, MHC-II heterozygosity correlates with increased abundance of beneficial Bifidobacterium and reduced pathogen loads in lemurs [10,11]. Conversely, low MHC diversity—common in small, fragmented populations—can disrupt microbial homeostasis, leading to dysbiosis and heightened disease susceptibility [12]. This genetic–microbial crosstalk is now recognized as a critical adaptive mechanism in wildlife facing environmental stressors [13,14].
Despite this conceptual progress, critical gaps persist in non-model and endangered primates. The Bengal slow loris (Nycticebus bengalensis), an IUCN Endangered nocturnal primate endemic to Southeast Asia, faces catastrophic declines due to habitat fragmentation and illegal wildlife trade [15,16]. Confiscated individuals increasingly rely on ex situ breeding programs, yet captivity imposes profound physiological stressors. Artificial diets, reduced microbial exposure, and chronic confinement alter gut microbiota, manifesting as reduced diversity, loss of keystone taxa (e.g., fiber-degrading Firmicutes), and proliferation of opportunistic pathogens [17,18]. Crucially, the role of MHC genetics in modulating these captivity-induced dysbioses remains entirely unexplored in slow lorises—a significant oversight given the MHC’s established role in microbial resilience.

2. Materials and Methods

2.1. Animal Ethics Statement

Sample collection and animal experiments were approved by the Institutional Review Board (IRB13627) and the Institutional Animal Care and Use Committee of the Sichuan Agricultural University, China, under permit number 20240098, as well as the Administration for Wild Animal Protection in Yunnan Provinces, China, and adhered to the American Society of Primatologists Principles for the Ethical Treatment of Non-Human Primates. This article has followed the Arrive guidelines.

2.2. Sample Collection and DNA Extraction

Fecal samples were collected from 46 captive Bengal slow lorises at Dehong Wildlife Rescue Center, China (24.38287° N, 98.45872° E), during July 2022. To ensure sample integrity, clean trays were placed under cages prior to morning feeding, preventing cross-contamination and environmental exposure. All subjects originated from confiscated/rescued wild populations with 12–18 months of captivity. Individuals were stratified into three groups by enclosure type: Group I (n = 23), single occupancy in standard cages (0.58 × 0.43 × 0.46 m3); Group II (n = 15), single occupancy in compact cages (0.48 × 0.30 × 0.33 m3); Group III (n = 8), enriched enclosures (4 m2 floor area, 2.5 m height; climbing structures; 1–2 individuals/room). The following ambient parameters were standardized across groups: temperature (25 ± 1 °C), humidity (60 ± 5%), and diet (rice/fruits/locusts). Variations were strictly limited to enclosure dimensions and social housing. Fresh fecal samples were immediately transferred to labeled centrifuge tubes, flash-frozen on dry ice, and stored at −80 °C at Sichuan Agricultural University.
Genomic DNA was extracted from fecal samples using the TiaNamp Stool DNA Kit (Tiangen Biotech Co., Ltd., Beijing, China) according to the manufacturer’s instructions. The extracted DNA was assessed for quality using 0.8% agarose gel electrophoresis and quantified using NanoDrop 2000 (Thermo Scientific, Wilmington, DE, USA). Subsequently, the DNA was stored at −20 °C for further experiments.

2.3. DRB1 Exon 2 Gene Sequencing and Allele Calling

Targeted primers for DRB1e2 exon 2 (Forward: 5′-GTTGTGTCTGCACACCGT-3′; Reverse: 5′-GCAGGCTAAGTTTGAGTGT-3′) were designed using Primer-BLAST (NCBI). Primer specificity was validated against the Bengal slow loris reference genome (NCBI Bioproject: PRJNA785018) and homologous sequences from related primates [19,20]. PCR reactions (50 µL volume) contained 25 µL 2× SanTaq Master Mix, 2 µL of each primer, and 10–50 ng DNA template. Amplification conditions were as follows: initial denaturation at 94 °C (5 min); 30 cycles at 94 °C (10 s), 52.5 °C (20 s), 72 °C (30 s); and final extension at 72 °C (5 min). Eight technical replicates per sample ensured ≥95% allele detection accuracy.
PCR products were purified (SanPreo Column DNA Kit), cloned into pUCm-T vectors, and subjected to bidirectional Sanger sequencing using Applied Biosystems™ 3730XL (Thermo Fisher Scientific Inc., Waltham, MA, USA). Forward and reverse reads were trimmed off primers/adapters using Fastp v0.20.0 and quality-filtered (Phred score > 20, Q > 80). The quality-controlled sequences were assembled into contiguous sequences via Seqman v7.1.0 and translated to amino acid sequences in MEGA v11 to confirm reading frame integrity.
Despite being optimized for shotgun data, the TARGT pipeline [21] was adapted for Sanger-derived FASTA files due to cross-platform compatibility and enhanced accuracy for low-variation targets. The pipeline output was validated against Kennedy’s criteria: alleles required either (a) presence in ≥2 individuals or (b) ≥3 identical clones in one individual [22].

2.4. Polymorphism and Phylogenetic Analysis

Population genetic analyses were conducted on DRB1e2 sequences stratified by the three captive groups (I–III). Using DNAsp v6.12.03 [23], polymorphic information sites and nucleotide diversity (π) were calculated, pairwise Fst between groups was quantified to assess genetic differentiation, and Tajima’s D for each group was computed to evaluate neutrality deviations. Variant calling was performed with Samtools v1.19.2 to categorize nucleotide substitution types. Genotype data were analyzed in R v4.3.2 (adegenet package) to determine allele frequencies, individual heterozygosity (HE), effective allele number (AE), and polymorphic information content (PIC). Allele frequency distributions were visualized using ggplot2. Hardy–Weinberg equilibrium was tested (SNPassoc package), and Kruskal–Wallis ANOVA compared median HE and π values across groups.
A phylogenetic analysis was performed to assess the specificity of DRB1e2 amplification products. Using known alleles from closely related species (Table 1) as outgroups, we constructed a maximum-likelihood (ML) tree in MEGA v11 to classify obtained DRB1e2 alleles and validate primer specificity for the target locus (i.e., confirm amplification of DRB1 paralogs versus other DRB genes). Given the limitations of single-copy alleles and highly variable exonic regions, this phylogeny serves primarily to evaluate PCR target specificity, not to infer interspecies evolutionary relationships. The best-fit nucleotide substitution model (T92 + G) was selected under the Akaike Information Criterion (AIC). Branch support was assessed with 1000 bootstrap replicates; only nodes ≥ 50% are shown.

2.5. Microbial Diversity and Correlation Analysis

Total genomic DNA was extracted from fresh fecal samples, followed by amplification of the bacterial 16S rRNA V3-V4 hypervariable region using universal primers 338F (5′-ACTCCTACGGGAGGCAGCA-3′) and 806R (5′-GGACTACHVGGGTWTCTAAT-3′). Purified PCR products were normalized, constructed into Illumina sequencing libraries, and subjected to paired-end sequencing (2 × 250 bp) on the NovaSeq 6000 platform (Illumina Inc., San Diego, CA, USA) after rigorous quality control. Raw sequencing reads underwent initial quality filtering with Trimmomatic (v0.33) to remove low-quality bases (Phred score < 20), followed by adapter trimming using Cutadapt (v1.9.1). Processed reads were merged and filtered for chimeric sequences via USEARCH (v10.0), generating high-fidelity sequences for downstream analysis. Operational taxonomic units (OTUs) were clustered at 97% similarity threshold using USEARCH and filtered at 0.005% relative abundance to eliminate spurious taxa. Taxonomic classification was performed against the SILVA v138 reference database through QIIME2’s (v2020.6) classify-sklearn algorithm, yielding abundance tables across six taxonomic ranks (phylum to species). Microbial α-diversity was quantified using Chao1, abundance-based coverage estimator (ACE), Shannon, Simpson, and Faith’s phylogenetic diversity (PD) indices in QIIME2, with group-wise comparisons assessed via Kruskal–Wallis tests. For β-diversity analysis, Jaccard, Bray–Curtis, and (un)weighted UniFrac distance matrices were computed and visualized through principal coordinate analysis (PCoA), non-metric multidimensional scaling (NMDS), and redundancy analysis (RDA), while permutational multivariate ANOVA (PERMANOVA; 999 iterations) decomposed variance contributions. Differential microbial abundance was identified using LEfSe (https://usegalaxy.org/) on the Galaxy platform (LDA score > 2.0, p < 0.05), with the top 20 discriminant genera further analyzed in Spearman correlation heatmaps to elucidate associations between DRB1e2 genotypes, enclosure types, and beneficial bacterial taxa.

3. Results

3.1. DRB1e2 Genetic Diversity

Nine distinct DRB1e2 alleles (designated Nybe-DRB1*01–09) were identified in the captive Bengal slow loris population (Supplementary Table S1). The Nybe-DRB1*06 allele exhibited a unique three-nucleotide insertion, adding a proline residue at position 9 of the translated protein (Supplementary Table S2). Phylogenetic analysis confirmed all amplified sequences belonged exclusively to the DRB1 clade, showing clear divergence from paralogous DRB3, DRB4, and DRB5 genes (Figure 1). In silico PCR validation (Primer-BLAST) confirmed target specificity with no off-target amplification.
Individuals carried 1–6 alleles (mean ± SD: 2.62 ± 1.42), with differential allele frequencies: Nybe-DRB1*05 demonstrated the highest prevalence, while Nybe-DRB1*08 occurred only in individual N53. Eleven genotypes (G1–G11) were identified, with G3 (Nybe-DRB1*02/04/05) being predominant (20 individuals, f = 0.43), followed by the homozygous G2 (Nybe-DRB1*03) (14 individuals, f = 0.30). Seven singleton genotypes were excluded from comparative analyses (Supplementary Table S3).
Population-level metrics revealed low heterozygosity (HE = 0.29) but high polymorphism (PIC = 0.82; allelic richness AE = 5.71). Nucleotide diversity (π) varied across the exon, peaking at 0.19 within the 27–58 bp segment. The negative Tajima’s D (−0.21, p < 0.05) and near-zero Fst (−0.01) indicated minimal population subdivision with greater variation within than between groups.

3.2. Group-Specific Variation

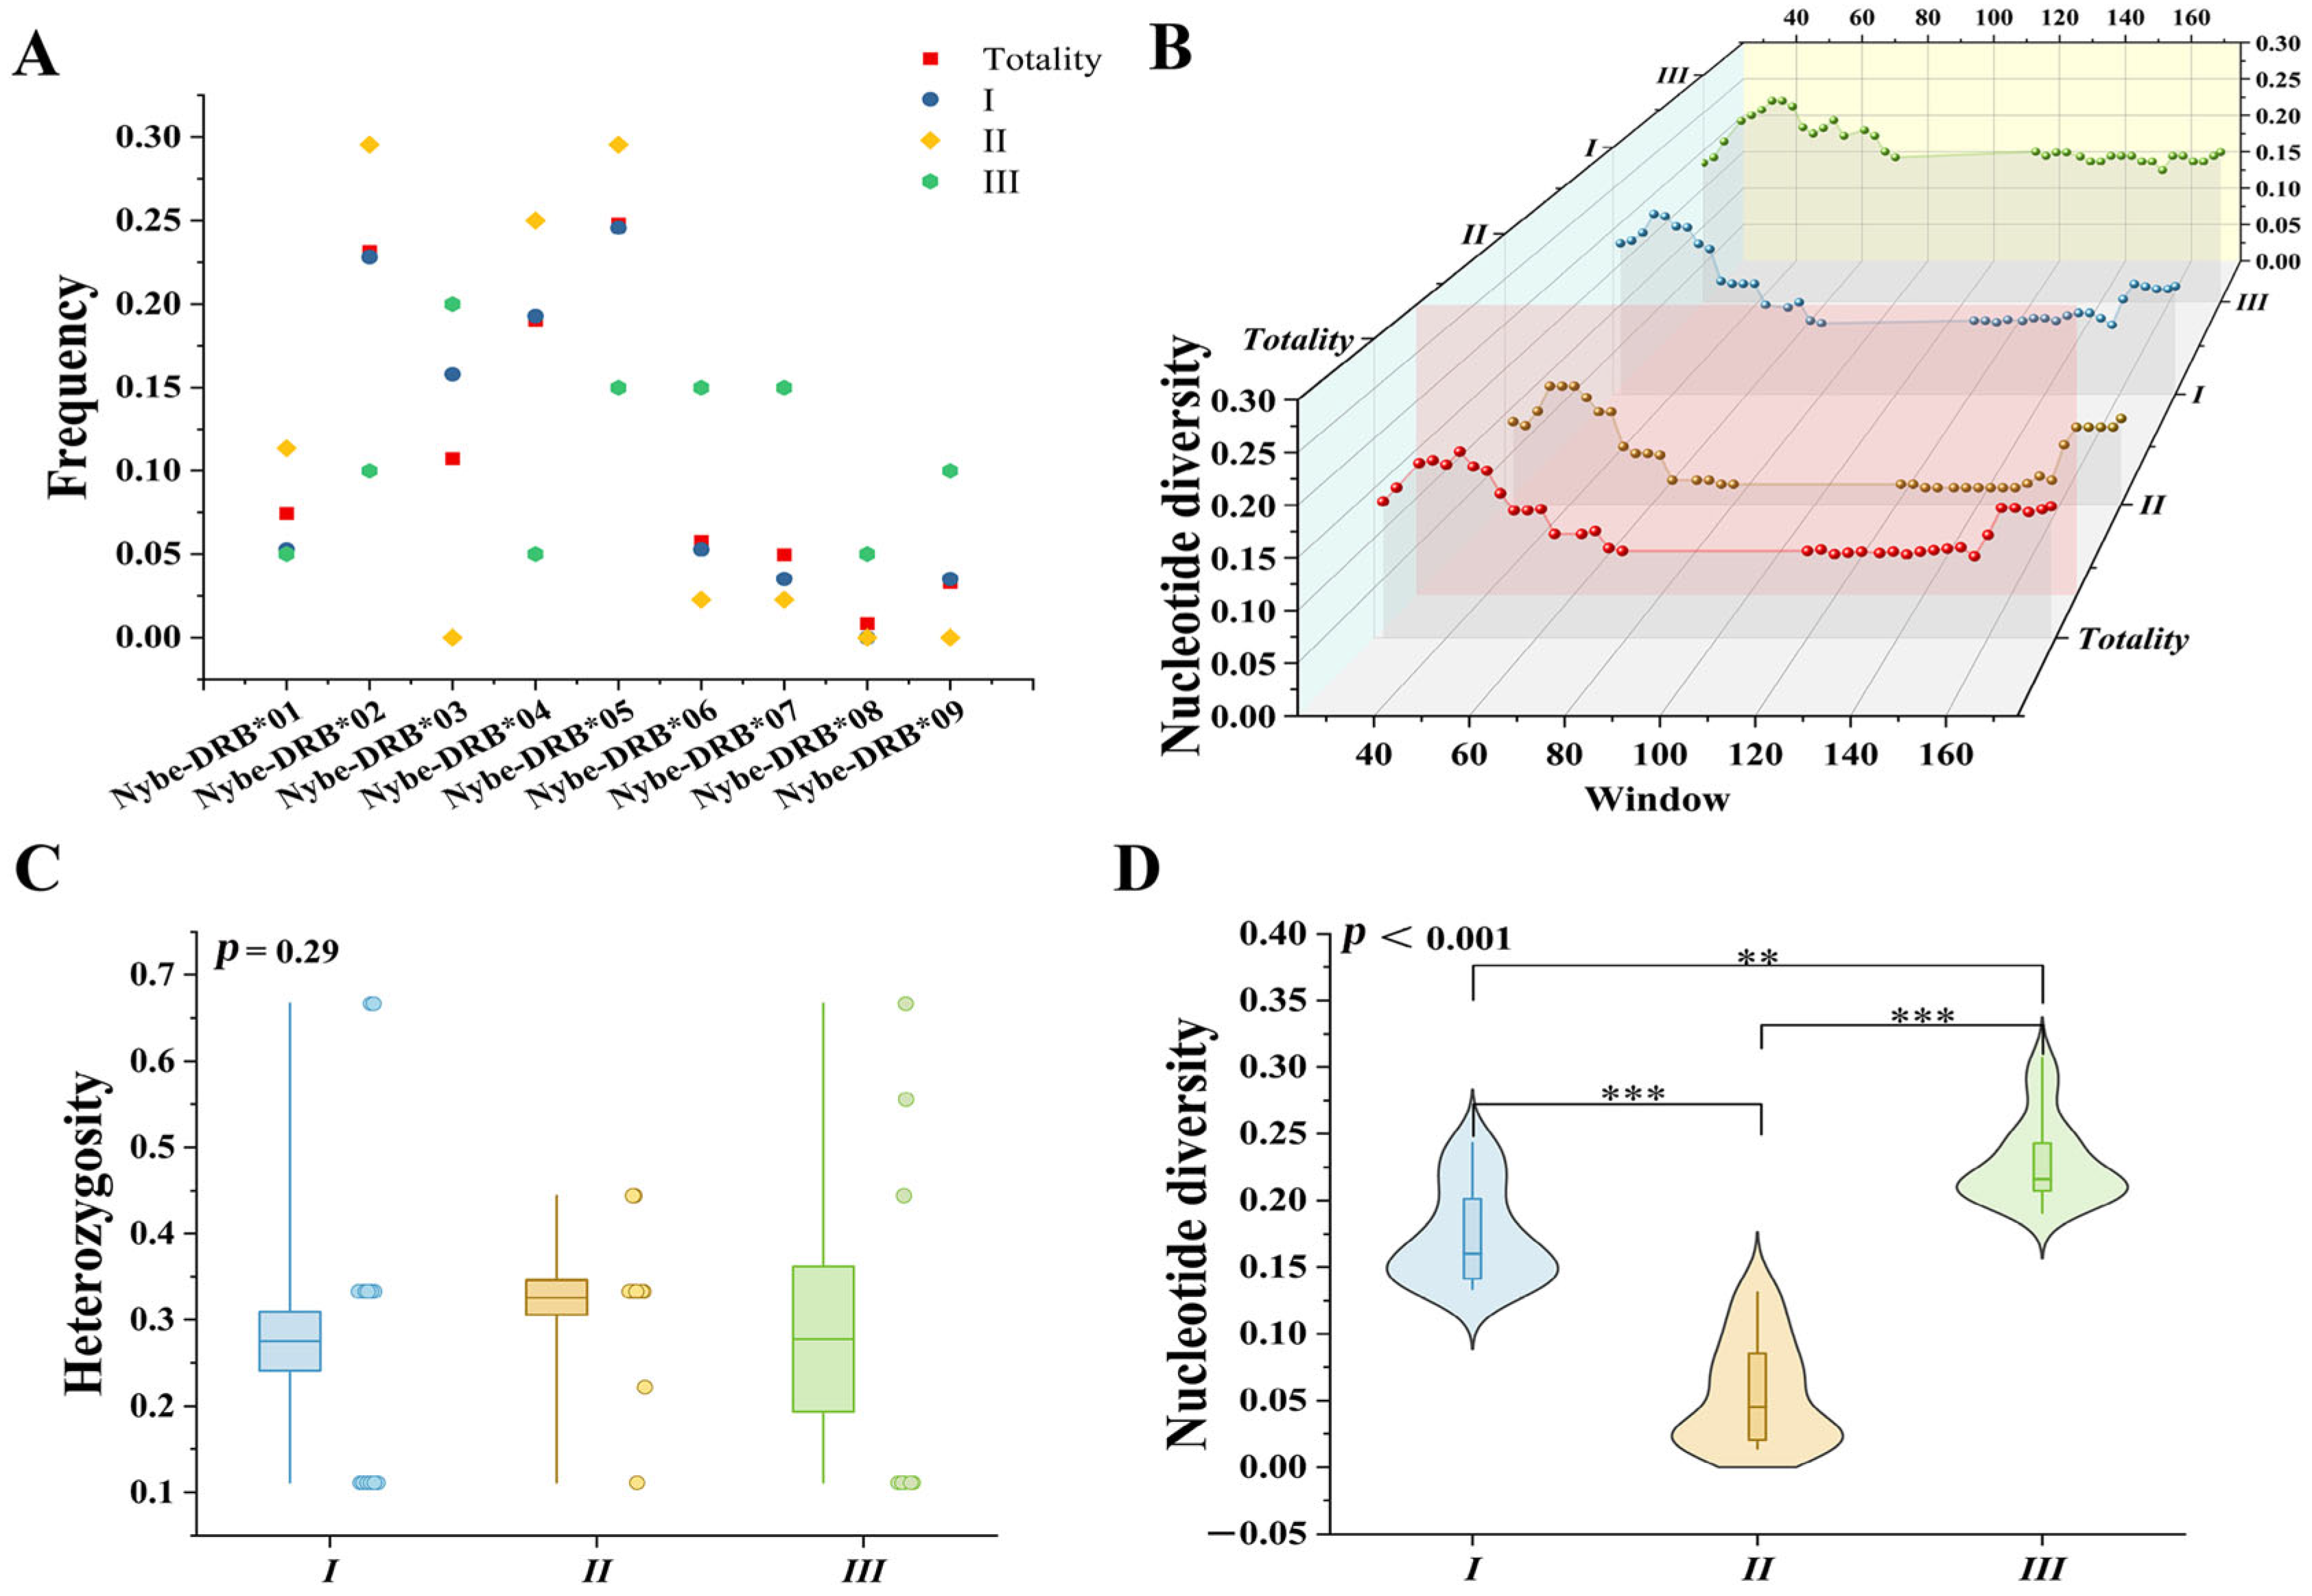
Allele/genotype distributions differed significantly among enclosure groups (Figure 2; Supplementary Table S1). Nybe-DRB1*05 dominated Groups I and II, while Nybe-DRB1*03 reached the highest frequency in Group III. G3 was most frequent in Groups I and II (n = 10 each), and G2 predominated in Group III (n = 5). This distribution suggests potential social stress-mediated selection in co-housed Group III versus neutral drift in isolated Groups I/II. While heterozygosity (p = 0.24) and PIC (p = 0.24) showed no intergroup differences, nucleotide diversity varied significantly (p < 0.01): Group III > Group I > Group II (Table 2).

3.3. MHC–Microbiota Associations

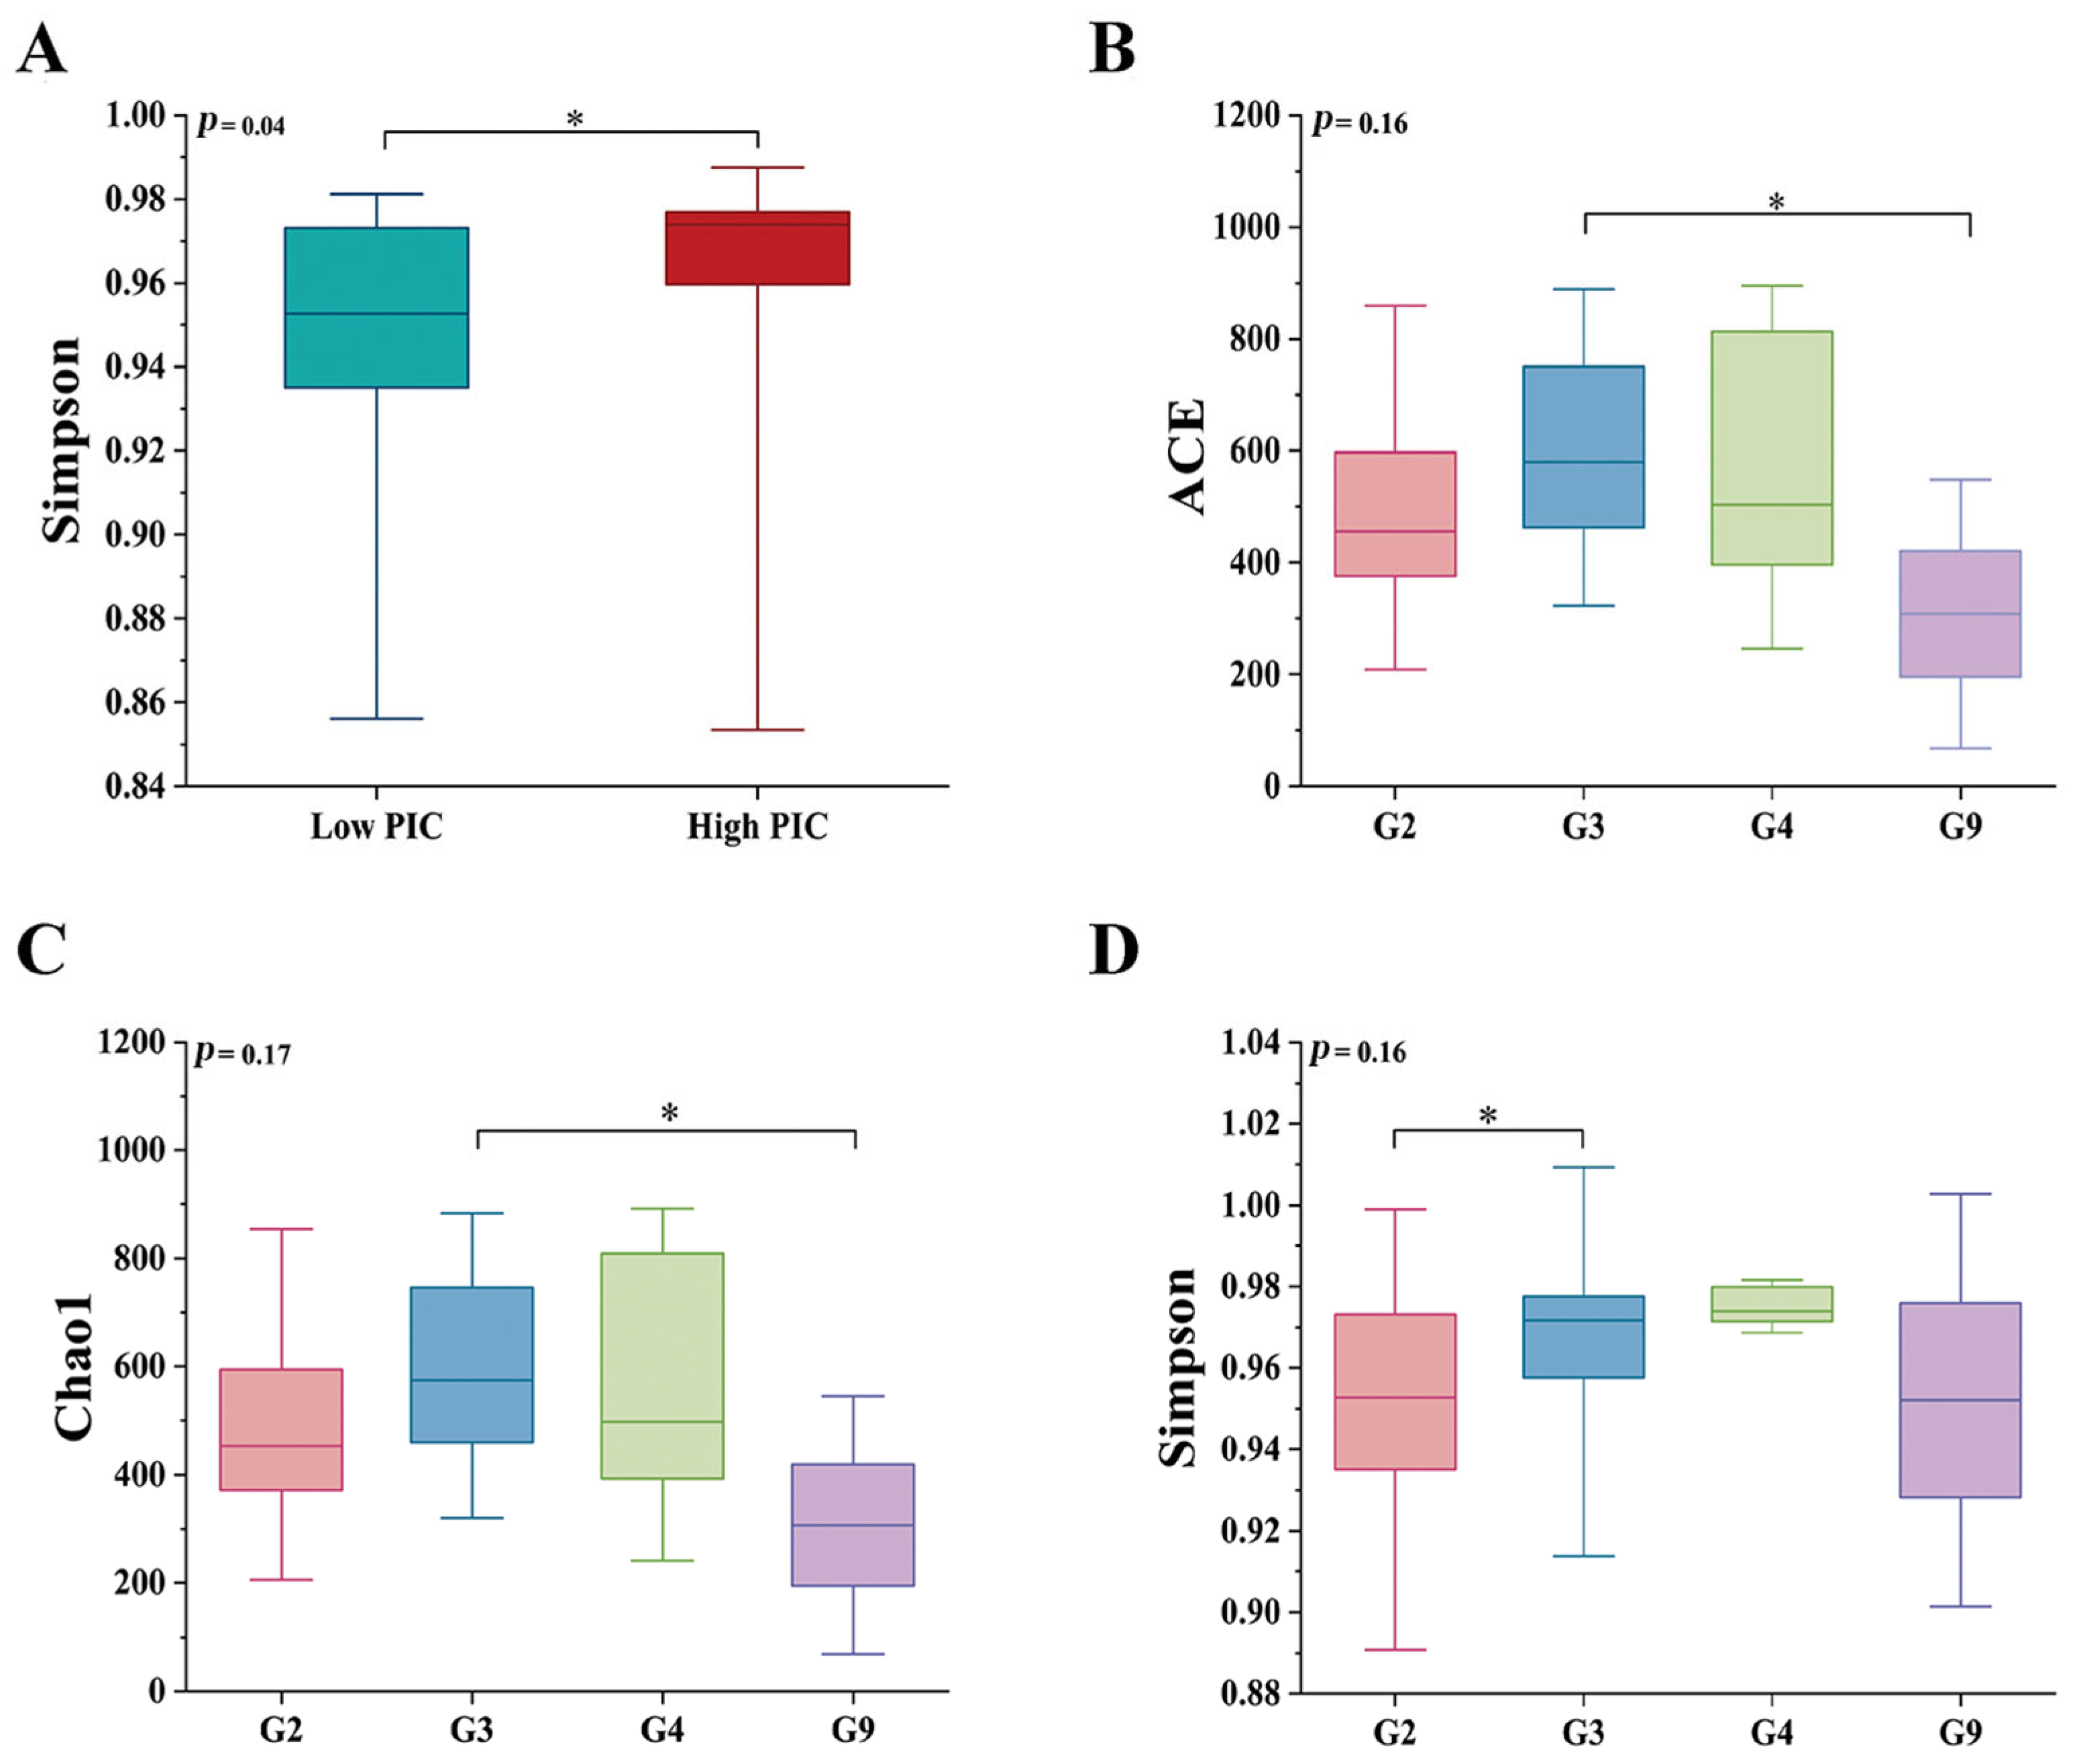
DRB1e2 polymorphism (PIC) showed no significant effect on microbiota richness (Chao1/ACE) or phylogenetic diversity (Supplementary Figure S1). However, microbial evenness—reflecting uniformity in species abundance distributions where low evenness indicates dominance by a few taxa and potential dysbiosis risk—exhibited a significant inverse relationship with polymorphism. Individuals with higher PIC displayed significantly lower evenness (Simpson index increase, p < 0.05; Figure 3A).
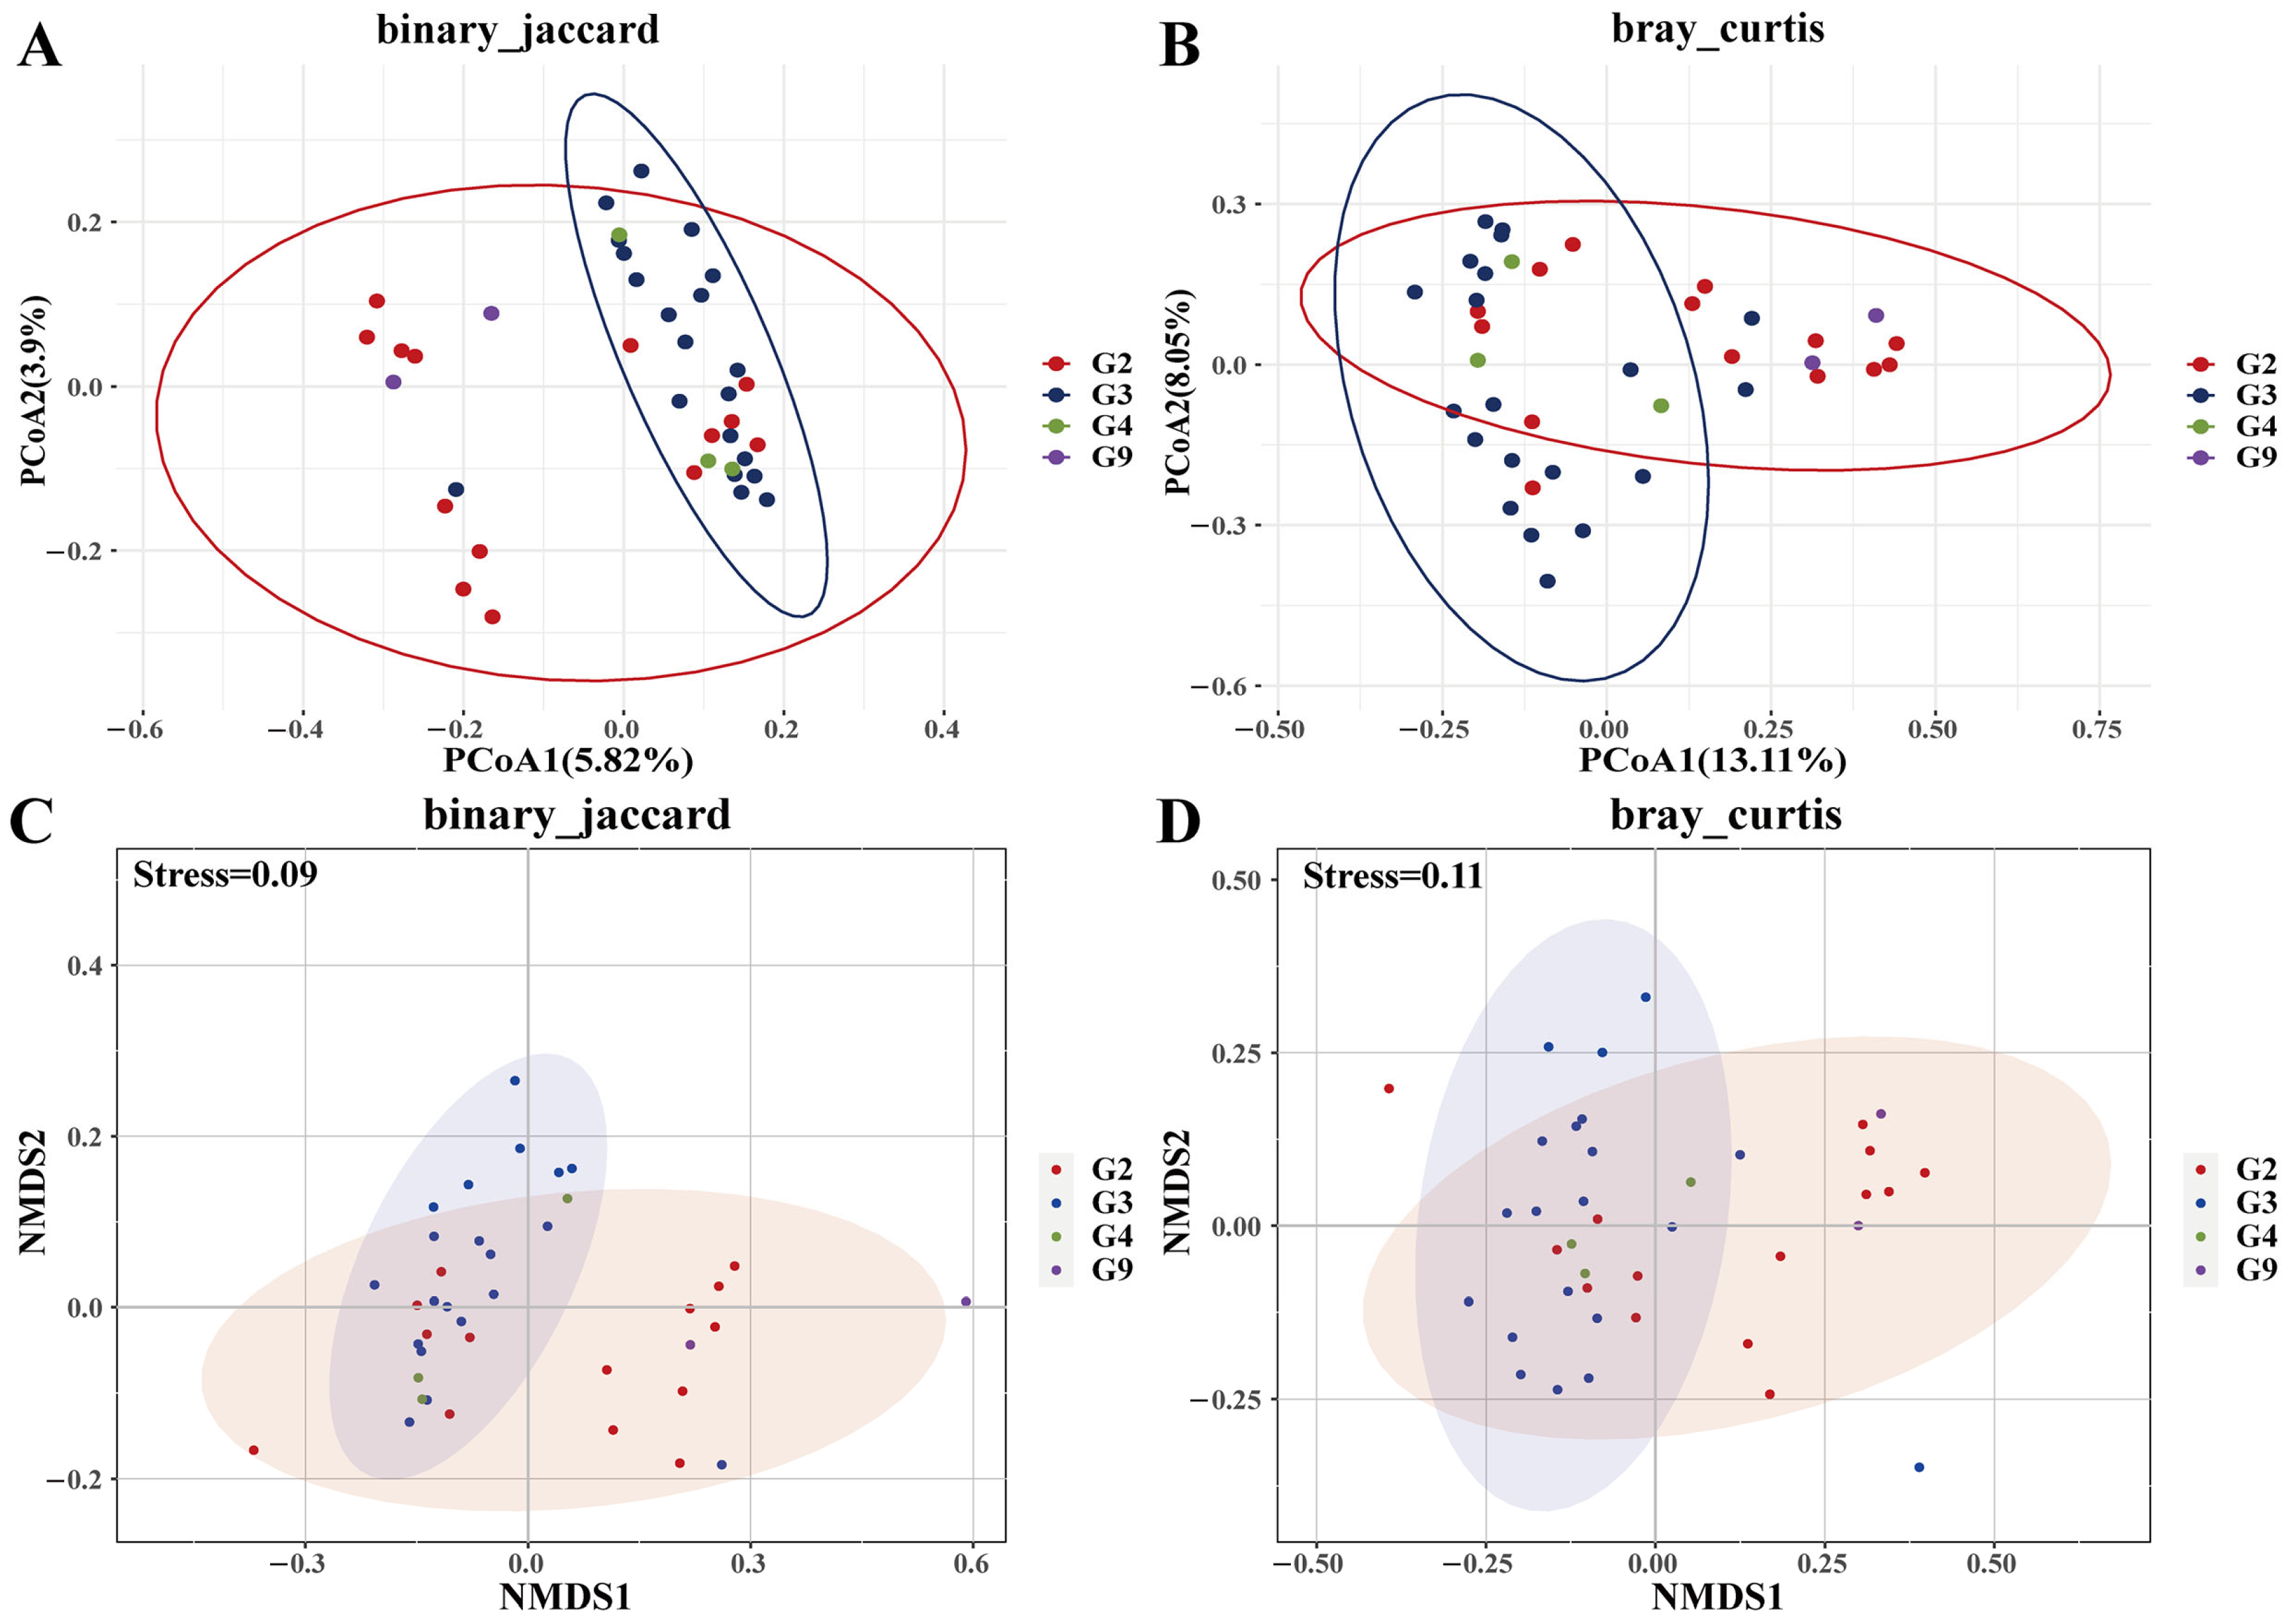
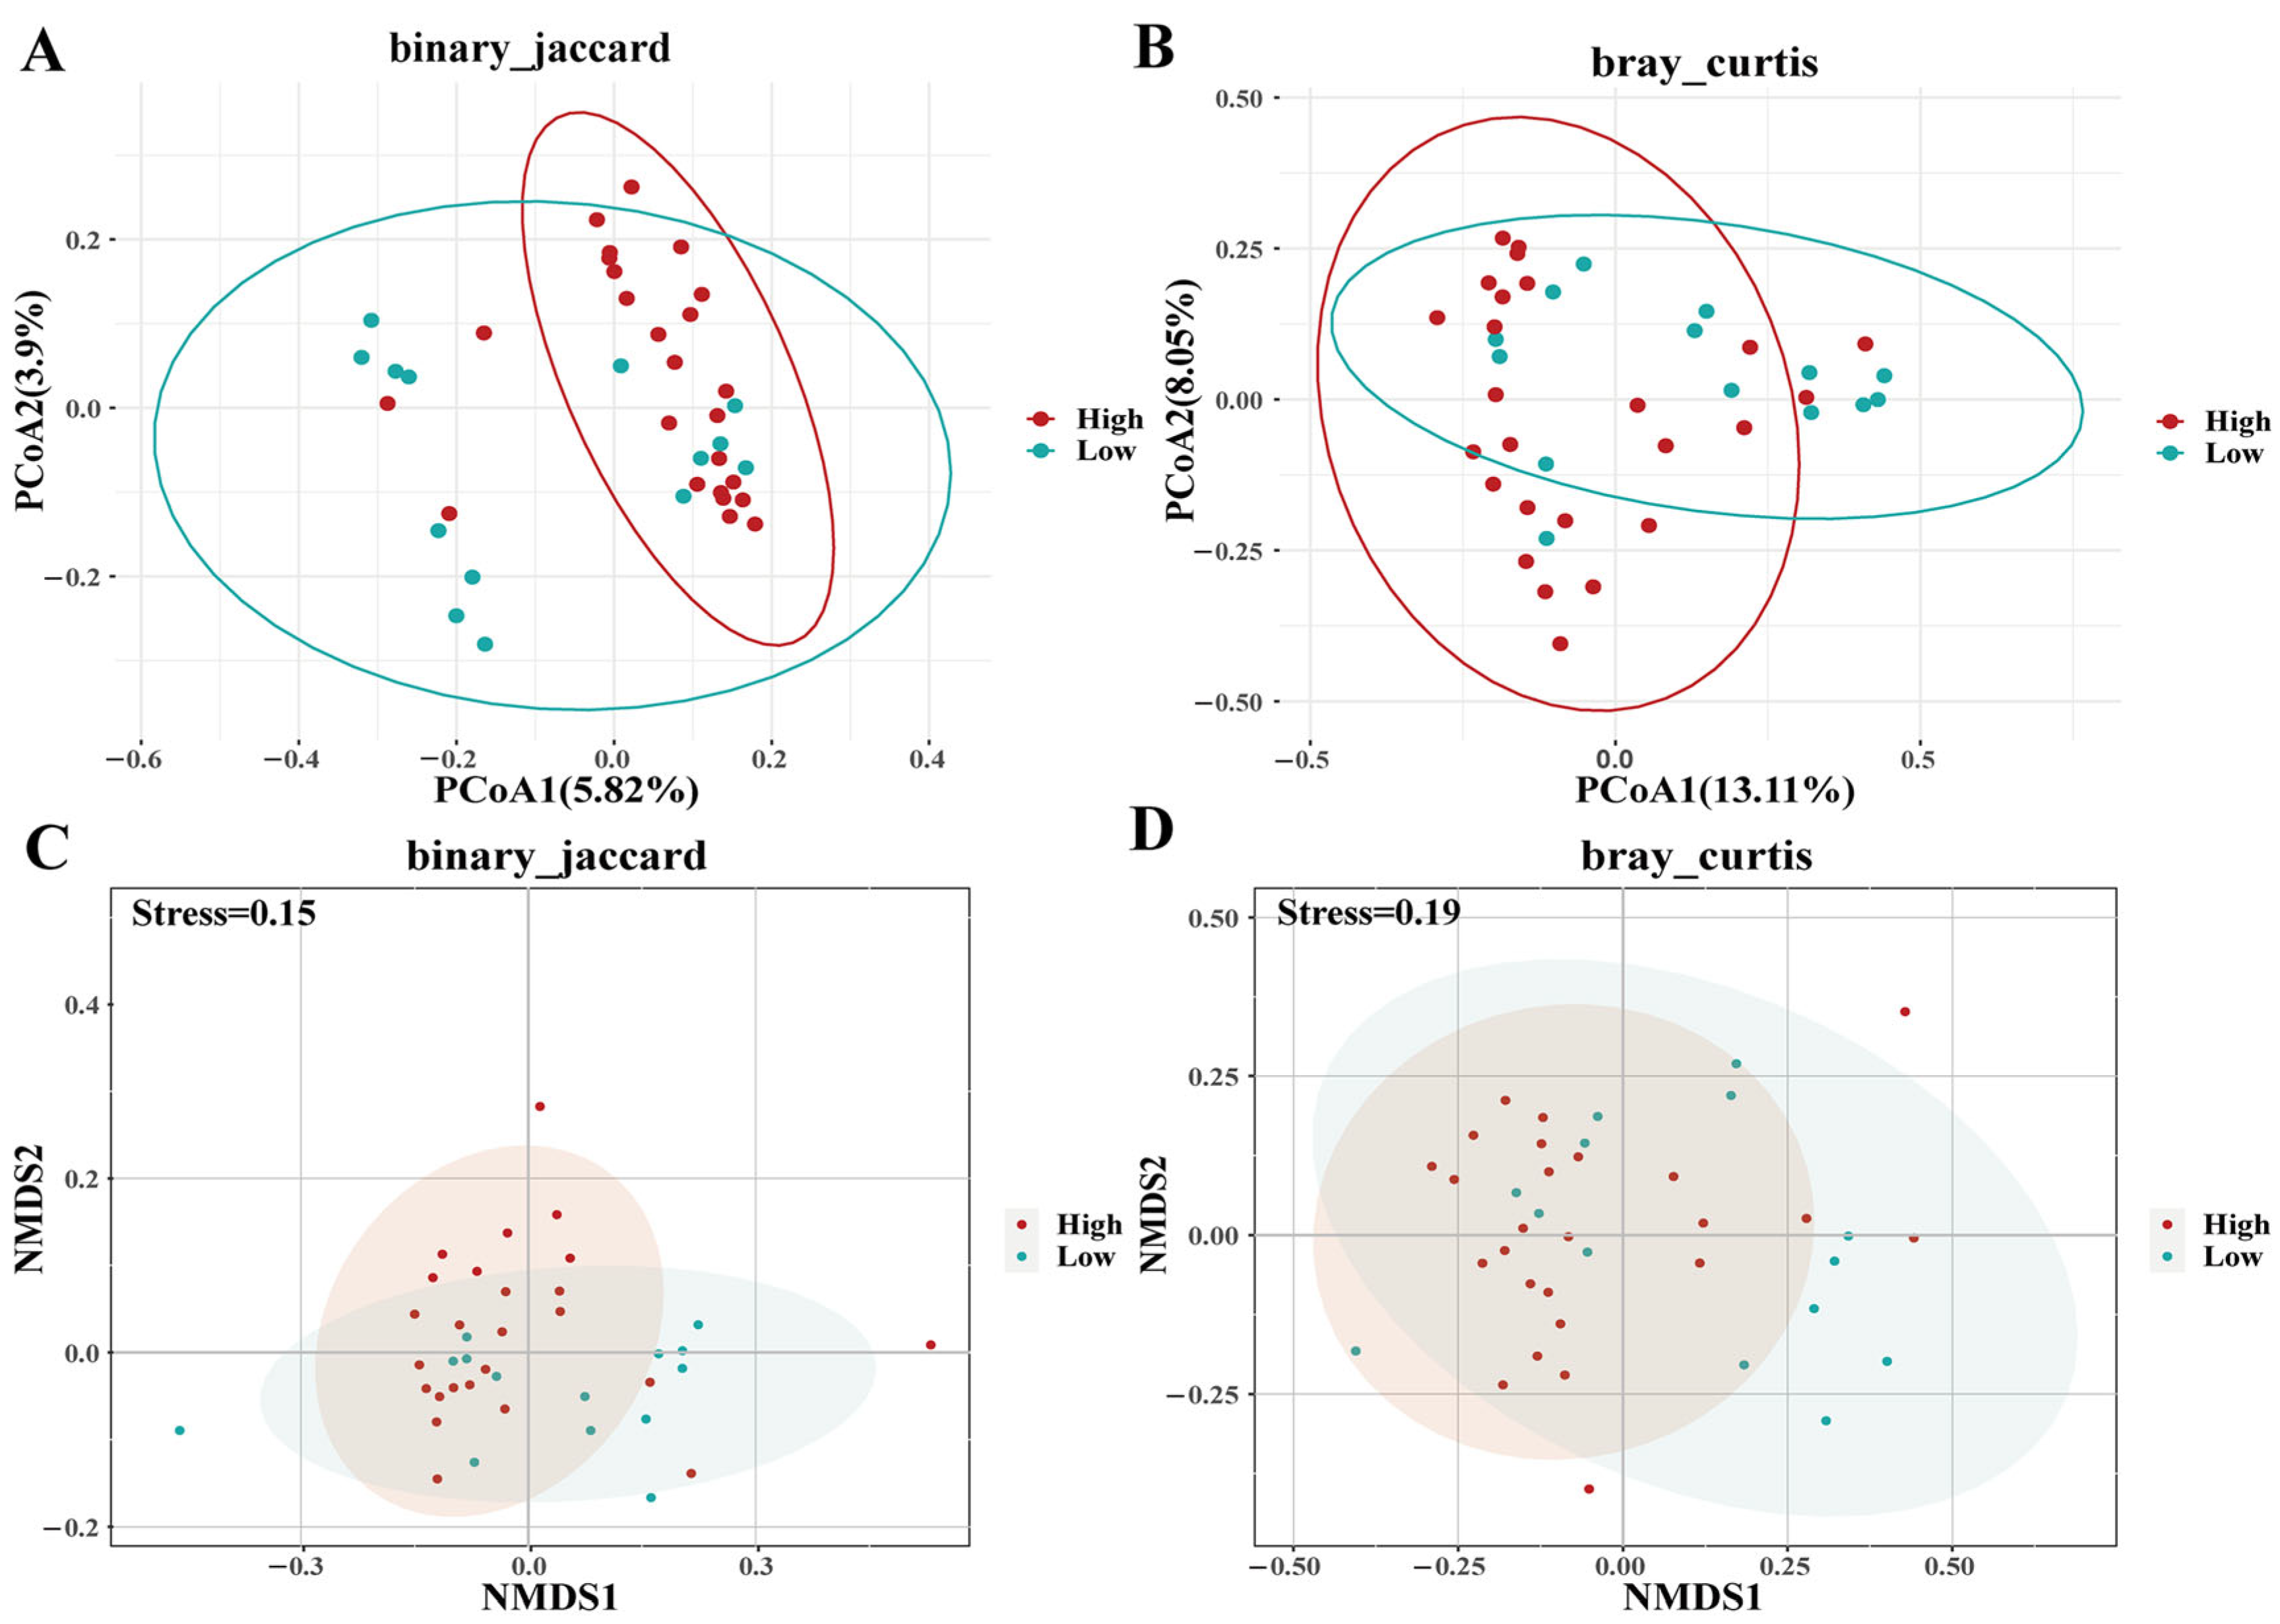
Genotype-specific microbial diversity patterns and relationships with PIC were observed. For example, G3 had higher ACE/Chao1 than G9 (p = 0.05), while G2 showed a lower Simpson index than G3 (p < 0.05) (Figure 3; Supplementary Figure S2). PCoA/NMDS with Jaccard (Fdf = 1.13, p < 0.01, R2 = 0.09) and Bray–Curtis (Fdf = 1.41, p < 0.01, R2 = 0.11) illustrated distinct clustering patterns for G3, with G2 proximity to G9, and G3 proximity to G4 (Figure 4), with no separation by (un)weighted UniFrac metrics (Supplementary Figure S3). High-PIC individuals clustered distinctly in Jaccard ordinations (Fdf = 1.23, p < 0.01, R2 = 0.03) and Bray–Curtis (Fdf = 1.65, p < 0.01, R2 = 0.04) (Figure 5). However, weighted and unweighted unifrac analysis did not differentiate between individuals (Supplementary Figure S4).

3.4. Genotype-Specific Microbiota Associations

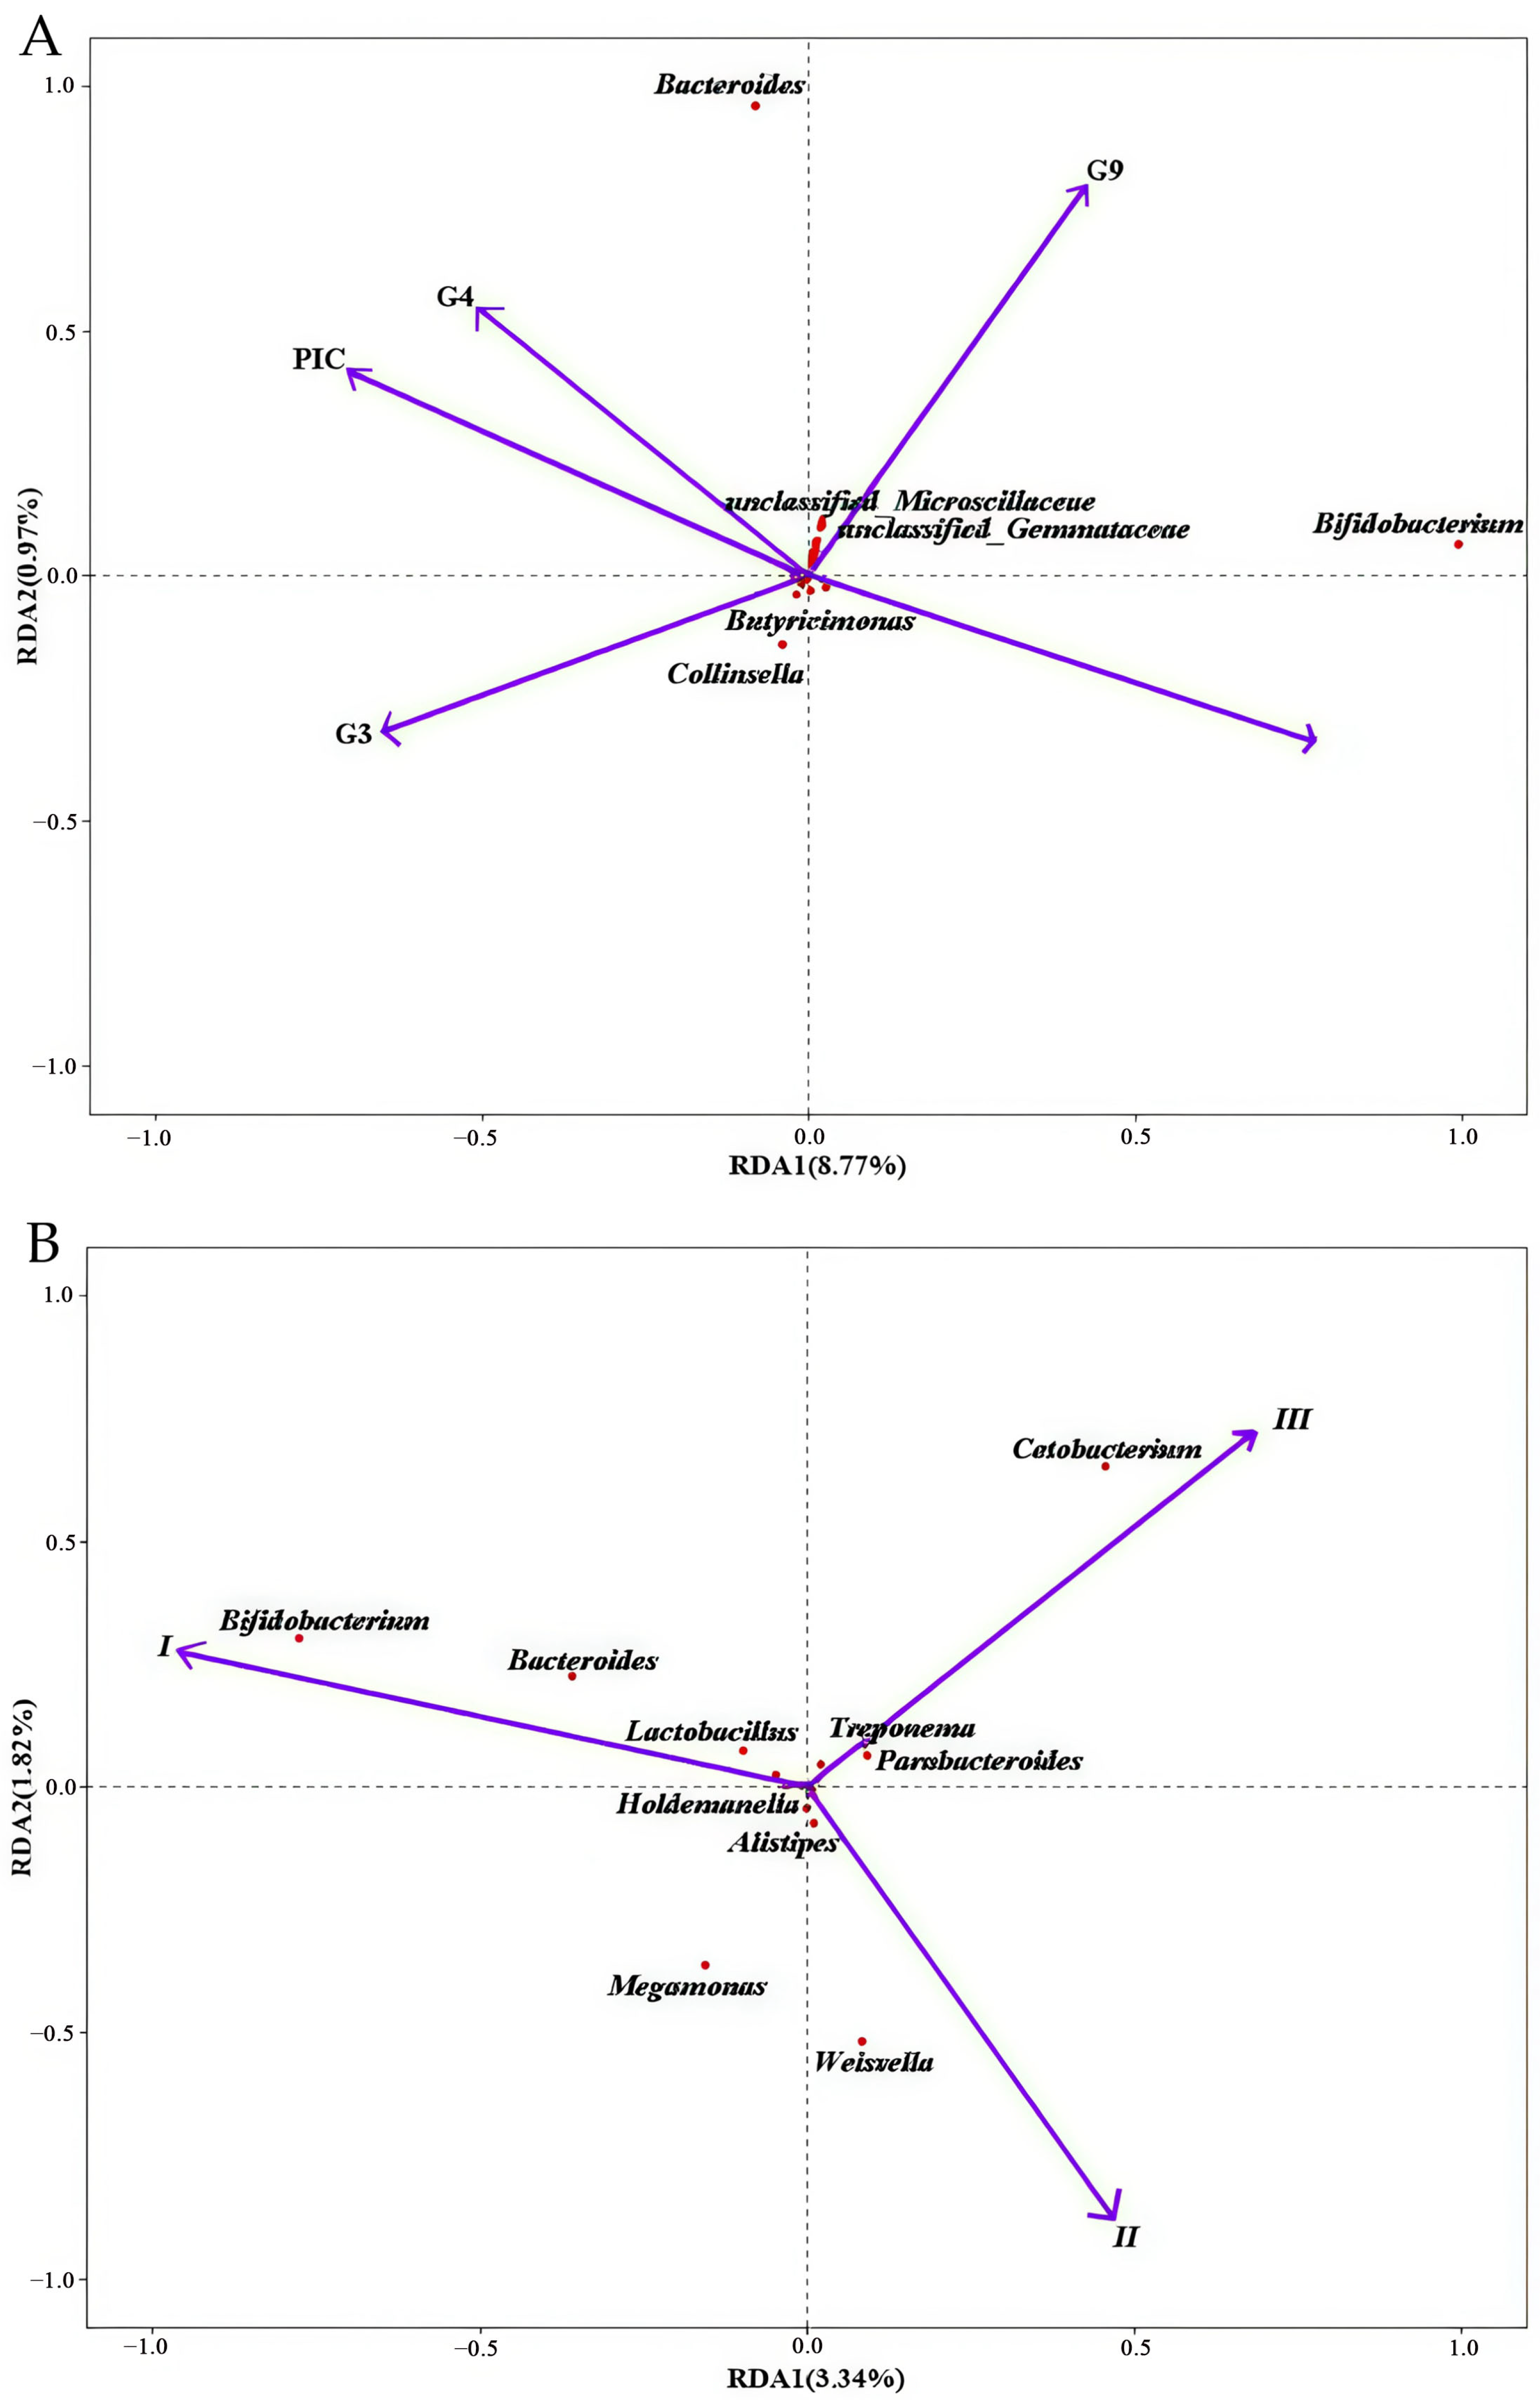
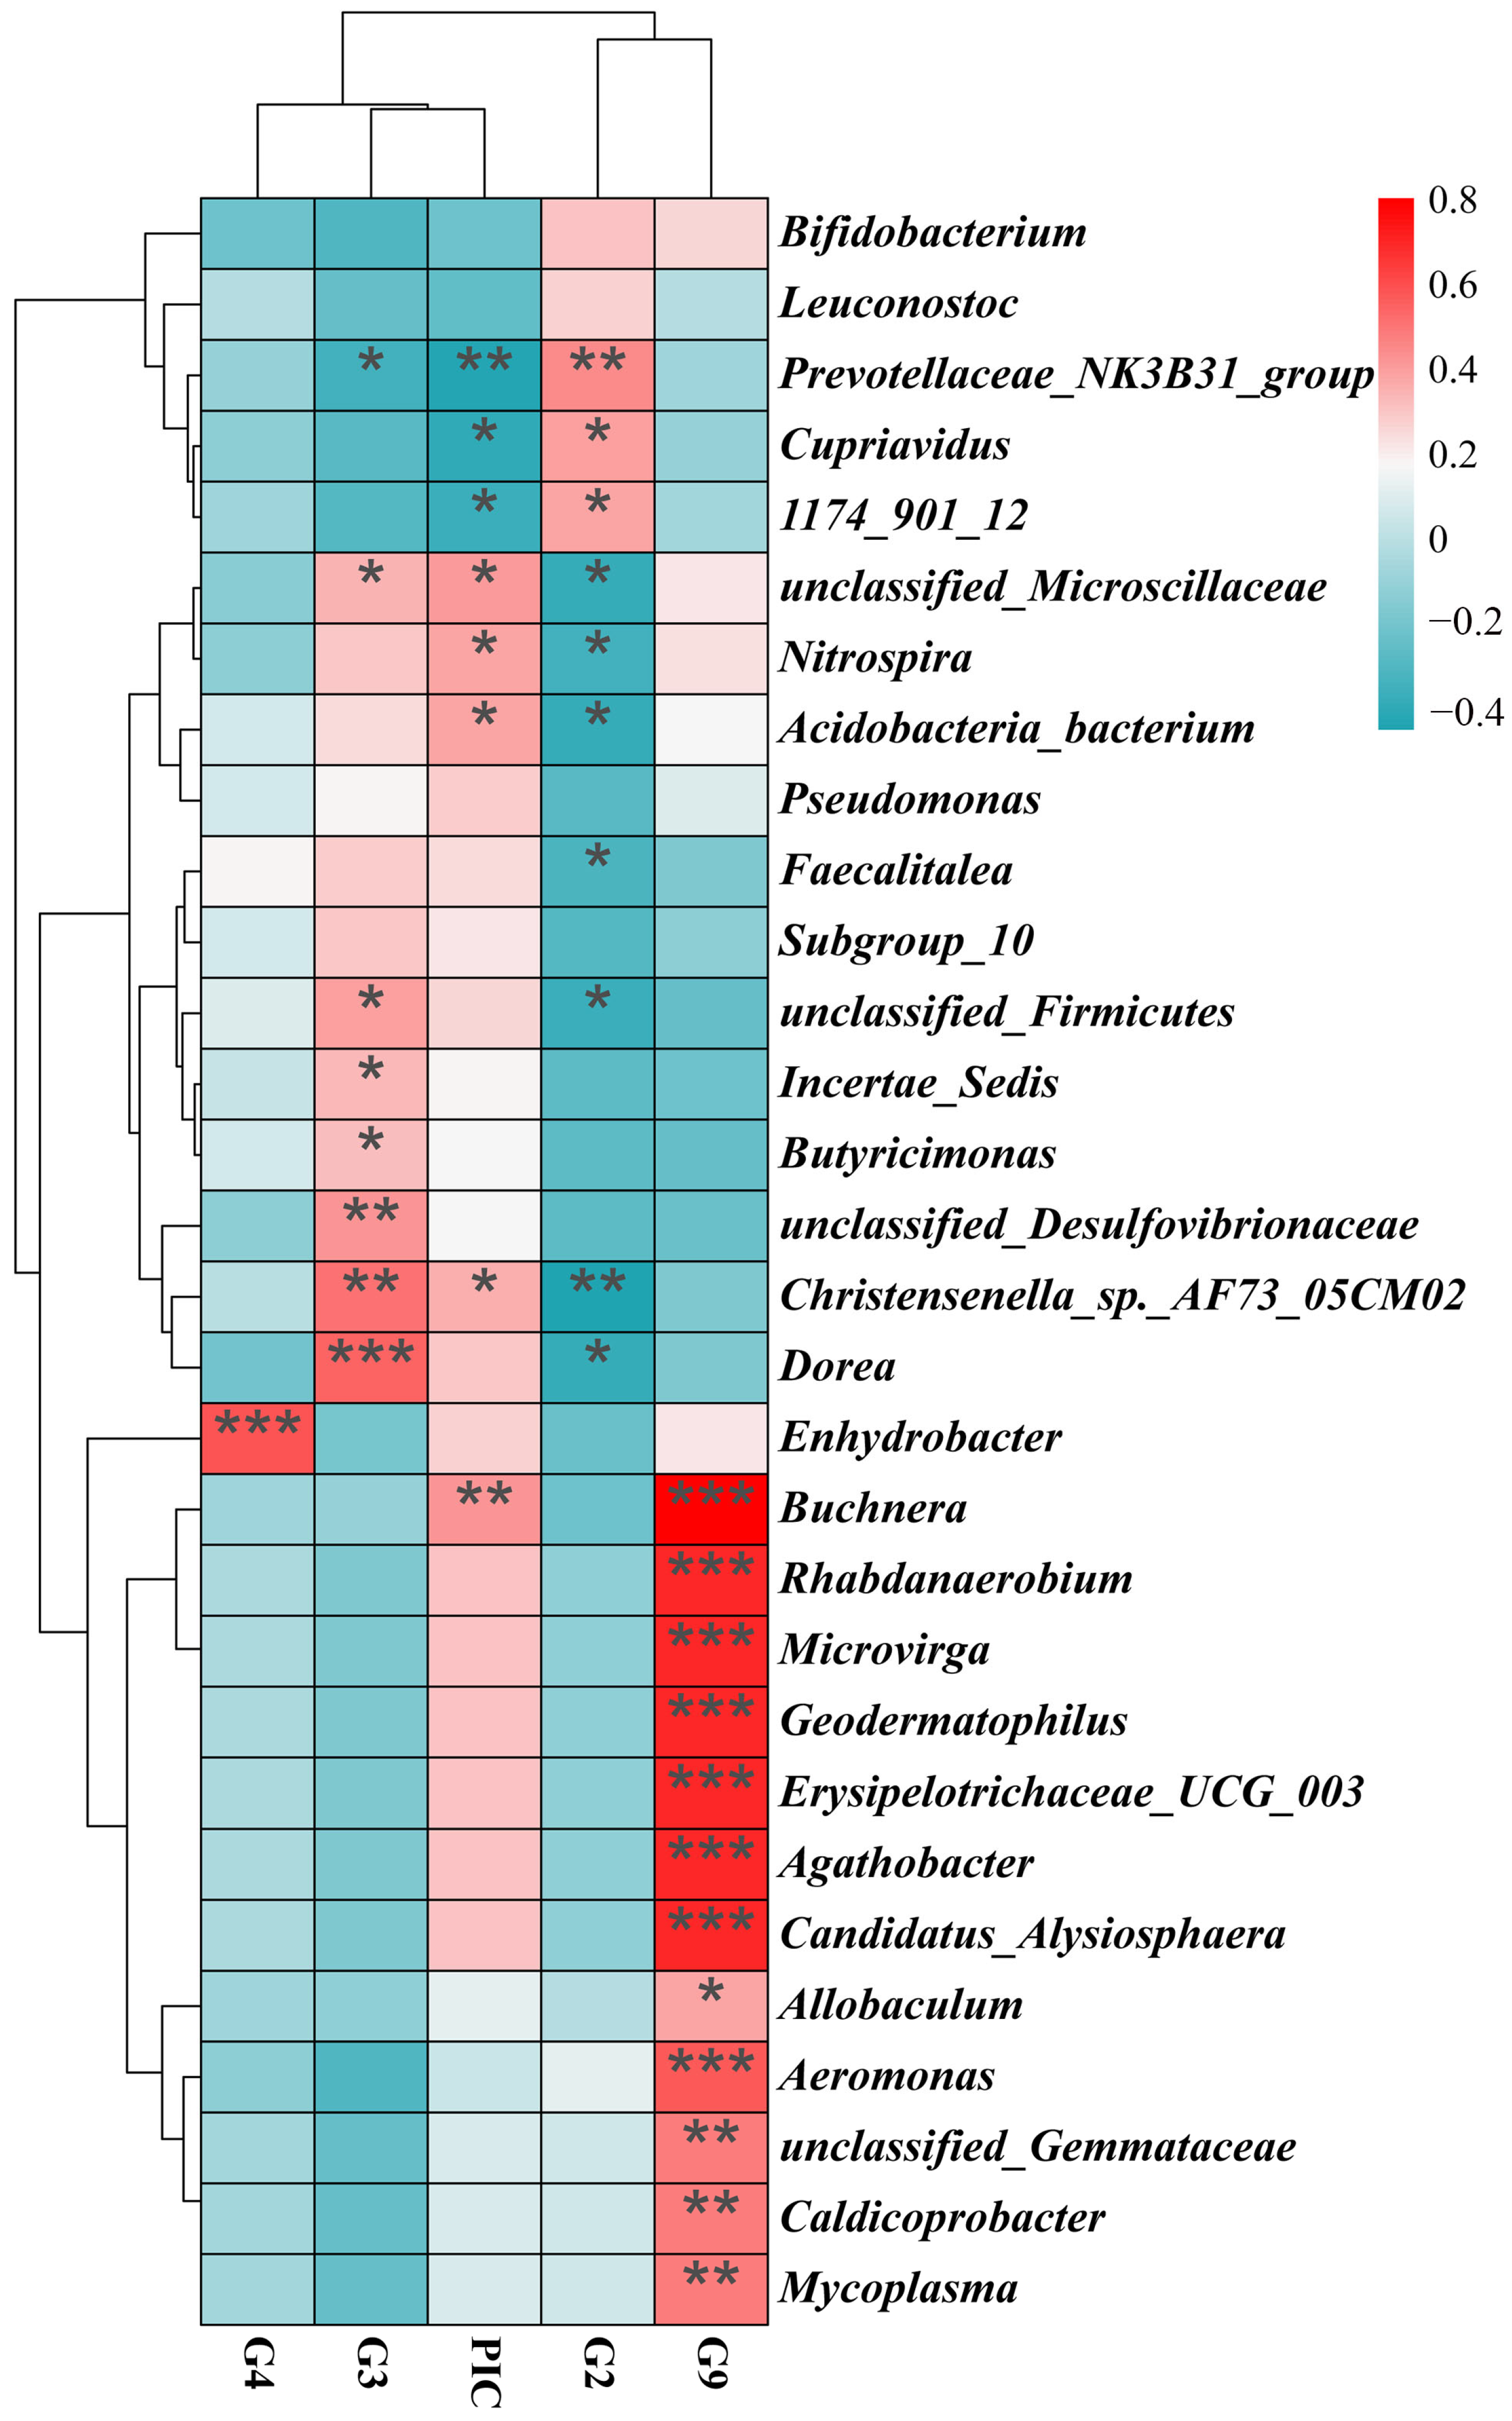
Multivariate analysis revealed that four DRB1e2 genotypes (G2–G4, G9) combined with polymorphism (PIC) explained 9.77% of total microbiota variation, though the overall model lacked significance (p = 0.26; Figure 6). Redundancy analysis (RDA) ordination showed Axis 1 divergence driven by antagonistic effects of G2/G9 versus G3/G4/PIC and Axis 2 divergence separating G2/G3 from G4/G9/PIC. Regarding the microbiota composition, G4/G9/PIC was positively correlated with Bacteroides, while G2/G3 was negatively correlated with Bacteroides. Furthermore, G2/G9 had positive correlation with Bifidobacterium spp. (Figure 6). The genotype-specific signatures showed that Buchnera was significantly positively correlated with G9 but negatively correlated with G2/G3/G4, while an exclusively positive correlation was found between G4 and Enhydrobacter. Some antagonistic relationships were also observed. For example, G3 was negatively correlated with Prevotellaceae, but G2 showed positive correlation; G3 was positively associated with Microscillaceae, Firmicutes, Dorea, and Christensenella, all of which were negatively correlated with G2. G9 demonstrated broad positive associations with multiple bacterial genera, indicating a distinct microbiota-modulating profile (Figure 7).

3.5. Enclosure Effects on Microbiota

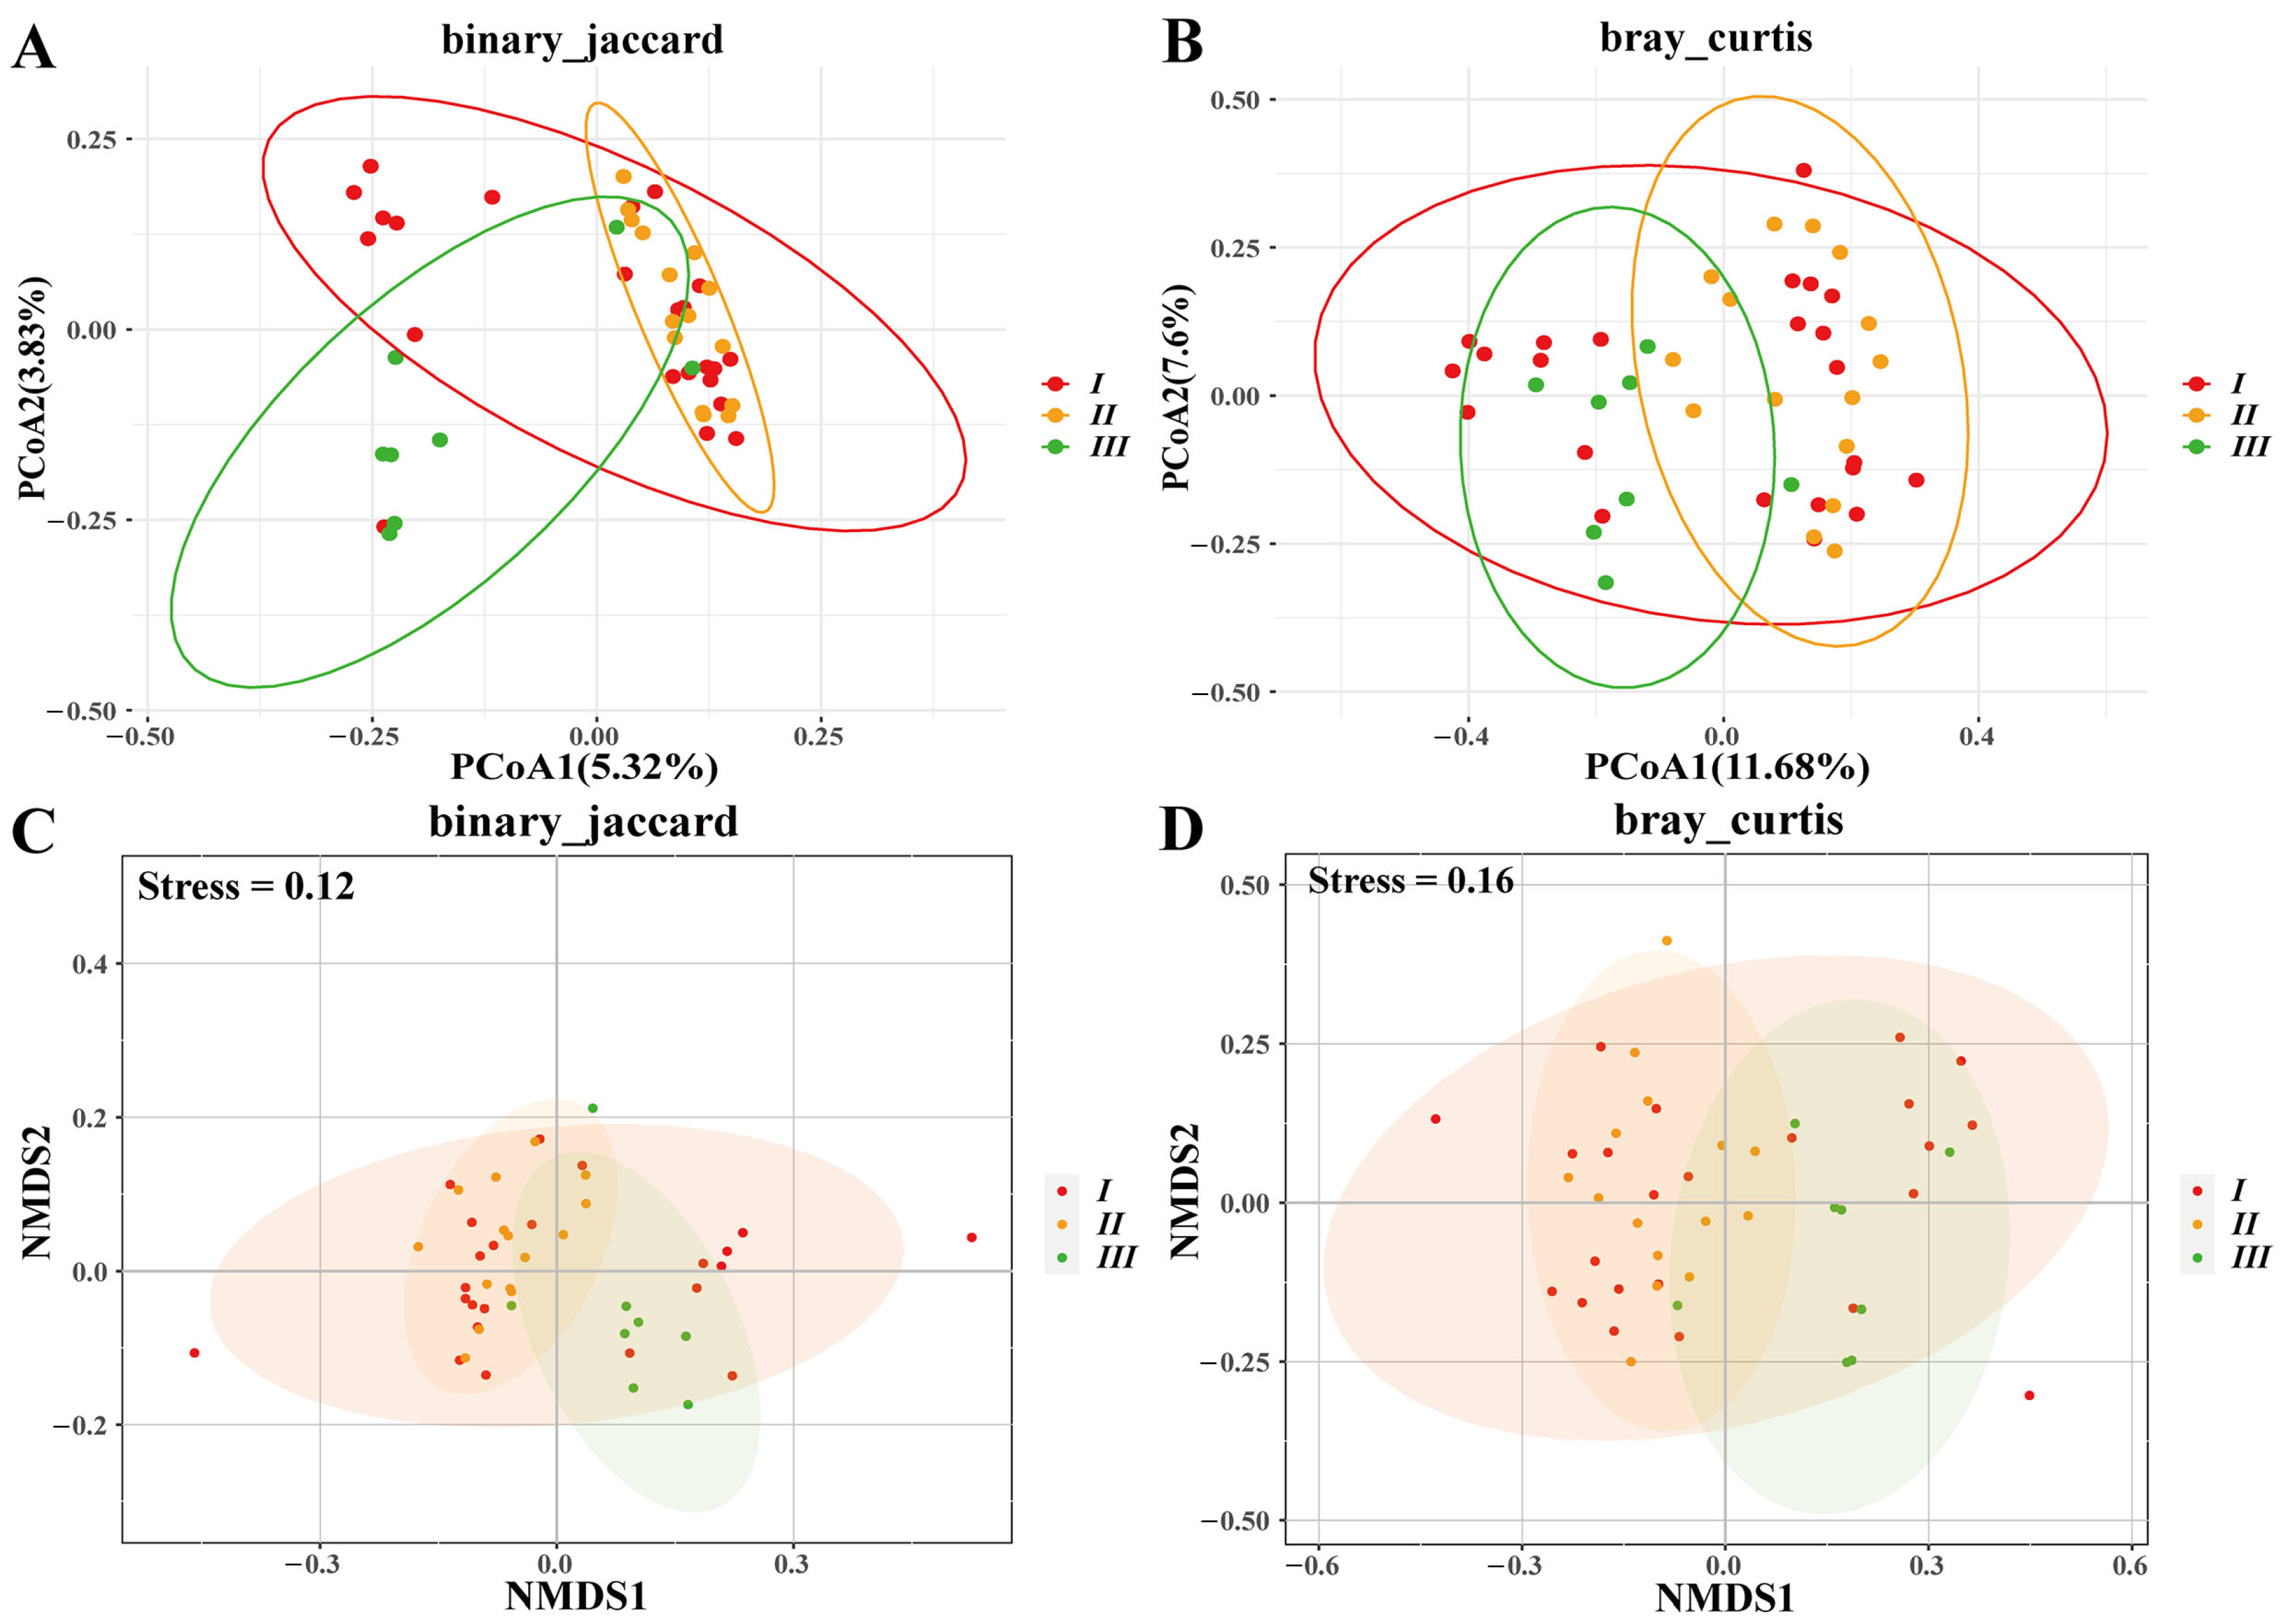
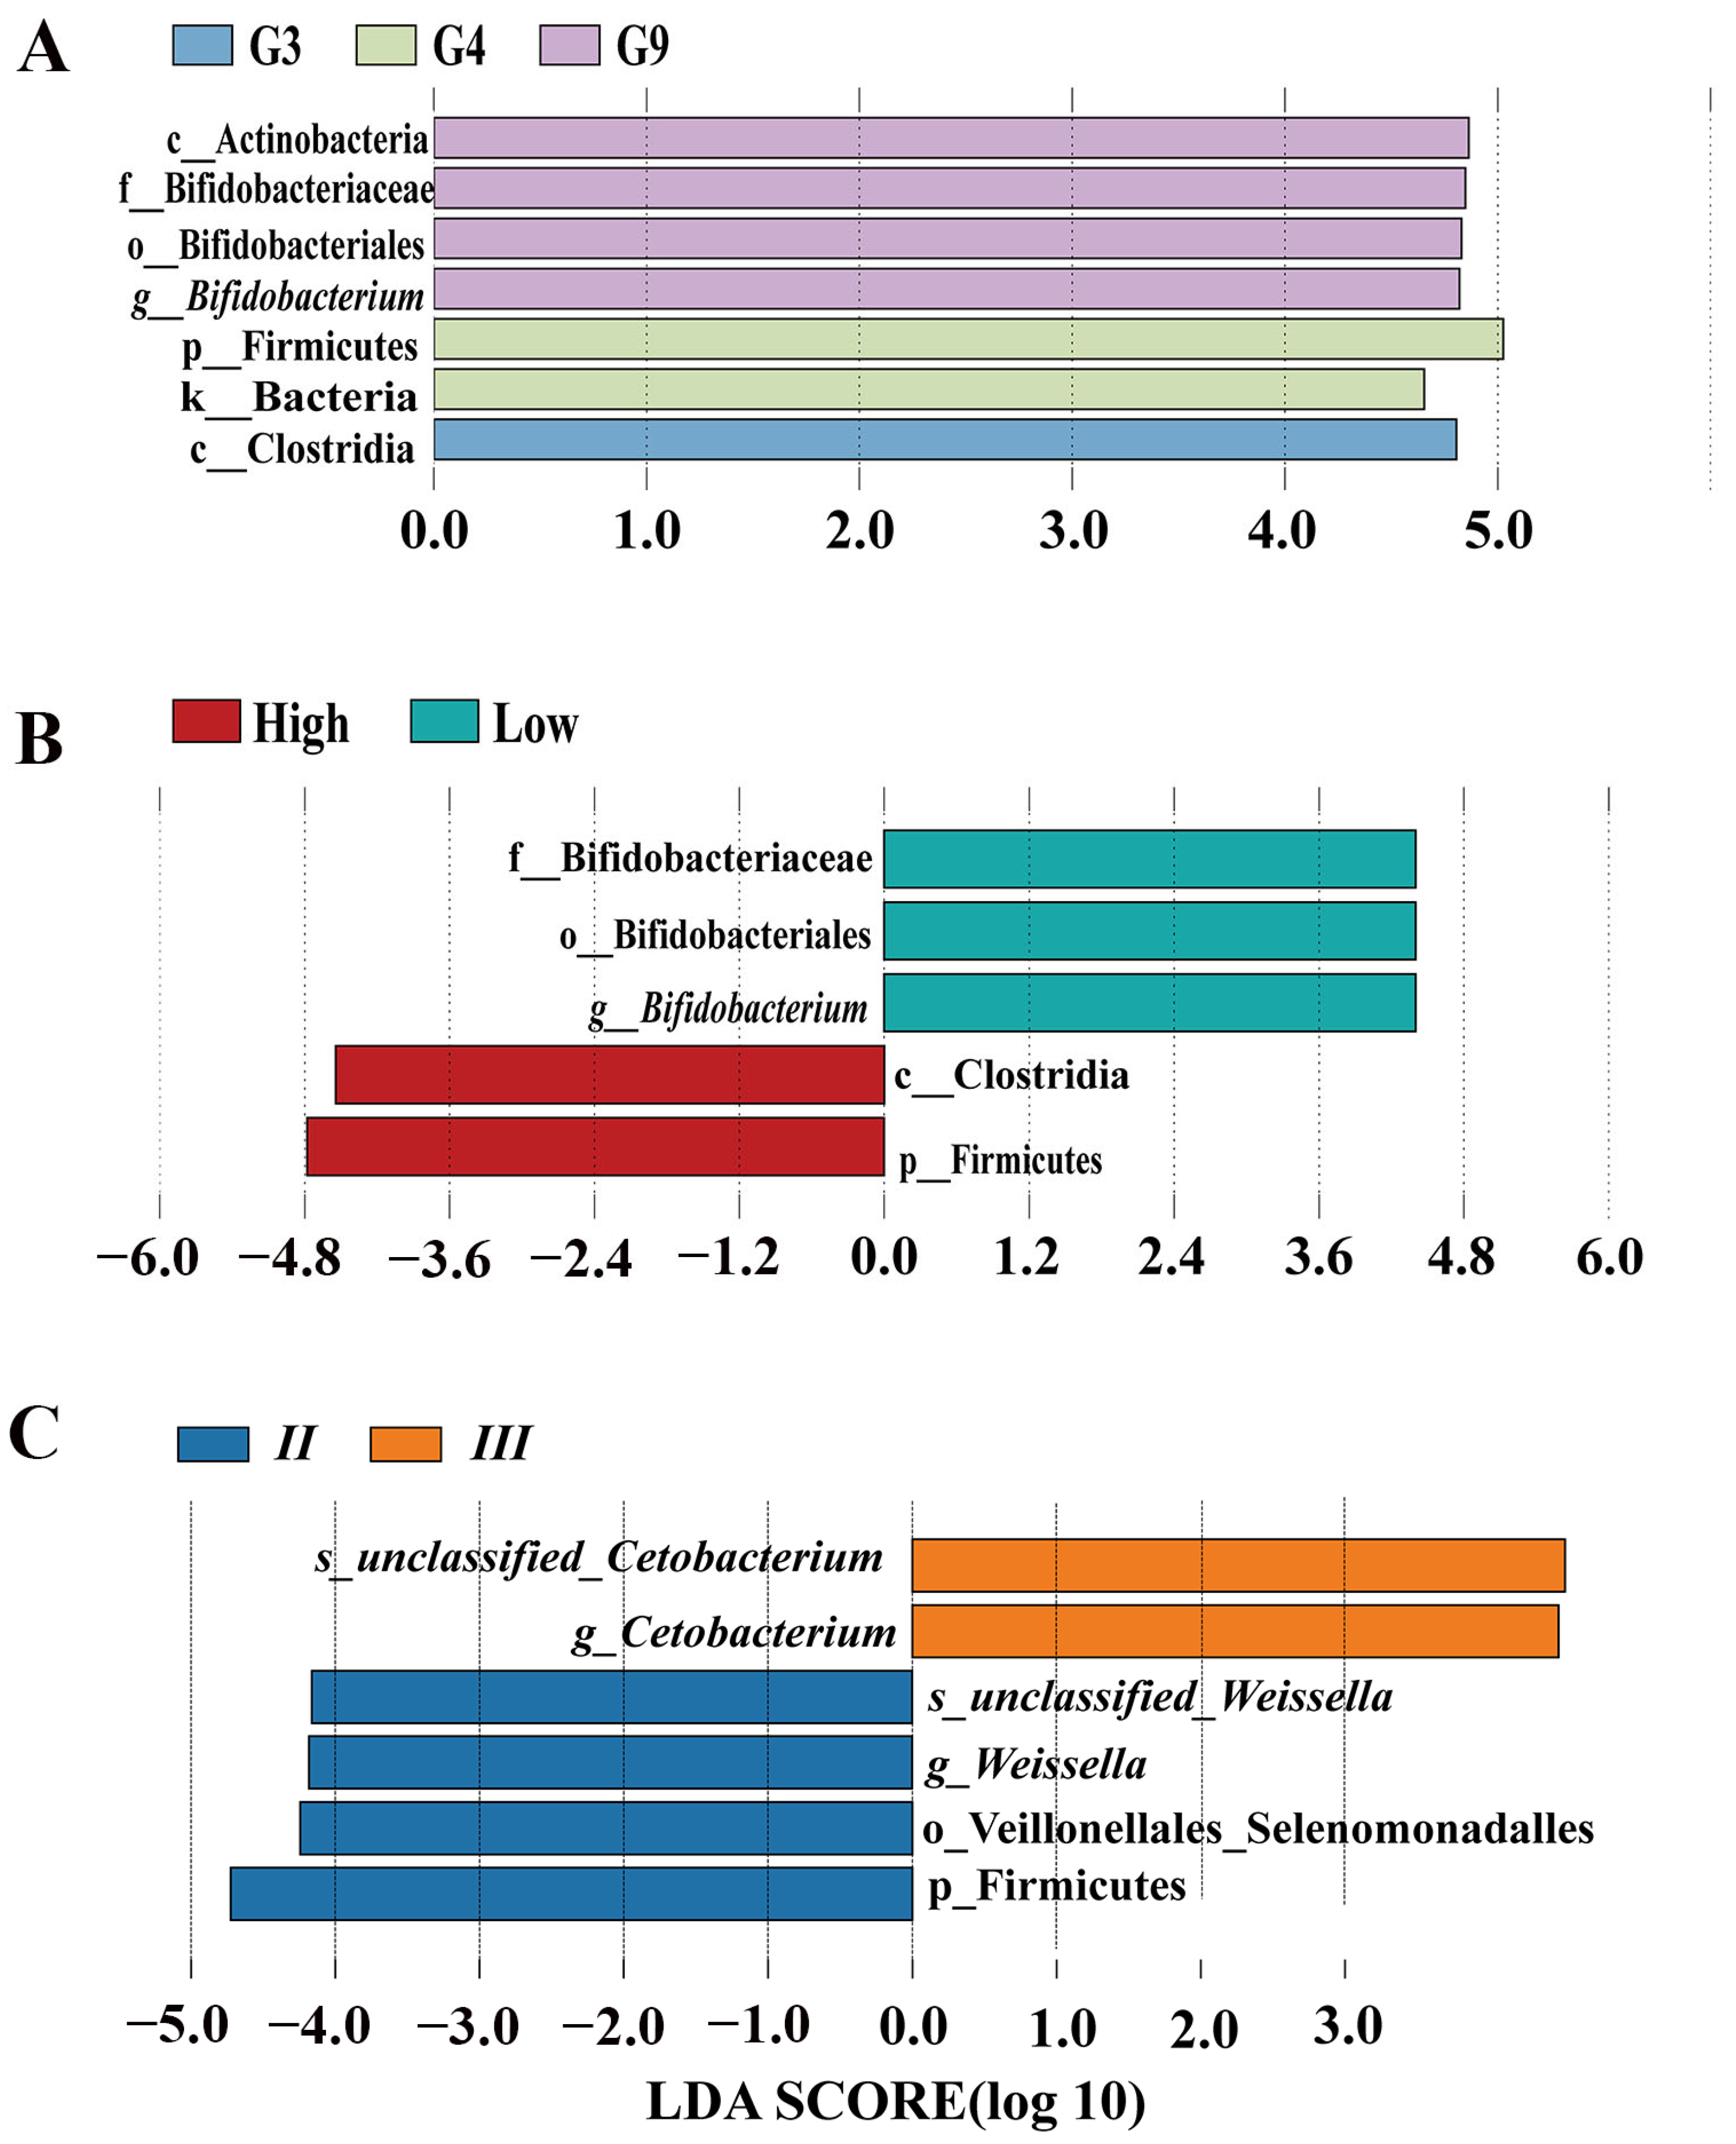
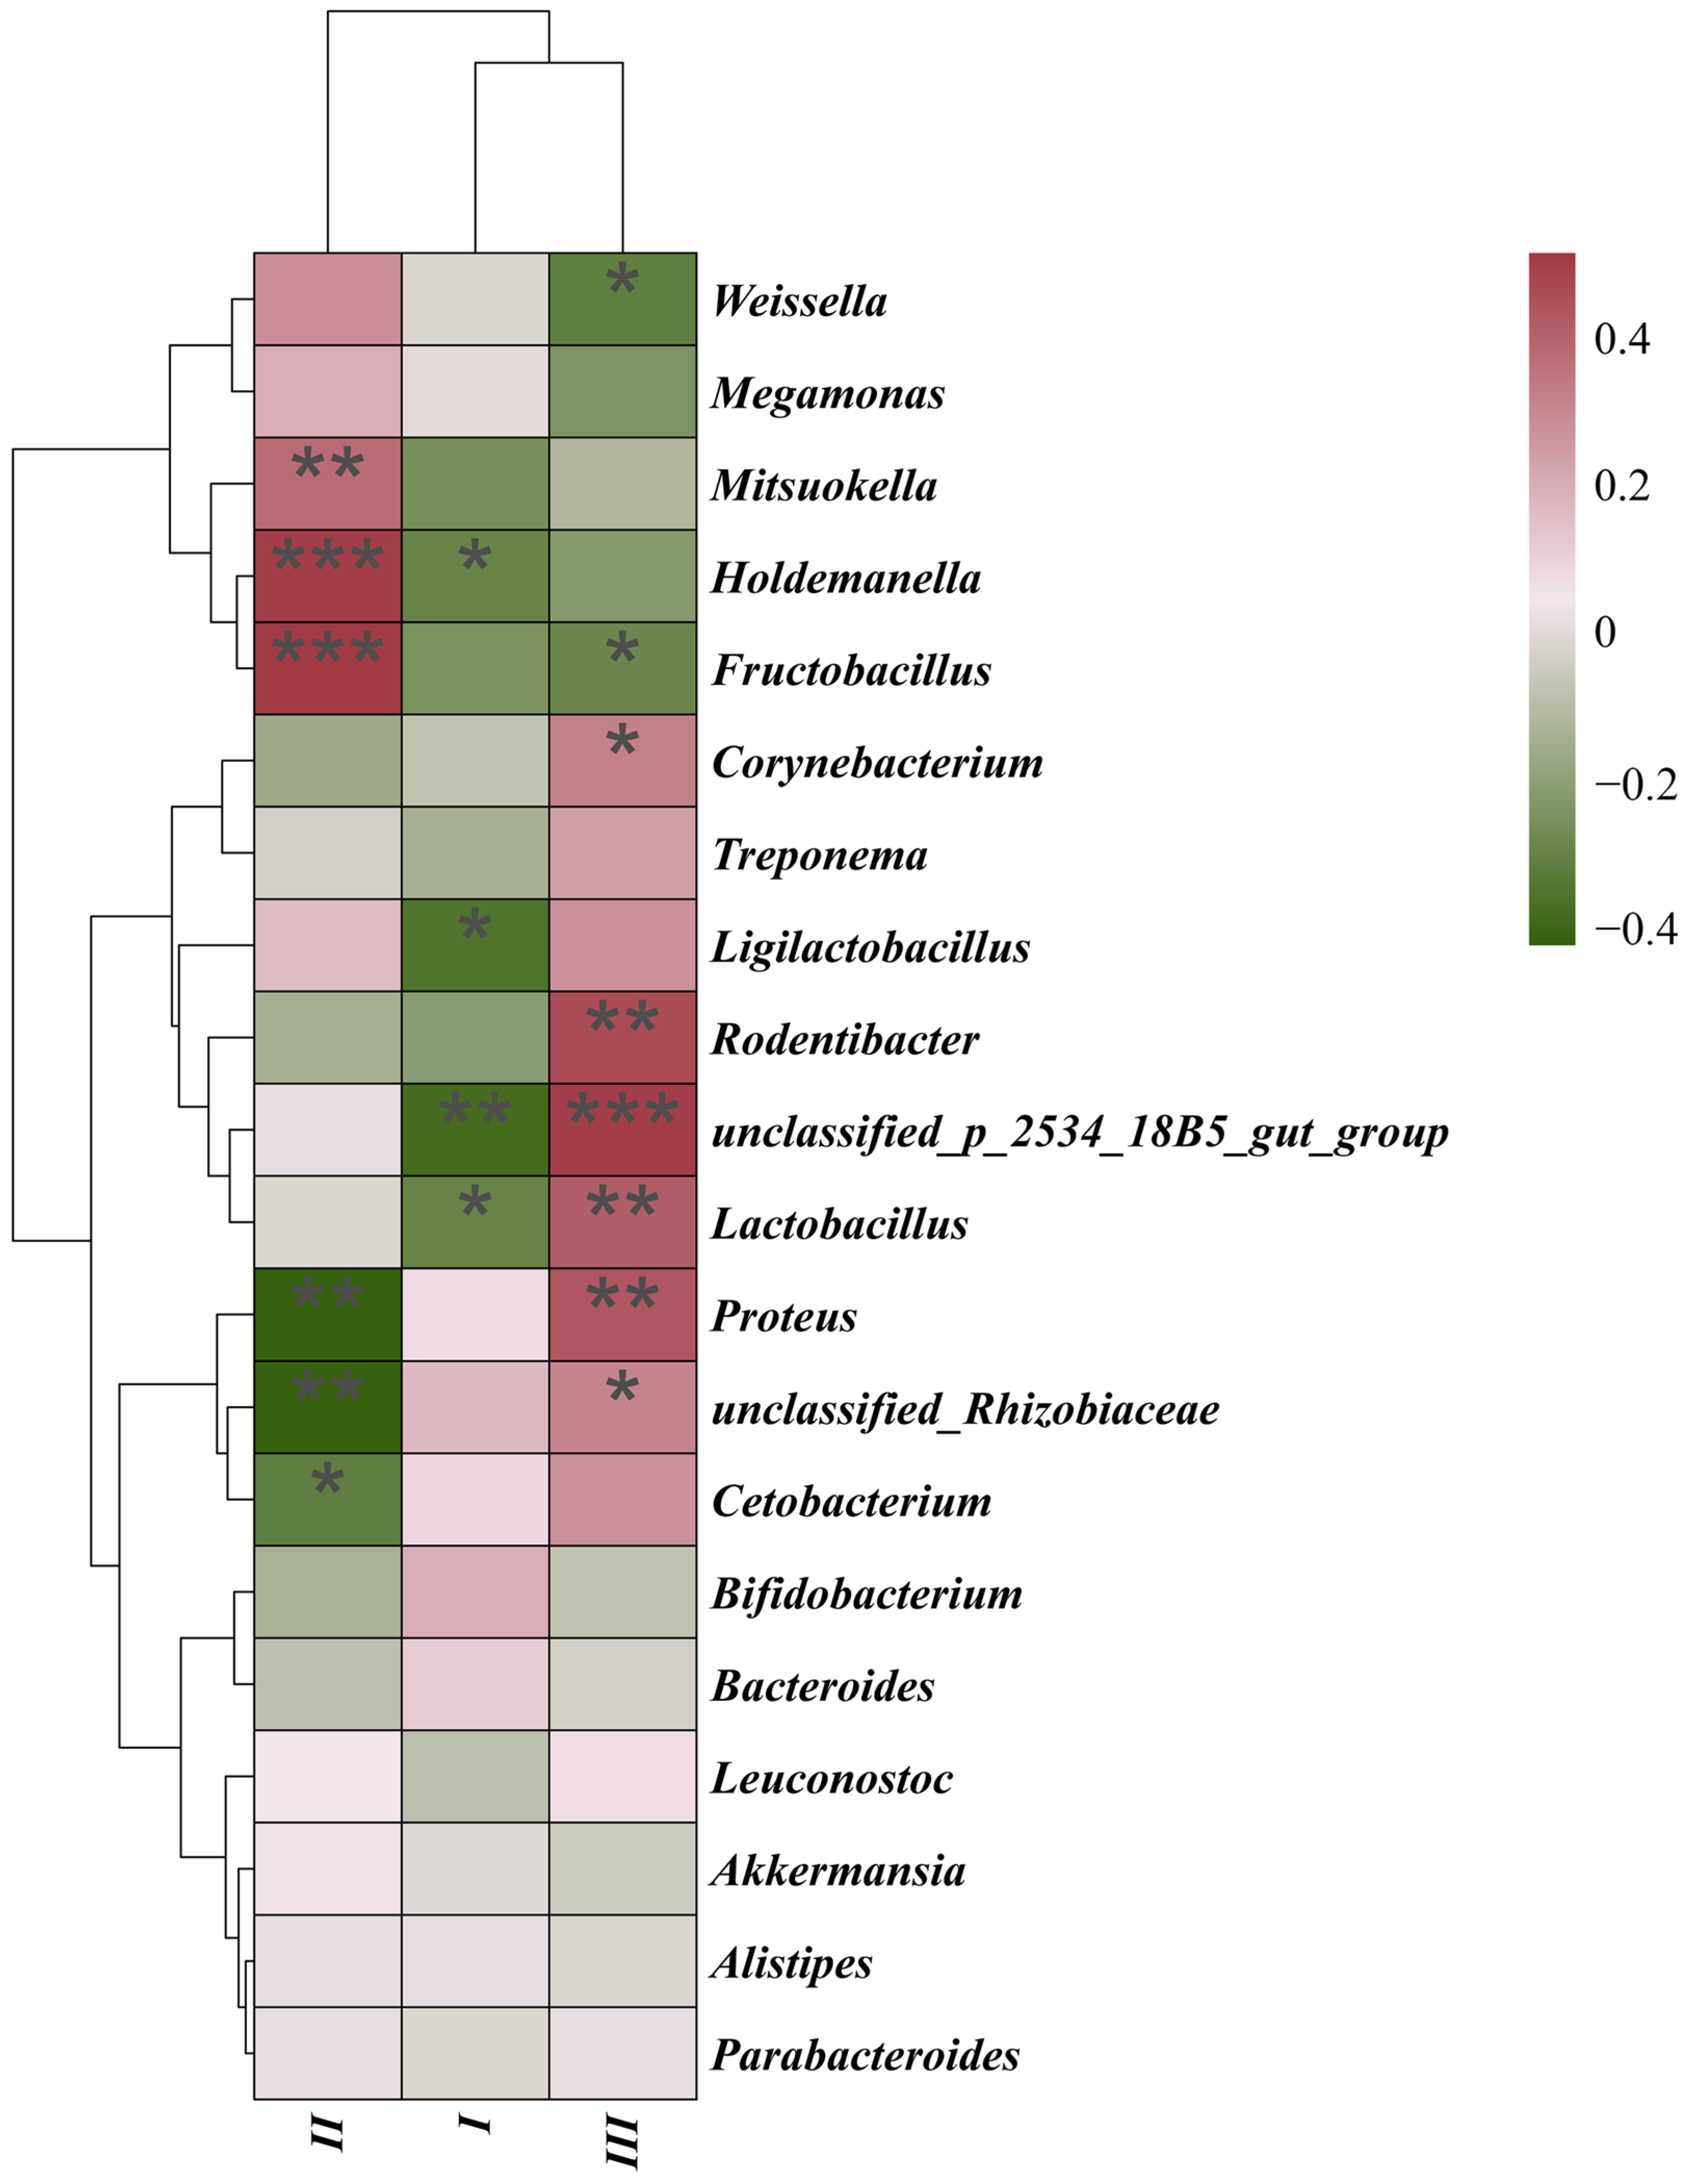
While α-diversity metrics (species richness, evenness, phylogenetic diversity) showed no significant differences among enclosure groups (Supplementary Figure S5), β-diversity analyses revealed distinct microbial structuring. PCoA/NMDS ordinations (Jaccard/Bray–Curtis) demonstrated greater separation between Group II and III than between I/II or I/III (p < 0.01; Figure 8). Group III exhibited the most divergent community composition. In addition, genus-level differential abundance analysis identified key taxonomic shifts. For example, Group II was enriched in Weissella, and Group III was dominated by Cetobacterium. Fructobacillus showed the most pronounced abundance gradient across groups. Group II vs. III exhibited stronger differentiation than I vs. II or I vs. III (Figure 9). Group III showed significant positive correlations with multiple bacterial genera, while Fructobacillus and Weissella were notably reduced (Figure 10). Redundancy analysis attributed 5.15% of total microbiota variation to enclosure differences, though the global model remained non-significant (p = 0.27; Figure 6). Ordination patterns revealed distinct patterns: Axis 1, Group I opposed to II/III; Axis 2, Group II opposed to I/III.

4. Discussion

4.1. Association Between DRB1e2 and Microbial Community

The high DRB1e2 polymorphism observed in captive Bengal slow lorises underscores its potential role in adaptive immune complexity. While our study cannot establish causality, the genotype-specific microbiota associations suggest coevolutionary dynamics, represented by allele-driven α-diversity modulation, bidirectional genotype–taxa relationships, and mechanistic knowledge gaps.
Elevated microbial richness in Nybe-DRB1*05 carriers (e.g., N1) implies allele-specific filtering of commensals, consistent with MHC-II-mediated microbial selection in primates [6]. Paradoxically, higher polymorphism reduced microbial evenness, potentially reflecting trade-offs between pathogen defense and symbiont maintenance. The antagonistic Buchnera responses (G2–G4 negative vs. G9 positive) mirror MHC-driven microbiota bifurcation [8]. As Buchnera supplies essential amino acids [24], G9-associated enrichment may enhance nutritional adaptation in captivity. G2’s strong correlation with Bifidobacterium spp.—a keystone genus in wild exudativorous primates [25]—highlights how host genetics interacts with dietary interventions [17] to shape beneficial taxa. The broad positive correlations of G9 with multiple genera may arise from its high allelic dosage (6 alleles), supporting the “gene dosage effect” hypothesis in MHC–microbiota crosstalk [26]. Though DRB1e2 variants explained 9.77% microbiota variation, it inherently lacks the functional resolution to directly distinguish whether these shifts arise from this specific form of immune selection or from other potential mechanisms influenced by MHC, such as differential tolerance induction or indirect effects on gut physiology or inflammation. To unequivocally demonstrate the role of immune filtering via IgA targeting or similar adaptive immune mechanisms, future studies would greatly benefit from incorporating metatranscriptomic analysis.

4.2. Captive Environment as a Microbiota Modulator

The results unequivocally demonstrate that captive enclosure design restructures gut microbial communities in Bengal slow lorises, with β-diversity analysis revealing significant divergence in Group III (socially housed enriched enclosures) compared to Groups I/II (single-cage housing). This environmental effect manifests through two interconnected mechanisms: (1) social housing-mediated microbial exchange facilitated by direct conspecific contact, overriding genetic background limitations in microbial transmission [27] and (2) physical complexity-driven exposure diversity where climbing structures introduce novel environmental microbiota, altering colonization dynamics [18]. Taxon-specific shifts carry critical health implications: Group II exhibited Weissella enrichment—a fermentative symbiont enhancing nutrient utilization—while Group III showed dualistic alterations including beneficial Cetobacterium (vitamin B12 synthesis) and Lactobacillus augmentation (pathogen exclusion via bacteriocin production) [28] but concerning depletion of Fructobacillus (reducing SCFA output) and paradoxical enrichment of opportunistic pathogens (Proteus and Corynebacterium spp.) [29]. This “pathogen paradox” suggests environmental enrichment simultaneously increases pathogen exposure risk while enhancing microbial resilience through Lactobacillus-mediated competitive exclusion—a trade-off demanding careful management in conservation settings. Critically, when contextualized with our genetic findings, enclosures explained 5.15% of microbiota variance versus 9.77% from DRB1e2 polymorphism, underscoring that while environmental modulation is significant [25], host genetics exerts predominant control. This necessitates integrated ex situ management strategies that pair genotype-targeted interventions (e.g., prioritizing high-heterozygosity individuals) with optimized enclosure designs balancing microbial diversity gains against pathogen risks.

5. Conclusions

This study establishes that MHC-II DRB1e2 polymorphism (PIC = 0.82) is the primary driver of gut microbiota structure in captive Bengal slow lorises, explaining 9.77% of variation—nearly double the environmental contribution (5.15%) from enclosures. Key findings reveal (1) genotype-specific microbial signatures, notably G9’s enrichment of nutritional symbiont Buchnera and SCFA-producers, and G2’s association with Bifidobacterium spp. essential for exudativory; (2) a paradoxical reduction in microbial evenness under high polymorphism, suggesting trade-offs in immune-mediated microbial filtering; (3) enclosure-driven trade-offs where enriched Group III elevated beneficial Lactobacillus but concurrently increased pathogens (Proteus, Corynebacterium). These results demonstrate MHC–microbiota co-adaptation as a critical adaptive mechanism, advocating for genotype-targeted interventions: prioritizing ex situ breeding of high-heterozygosity individuals (e.g., G9 carriers), implementing allele-matched diets (e.g., gum arabic for G2 genotypes), and optimizing enclosure designs to balance microbial diversity with pathogen control. This integrated genetic–microbial framework significantly advances conservation strategies for this endangered primate.

Supplementary Materials

The following supporting information can be downloaded at: https://www.mdpi.com/article/10.3390/biology14081094/s1, Figure S1: Comparison of ACE (A), Chao1 (B), Shannon (C), and PD_whole_tree (D) indices across different polymorphisms; Figure S2: Shannon and PD_whole_tree comparison under genotypes; Figure S3: PCoA (A,B) and NMDS (C,D) analysis of β diversity (weighted unifrac and unweighted unifrac distances) under different genotypes of DRB1e2; Figure S4: PCoA (A,B) and NMDS (C,D) analysis of β diversity (weighted unifrac and unweighted unifrac distances) under different polymorphisms of DRB1e2; Figure S5: Comparison of α diversity indices under enclosures; Figure S6: PCoA (A,B) and NMDS (C,D) analysis of β diversity (weighted unifrac and unweighted unifrac distances) under different enclosures; Figure S7: binary_jaccard.permanova.DistMatrixBoxplot under different enclosures; Table S1: DRB1 allele frequencies and genotype frequencies in Bengal slow lorises under different enclosures; Table S2: The amino acid sequence of DRB1e2 in Bengal slow lorises; Table S3: Genotype statistics of the Bengal slow loris DRB1e2.

Author Contributions

Conceptualization, R.J., X.Z., and M.X.; methodology, R.J. and X.Z.; software, R.J., L.X., and X.Z.; formal analysis, R.J. and X.Z.; investigation, L.X., Y.Z., and C.Z.; resources, Y.Y., H.X., and Q.N.; data curation, C.Y. and X.W.; writing—original draft preparation, R.J., X.Z., and Q.N.; writing—review and editing, M.X. and C.L.; funding acquisition, Q.N. All authors have read and agreed to the published version of the manuscript.

Funding

This study was supported by the National Natural Science Foundation of China (No. 32070521).

Institutional Review Board Statement

The study was conducted according to the guidelines of the Declaration of Helsinki and approved by the Institutional Review Board (IRB13627) and the Institutional Animal Care and Use Committee of the Sichuan Agricultural University, China, under permit number 20240098, approved on 7 March 2024.

Data Availability Statement

The raw sequence data reported in this paper have been deposited in the Genome Sequence Archive (Genomics, Proteomics & Bioinformatics 2021) in National Genomics Data Center (Nucleic Acids Res 2022), China National Center for Bioinformation/Beijing Institute of Genomics, Chinese Academy of Sciences (GSA: CRA021047), and are publicly accessible at https://ngdc.cncb.ac.cn/gsa accessed on 5 December 2024.

Acknowledgments

We thank the whole staff of Dehong Wildlife Rescue Center for facilitating the research.

Conflicts of Interest

The authors declare no conflicts of interest.

References

  1. Wang, Y.; Zhan, H.; Saif, A.; Zhang, X.; Su, H. Analysis of winter survival strategies of sympatric black-necked cranes, and common cranes from the perspective of diet and gut microbiota. Ecol. Indic. 2024, 160, 111782. [Google Scholar] [CrossRef]
  2. Scholier, T.; Lavrinienko, A.; Kallio, E.R.; Watts, P.C.; Mappes, T. Effects of past and present habitat on the gut microbiota of a wild rodent. Proc. R. Soc. B Biol. Sci. 2024, 291, 20232531. [Google Scholar] [CrossRef] [PubMed]
  3. Larzul, C.; Estellé, J.; Borey, M.; Blanc, F.; Lemonnier, G.; Billon, Y.; Thiam, M.G.; Quinquis, B.; Galleron, N.; Jardet, D.; et al. Driving gut microbiota enterotypes through host genetics. Microbiome 2024, 12, 116. [Google Scholar] [CrossRef]
  4. Bawden, E.G.; Wagner, T.; Schröder, J.; Effern, M.; Hinze, D.; Newland, L.; Attrill, G.H.; Lee, A.R.; Engel, S.; Freestone, D.; et al. CD4+ T cell immunity against cutaneous melanoma encompasses multifaceted MHC II–dependent responses. Sci. Immunol. 2024, 9, eadi9517. [Google Scholar] [CrossRef]
  5. König, R.; Huang, L.-Y.; Germain, R.N. MHC class II interaction with CD4 mediated by a region analogous to the MHC class I binding site for CD8. Nature 1992, 356, 796–798. [Google Scholar] [CrossRef]
  6. Kubinak, J.L.; Stephens, W.Z.; Soto, R.; Petersen, C.; Chiaro, T.; Gogokhia, L.; Bell, R.; Ajami, N.J.; Petrosino, J.F.; Morrison, L.; et al. MHC variation sculpts individualized microbial communities that control susceptibility to enteric infection. Nat. Commun. 2015, 6, 8642. [Google Scholar] [CrossRef] [PubMed]
  7. Roland, M.M.; Mohammed, A.D.; Kubinak, J.L. How MHCII signaling promotes benign host-microbiota interactions. PLoS Pathog. 2020, 16, e1008558. [Google Scholar] [CrossRef]
  8. Fleischer, R.; Schmid, D.W.; Wasimuddin; Brändel, S.D.; Rasche, A.; Corman, V.M.; Drosten, C.; Tschapka, M.; Sommer, S. Interaction between MHC diversity and constitution, gut microbiota and Astrovirus infections in a neotropical bat. Mol. Ecol. 2022, 31, 3342–3359. [Google Scholar] [CrossRef]
  9. Montero, B.K.; Wasimuddin; Schwensow, N.; Gillingham, M.A.F.; Ratovonamana, Y.R.; Rakotondranary, S.J.; Corman, V.; Drosten, C.; Ganzhorn, J.U.; Sommer, S. Evidence of MHC class I and II influencing viral and helminth infection via the microbiome in a non-human primate. PLoS Pathog. 2021, 17, e1009675. [Google Scholar] [CrossRef]
  10. Fogel, A.T. The Gut Microbiome of Wild Lemurs: A Comparison of Sympatric Lemur catta and Propithecus verreauxi. Folia Primatol. 2015, 86, 85–95. [Google Scholar] [CrossRef]
  11. de Winter, I.I.; Qurkhuli, T.; de Groot, N.; de Vos-Rouweler, A.J.M.; van Hooft, P.; Heitkönig, I.M.A.; Prins, H.H.T.; Bontrop, R.E.; Doxiadis, G.G.M. Determining Mhc-DRB profiles in wild populations of three congeneric true lemur species by noninvasive methods. Immunogenetics 2019, 71, 97–107. [Google Scholar] [CrossRef] [PubMed]
  12. Petersen, R.M.; Bergey, C.M.; Roos, C.; Higham, J.P. Relationship between genome-wide and MHC class I and II genetic diversity and complementarity in a nonhuman primate. Ecol. Evol. 2022, 12, e9346. [Google Scholar] [CrossRef] [PubMed]
  13. Uren Webster, T.M.; Consuegra, S.; Hitchings, M.; Garcia de Leaniz, C. Interpopulation Variation in the Atlantic Salmon Microbiome Reflects Environmental and Genetic Diversity. Appl. Environ. Microbiol. 2018, 84, e00691-18. [Google Scholar] [CrossRef]
  14. Couch, C.E.; Epps, C.W. Host, Microbiome, and Complex Space: Applying Population and Landscape Genetic Approaches to Gut Microbiome Research in Wild Populations. J. Hered. 2022, 113, 221–234. [Google Scholar] [CrossRef] [PubMed]
  15. Qingyong, N.; Xin, H.; Yu, W.; Xiangyun, M. Distribution and Conservation Status of Slow Lorises in Indo-China. In Evolution, Ecology and Conservation of Lorises and Pottos; Nekaris, K.A.I., Burrows, A.M., Eds.; Cambridge Studies in Biological and Evolutionary Anthropology; Cambridge University Press: Cambridge, UK, 2020; pp. 326–338. [Google Scholar]
  16. Thạch, H.M.; Le, M.D.; Vũ, N.B.; Panariello, A.; Sethi, G.; Sterling, E.J.; Blair, M.E. Slow Loris Trade in Vietnam: Exploring Diverse Knowledge and Values. Folia Primatol. 2018, 89, 45–62. [Google Scholar] [CrossRef]
  17. Qingyong, N.; Chen, Z.; Diyan, L.; Huailiang, X.; Yongfang, Y.; Mingwang, Z.; Xiaolan, F.; Bo, Z.; Deying, Y.; Meng, X. Effects of Dietary Alteration on the Gut Microbiome and Metabolome of the Rescued Bengal Slow Loris. Front. Microbiol. 2021, 12, 650991. [Google Scholar] [CrossRef]
  18. McKenzie, V.J.; Song, S.J.; Delsuc, F.; Prest, T.L.; Oliverio, A.M.; Korpita, T.M.; Alexiev, A.; Amato, K.R.; Metcalf, J.L.; Kowalewski, M.; et al. The Effects of Captivity on the Mammalian Gut Microbiome. Integr. Comp. Biol. 2017, 57, 690–704. [Google Scholar] [CrossRef]
  19. Doxiadis, G.G.M.; Otting, N.; Groot, N.G.d.; Groot, N.d.; Rouweler, A.J.M.; Noort, R.; Verschoor, E.J.; Bontjer, I.; Bontrop, R.E. Evolutionary stability of MHC class II haplotypes in diverse rhesus macaque populations. Immunogenetics 2003, 55, 540–551. [Google Scholar] [CrossRef]
  20. Song, X.; Zhang, P.; Huang, K.; Chen, D.; Guo, S.; Qi, X.; He, G.; Pan, R.; Li, B. The influence of positive selection and trans-species evolution on DPB diversity in the golden snub-nosed monkeys (Rhinopithecus roxellana). Primates 2016, 57, 489–499. [Google Scholar] [CrossRef]
  21. Pierini, F.; Nutsua, M.; Böhme, L.; Özer, O.; Bonczarowska, J.; Susat, J.; Franke, A.; Nebel, A.; Krause-Kyora, B.; Lenz, T.L. Targeted analysis of polymorphic loci from low-coverage shotgun sequence data allows accurate genotyping of HLA genes in historical human populations. Sci. Rep. 2020, 10, 7339. [Google Scholar] [CrossRef]
  22. Kennedy, L.J.; Ryvar, R.; Gaskell, R.M.; Addie, D.D.; Willoughby, K.; Carter, S.D.; Thomson, W.; Ollier, W.E.R.; Radford, A.D. Sequence analysis of MHC DRB alleles in domestic cats from the United Kingdom. Immunogenetics 2002, 54, 348–352. [Google Scholar] [CrossRef] [PubMed]
  23. Rozas, J.; Ferrer-Mata, A.; Sánchez-DelBarrio, J.C.; Guirao-Rico, S.; Librado, P.; Ramos-Onsins, S.E.; Sánchez-Gracia, A. DnaSP 6: DNA Sequence Polymorphism Analysis of Large Data Sets. Mol. Biol. Evol. 2017, 34, 3299–3302. [Google Scholar] [CrossRef]
  24. Pers, D.; Hansen, A.K. The boom and bust of the aphid’s essential amino acid metabolism across nymphal development. G3-Genes Genomes Genet. 2021, 11, jkab115. [Google Scholar] [CrossRef]
  25. Cabana, F.; Clayton, J.B.; Nekaris, K.A.I.; Wirdateti, W.; Knights, D.; Seedorf, H. Nutrient-based diet modifications impact on the gut microbiome of the Javan slow loris (Nycticebus javanicus). Sci. Rep. 2019, 9, 4078. [Google Scholar] [CrossRef]
  26. Khan, M.A.W.; Stephens, W.Z.; Mohammed, A.D.; Round, J.L.; Kubinak, J.L. Does MHC heterozygosity influence microbiota form and function? PLoS ONE 2019, 14, e0215946. [Google Scholar] [CrossRef] [PubMed]
  27. Clayton, J.B.; Vangay, P.; Huang, H.; Ward, T.; Hillmann, B.M.; Al-Ghalith, G.A.; Travis, D.A.; Long, H.T.; Tuan, B.V.; Minh, V.V.; et al. Captivity humanizes the primate microbiome. Proc. Natl. Acad. Sci. USA 2016, 113, 10376–10381. [Google Scholar] [CrossRef] [PubMed]
  28. Reid, G.; Burton, J. Use of Lactobacillus to prevent infection by pathogenic bacteria. Microbes Infect. 2002, 4, 319–324. [Google Scholar] [CrossRef]
  29. Hoefer, A.; Seth-Smith, H.; Palma, F.; Schindler, S.; Freschi, L.; Dangel, A.; Berger, A.; D’Aeth, J.; Indra, A.; Fry, N.K.; et al. Phenotypic and genomic analysis of a large-scale Corynebacterium diphtheriae outbreak among migrant populations in Europe. medRxiv 2023. medRxiv:2023.11.10.23297228. [Google Scholar] [CrossRef]
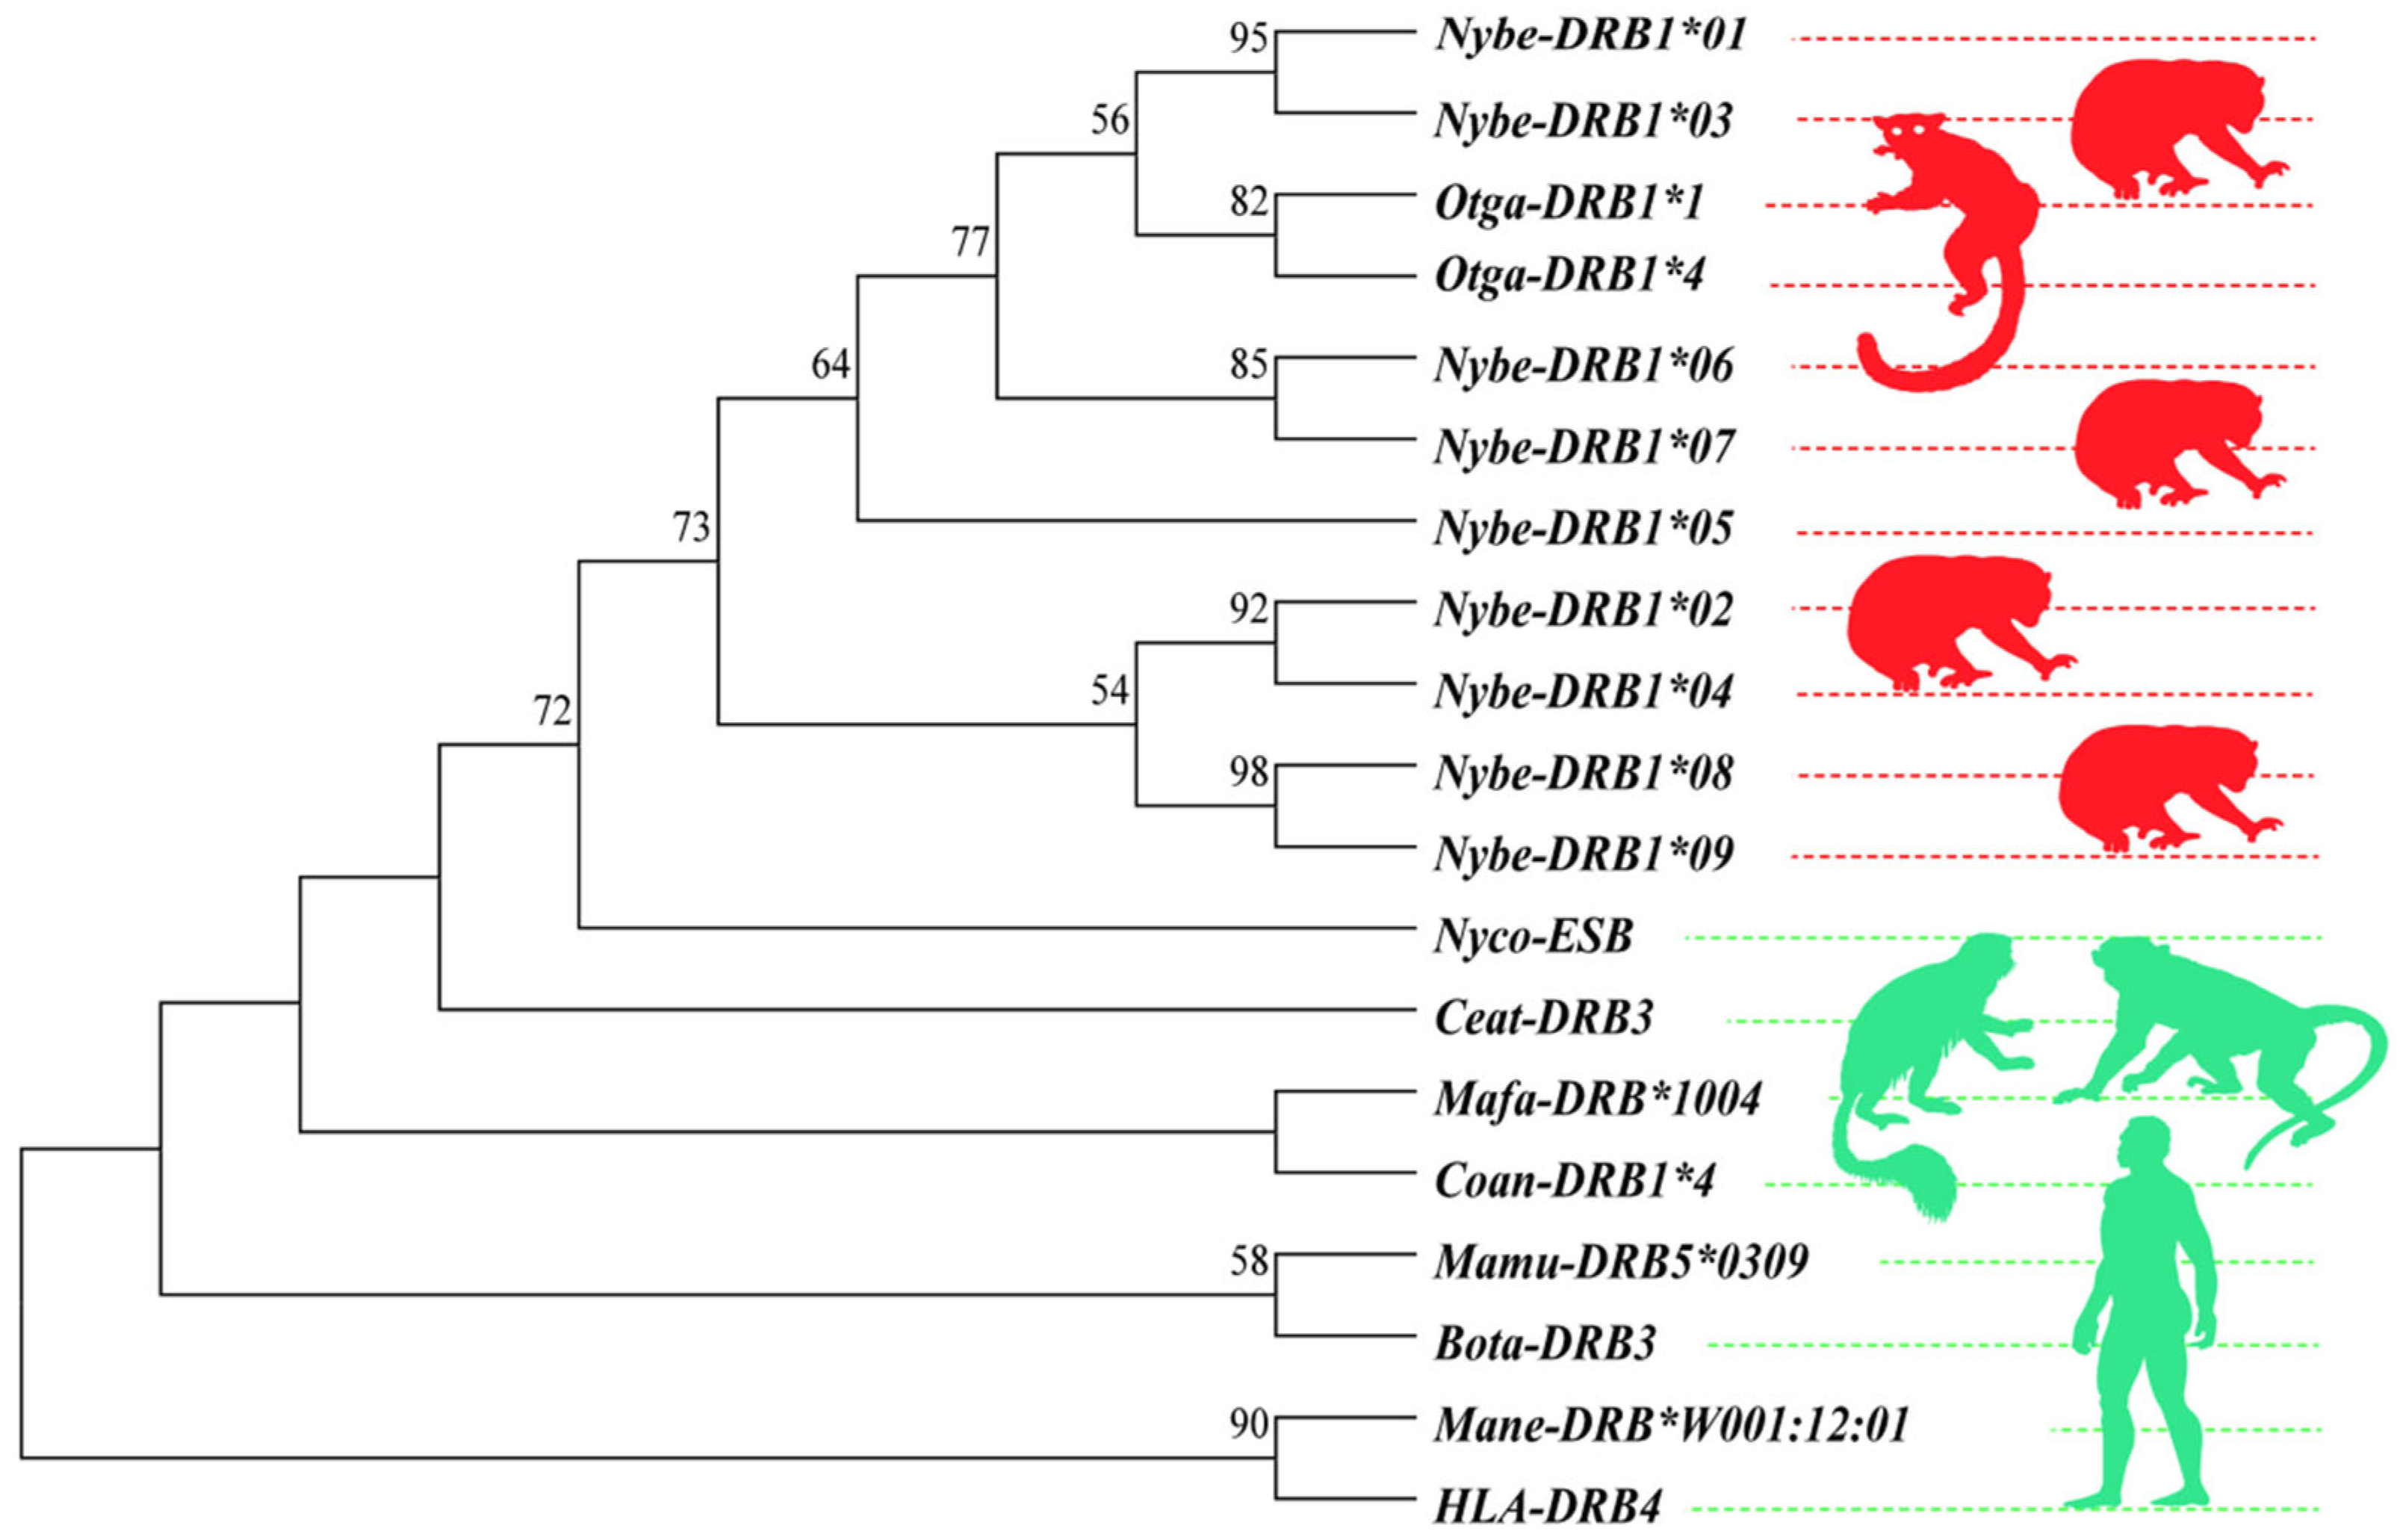
Figure 1. Phylogenetic tree of DRB1e2 alleles in Bengal slow lorises.
Biology 14 01094 g001
Figure 2. Distribution of DRB1e2 gene frequencies and polymorphism comparison in captive populations and different enclosures. (A) Distribution of DRB1e2 gene frequencies, red squares represent “Totality,” while blue circles, yellow diamonds, and green triangles denote groups I, II, and III, respectively; (B) nucleotide polymorphism curves of DRB1e2, red, blue, brown, and green dots with shaded areas correspond to “Totality,” group I, group II, and group III in terms of nucleotide diversity; (C) comparison of heterozygosity, light blue, tan, and light green boxplots with scatterplots represent groups I, II, and III; (D) comparison of nucleotide polymorphism, light blue, tan, and light green violin plots are used to depict groups I, II, and III (**: p < 0.01; ***: p < 0.001).
Biology 14 01094 g002
Figure 3. Comparison of α diversity indices under different polymorphisms (A) and genotypes (BD) (*: p < 0.05). Abbreviations: PIC, polymorphic information; ACE, abundance-based coverage estimator.
Biology 14 01094 g003
Figure 4. PCoA (A,B) and NMDS (C,D) analysis of β diversity (binary_jaccard and bray_curtis distances) under different genotypes of DRB1e2. In A, the red ellipse encompasses samples primarily classified as G2 (red dots), demonstrating clear clustering based on binary Jaccard dissimilarity. In B, the red ellipse also highlights samples mainly from group G2, though there is some overlap with other groups, reflecting partial intermixing under the Bray–Curtis dissimilarity measure. In C, samples within the ellipse belong to multiple groups (G3, G4, G9) in the NMDS ordination using binary Jaccard, indicating poorer separation compared to the PCoA result. In D, the ellipse again incorporates a mixture of groups (G2, G3, G4, G9) in the NMBS Bray–Curtis ordination, demonstrating broader overlap among groups. Collectively, the ellipses visually summarize the clustering patterns and dispersion of sample groups across multivariate ordination methods. Abbreviations: PCoA, principal coordinate analysis; NMDS, non-metric multidimensional scaling.
Biology 14 01094 g004
Figure 5. PCoA (A,B) and NMDS (C,D) analysis of β diversity (binary_jaccard and bray_curtis distances) under different polymorphisms of DRB1e2.
Biology 14 01094 g005
Figure 6. RDA plot showing the impact of genotypes and polymorphism (A) and captive environment on the intestinal microbiota composition of the Bengal slow loris (B). Bacterial genera are represented as red points. MHC variables and captive environment variables significantly influencing intestinal microbiota are indicated by arrows, marked in purple. For visualization purposes, only the 20 genera with the smallest p-values are labeled. Abbreviations: RDA, redundancy analysis; PIC, polymorphic information.
Biology 14 01094 g006
Figure 7. Correlation heatmap between DRB1e2 genotypes and PIC with microbial genera. The heatmap depicts the estimated impact of the four DRB1e2 genotypes on the 20 microbial genera with the smallest p-values within the group (Spearman). Blue indicates consistency between the presence of a given factor and lower relative abundance of a specific microbial genus, while red indicates that the genus is more common when this MHC factor is present. Black asterisks denote significant effects (* p < 0.05; ** p < 0.01; *** p < 0.001).
Biology 14 01094 g007
Figure 8. PCoA (A,B) and NMDS (C,D) analysis of β diversity (binary_jaccard and bray_curtis distances) under different enclosures. In A, the red ellipse delineates a distinct cluster of group I (red dots) under binary Jaccard dissimilarity. The orange and green ellipses enclose groups II and III, respectively, showing clear separation in the PCoA ordination. In B, the red ellipse again primarily contains group I, but with greater overlap with groups II and III under Bray–Curtis dissimilarity. The orange and green ellipses remain associated with groups II and III, though with reduced distinctness. In C, ellipses corresponding to groups I, II, and III illustrate moderate separation in the NMDS ordination with binary Jaccard. In D, all three group ellipses exhibit broader overlap in the NMDS Bray–Curtis ordination, reflecting weaker group discrimination.
Biology 14 01094 g008
Figure 9. Linear discriminant analysis effect size (LefSe) analysis. The cladogram shows significantly different taxonomic groups of intestinal microbiota within groups of PIC (A), genotype (B), and captive environments (C) (LDA score > 4, p < 0.05). Species (s), genus (g), family (f), order (o), class (c), and phylum (p).
Biology 14 01094 g009
Figure 10. Correlation heatmap between different enclosures and microbial genera, showing the estimated impact size of three captive environments on the 20 microbial genera with the smallest p-values within groups (Spearman). Green indicates the presence of the given factor is consistent with lower relative abundance of specific microbial genera, while red indicates the genus is more common when this factor is present. Black asterisks denote significant effects (* p < 0.05; ** p < 0.01; *** p < 0.001).
Biology 14 01094 g010
Table 1. Statistics of group information outside phylogenetic tree.
Closely Related SpeciesGene SymbolGenebank Number
Nycticebus coucangNyco-ESBXM053603395
Otolemur garnettiiOtga-DRB1*1XM012804740
Otolemur garnettiiOtga-DRB1*4XM003789065
Macaca mulattaMamu-DRB5*0309EU934778
Bos taurusBota-DRB3BT029914
Macaca nemestrinaMane-DRB*W001:12:01LN998245
Macaca fascicularisMafa-DRB*1004KR632829
Colobus angolensisCoan-DRB1*4XR_001002085.1
Cerocebus atysCeat-DRB3XM012070072
Homo sapiensHLA-DRB4MW60513
Table 2. Polymorphism statistics of the Bengal slow loris DRB1e2.
TotalityIIIIII
N4623158
A9869
AE5.715.483.987.41
AR9869
SNPs91391042
PIS84422522
PIC0.820.820.750.87
HE0.290.290.30.31
Tajima’s D−0.21
Pi0.140.170.060.22
Fst−0.02
Over mean distance0.15 ± 0.030.10 ± 0.050.07 ± 0.010.31 ± 0.05
Abbreviations: A, observed number of alleles; AE, effective number of alleles; AR, allelic richness; SNPs, single-nucleotide polymorphisms; PIS, polymorphic information site; PIC, polymorphic information content; HE, expected heterozygosity; Pi, nucleotide polymorphism; Fst, Fixation Index.
Disclaimer/Publisher’s Note: The statements, opinions and data contained in all publications are solely those of the individual author(s) and contributor(s) and not of MDPI and/or the editor(s). MDPI and/or the editor(s) disclaim responsibility for any injury to people or property resulting from any ideas, methods, instructions or products referred to in the content.