Exploring the Efficacy and Potential Mechanisms of Topical Periplaneta americana (L.) Extract in Treating Androgenetic Alopecia in a Mouse Model: A Systems Pharmacology and Skin Microbiome Analysis

 ,
,
Simple Summary
Abstract
1. Introduction
2. Materials and Methods
2.1. Materials
2.2. Preparation of PA-011
2.3. Identification of the Chemical Composition of PA-011
2.4. Network Pharmacology Analysis and Molecular Docking Simulation
2.4.1. Screening of Potentially Active Compounds and Compound Prediction
2.4.2. AGA Target Acquisition
2.4.3. Ingredient-Pharmacological-Target-Disease Pathway Network Construction
2.4.4. Protein Interaction (PPI) Network Construction and Analysis
2.4.5. Gene Ontology (GO) and Kyoto Encyclopedia of Genes and Genomes (KEGG) Pathway Enrichment Analyses
2.4.6. Molecular Docking
2.5. Animal Experiments
2.5.1. Experimental Animals and AGA Models
2.5.2. Epigenetic Evaluation of PA-011 on Hair Growth in AGA Mice
2.5.3. Determination of Mouse Biochemical Indexes
2.5.4. Skin Pathology Observation and Immunofluorescence Detection in Mice
2.5.5. mRNA Expression Detection and Analysis by Real-Time Quantitative Polymerase Chain Reaction (RT-qPCR)
2.5.6. Western Blot (WB)
2.5.7. Analysis of Skin Tissue Transcriptomic Test
2.5.8. Non-Target Metabolomics Analysis of Skin Tissue
2.5.9. Joint Analysis of Skin Tissue Greening and Non-Target Metabolomics
2.5.10. Skin Microbiota Analysis
2.6. Safety Evaluation of Topical Application of PA-011
2.6.1. Experimental Animals
2.6.2. Acute Dermal Toxicity Test
2.6.3. Skin Sensitization Test
2.6.4. Skin Irritation Test
2.7. Statistical Analysis
3. Results
3.1. Composition of PA-011
3.2. Network Pharmacology Results
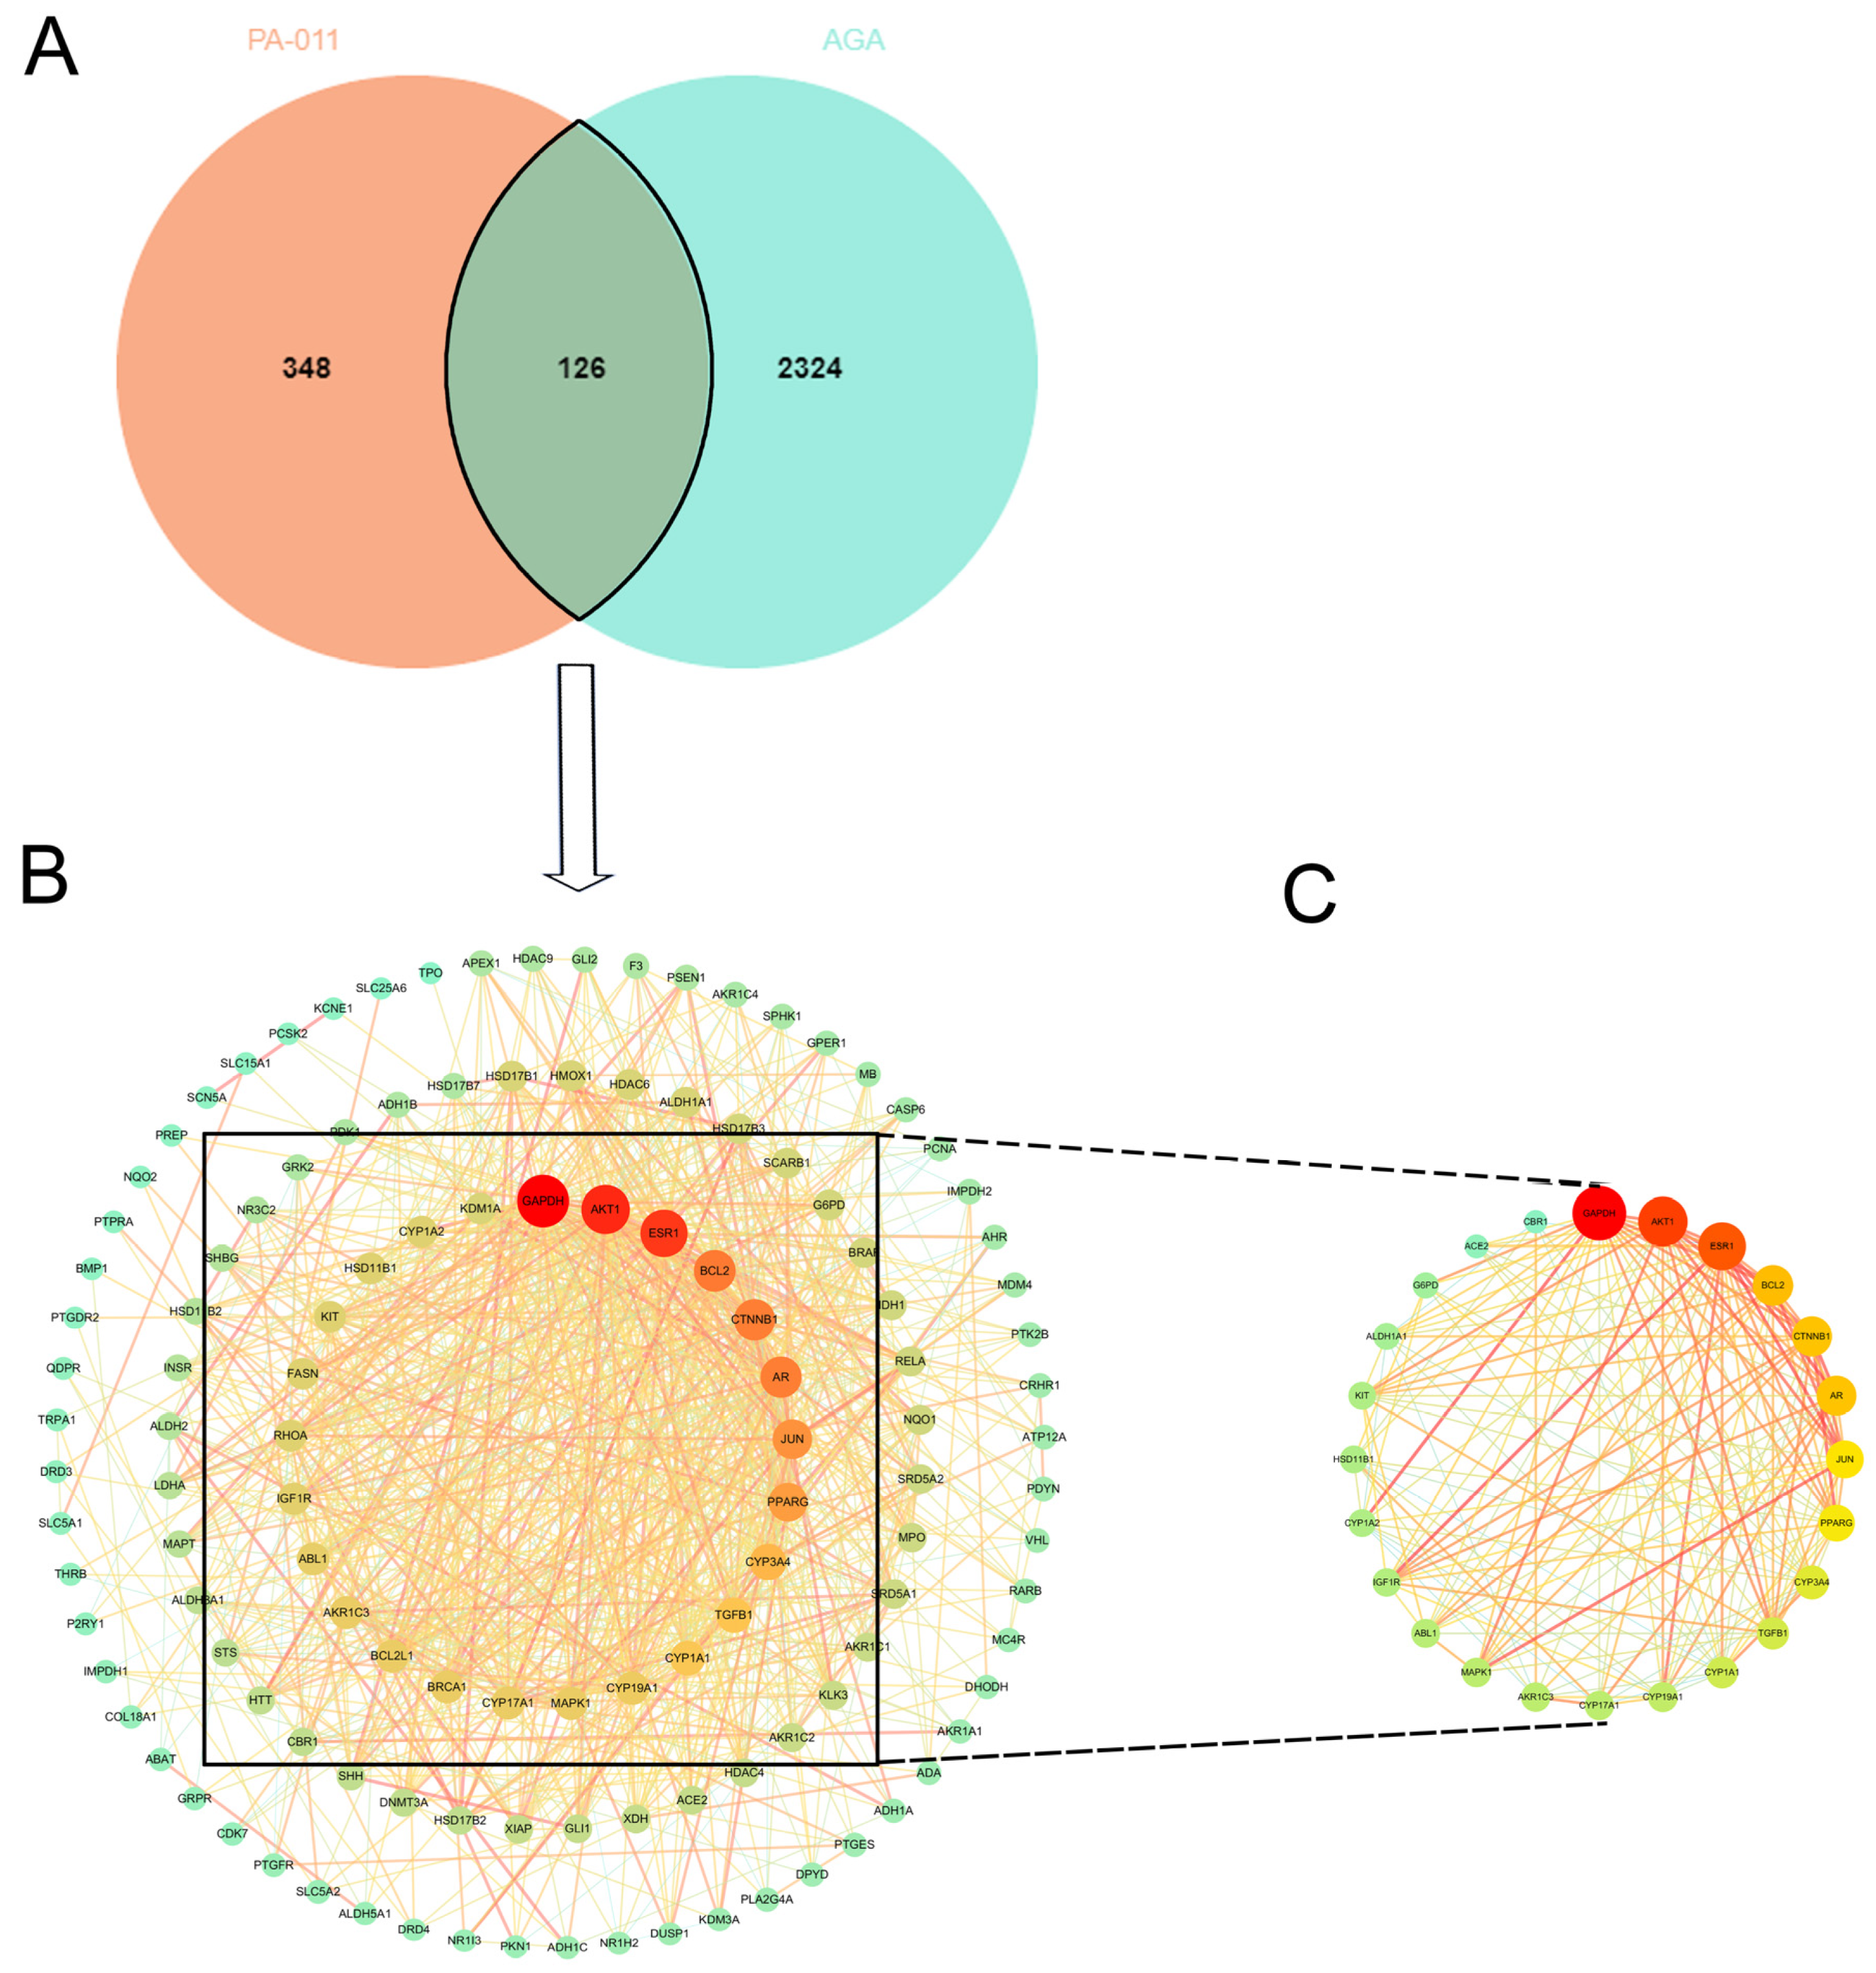
3.2.1. Intersection Target Acquisition
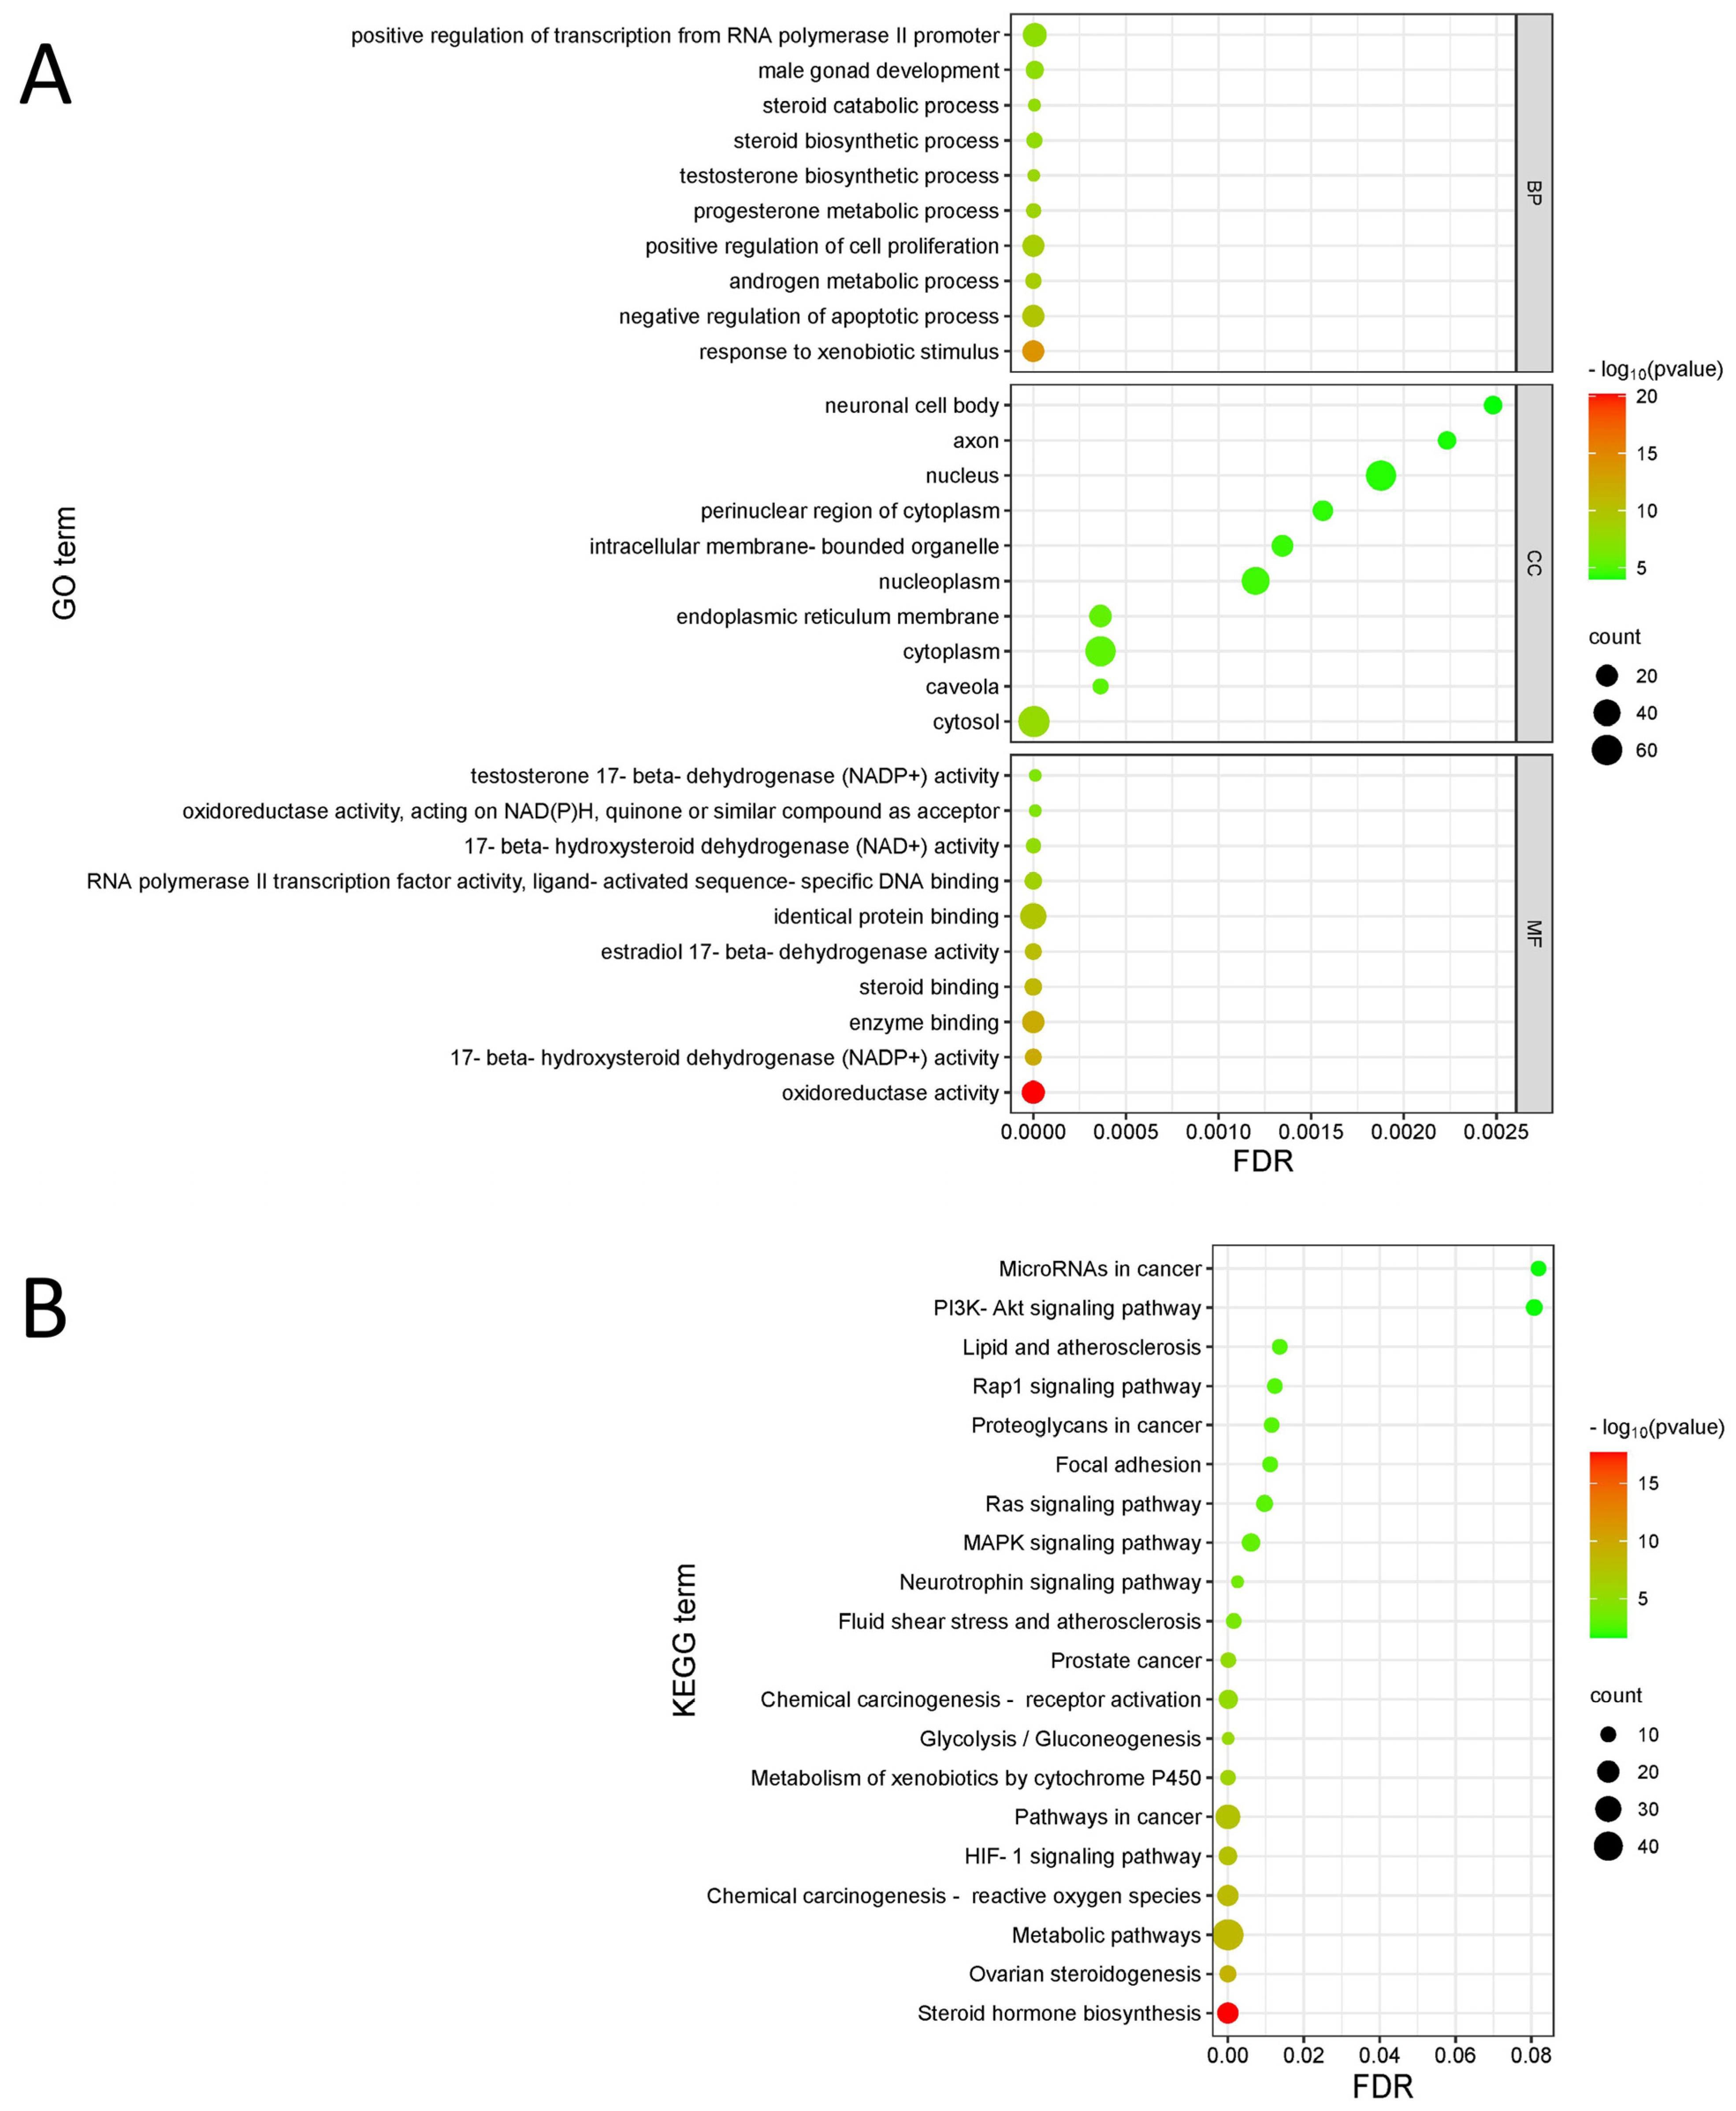
3.2.2. Enrichment Analysis
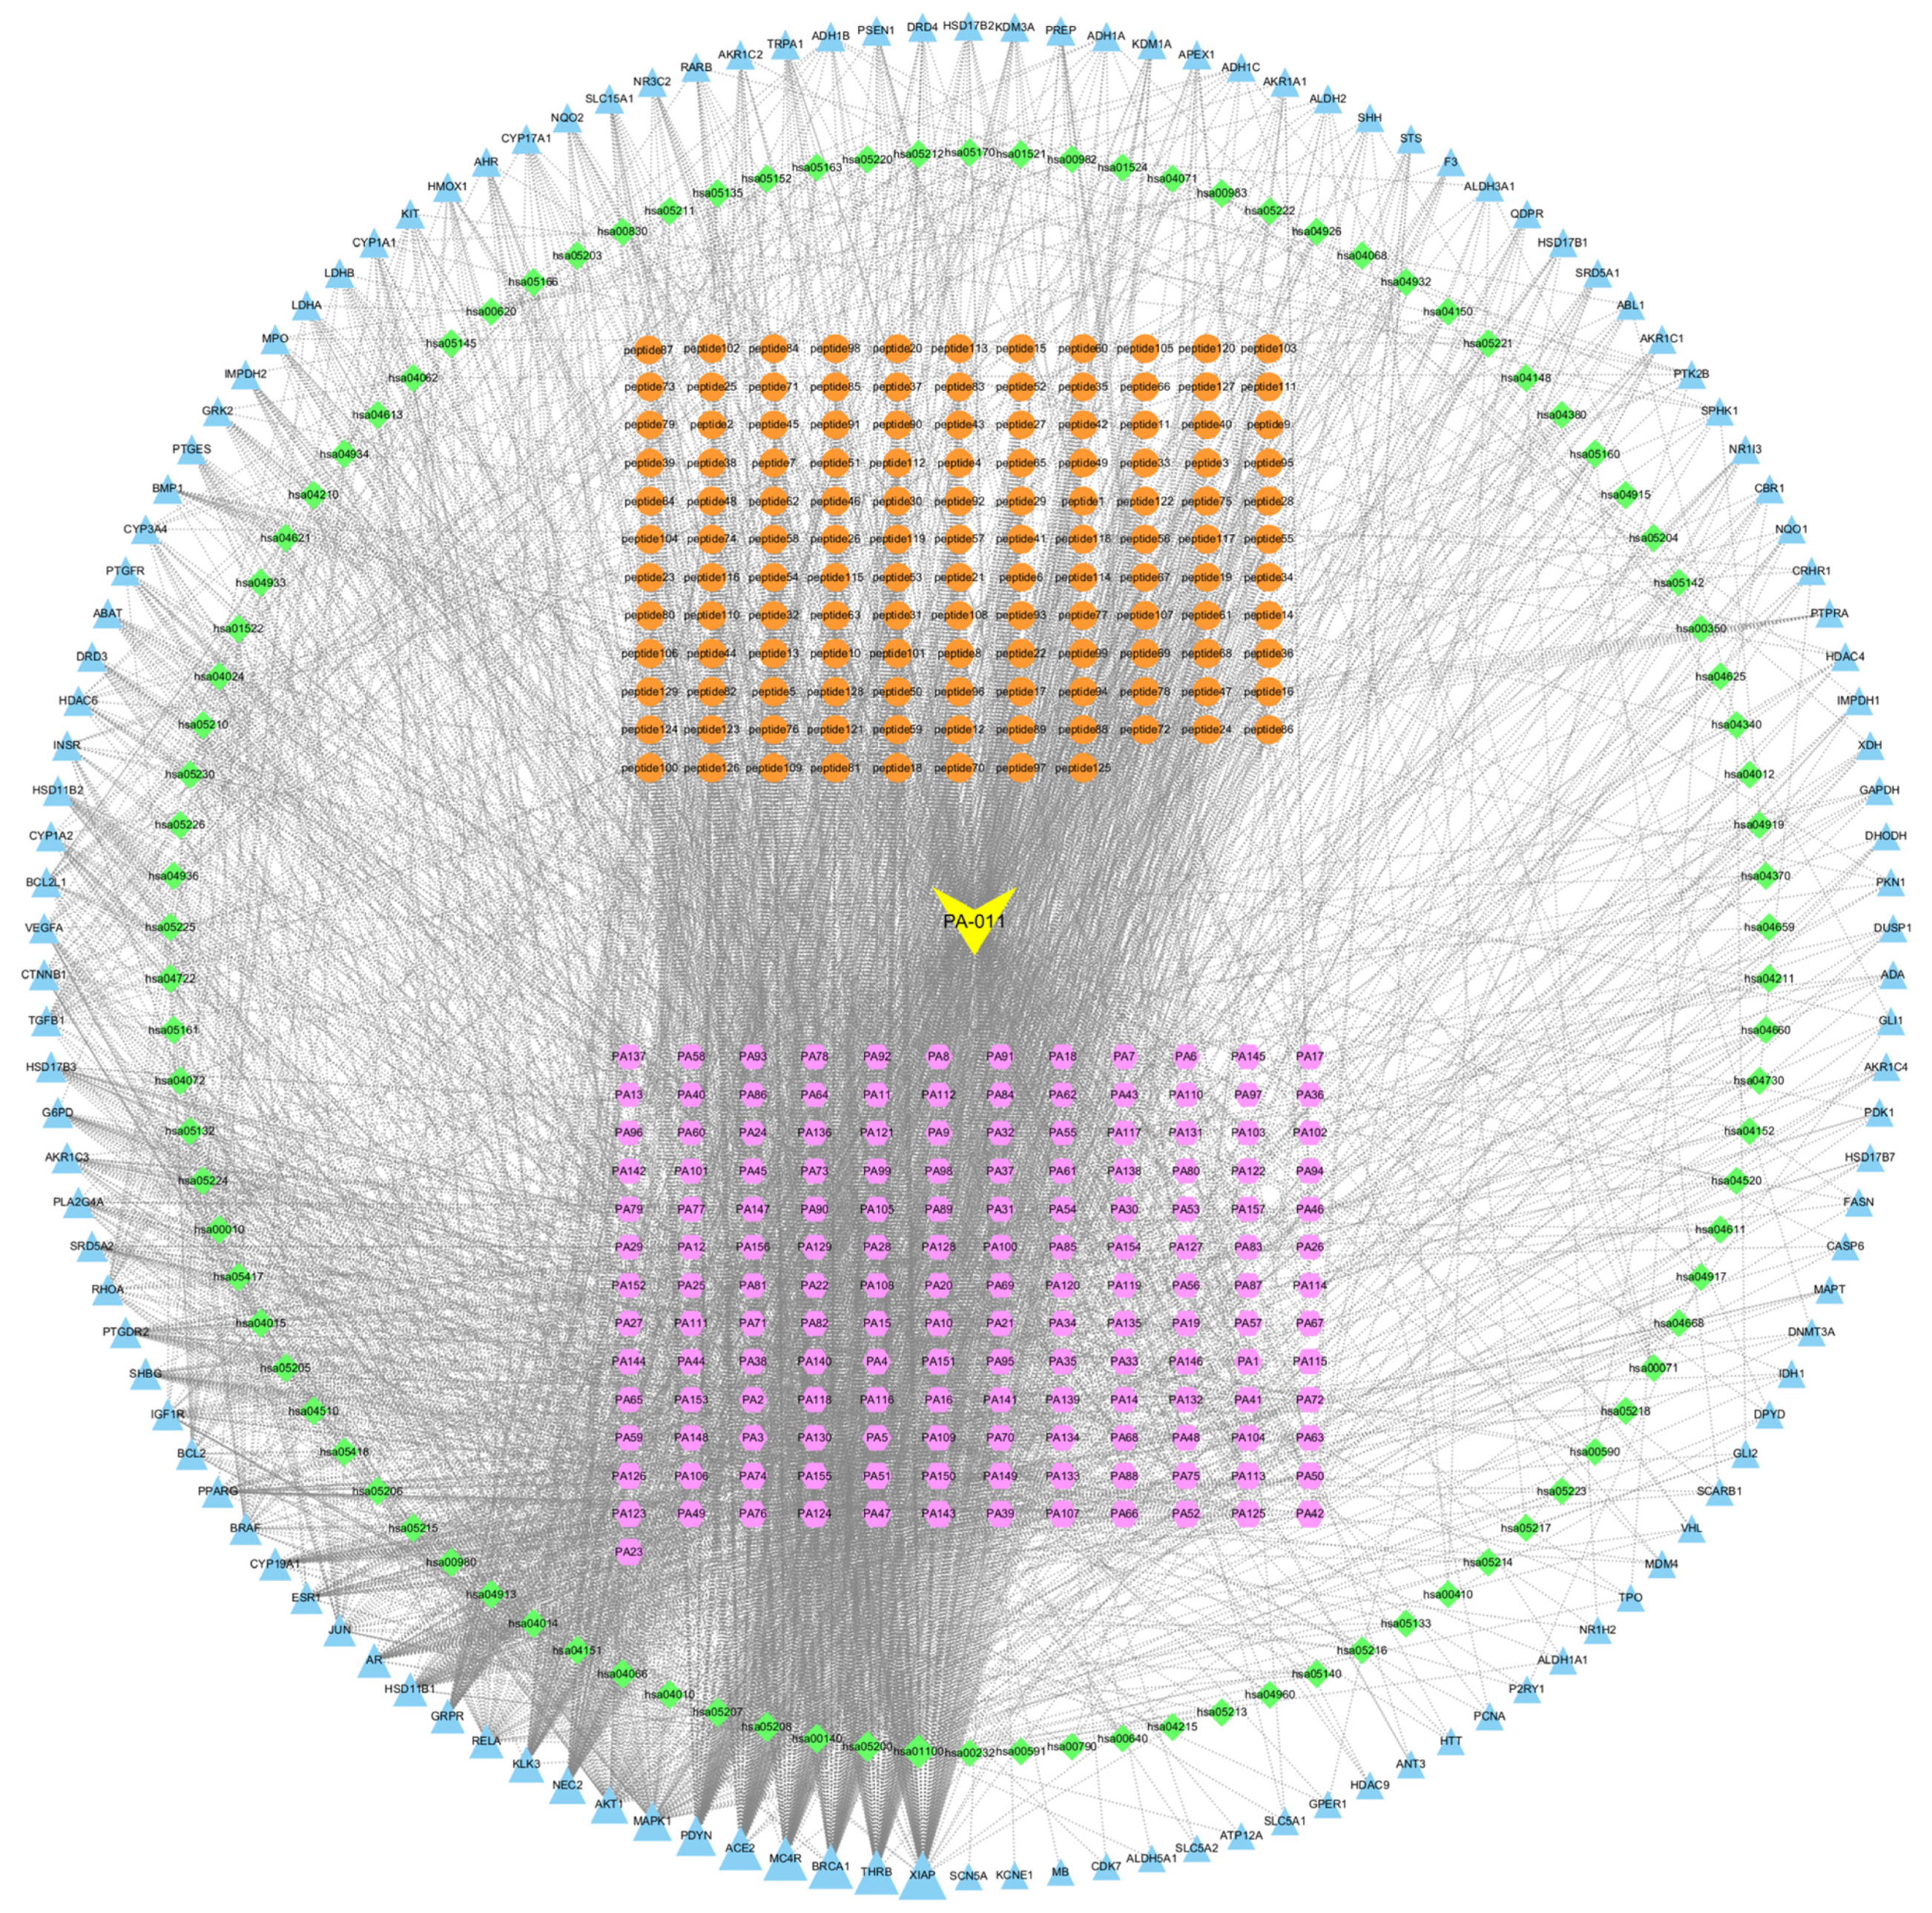
3.2.3. Component Target Path Correlation Network Analysis
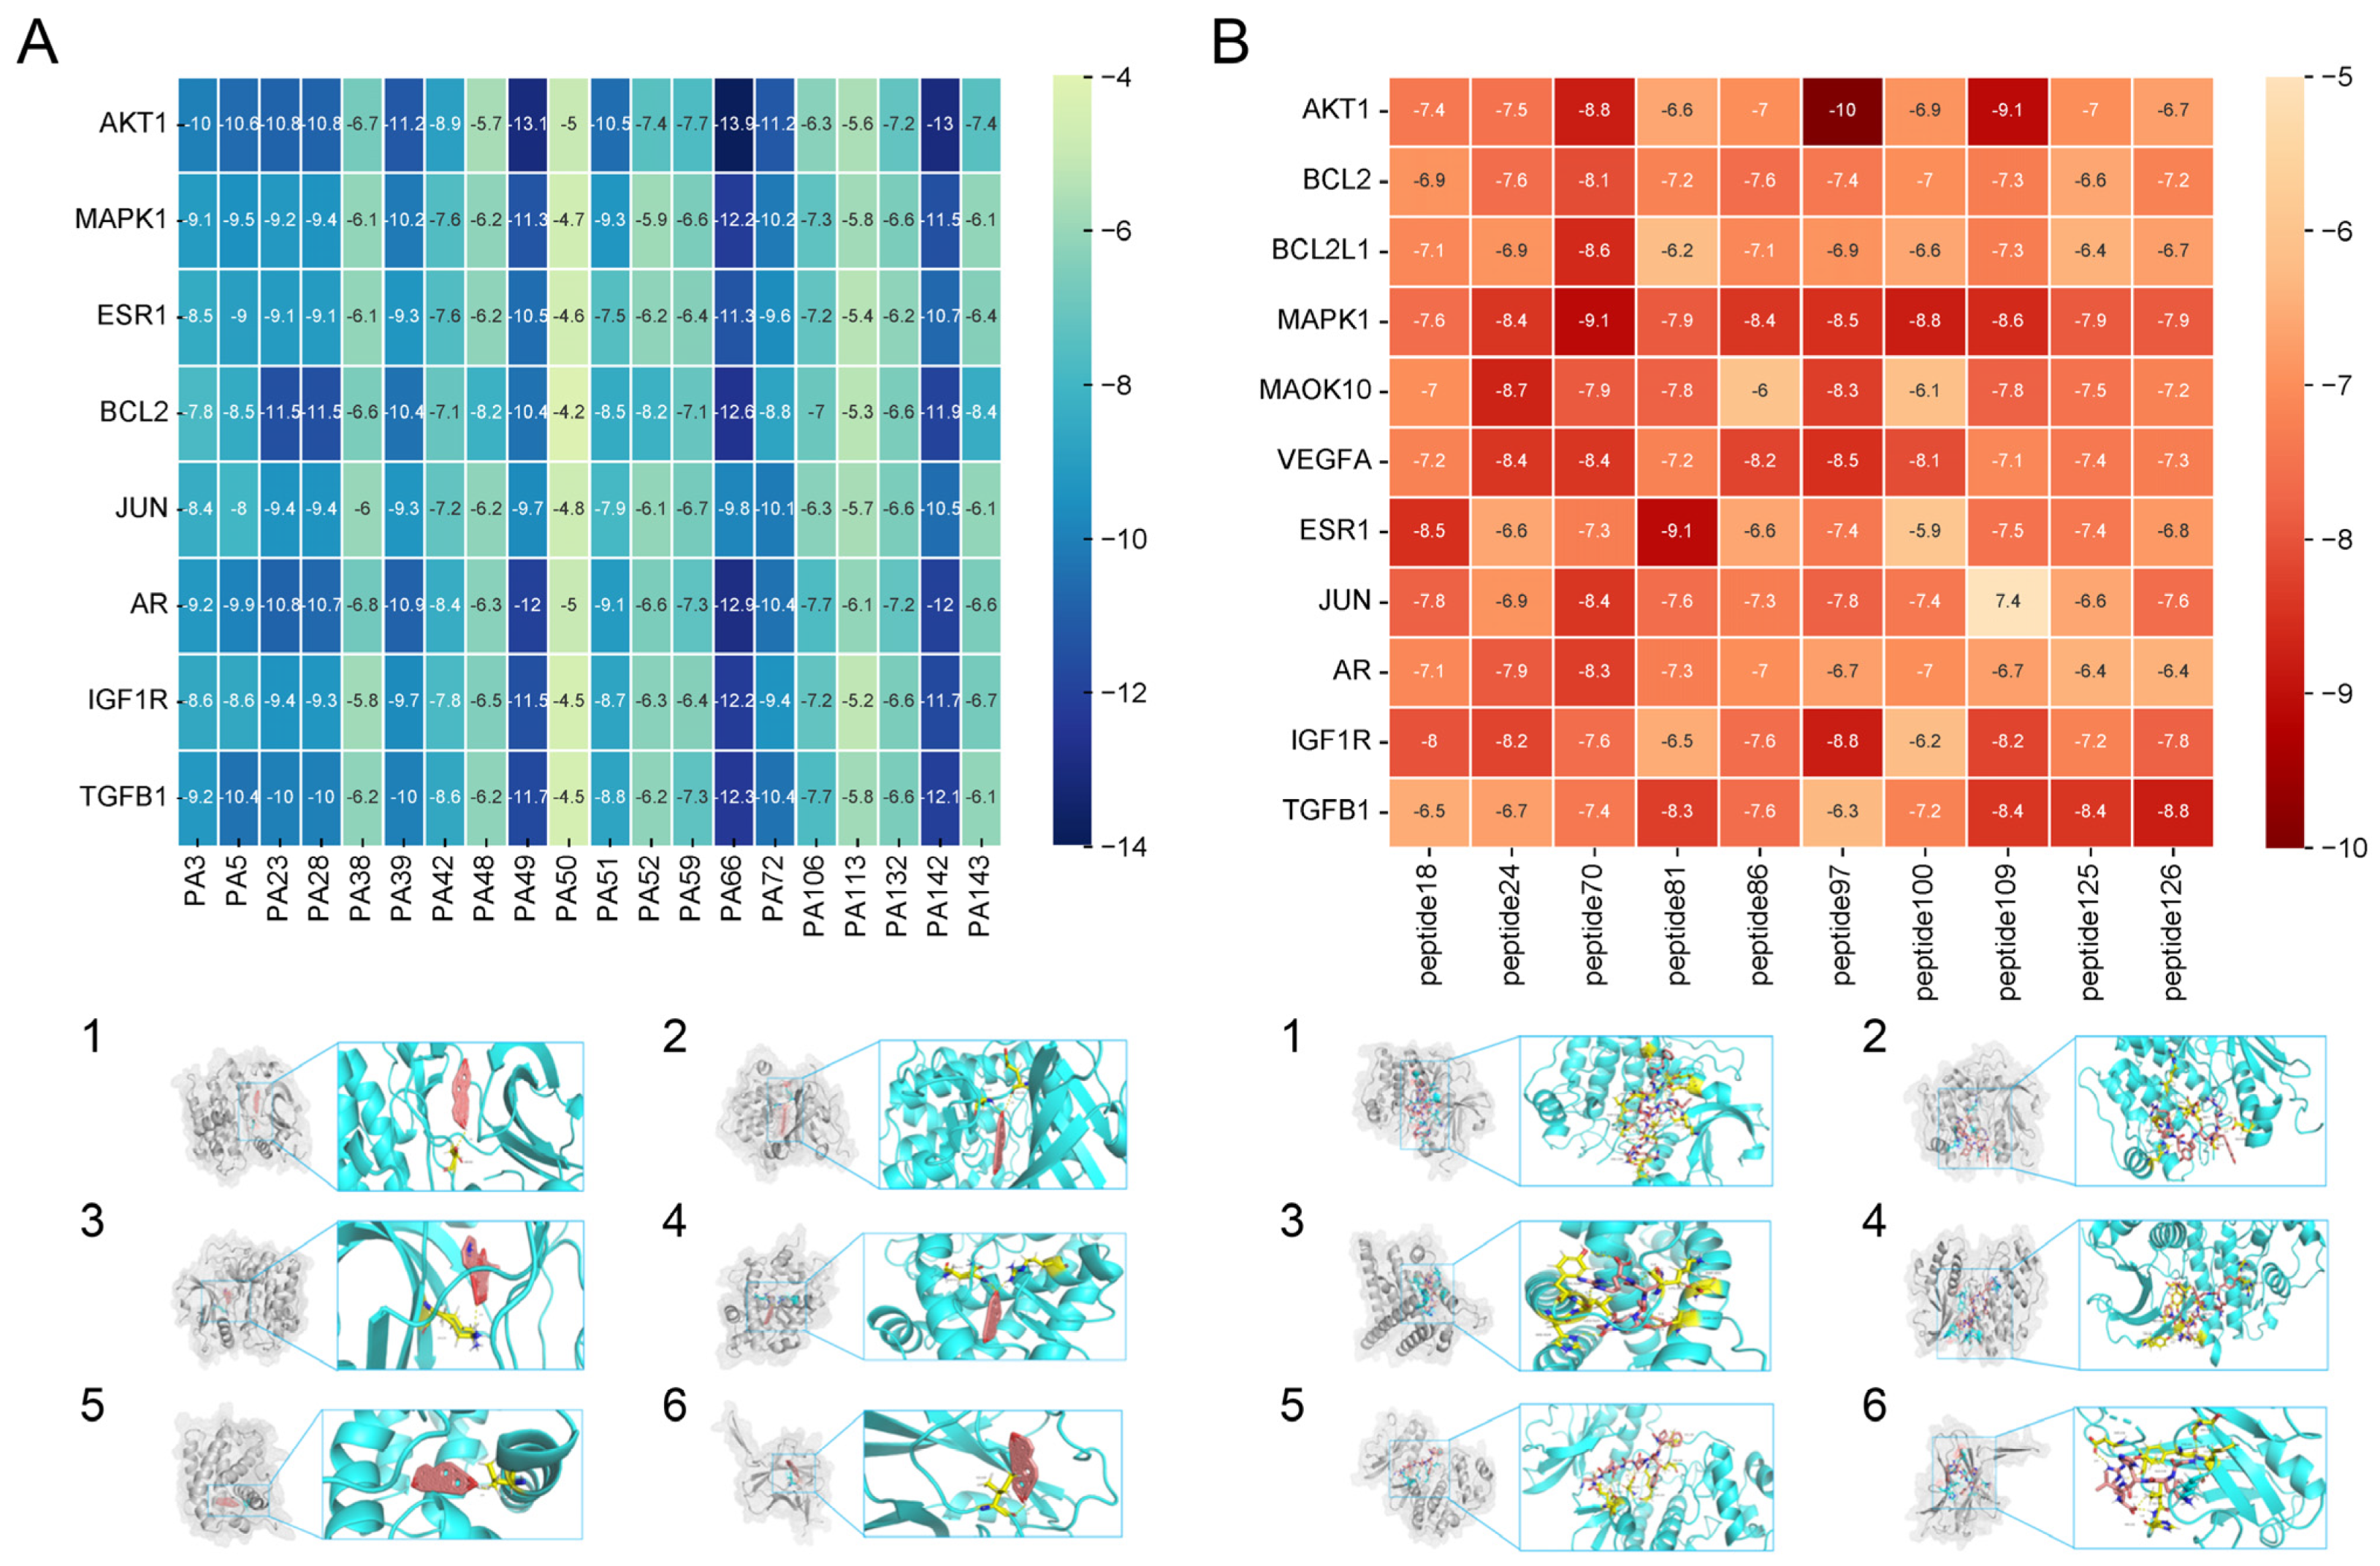
3.2.4. The Results of Molecular Docking
3.3. PA-011 Can Significantly Promote Hair Growth in AGA Mice
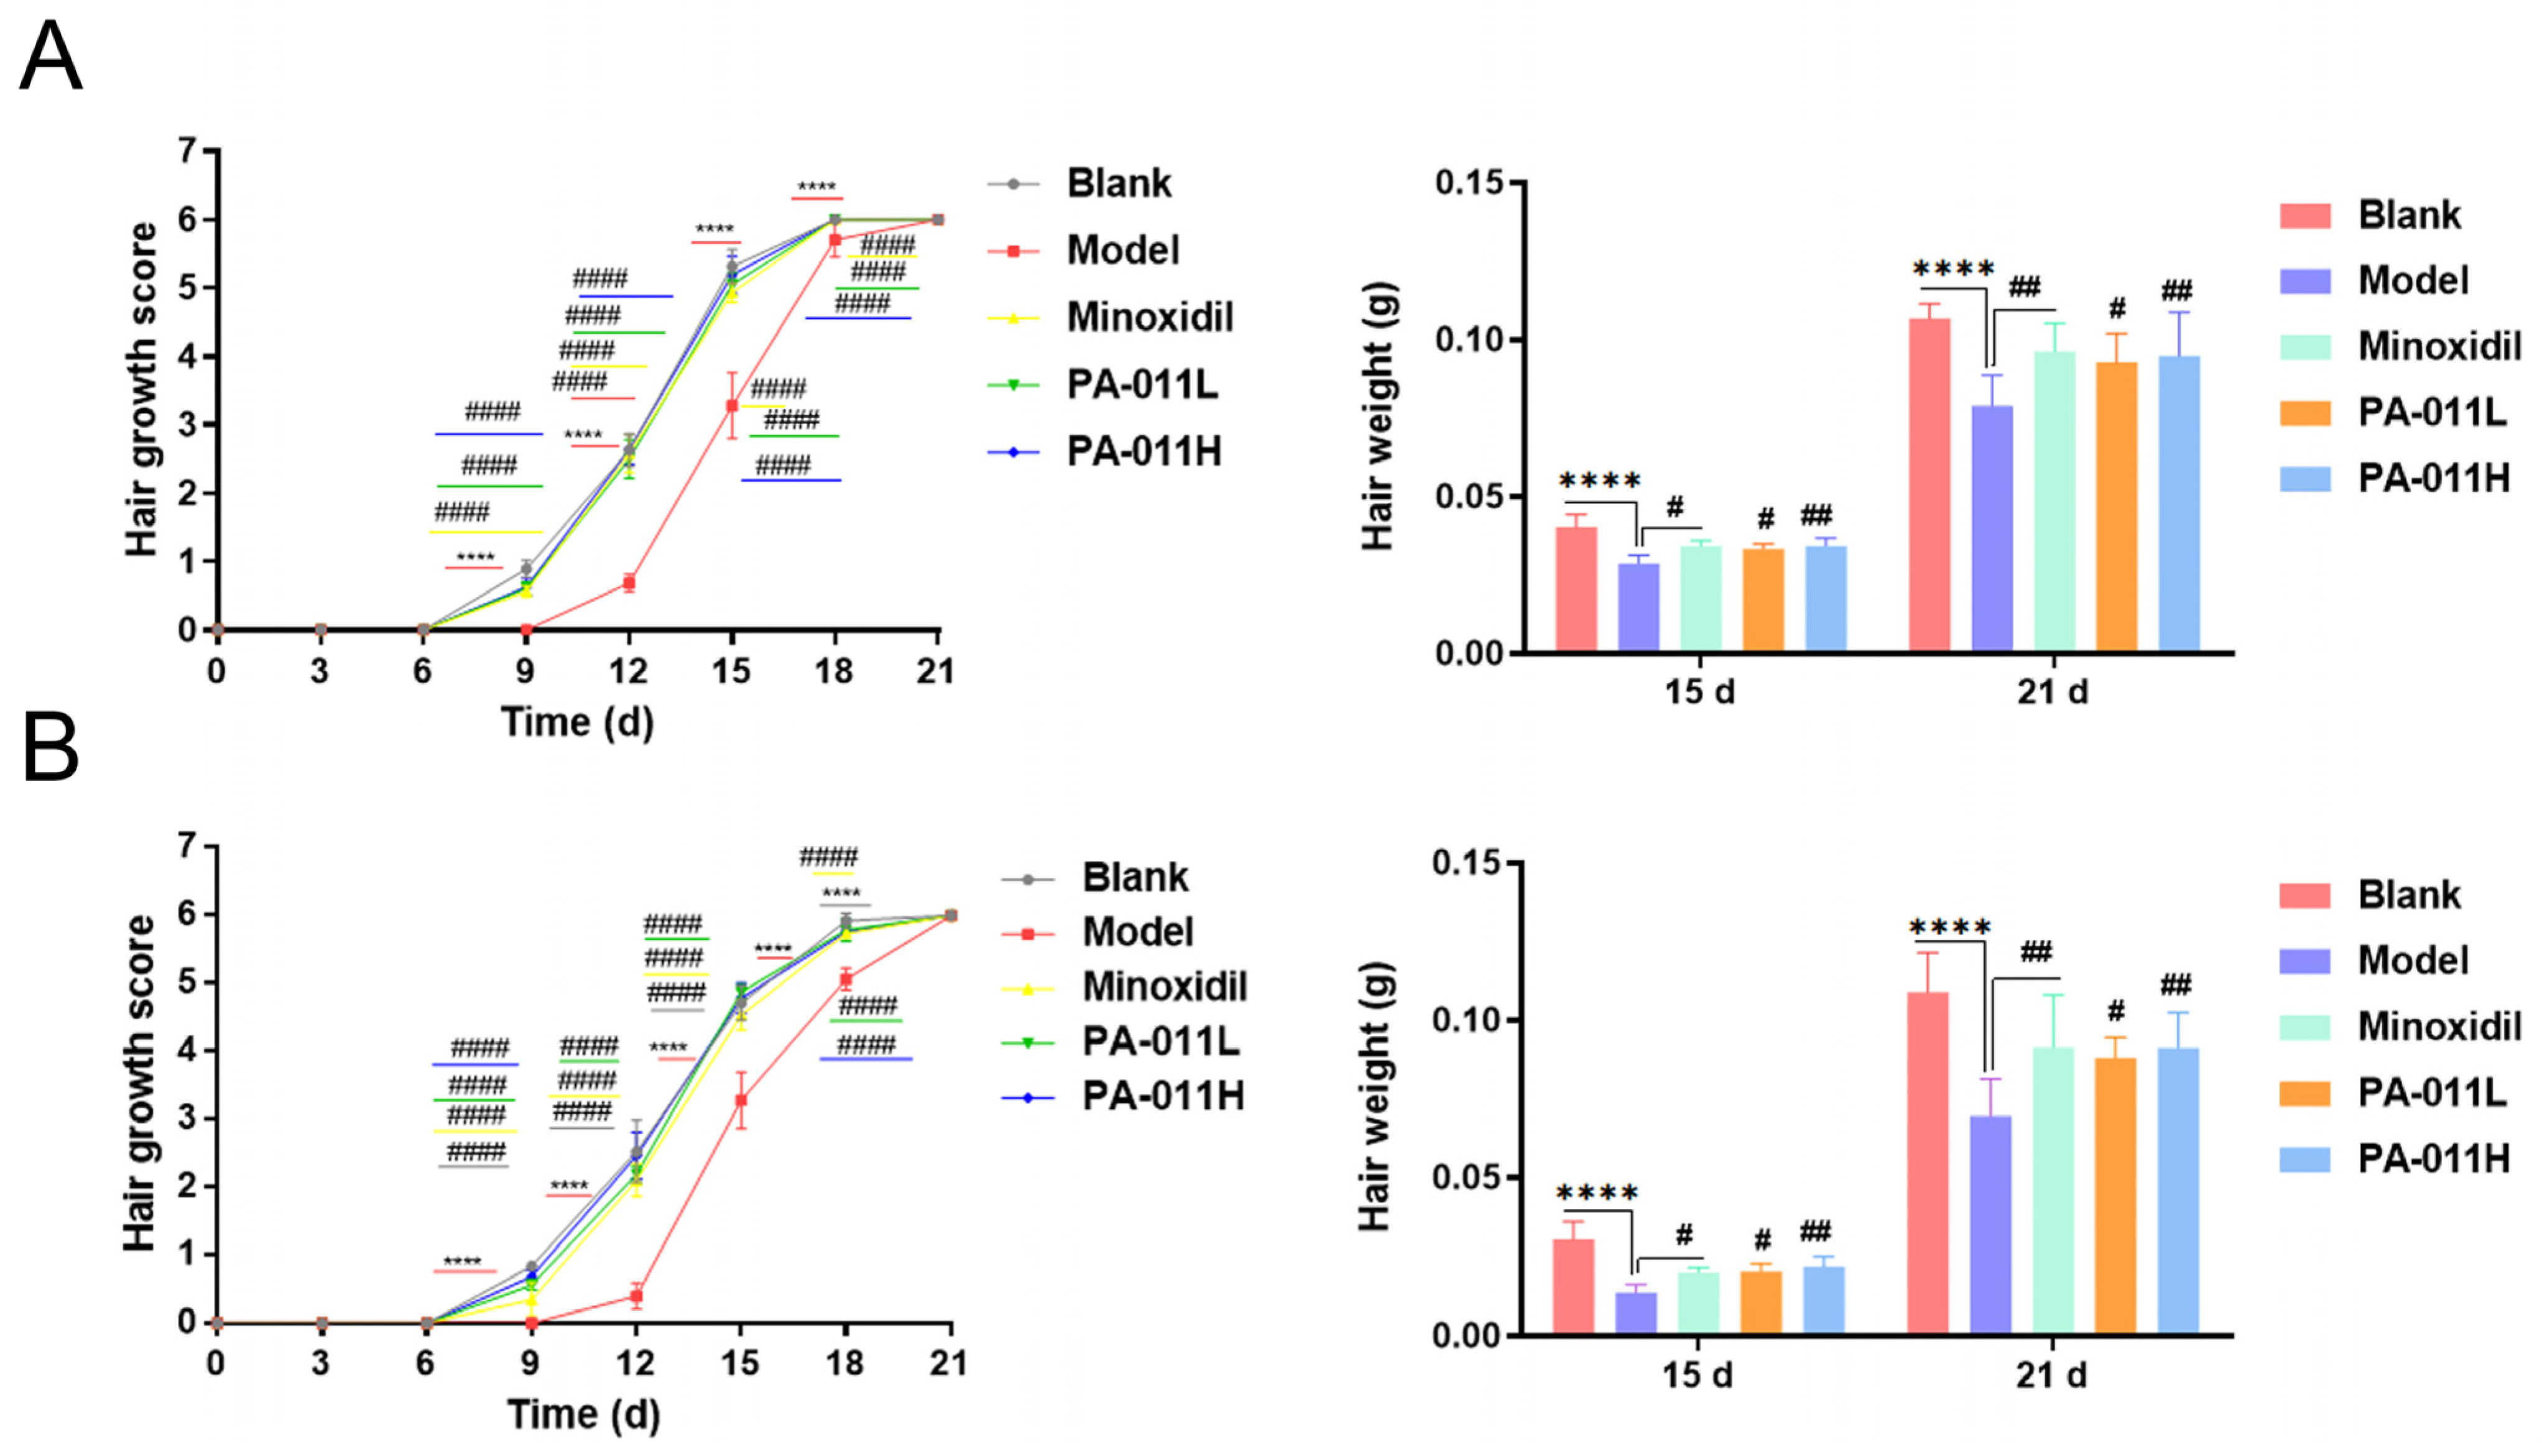
3.4. Hair Growth Coverage and Gross Weight Score
3.5. PA-011 Can Increase E2 Content and ALP Activity in AGA Mice and Reduce the Level of Inflammatory Factors and Oxidative Stress in Skin
3.6. PA-011 Can Significantly Promote Proliferation and Decrease Apoptosis of Hair Follicle Cells
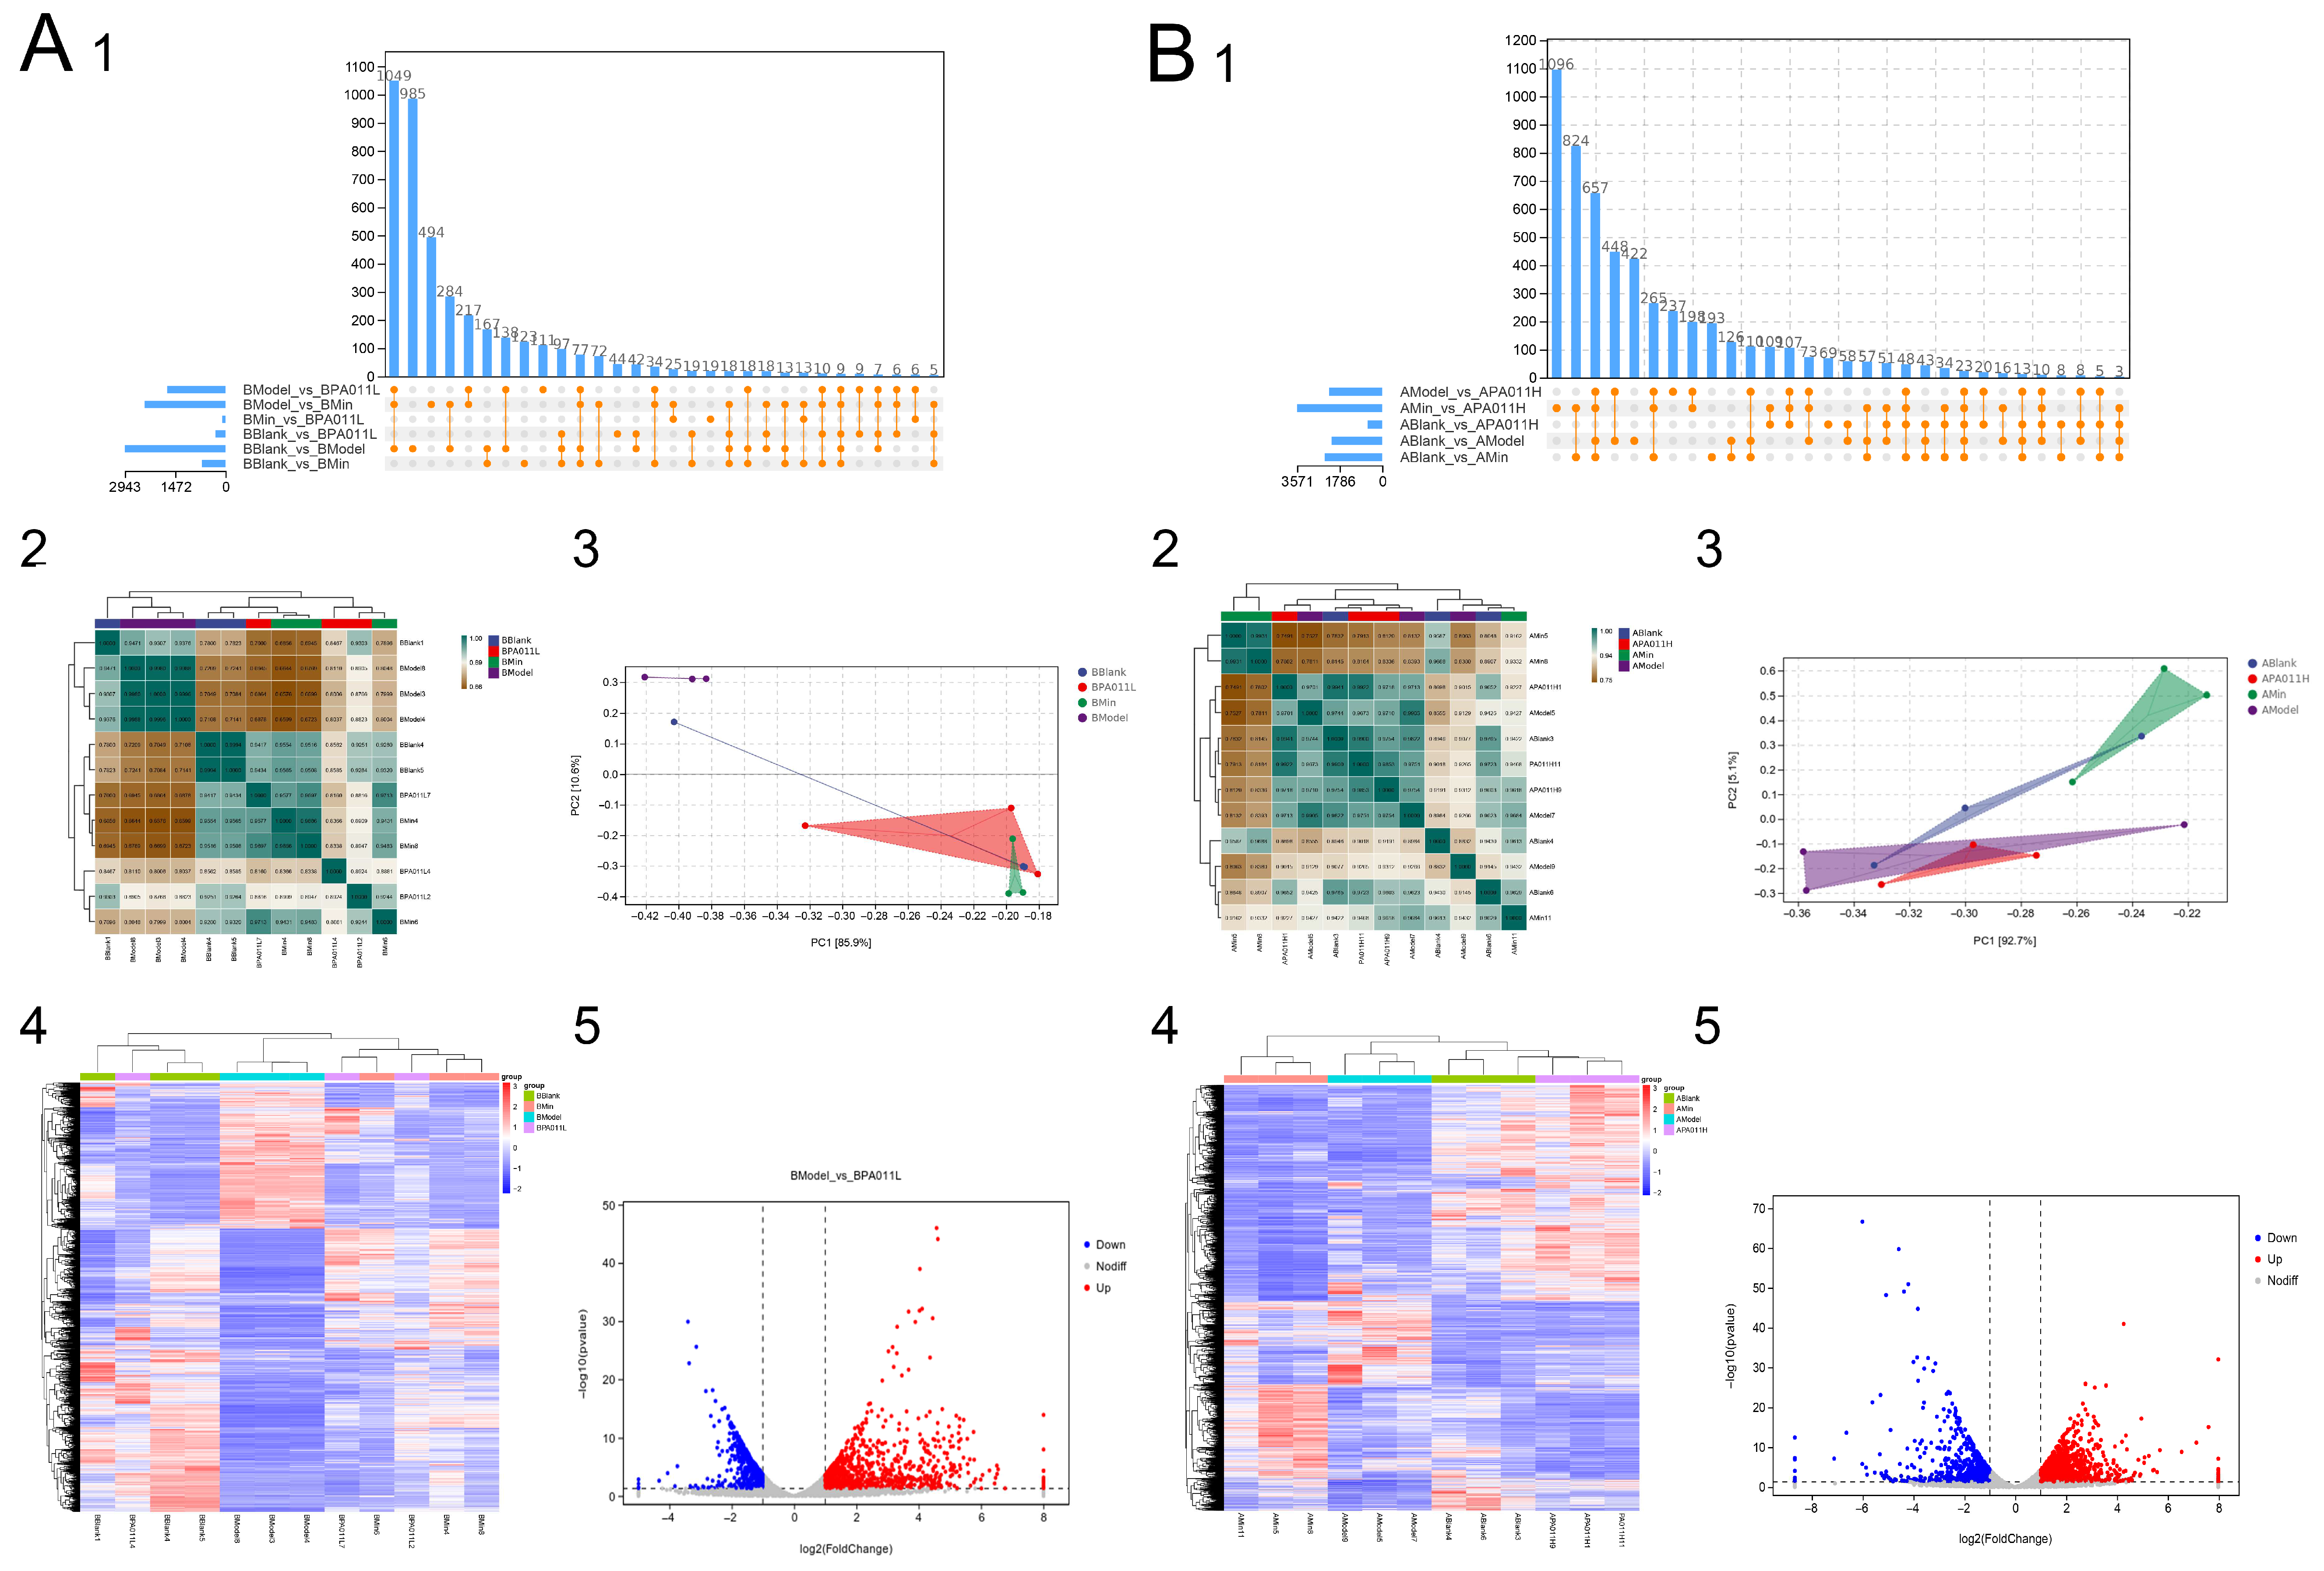
3.7. Skin Transcriptomic Analysis
3.7.1. Differential Gene Analysis
3.7.2. Protein Interaction Analysis of Differential Genes
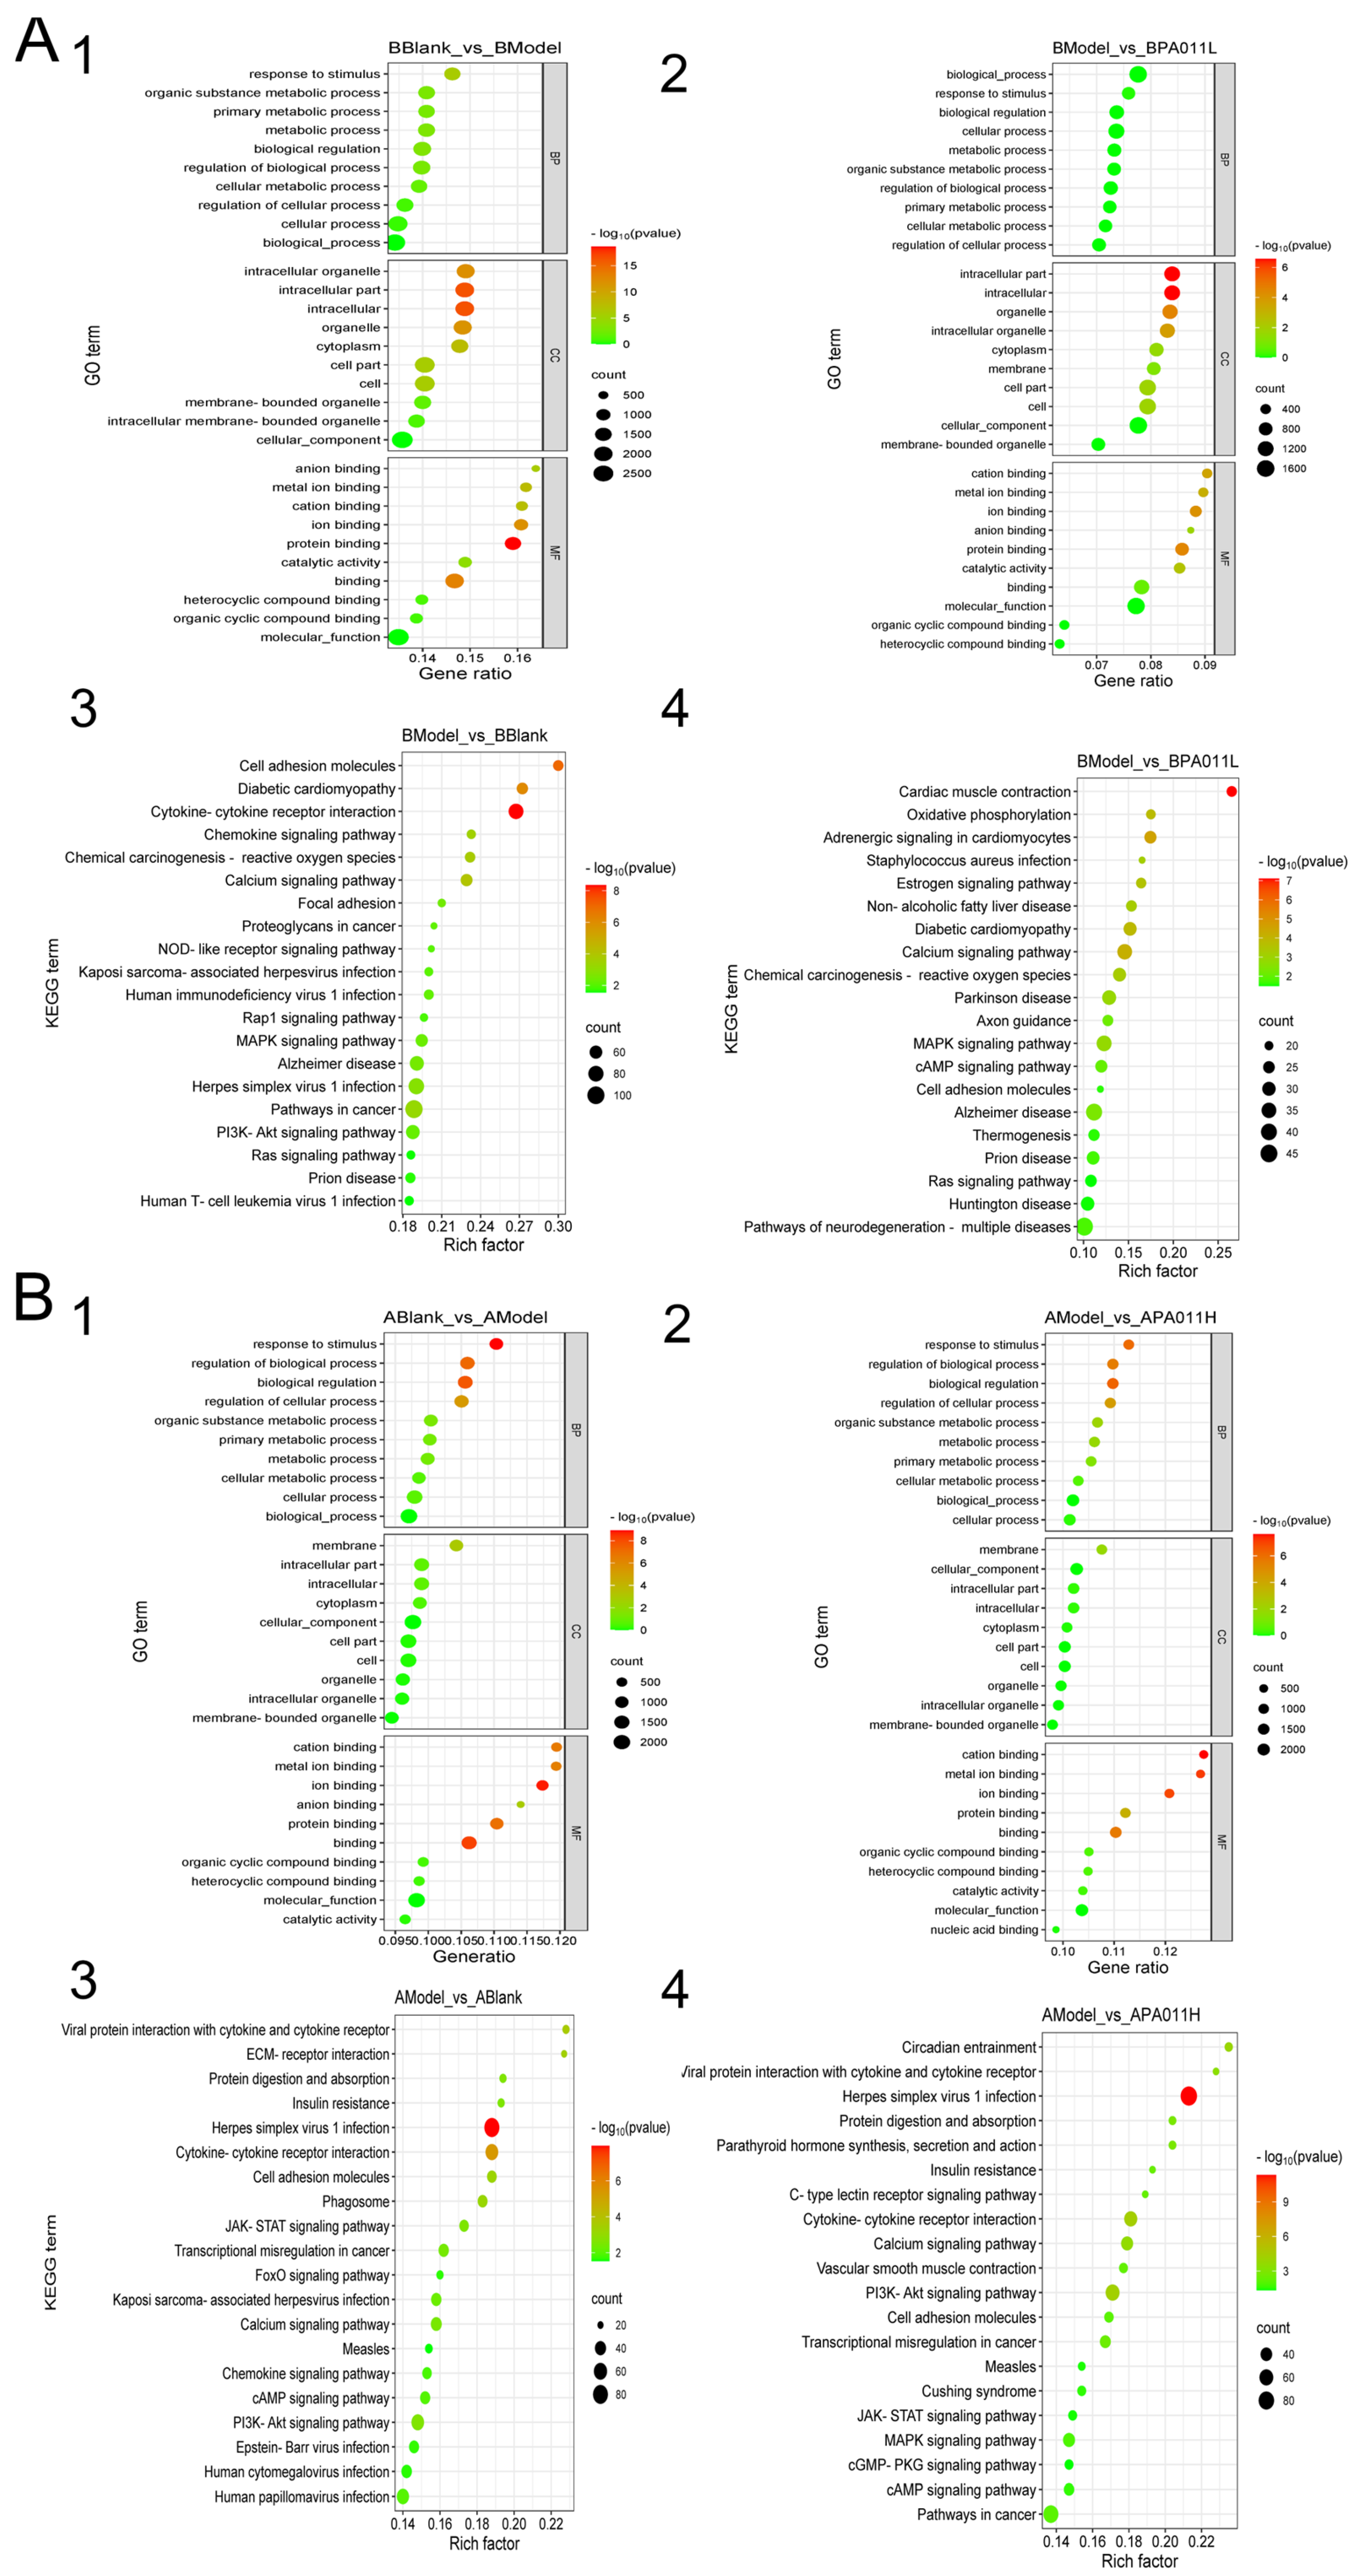
3.7.3. Transcriptome Enrichment Analysis
3.8. PA-011 Modulates the Wnt/β-Catenin Signaling Pathway to Promote Hair Growth in AGA Mice
3.9. Skin Non-Target Metabolomics Results
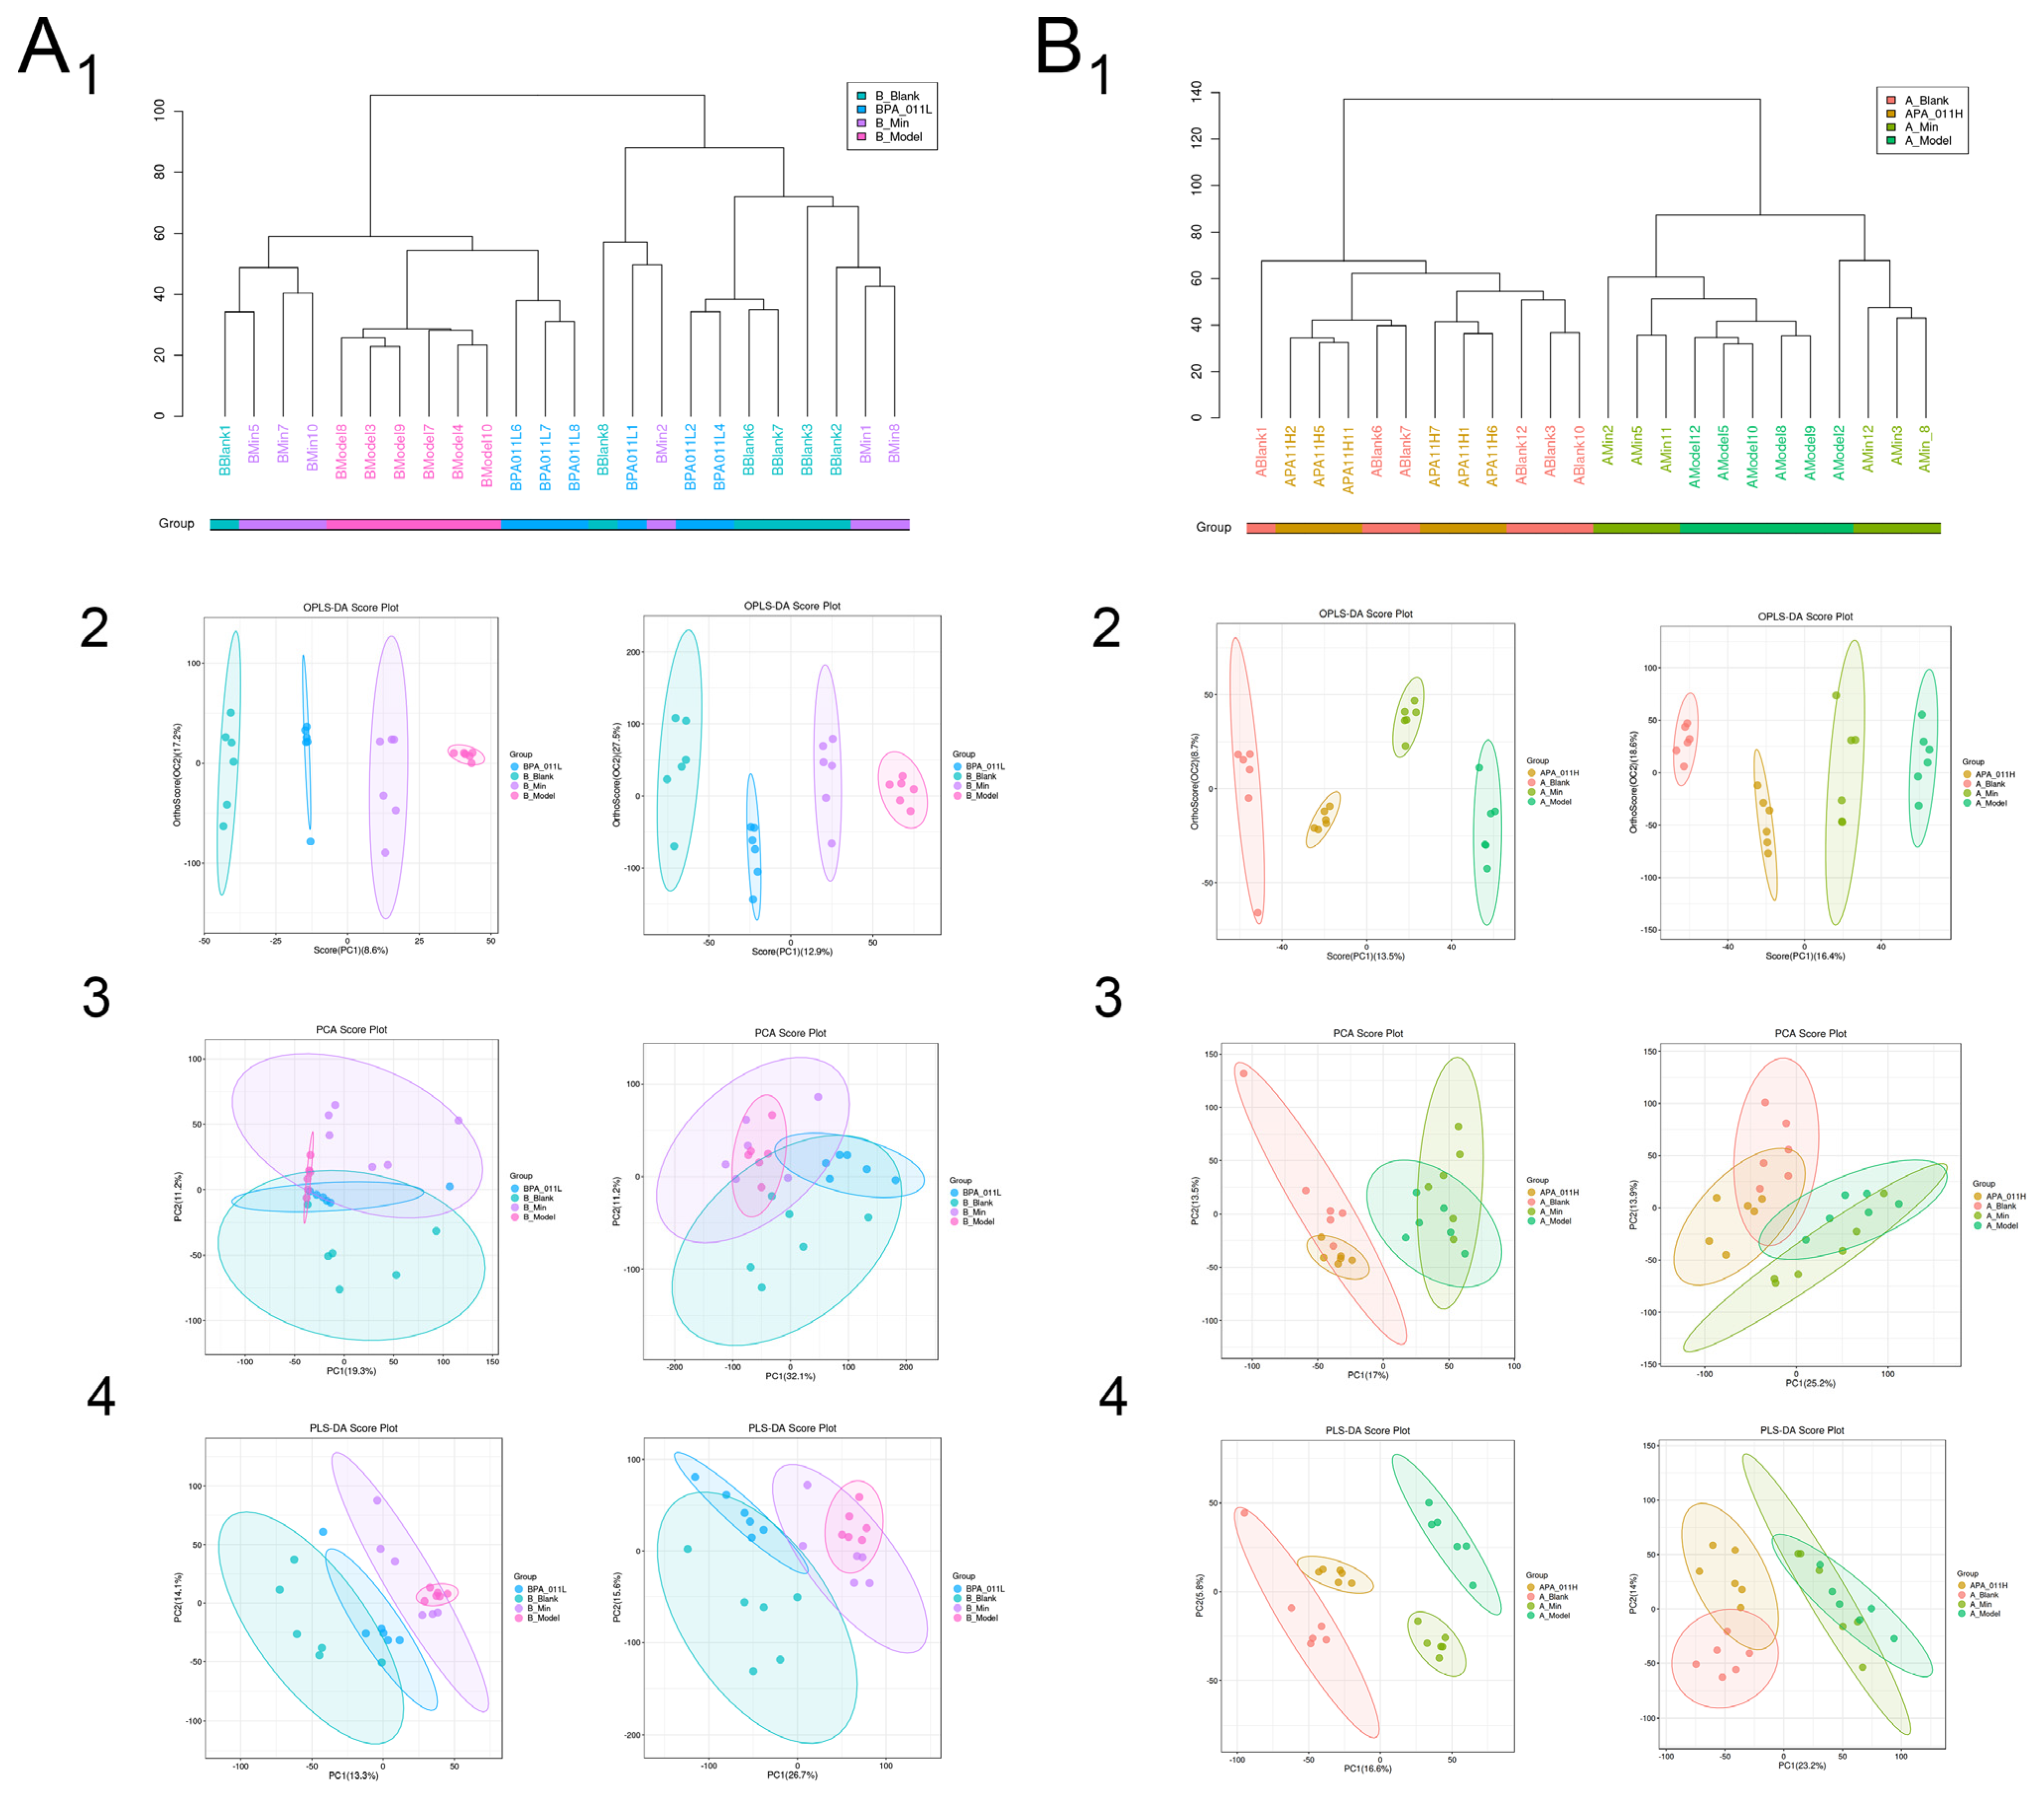
3.9.1. Sample Reliability Test
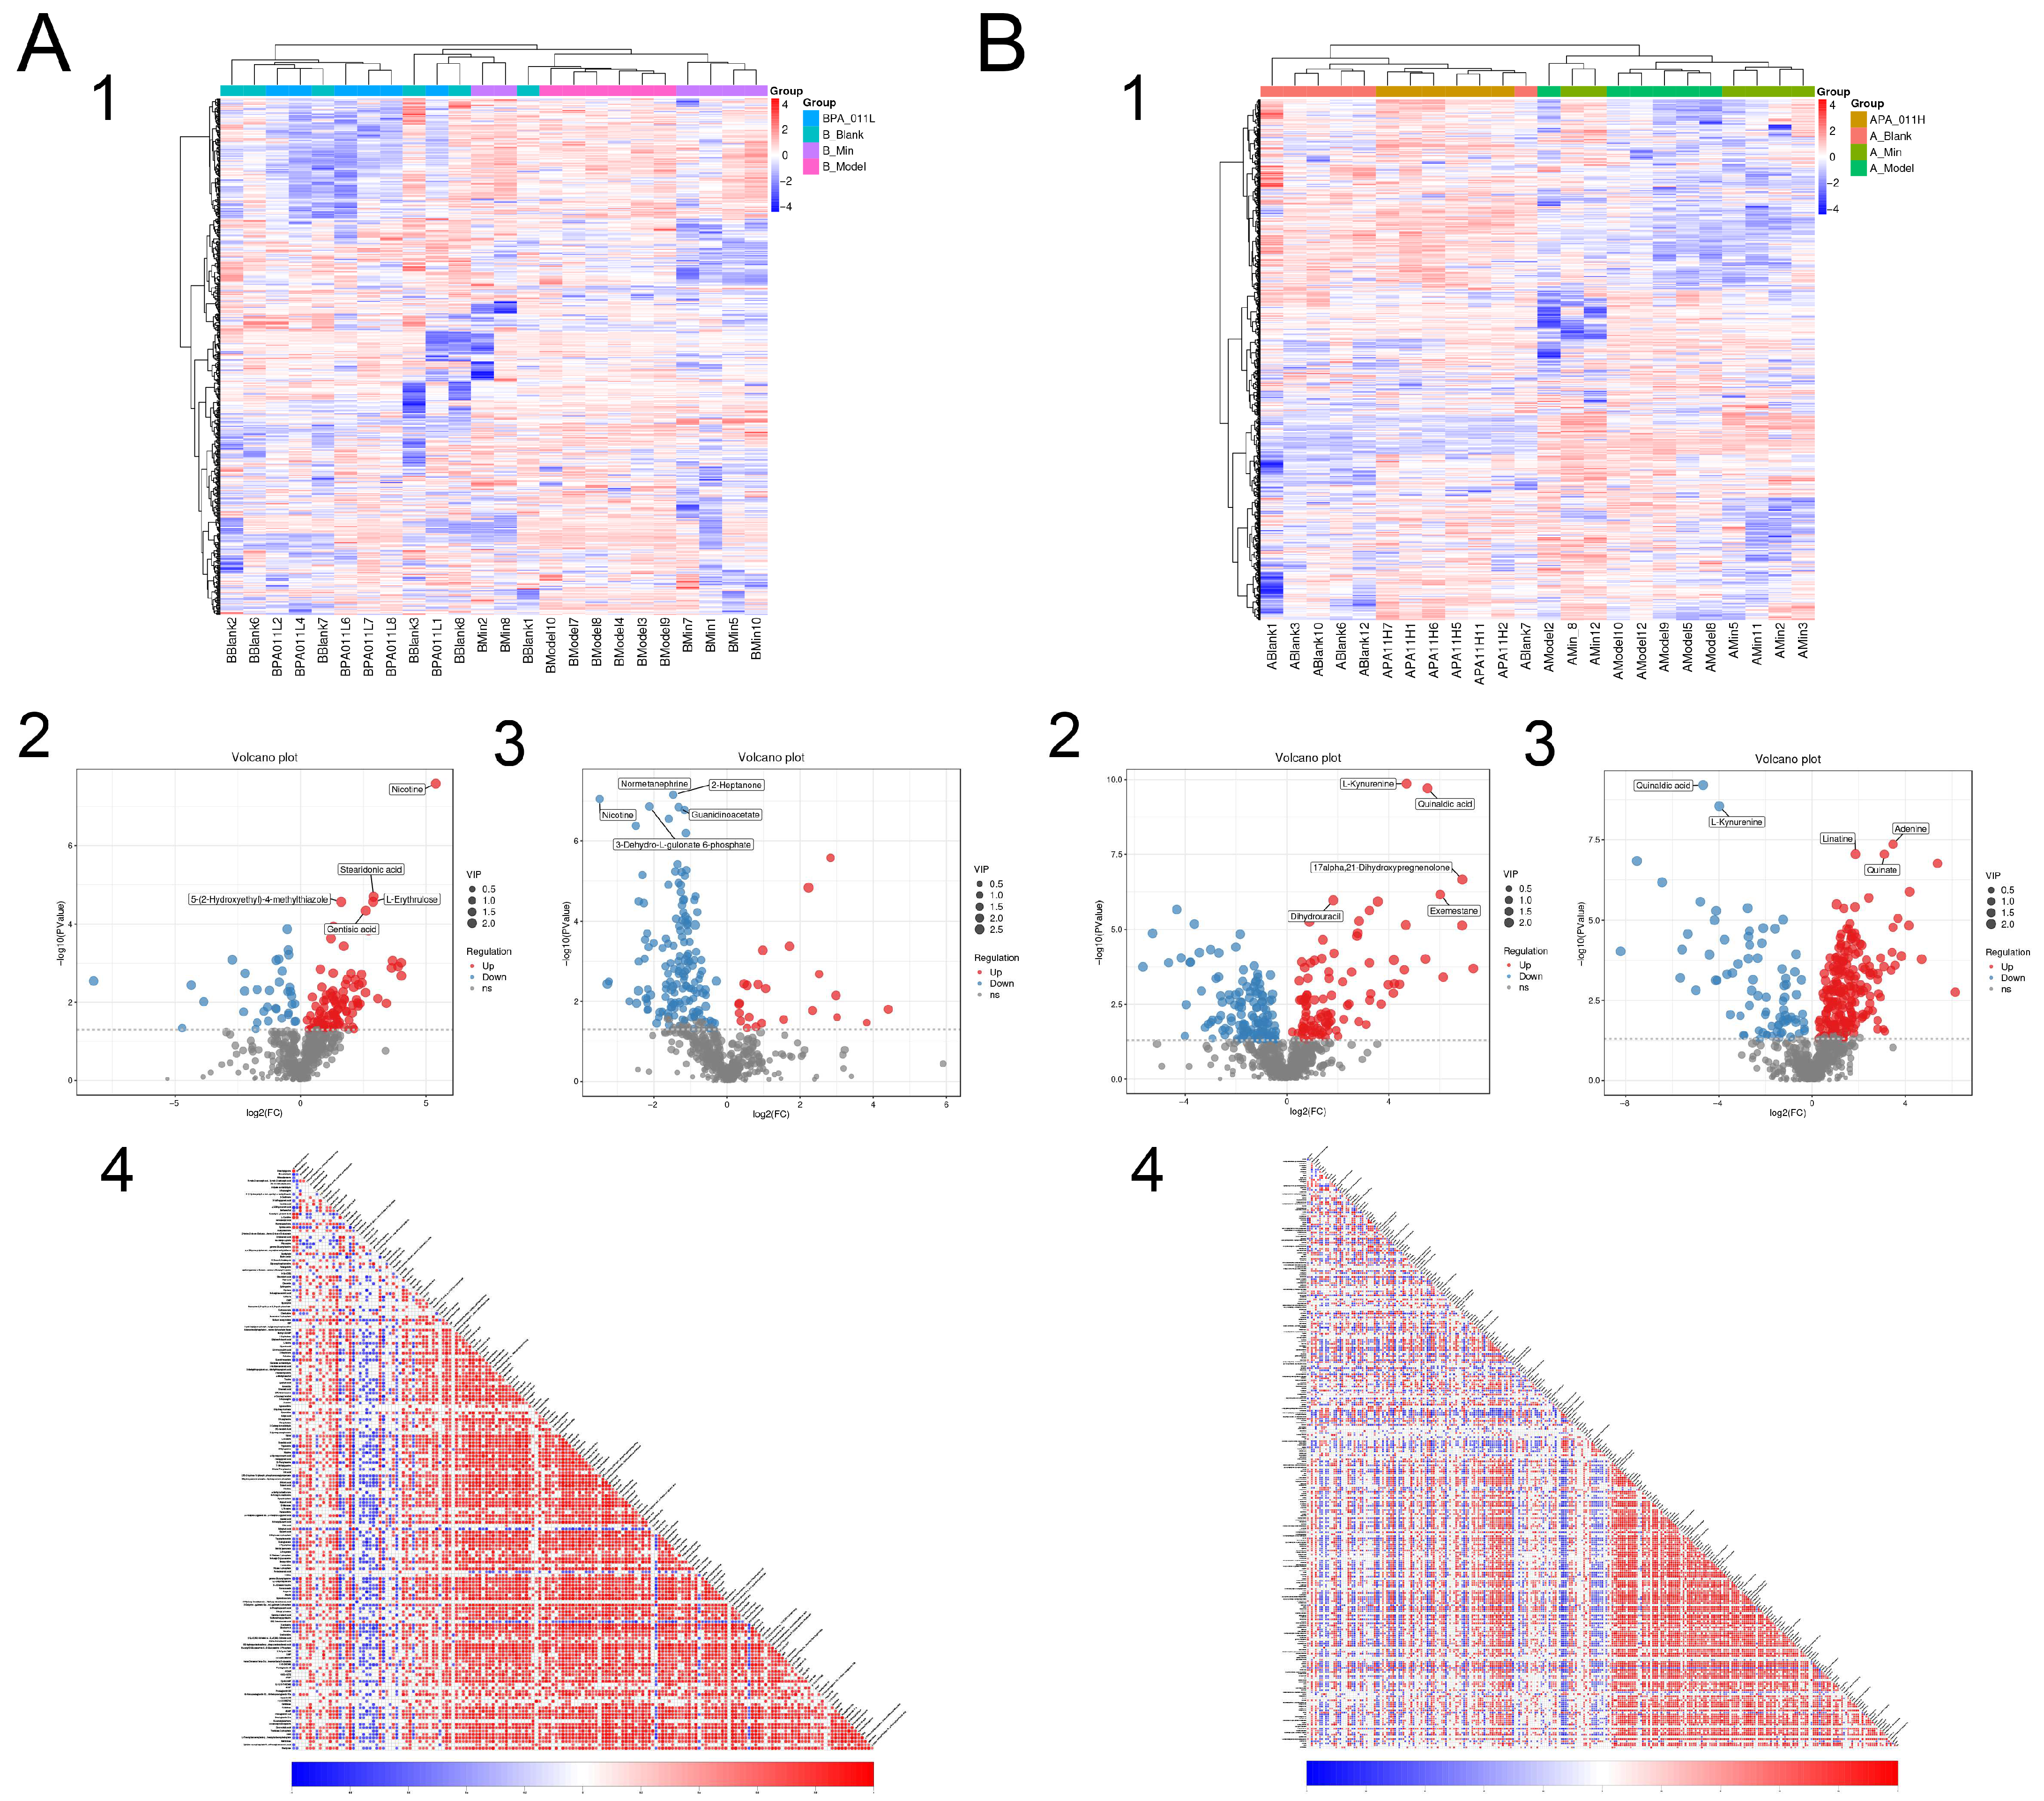
3.9.2. Metabolite Difference Detection
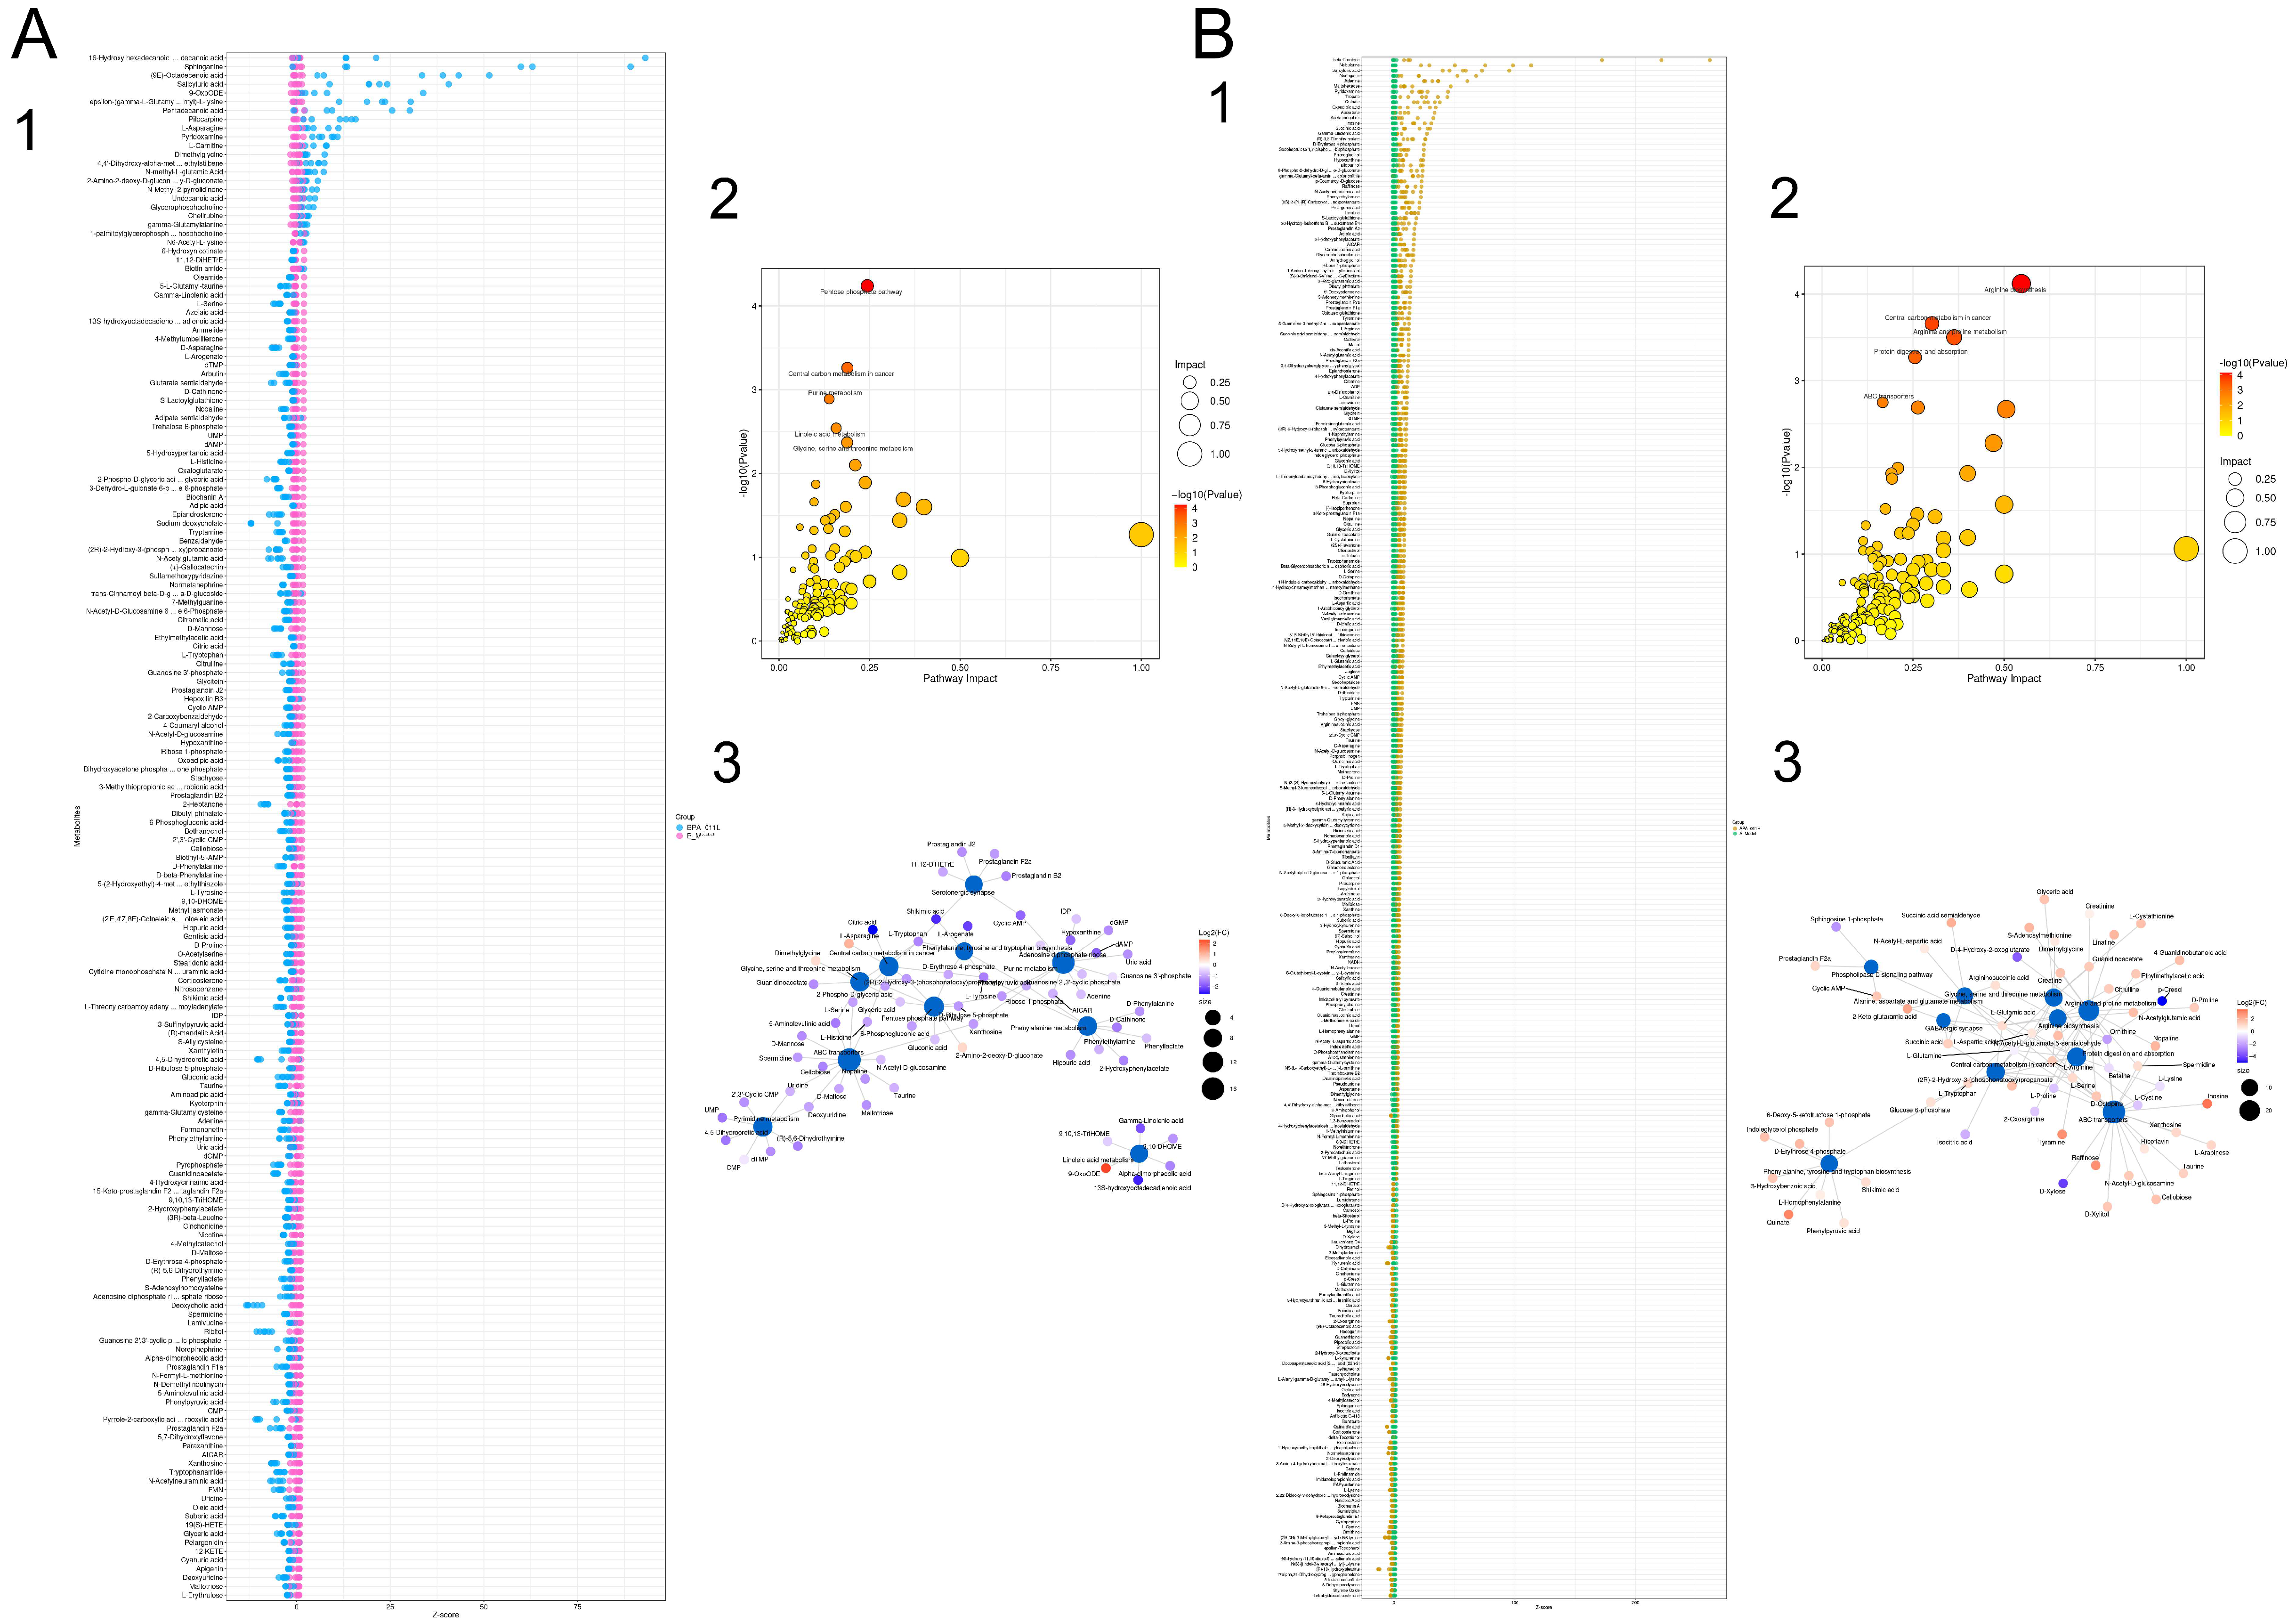
3.9.3. Differential Metabolite Function Prediction
3.10. Combined Transcriptomic and Non-Target Metabolomics Analysis
3.11. PA-011 Changed the Composition of Skin Microbiota in AGA Mice
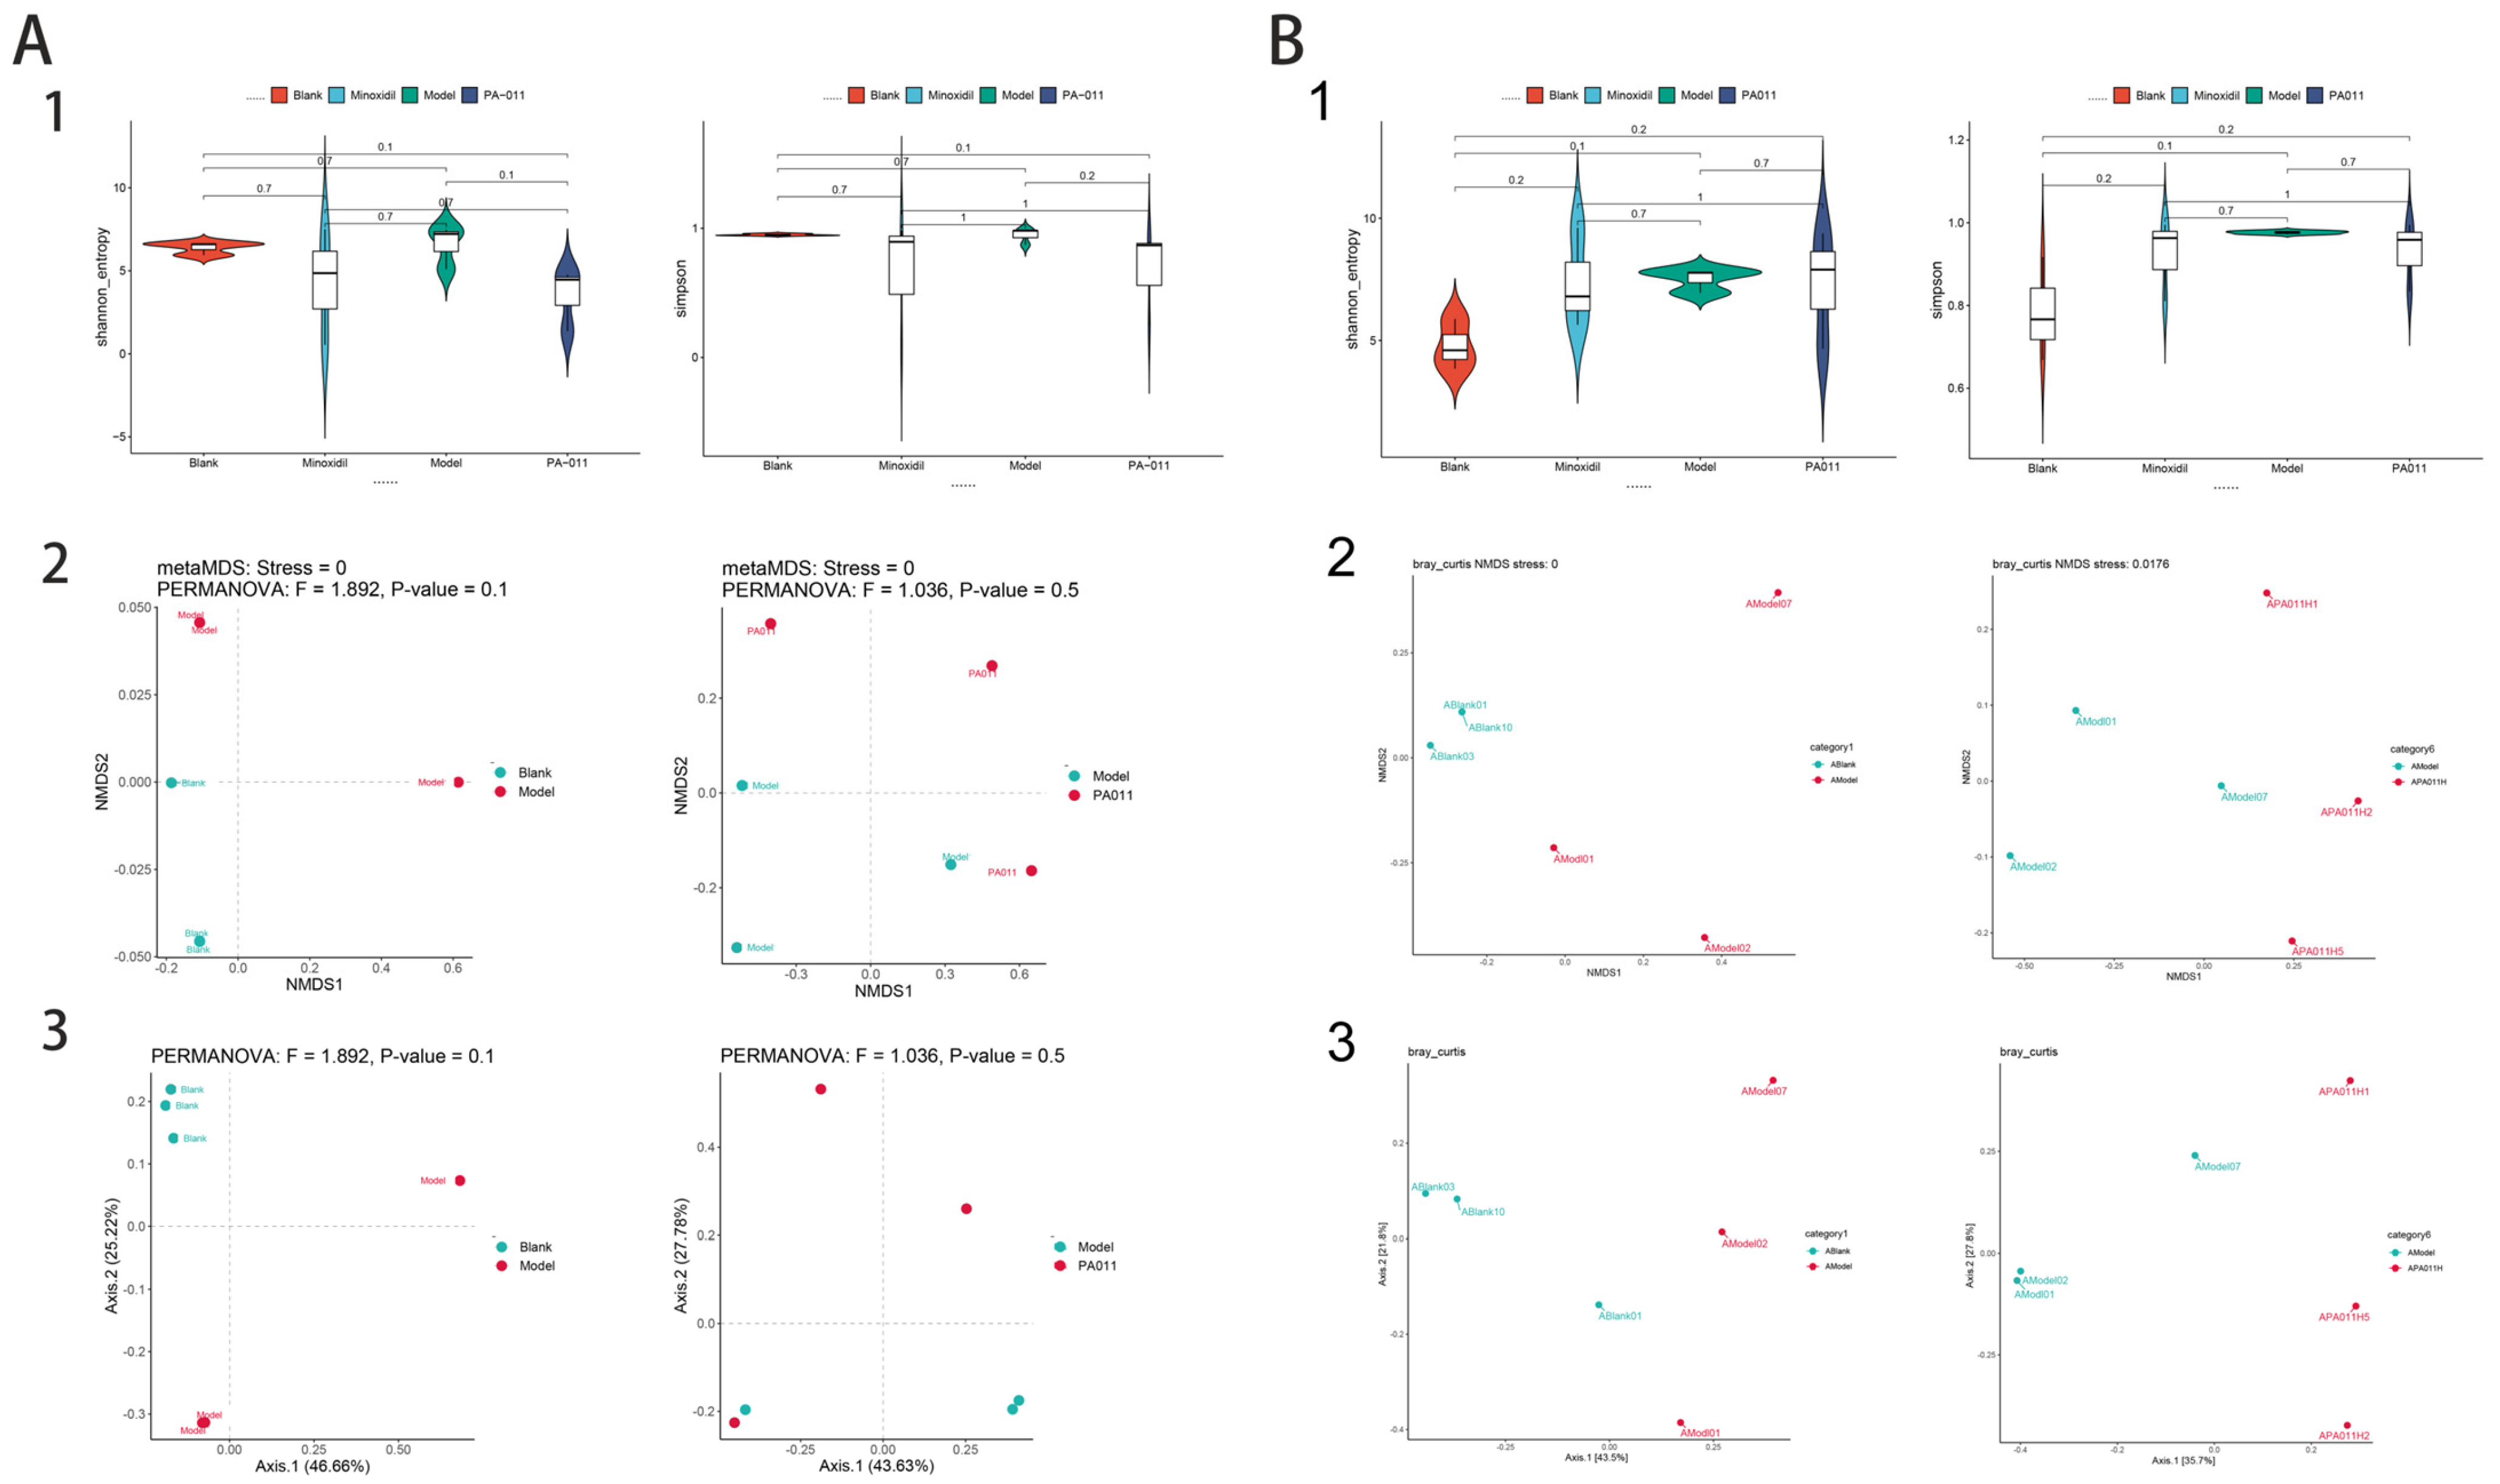
3.11.1. Analysis of Skin Microbiota Diversity
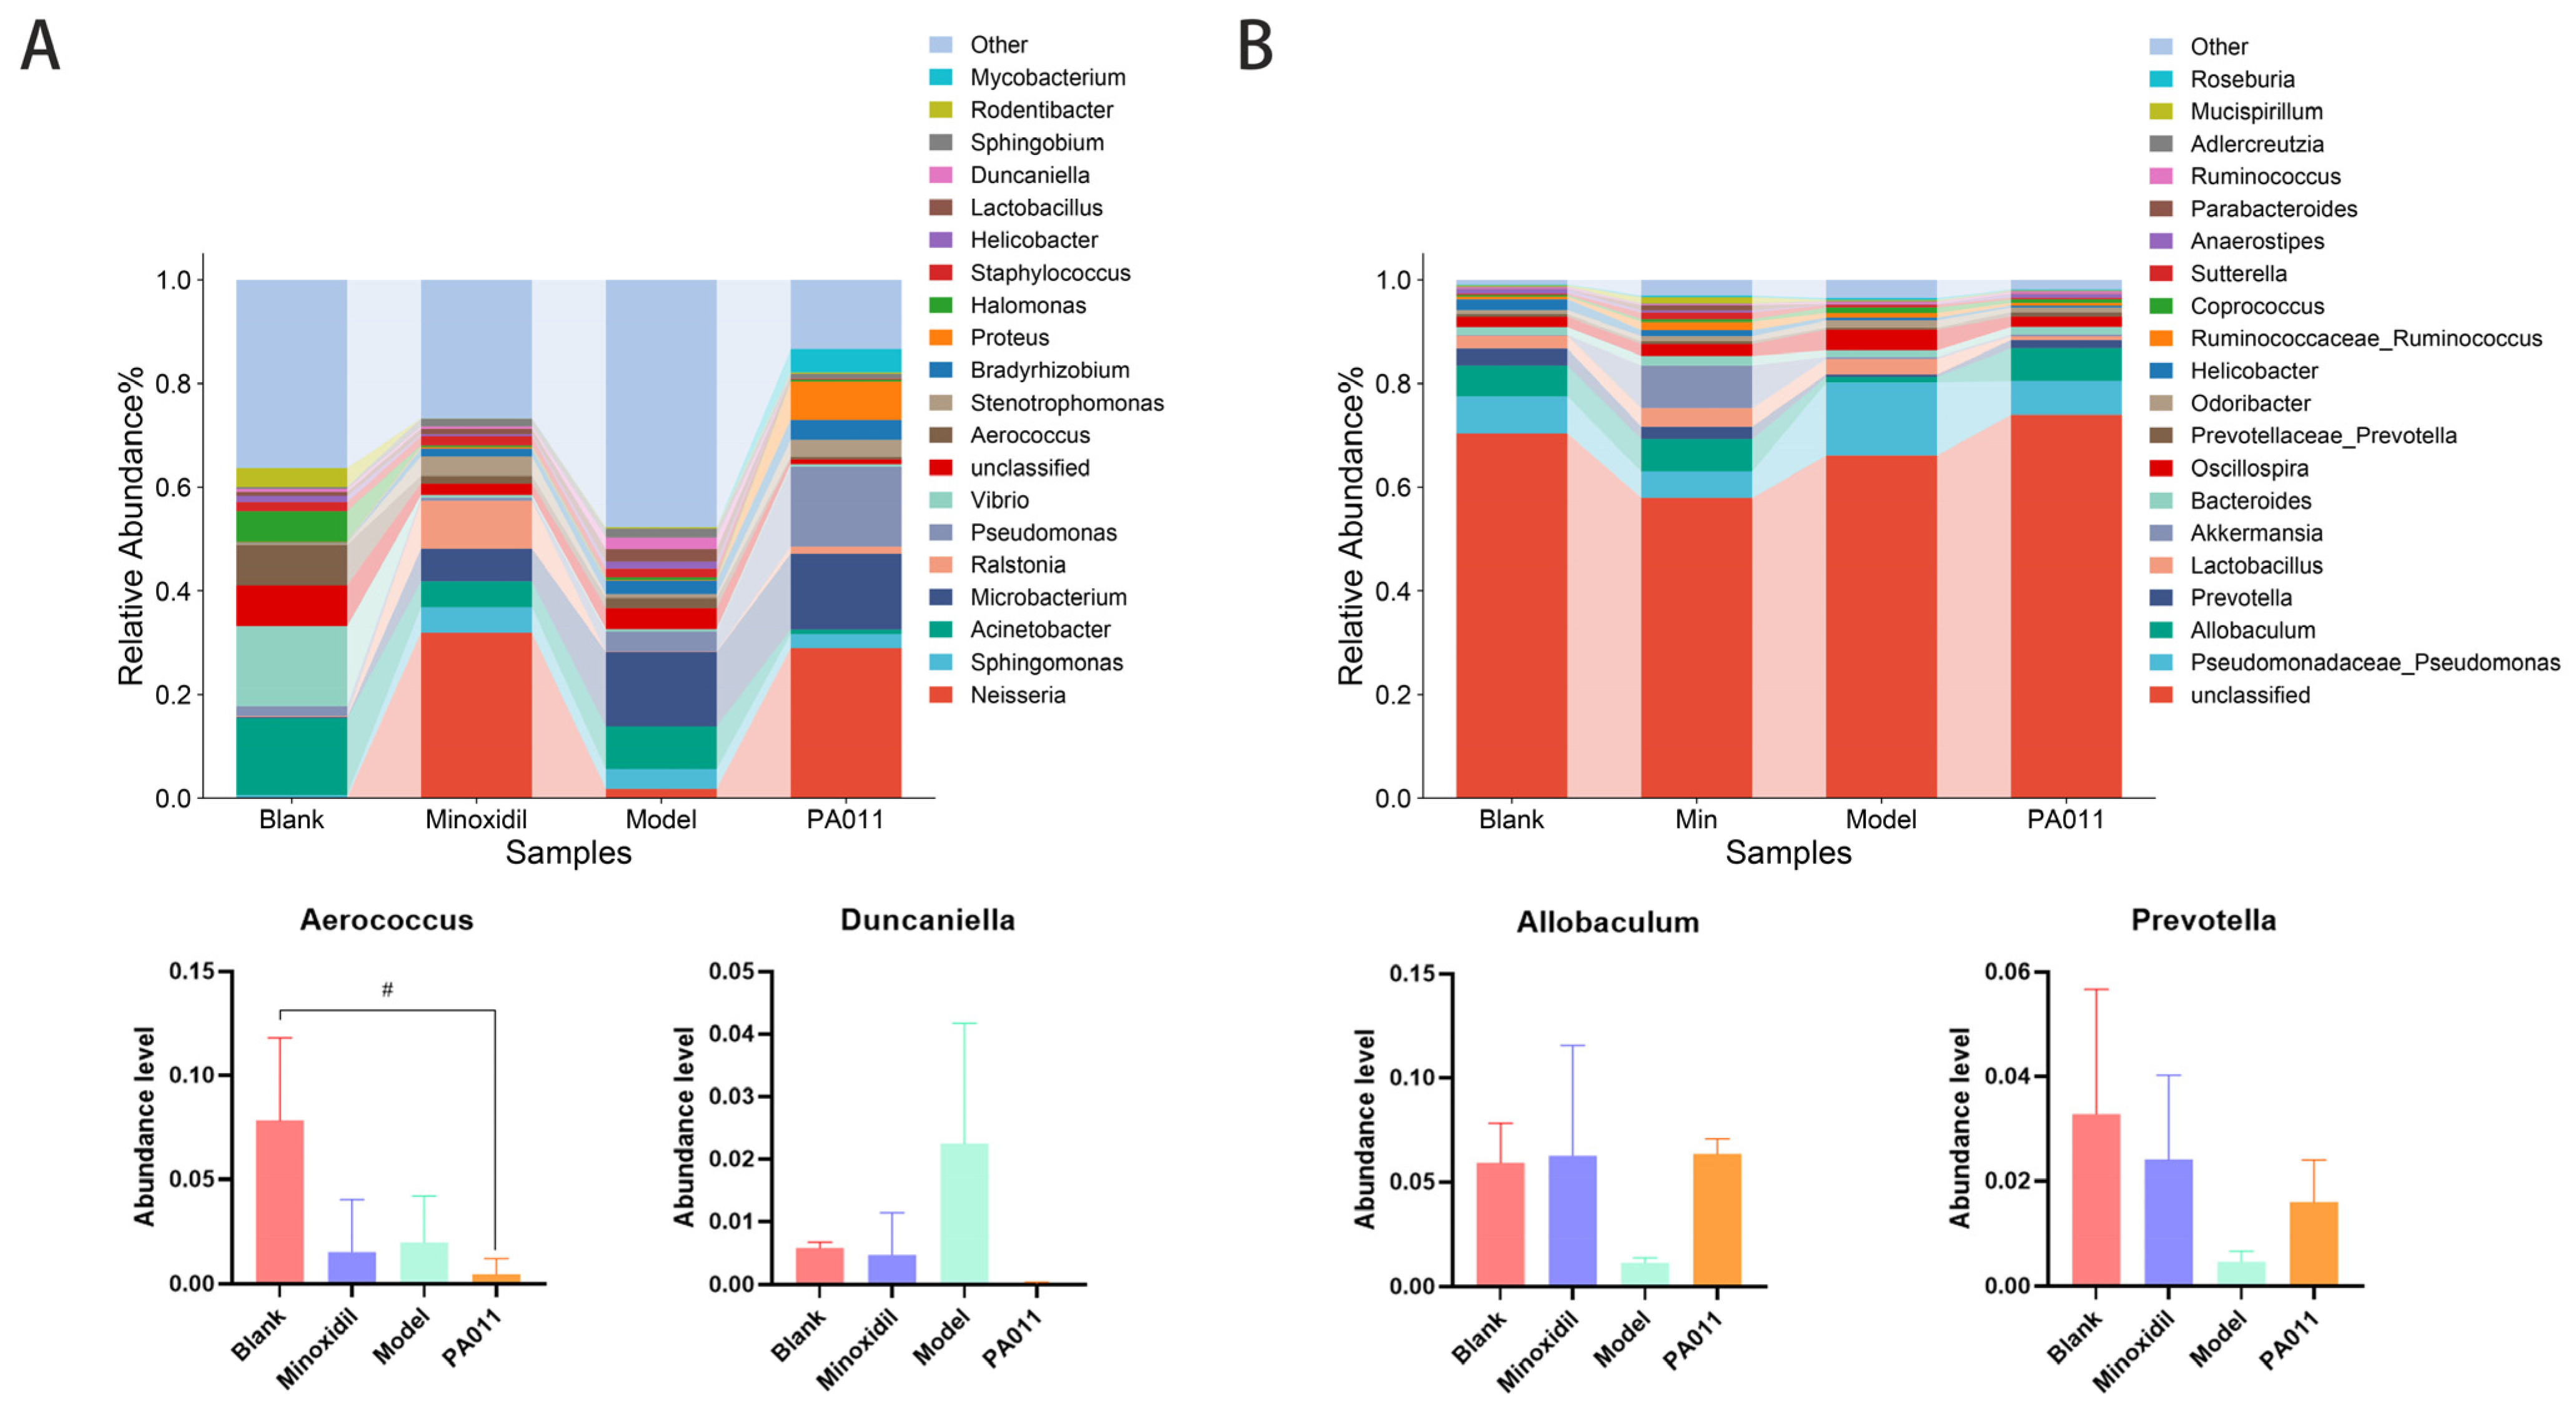
3.11.2. Genus-Level Species Analysis of Skin Microbiota
3.11.3. The Composition of Skin Microbiota Is Correlated with the Levels of HGF, VEGF, MDA, TNF-α, and IL-6 and the Activity of SOD, GSH-PX, and ALP in the Skin After AGA
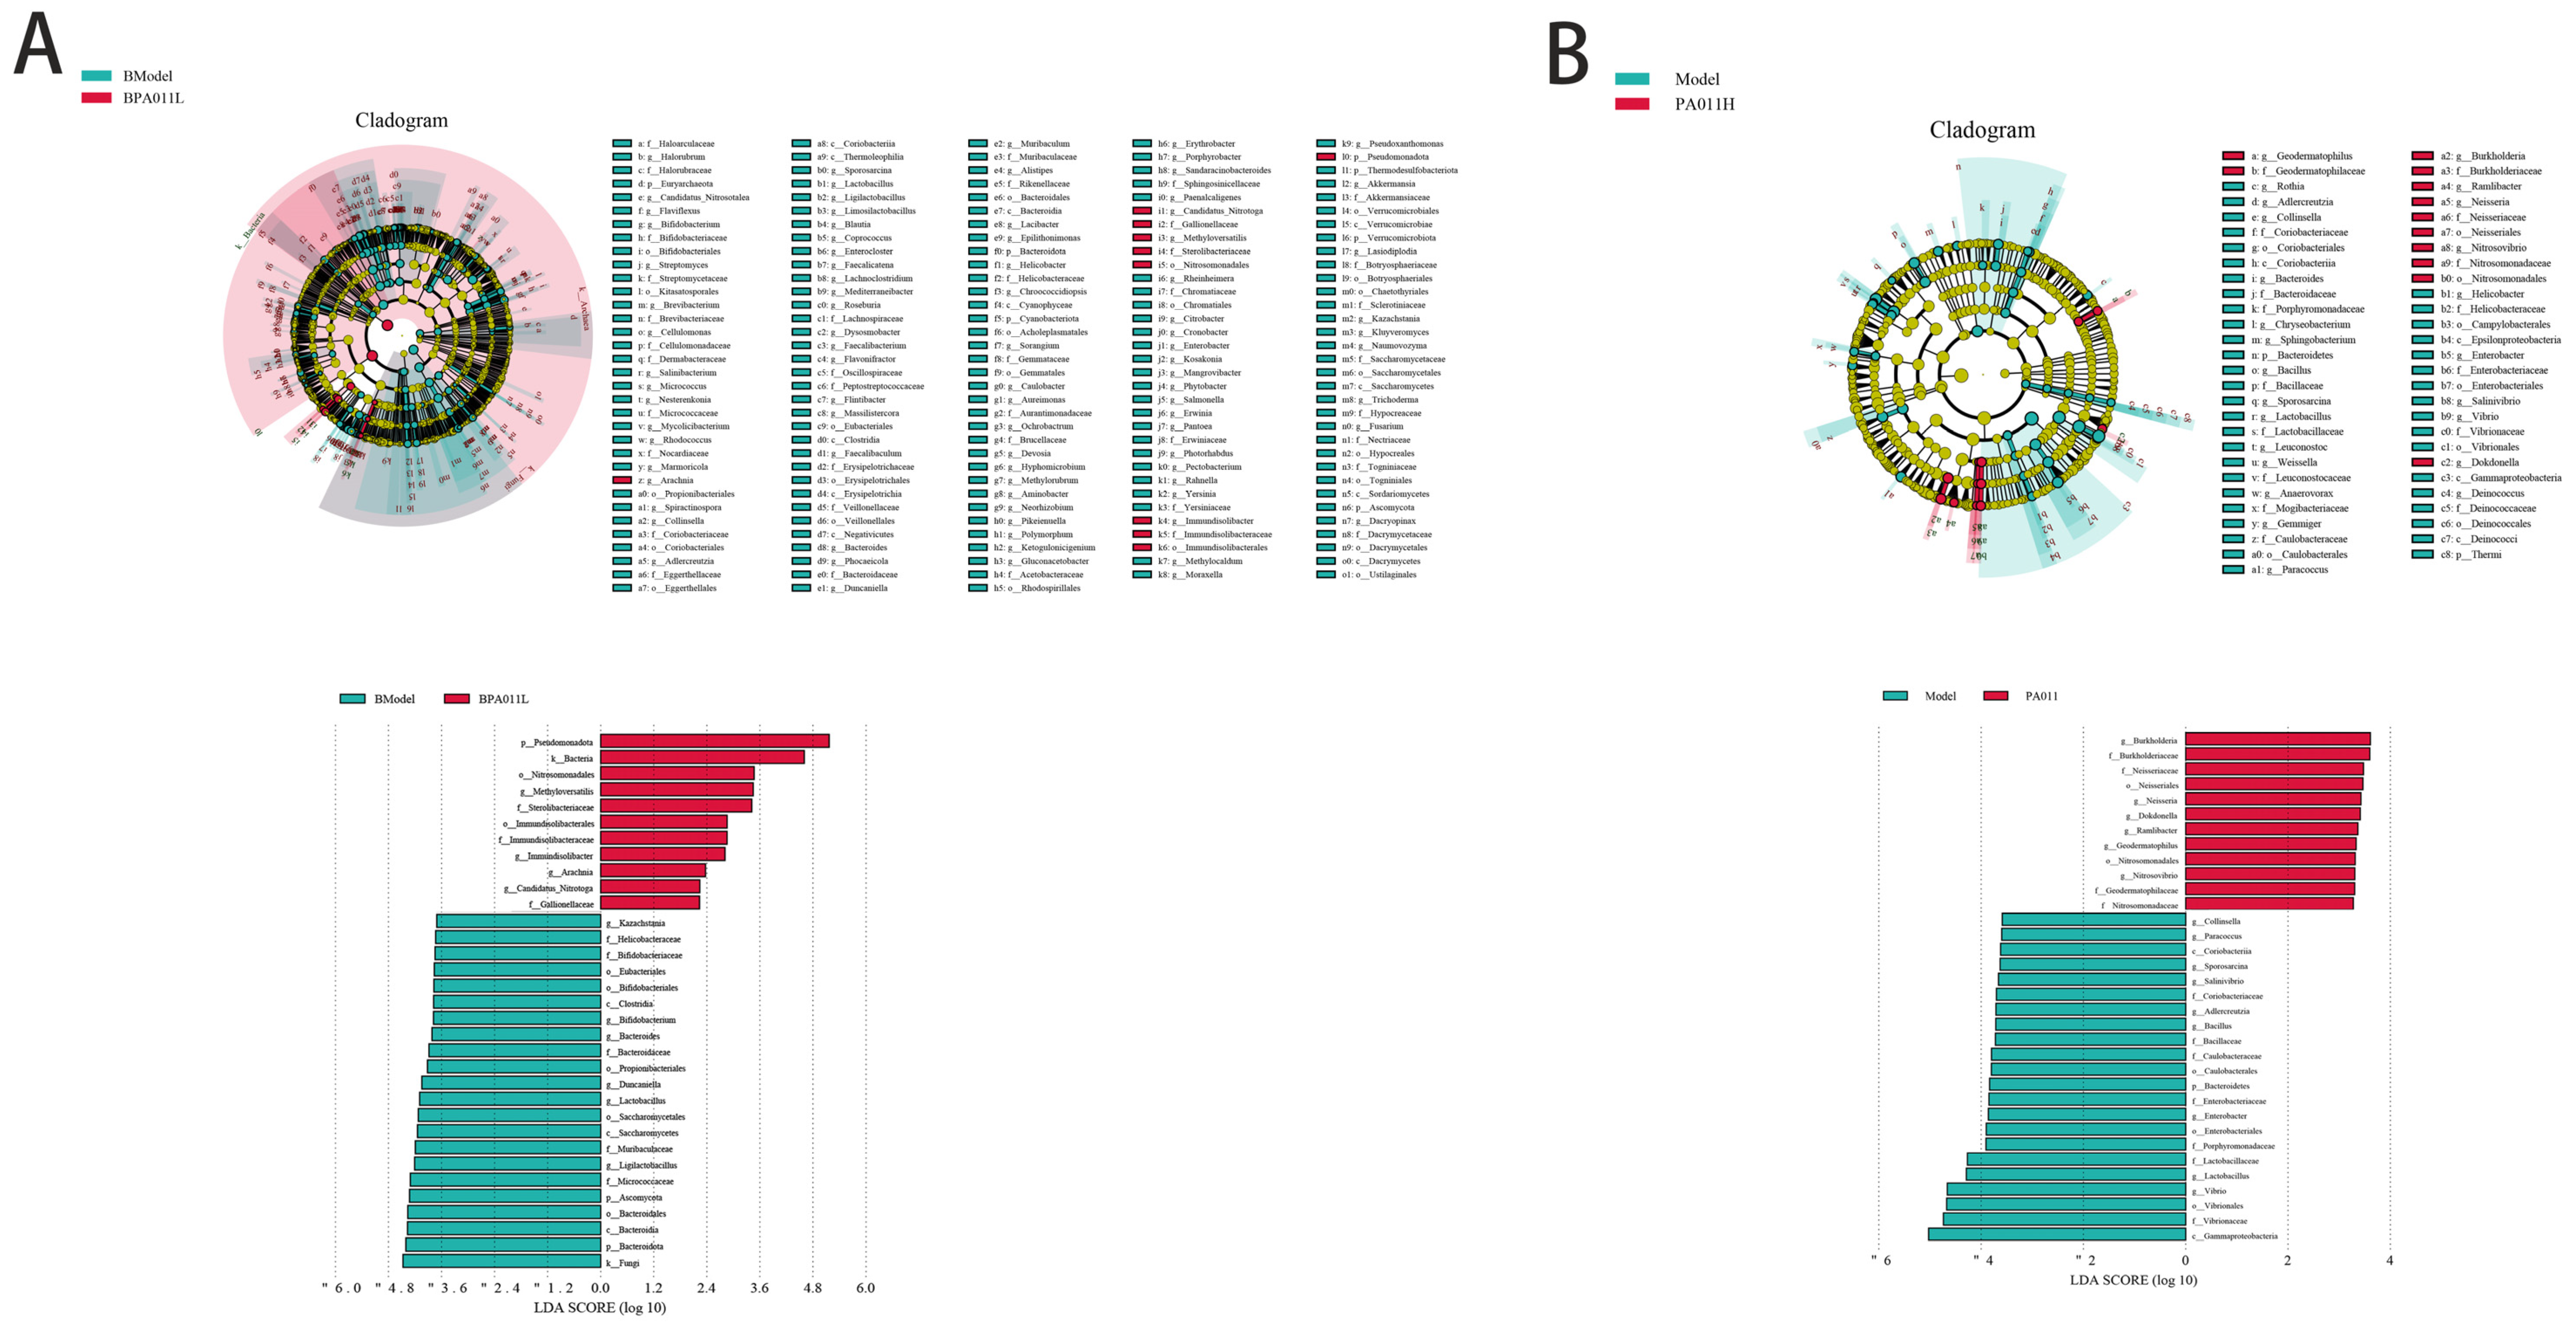
3.11.4. Differences in Microbiota Composition Among Groups
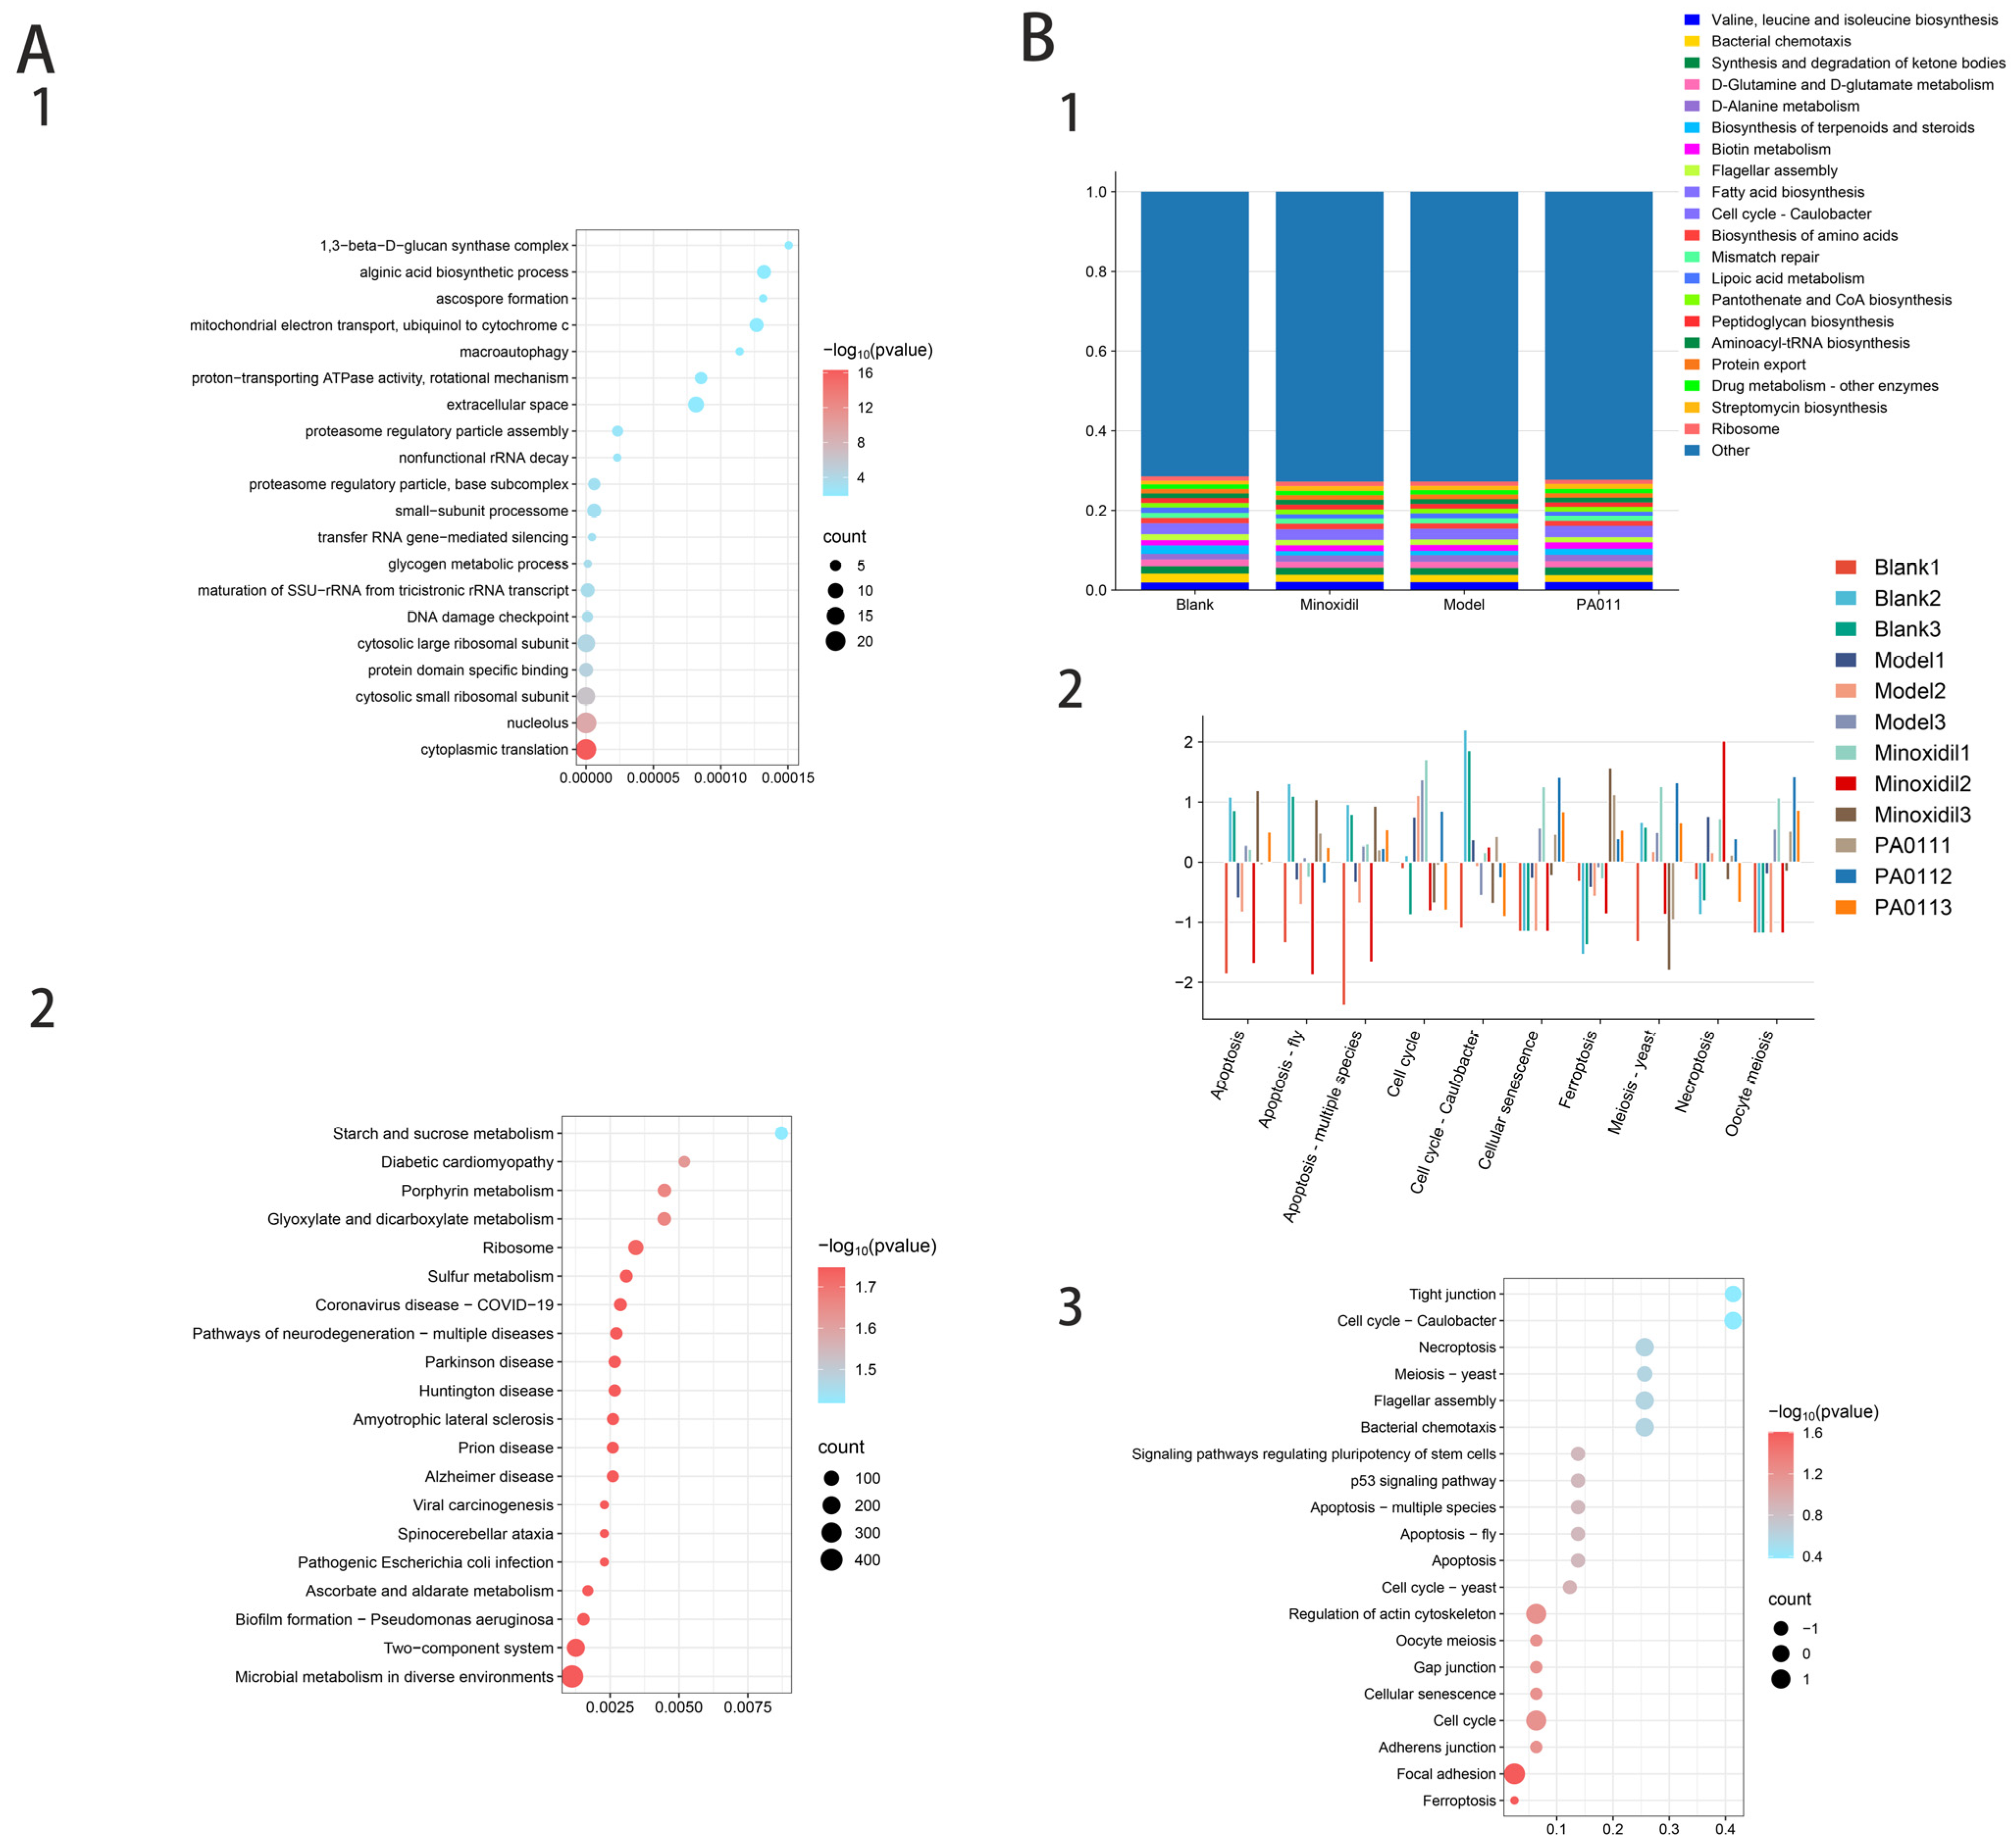
3.11.5. Prediction and Function Analysis of Microbial Composition in Each Group
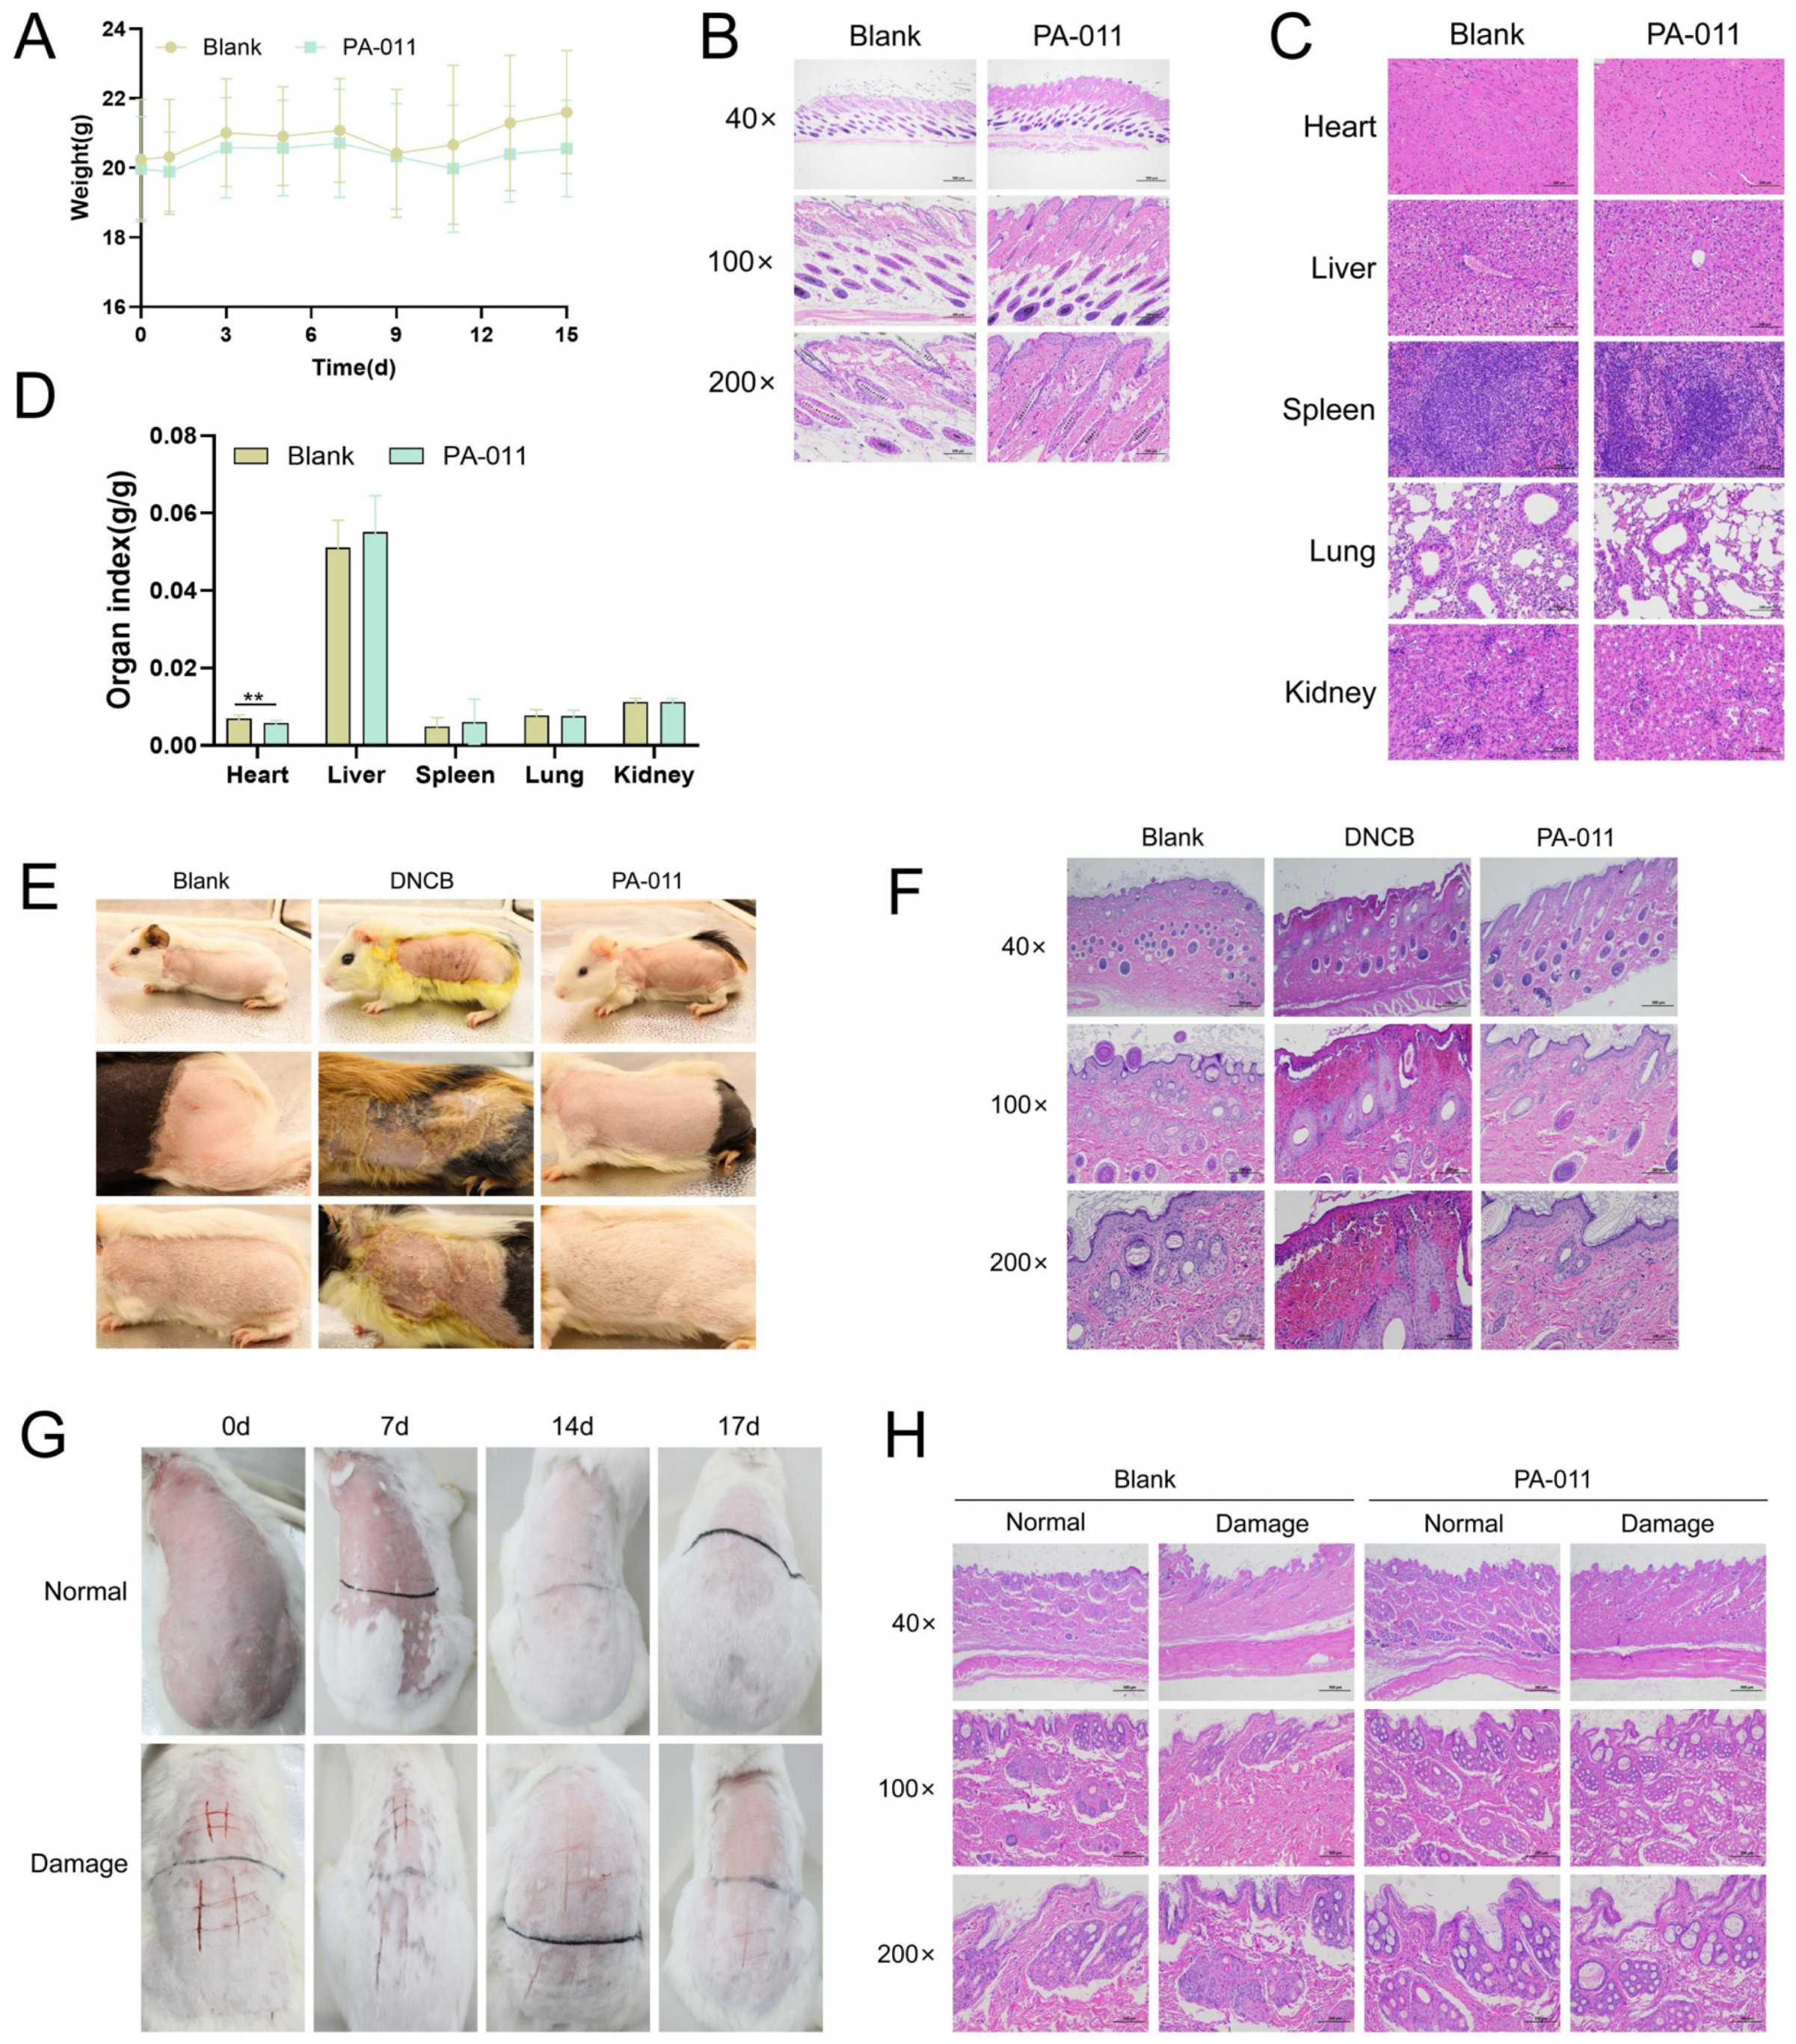
3.12. Topical Application of PA-011 Demonstrated Favorable Safety Profiles
3.13. Acute Dermal Toxicity Test in Mice
3.14. Guinea Pig Skin Sensitization Test
3.15. Rabbit Skin Irritation Test
4. Discussion
5. Conclusions
Supplementary Materials
Author Contributions
Funding
Institutional Review Board Statement
Informed Consent Statement
Data Availability Statement
Conflicts of Interest
Abbreviations
| AGA | Androgenetic alopecia |
| ALP/AKP | Alkaline phosphatase |
| AR | Androgen receptor |
| BP | Biological process |
| CC | Cell composition |
| DHT | Dihydrotestosterone |
| DPCs | Ermal papilla cells |
| E2 | Estradiol |
| GO | Gene Ontology |
| GSH-PX | Glutathione peroxidase |
| HE | Hematoxylin and Eosin |
| HFs | Hair follicle cells |
| HGF | Hepatocyte Growth Factor |
| IL-1α | Interleukin-1α |
| IL-6 | Interleukin 6 |
| KEGG | Kyoto Encyclopedia of Genes and Genomes |
| LC-MS/MS | Liquid Chromatography Tandem Mass Spectrometry |
| MDA | Malondialdehyde |
| MF | Molecular function |
| OPLS-DA | Orthogonal partial least squares discriminant analysis |
| PA | Periplaneta americana |
| PAE | P. americana extract |
| PCA | Principal component analysis |
| PLS-DA | Partial least squares discriminant analysis |
| PPI | Protein interaction |
| SEM | Standard error of the mean |
| SOD | Superoxide dismutase |
| TGF-β 1 | Transforming growth factor-β1 protein |
| TNF-α | Tumor necrosis factor-α |
| VEGF | Vascular endothelial growth factor |
| DNCB | Dinitrochlorobenzene |
References
- Ho, A.; Shapiro, J. Medical therapy for frontal fibrosing alopecia: A review and clinical approach. J. Am. Acad. Dermatol. 2019, 81, 568–580. [Google Scholar] [CrossRef] [PubMed]
- Chen, S.; Xie, X.; Zhang, G.; Zhang, Y. Comorbidities in Androgenetic Alopecia: A Comprehensive Review. Dermatol. Ther. 2022, 12, 2233–2247. [Google Scholar] [CrossRef] [PubMed]
- Katzer, T.; Leite Junior, A.; Beck, R.; da Silva, C. Physiopathology and current treatments of androgenetic alopecia: Going beyond androgens and anti-androgens. Dermatol. Ther. 2019, 32, e13059. [Google Scholar] [CrossRef]
- Li, X.; Jiang, F.; Duan, Y.; Li, Q.; Qu, Y.; Zhao, S.; Yue, X.; Huang, C.; Zhang, C.; Pan, X. Chitosan electrospun nanofibers derived from Periplaneta americana residue for promoting infected wound healing. Int. J. Biol. Macromol. 2023, 229, 654–667. [Google Scholar] [CrossRef]
- Rao, J.; Li, H.; Zhang, H.; Xiang, X.; Ding, X.; Li, L.; Geng, F.; Qi, H. Periplaneta americana (L.) extract activates the ERK/CREB/BDNF pathway to promote post-stroke neuroregeneration and recovery of neurological functions in rats. J. Ethnopharmacol. 2024, 321, 117400. [Google Scholar] [CrossRef]
- Song, Q.; Xie, Y.; Gou, Q.; Guo, X.; Yao, Q.; Gou, X. JAK/STAT3 and Smad3 activities are required for the wound healing properties of Periplaneta americana extracts. Int. J. Mol. Med. 2017, 40, 465–473. [Google Scholar] [CrossRef]
- Chen, X.H.; Ran, X.Z.; Sun, R.S.; Shi, C.M.; Su, Y.; Guo, C.H.; Cheng, T.M. Protective effect of an extract from Periplaneta americana on hematopoiesis in irradiated rats. Int. J. Radiat. Biol. 2009, 85, 607–613. [Google Scholar] [CrossRef]
- Nguyen, T.; Chen, X.; Chai, J.; Li, R.; Han, X.; Chen, X.; Liu, S.; Chen, M.; Xu, X. Antipyretic, anti-inflammatory and analgesic activities of Periplaneta americana extract and underlying mechanisms. Biomed. Pharmacother. 2020, 123, 109753. [Google Scholar] [CrossRef]
- Liao, Q.; Su, L.; Pang, L.; Li, J.; Li, H.; Li, J.; Liu, Y.; Zhang, J. Natural exosome-like nanoparticles derived from ancient medicinal insect Periplaneta americana L. as a novel diabetic wound healing accelerator. J. Nanobiotechnol. 2023, 21, 169. [Google Scholar] [CrossRef]
- Xiao, X.; Zhu, A.; He, G.; Tokula, S.; Yang, Y.; Qing, Y.; Liu, Y.; Hu, H.; Song, Q. A polysaccharide from Periplaneta americana promotes macrophage M2 polarization, exhibiting anti-inflammatory and wound-healing activities. Int. J. Biol. Macromol. 2024, 281, 135836. [Google Scholar] [CrossRef]
- Li, L.J.; Wang, M.Z.; Yuan, T.J.; Xu, X.H.; Dad, H.A.; Yu, C.L.; Hou, J.; Peng, L.H. The crude ethanol extract of Periplaneta americana L. stimulates wound healing in vitro & in vivo. Chin. Med. 2019, 14, 33. [Google Scholar] [CrossRef] [PubMed]
- Xia, W.; Wang, Y.; Yue, J.; Fu, X. Insights into Q-markers of honey-fried licorice in treating spleen deficiency based on substance and energy metabolism regulation. Phytomedicine 2024, 127, 155498. [Google Scholar] [CrossRef] [PubMed]
- Yang, Y.; Fan, C.; Zhang, Y.; Kang, T.; Jiang, J. Untargeted Metabolomics Reveals the Role of Lipocalin-2 in the Pathological Changes of Lens and Retina in Diabetic Mice. Investig. Ophthalmol. Vis. Sci. 2024, 65, 19. [Google Scholar] [CrossRef]
- Zelena, E.; Dunn, W.B.; Broadhurst, D.; Francis-McIntyre, S.; Carroll, K.M.; Begley, P.; O’Hagan, S.; Knowles, J.D.; Halsall, A.; Wilson, I.D.; et al. Development of a robust and repeatable UPLC-MS method for the long-term metabolomic study of human serum. Anal. Chem. 2009, 81, 1357–1364. [Google Scholar] [CrossRef]
- Want, E.J.; Masson, P.; Michopoulos, F.; Wilson, I.D.; Theodoridis, G.; Plumb, R.S.; Shockcor, J.; Loftus, N.; Holmes, E.; Nicholson, J.K. Global metabolic profiling of animal and human tissues via UPLC-MS. Nat. Protoc. 2013, 8, 17–32. [Google Scholar] [CrossRef]
- Song, H.; Hu, Z.; Zhang, S.; Yang, L.; Feng, J.; Lu, L.; Liu, Y.; Wang, T. Application of urine proteomics in the diagnosis and treatment effectiveness monitoring of early-stage Mycosis Fungoides. Clin. Proteom. 2024, 21, 53. [Google Scholar] [CrossRef]
- Xia, W.; Wang, Y.; Tao, M.; Li, T.; Fu, X. Effect of Licorice polysaccharides before and after honey-processing on improving chronic fatigue syndrome and its mechanism. Int. J. Biol. Macromol. 2024, 276, 133968. [Google Scholar] [CrossRef]
- Xiang, L.; Qiu, Z.; Zhao, R.; Zheng, Z.; Qiao, X. Advancement and prospects of production, transport, functional activity and structure-activity relationship of food-derived angiotensin converting enzyme (ACE) inhibitory peptides. Crit. Rev. Food Sci. Nutr. 2023, 63, 1437–1463. [Google Scholar] [CrossRef]
- Ge, H.; Zhang, B.; Li, T.; Yu, Y.; Men, F.; Zhao, S.; Liu, J.; Zhang, T. Potential targets and the action mechanism of food-derived dipeptides on colitis: Network pharmacology and bioinformatics analysis. Food Funct. 2021, 12, 5989–6000. [Google Scholar] [CrossRef]
- Guha, S.; Majumder, K. Structural-features of food-derived bioactive peptides with anti-inflammatory activity: A brief review. J. Food Biochem. 2019, 43, e12531. [Google Scholar] [CrossRef]
- Edwards, A.B.; Anderton, R.S.; Knuckey, N.W.; Meloni, B.P. Perinatal Hypoxic-Ischemic Encephalopathy and Neuroprotective Peptide Therapies: A Case for Cationic Arginine-Rich Peptides (CARPs). Brain Sci. 2018, 8, 147. [Google Scholar] [CrossRef] [PubMed]
- Fu, D.; Huang, J.; Li, K.; Chen, Y.; He, Y.; Sun, Y.; Guo, Y.; Du, L.; Qu, Q.; Miao, Y.; et al. Dihydrotestosterone-induced hair regrowth inhibition by activating androgen receptor in C57BL6 mice simulates androgenetic alopecia. Biomed. Pharmacother. 2021, 137, 111247. [Google Scholar] [CrossRef] [PubMed]
- Kong, J.; Qiang, W.; Jiang, J.; Hu, X.; Chen, Y.; Guo, Y.; Liu, H.; Sun, S.; Gao, H.; Zhang, Y.; et al. Safflower oil body nanoparticles deliver hFGF10 to hair follicles and reduce microinflammation to accelerate hair regeneration in androgenetic alopecia. Int. J. Pharm. 2022, 616, 121537. [Google Scholar] [CrossRef]
- Kanti, V.; Messenger, A.; Dobos, G.; Reygagne, P.; Finner, A.; Blumeyer, A.; Trakatelli, M.; Tosti, A.; Del Marmol, V.; Piraccini, B.M.; et al. Evidence-based (S3) guideline for the treatment of androgenetic alopecia in women and in men–short version. J. Eur. Acad. Dermatol. Venereol. 2018, 32, 11–22. [Google Scholar] [CrossRef]
- Thévenot, E.A.; Roux, A.; Xu, Y.; Ezan, E.; Junot, C. Analysis of the Human Adult Urinary Metabolome Variations with Age, Body Mass Index, and Gender by Implementing a Comprehensive Workflow for Univariate and OPLS Statistical Analyses. J. Proteome Res. 2015, 14, 3322–3335. [Google Scholar] [CrossRef]
- Xia, J.; Wishart, D.S. Web-based inference of biological patterns, functions and pathways from metabolomic data using MetaboAnalyst. Nat. Protoc. 2011, 6, 743–760. [Google Scholar] [CrossRef]
- Villar, E.; Farrant, G.K.; Follows, M.; Garczarek, L.; Speich, S.; Audic, S.; Bittner, L.; Blanke, B.; Brum, J.R.; Brunet, C.; et al. Environmental characteristics of Agulhas rings affect interocean plankton transport. Science 2015, 348, 1261447. [Google Scholar] [CrossRef]
- Hsia, C.W.; Ho, M.Y.; Shui, H.A.; Tsai, C.B.; Tseng, M.J. Analysis of dermal papilla cell interactome using STRING database to profile the ex vivo hair growth inhibition effect of a vinca alkaloid drug, colchicine. Int. J. Mol. Sci. 2015, 16, 3579–3598. [Google Scholar] [CrossRef]
- Son, M.J.; Jeong, J.K.; Kwon, Y.; Ryu, J.S.; Mun, S.J.; Kim, H.J.; Kim, S.W.; Yoo, S.; Kook, J.; Lee, H.; et al. A novel and safe small molecule enhances hair follicle regeneration by facilitating metabolic reprogramming. Exp. Mol. Med. 2018, 50, 1–15. [Google Scholar] [CrossRef]
- Krefft-Trzciniecka, K.; Piętowska, Z.; Nowicka, D.; Szepietowski, J.C. Human Stem Cell Use in Androgenetic Alopecia: A Systematic Review. Cells 2023, 12, 951. [Google Scholar] [CrossRef]
- Castro, A.R.; Portinha, C.; Logarinho, E. The booming business of hair loss. Trends Biotechnol. 2023, 41, 731–735. [Google Scholar] [CrossRef] [PubMed]
- Rogers, N.E.; Avram, M.R. Medical treatments for male and female pattern hair loss. J. Am. Acad. Dermatol. 2008, 59, 547–568. [Google Scholar] [CrossRef] [PubMed]
- Carlin, J.R.; Höglund, P.; Eriksson, L.O.; Christofalo, P.; Gregoire, S.L.; Taylor, A.M.; Andersson, K.E. Disposition and pharmacokinetics of [14C]finasteride after oral administration in humans. Drug Metab. Dispos. 1992, 20, 148–155. [Google Scholar] [CrossRef] [PubMed]
- Oliveira-Soares, R.; André, M.C.; Peres-Correia, M. Adverse Effects with Finasteride 5 mg/day for Patterned Hair Loss in Premenopausal Women. Int. J. Trichol. 2018, 10, 48–50. [Google Scholar] [CrossRef]
- Morinaga, H.; Mohri, Y.; Grachtchouk, M.; Asakawa, K.; Matsumura, H.; Oshima, M.; Takayama, N.; Kato, T.; Nishimori, Y.; Sorimachi, Y.; et al. Obesity accelerates hair thinning by stem cell-centric converging mechanisms. Nature 2021, 595, 266–271. [Google Scholar] [CrossRef]
- Kwack, M.H.; Sung, Y.K.; Chung, E.J.; Im, S.U.; Ahn, J.S.; Kim, M.K.; Kim, J.C. Dihydrotestosterone-inducible dickkopf 1 from balding dermal papilla cells causes apoptosis in follicular keratinocytes. J. Investig. Dermatol. 2008, 128, 262–269. [Google Scholar] [CrossRef]
- Wang, Z.D.; Feng, Y.; Sun, L.; Gan, J.; Li, X.; Ding, W.F.; Chen, X.M. Anti-androgenetic alopecia effect of policosanol from Chinese wax by regulating abnormal hormone levels to suppress premature hair follicle entry into the regression phase. Biomed. Pharmacother. 2021, 136, 111241. [Google Scholar] [CrossRef]
- Kwack, M.H.; Kim, M.K.; You, S.H.; Kim, N.; Park, J.H. Comparative Graft Survival Study of Follicular Unit Excision Grafts With or Without Minor Injury. Dermatol. Surg. 2021, 47, e191–e194. [Google Scholar] [CrossRef]
- Deng, W.; Zhang, Y.; Wang, W.; Song, A.; Mukama, O.; Huang, J.; Han, X.; Deng, S.; Lin, Z.; Habimana, J.d.D.; et al. Hair follicle-derived mesenchymal stem cells decrease alopecia areata mouse hair loss and reduce inflammation around the hair follicle. Stem Cell Res. Ther. 2021, 12, 548. [Google Scholar] [CrossRef]
- Müller-Röver, S.; Handjiski, B.; van der Veen, C.; Eichmüller, S.; Foitzik, K.; McKay, I.A.; Stenn, K.S.; Paus, R. A comprehensive guide for the accurate classification of murine hair follicles in distinct hair cycle stages. J. Investig. Dermatol. 2001, 117, 3–15. [Google Scholar] [CrossRef]
- Wang, E.C.; Dai, Z.; Ferrante, A.W.; Drake, C.G.; Christiano, A.M. A Subset of TREM2 Dermal Macrophages Secretes Oncostatin M to Maintain Hair Follicle Stem Cell Quiescence and Inhibit Hair Growth. Cell Stem Cell 2019, 24, 654–669.e6. [Google Scholar] [CrossRef] [PubMed]
- Trueb, R.; Henry, J.; Davis, M.; Schwartz, J. Scalp Condition Impacts Hair Growth and Retention via Oxidative Stress. Int. J. Trichol. 2018, 10, 262–270. [Google Scholar] [CrossRef] [PubMed]
- Battistella, C.; McCallum, N.C.; Gnanasekaran, K.; Zhou, X.; Caponetti, V.; Montalti, M.; Gianneschi, N.C. Mimicking Natural Human Hair Pigmentation with Synthetic Melanin. ACS Cent. Sci. 2020, 6, 1179–1188. [Google Scholar] [CrossRef]
- Xiao, Y.; Gao, C.; Wu, J.; Li, J.; Wang, L.; You, Y.; Peng, T.; Zhang, K.; Cao, M.; Hong, J. Periplaneta americana extract alleviates steatohepatitis in a mouse model by modulating HMGB1-mediated inflammatory response. Front. Pharmacol. 2022, 13, 995523. [Google Scholar] [CrossRef]
- Fu, S.; Chen, J.; Zhang, C.; Shi, J.; Nie, X.; Hu, Y.; Fu, C.; Li, X.; Zhang, J. Gastroprotective Effects of Periplaneta americana L. Extract Against Ethanol-Induced Gastric Ulcer in Mice by Suppressing Apoptosis-Related Pathways. Front. Pharmacol. 2021, 12, 798421. [Google Scholar] [CrossRef]
- Liu, W.; Li, K.; Wang, G.; Yang, L.; Qu, Q.; Fan, Z.; Sun, Y.; Huang, J.; Miao, Y.; Hu, Z. Impairment of autophagy may be associated with follicular miniaturization in androgenetic alopecia by inducing premature catagen. J. Dermatol. 2021, 48, 289–300. [Google Scholar] [CrossRef]
- Gentile, P.; Garcovich, S. Systematic Review of Platelet-Rich Plasma Use in Androgenetic Alopecia Compared with Minoxidil, Finasteride, and Adult Stem Cell-Based Therapy. Int. J. Mol. Sci. 2020, 21, 2702. [Google Scholar] [CrossRef]
- Huang, P.; Yan, R.; Zhang, X.; Wang, L.; Ke, X.; Qu, Y. Activating Wnt/β-catenin signaling pathway for disease therapy: Challenges and opportunities. Pharmacol. Ther. 2019, 196, 79–90. [Google Scholar] [CrossRef]
- Li, K.; Sun, Y.; Liu, S.; Zhou, Y.; Qu, Q.; Wang, G.; Wang, J.; Chen, R.; Fan, Z.; Liu, B.; et al. The AR/miR-221/IGF-1 pathway mediates the pathogenesis of androgenetic alopecia. Int. J. Biol. Sci. 2023, 19, 3307–3323. [Google Scholar] [CrossRef]
- Ji, C.; Ma, J.; Feng, C.; Zhu, H.; Gao, Y.; Huang, J.; Shen, H.; Wei, Y. Promotion of Hair Regrowth in Androgenetic Alopecia with Supplemented Erzhi Wan: Exploring Its Mechanism Using Network Pharmacology and Molecular Docking. Clin. Cosmet. Investig. Dermatol. 2023, 16, 2995–3022. [Google Scholar] [CrossRef]
- Bin, P.; Huang, R.; Zhou, X. Oxidation Resistance of the Sulfur Amino Acids: Methionine and Cysteine. Biomed. Res. Int. 2017, 2017, 9584932. [Google Scholar] [CrossRef] [PubMed]
- Patra, K.C.; Hay, N. The pentose phosphate pathway and cancer. Trends Biochem. Sci. 2014, 39, 347–354. [Google Scholar] [CrossRef] [PubMed]
- TeSlaa, T.; Ralser, M.; Fan, J.; Rabinowitz, J.D. The pentose phosphate pathway in health and disease. Nat. Metab. 2023, 5, 1275–1289. [Google Scholar] [CrossRef] [PubMed]
- Liu, Y.; Guerrero-Juarez, C.F.; Xiao, F.; Shettigar, N.U.; Ramos, R.; Kuan, C.-H.; Lin, Y.-C.; Lomeli, L.d.J.M.; Park, J.M.; Oh, J.W.; et al. Hedgehog signaling eprograms hair follicle niche fibroblasts to a hyper-activated state. Dev. Cell 2022, 57, 1758–1775.e7. [Google Scholar] [CrossRef]
- Brinkac, L.; Clarke, T.H.; Singh, H.; Greco, C.; Gomez, A.; Torralba, M.G.; Frank, B.; Nelson, K.E. Spatial and Environmental Variation of the Human Hair Microbiota. Sci. Rep. 2018, 8, 9017. [Google Scholar] [CrossRef]
- Pinto, D.; Sorbellini, E.; Marzani, B.; Rucco, M.; Giuliani, G.; Rinaldi, F. Scalp bacterial shift in Alopecia areata. PLoS ONE 2019, 14, e215206. [Google Scholar] [CrossRef]
- Hayashi, A.; Mikami, Y.; Miyamoto, K.; Kamada, N.; Sato, T.; Mizuno, S.; Naganuma, M.; Teratani, T.; Aoki, R.; Fukuda, S.; et al. Intestinal Dysbiosis and Biotin Deprivation Induce Alopecia through Overgrowth of Lactobacillus murinus in Mice. Cell Rep. 2017, 20, 1513–1524. [Google Scholar] [CrossRef]
- Suzuki, K.; Inoue, M.; Cho, O.; Mizutani, R.; Shimizu, Y.; Nagahama, T.; Sugita, T. Scalp Microbiome and Sebum Composition in Japanese Male Individuals with and without Androgenetic Alopecia. Microorganisms 2021, 9, 2132. [Google Scholar] [CrossRef]
- Yang, Y.; Zhao, Y.L.; Zou, Y.J.; Lu, C.Y.; Li, N.; Shi, Z.Y.; Li, X.; Lai, X.X. Ultra-sensitive pH-responsive hydrogels with injectable and self-healing performance for controlled drug delivery. Int. J. Pharm. X 2025, 9, 100334. [Google Scholar] [CrossRef]
- Li, X.; Ouyang, Z.; Hetjens, L.; Ni, M.; Lin, K.; Hu, Y.; Shi, X.; Pich, A. Functional Dendrimer Nanogels for DNA Delivery and Gene Therapy of Tumors. Angew. Chem. Int. Ed. 2025, 64, e202505669. [Google Scholar] [CrossRef]

 and
and  indicate terminal hair follicles;
  indicates vellus hair follicles. One-way analysis of variance (ANOVA) was performed. *** p < 0.001 vs. blank group; # p < 0.05, ### p < 0.001 vs. model group. Scale bars: 500 μm and 50 μm.
and indicate terminal hair follicles; indicates vellus hair follicles. One-way analysis of variance (ANOVA) was performed. *** p < 0.001 vs. blank group; # p < 0.05, ### p < 0.001 vs. model group. Scale bars: 500 μm and 50 μm.
indicates vellus hair follicles. One-way analysis of variance (ANOVA) was performed. *** p < 0.001 vs. blank group; # p < 0.05, ### p < 0.001 vs. model group. Scale bars: 500 μm and 50 μm.
and indicate terminal hair follicles; indicates vellus hair follicles. One-way analysis of variance (ANOVA) was performed. *** p < 0.001 vs. blank group; # p < 0.05, ### p < 0.001 vs. model group. Scale bars: 500 μm and 50 μm.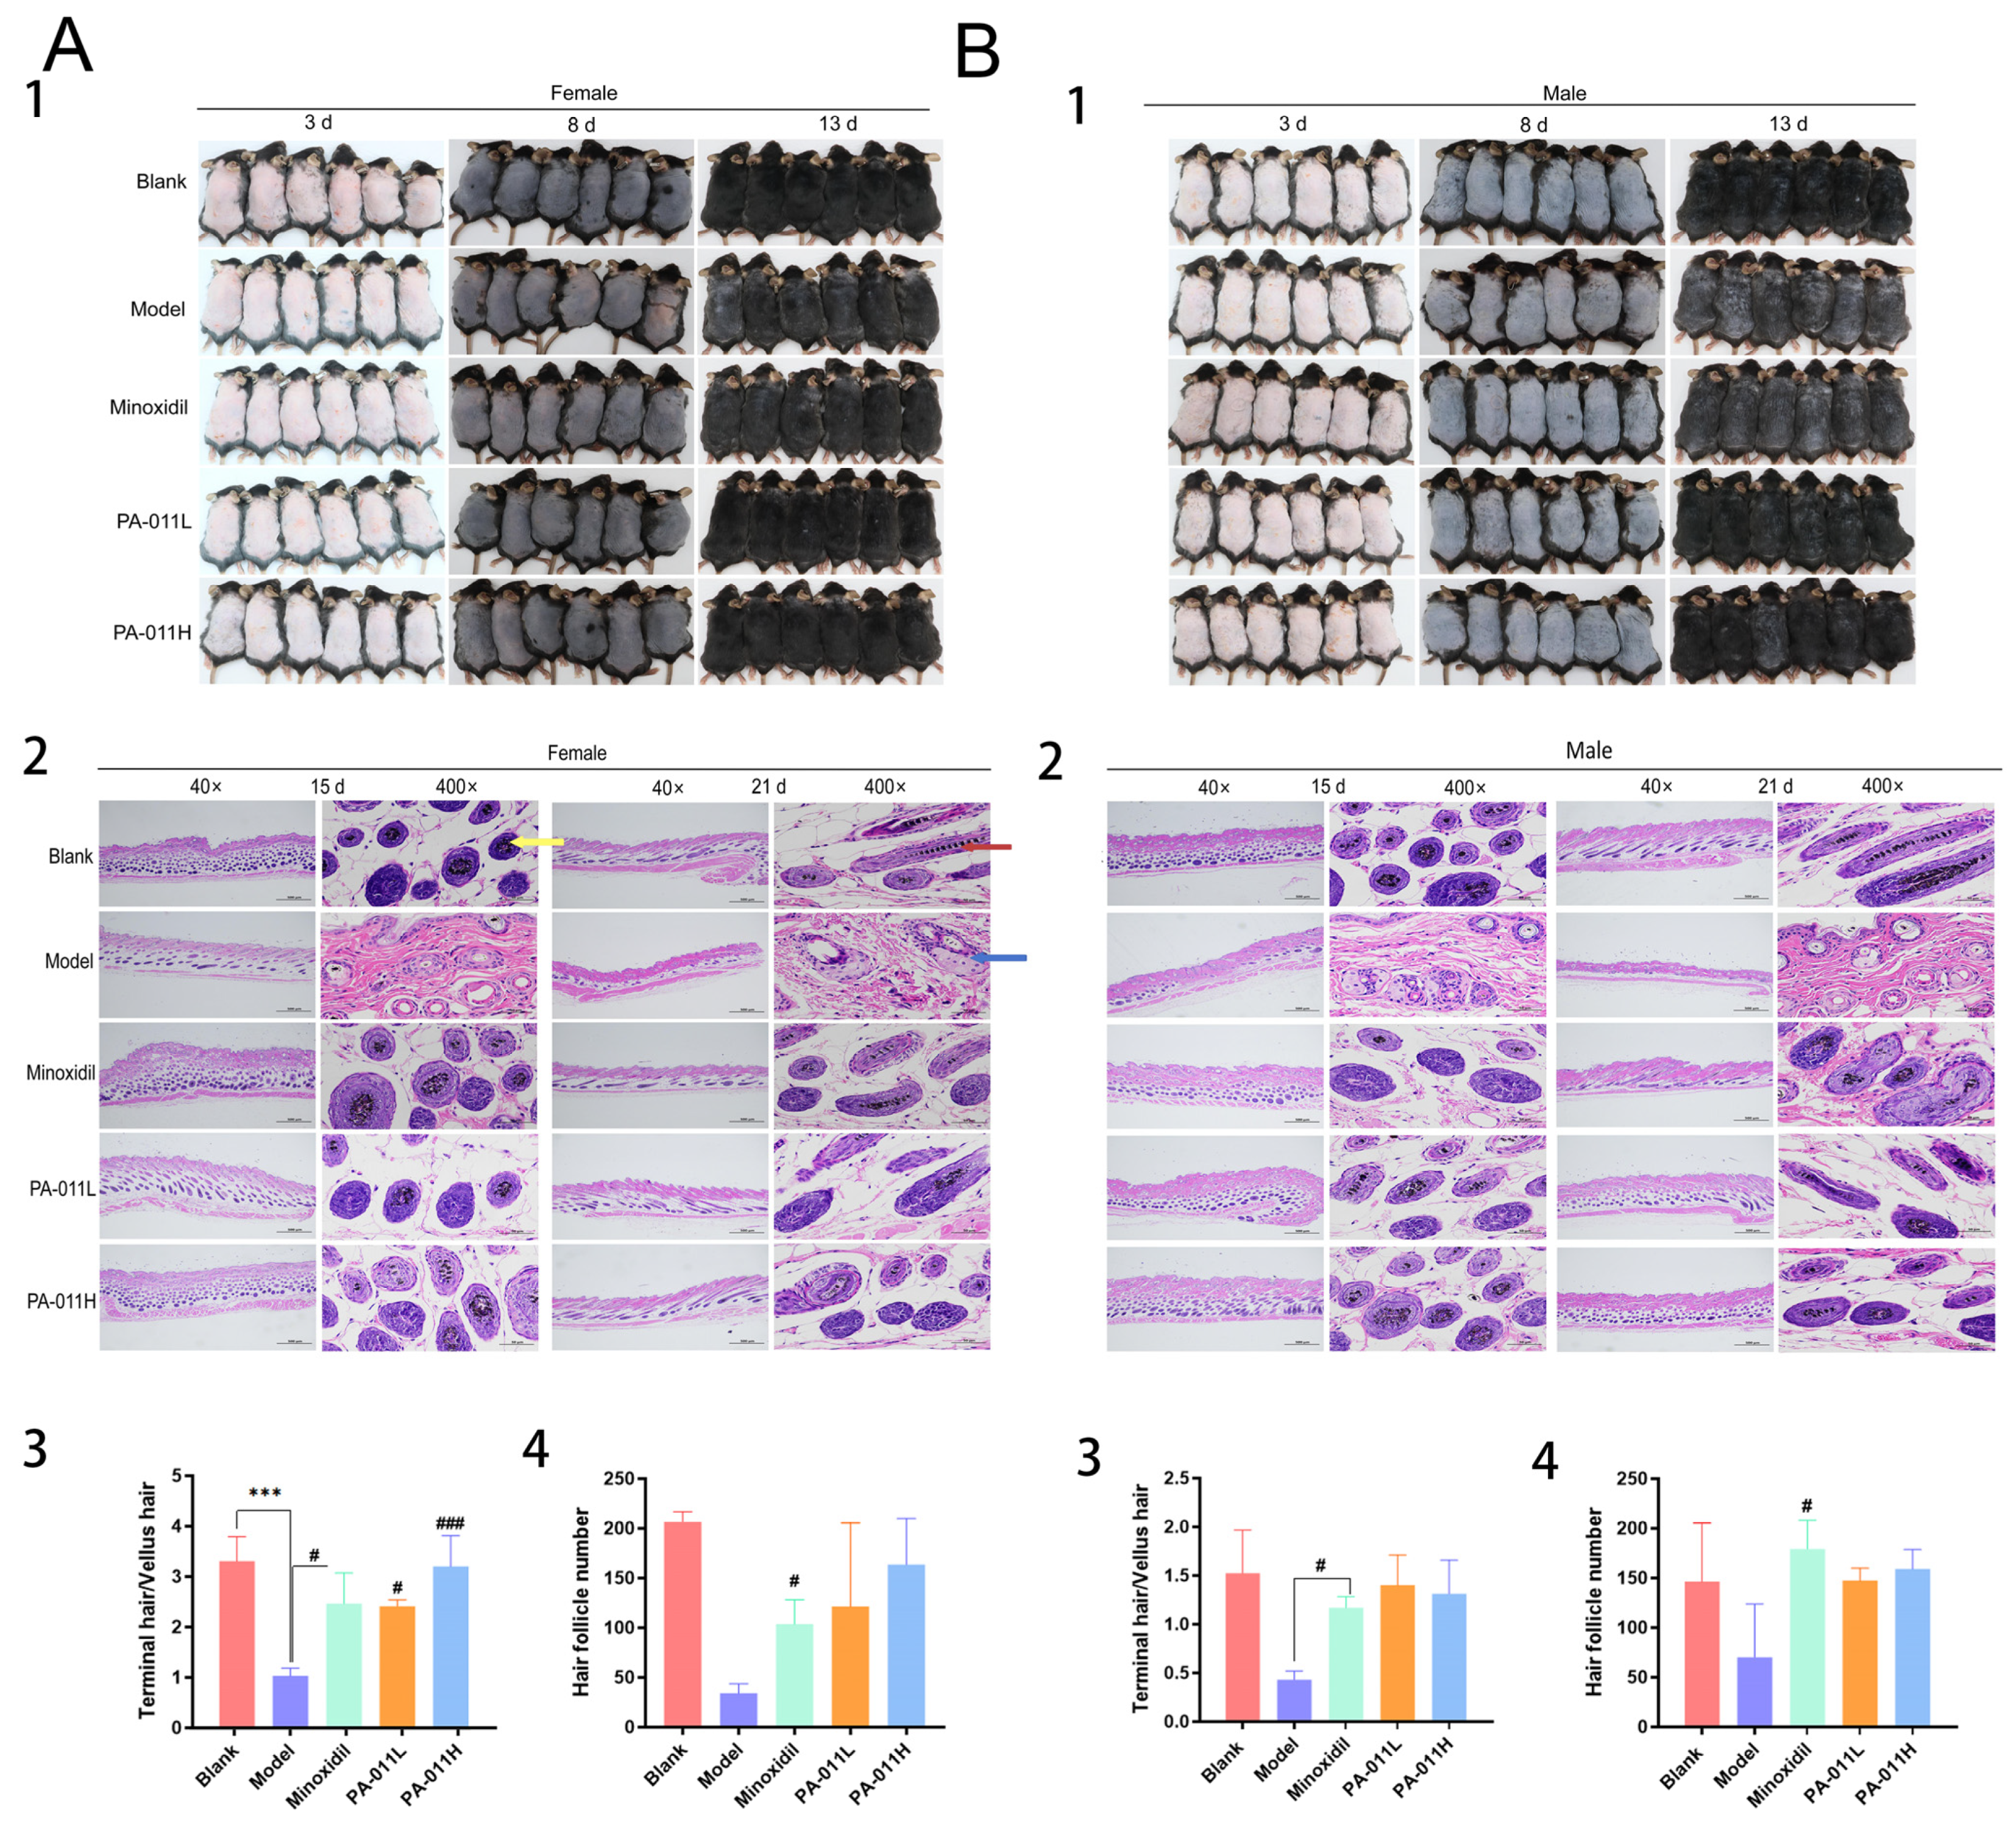


| Mode | Time (min) | Mobile Phases |
|---|---|---|
| Pos | 0~1 | 2% B2 |
| 1~9 | 2~50% B2 | |
| 9~12 | 50~98% B2 | |
| 12~13.5 | 98% B2 | |
| 13.5~14 | 98~2% B2 | |
| 14~20 | 2% B2 | |
| Neg | 0~1 | 2% B3 |
| 1~9 | 2~50% B3 | |
| 9~12 | 50~98% B3 | |
| 12~13.5 | 98% B3 | |
| 13.5~14 | 98~2% B3 | |
| 14~17 | 2% B3 |
| Time (min) | Mobile Phases |
|---|---|
| 0~7 | 8% B |
| 7~55 | 12% B |
| 55~56 | 30% B |
| 65~66 | 40% B |
| 66~80 | 95% B |
| 80 | 95% B |
| Name | Primer Sequence (5′-3′) | |
|---|---|---|
| Gapdh | Forward | CCTCGTCCCGTAGACAAAATG |
| Reverse | TGAGGTCAATGAAGGGGTCGT | |
| β-catenin | Forward | GGACCCCAAGCCTTAGTAAACA |
| Reverse | TTATATCATCGGAACCCAGAAGC | |
| Wnt3a | Forward | ATCTGGTGGTCCTTGGCTGTG |
| Reverse | ACTCCTGGATGCCCGCTTT | |
| Akt | Forward | CTTCCTCCTCAAGAACGATGGC |
| Reverse | TGTCTTCATCAGCTGGCATTGT |
| Number | Name | ID | Molecular Formula | Structures |
|---|---|---|---|---|
| 1 | (R)-Methysticin | PA3 | C15H14O5 |  |
| 2 | (S)-N-Methylcoclaurine | PA5 | C18H21NO3 |  |
| 3 | 3-Hydroxyflavone | PA23 | C15H10O3 |  |
| 4 | 3-Methylindole | PA28 | C9H9N |  |
| 5 | 4-Methylcatechol | PA38 | C7H8O2 |  |
| 6 | 5,7-Dihydroxyflavone | PA39 | C15H10O4 |  |
| 7 | 6-Hydroxymelatonin | PA42 | C13H16N2O3 | 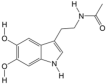 |
| 8 | 13S-hydroxyoctadecadienoic acid | PA48 | C18H32O3 | 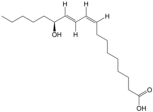 |
| 9 | 17a-Estradiol | PA49 | C18H24O2 |  |
| 10 | Acetylcholine | PA50 | C7H16NO2 |  |
| 11 | all-trans-Retinoic acid | PA51 | C20H28O2 | 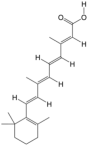 |
| 12 | Alpha-Linolenic acid | PA52 | C18H30O2 | 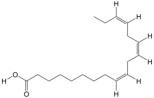 |
| 13 | Caffeate | PA59 | C9H8O4 | 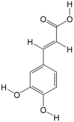 |
| 14 | Dehydroepiandrosterone | PA66 | C19H28O2 |  |
| 15 | Dodecanedioic acid | PA72 | C12H22O4 | 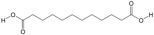 |
| 16 | Misoprostol | PA106 | C22H38O5 | 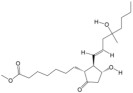 |
| 17 | Pipecolic acid | PA131 | C6H11NO2 |  |
| 18 | Propylparaben | PA132 | C10H12O3 |  |
| 19 | Sotalol | PA142 | C12H20N2O3S |  |
| 20 | Stearidonic acid | PA143 | C18H28O2 | 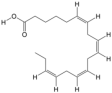 |
| Number | Peptide | ID | Charge |
|---|---|---|---|
| 1 | GGGAGGGAGGFGGGAGGGYR | peptide18 | 1 |
| 2 | AAKAAHFAAYGAA | peptide24 | 1.5 |
| 3 | FYGVVRAP | peptide70 | 1 |
| 4 | FGGANR | peptide81 | 1 |
| 5 | YAPR | peptide86 | 2 |
| 6 | FGGGGAGGFGGGAGGR | peptide97 | 1 |
| 7 | PFFPGLVK | peptide100 | 1 |
| 8 | YPYAPR | peptide109 | 2 |
| 9 | AAKAAHF | peptide125 | 1.5 |
| 10 | GYHVR | peptide126 | 1.5 |
Disclaimer/Publisher’s Note: The statements, opinions and data contained in all publications are solely those of the individual author(s) and contributor(s) and not of MDPI and/or the editor(s). MDPI and/or the editor(s) disclaim responsibility for any injury to people or property resulting from any ideas, methods, instructions or products referred to in the content. |
© 2025 by the authors. Licensee MDPI, Basel, Switzerland. This article is an open access article distributed under the terms and conditions of the Creative Commons Attribution (CC BY) license (https://creativecommons.org/licenses/by/4.0/).
Share and Cite
Guan, T.; Yang, X.; Hong, C.; Xiao, P.; Yang, Y.; Zhang, C.; He, Z. Exploring the Efficacy and Potential Mechanisms of Topical Periplaneta americana (L.) Extract in Treating Androgenetic Alopecia in a Mouse Model: A Systems Pharmacology and Skin Microbiome Analysis. Biology 2025, 14, 831. https://doi.org/10.3390/biology14070831
Guan T, Yang X, Hong C, Xiao P, Yang Y, Zhang C, He Z. Exploring the Efficacy and Potential Mechanisms of Topical Periplaneta americana (L.) Extract in Treating Androgenetic Alopecia in a Mouse Model: A Systems Pharmacology and Skin Microbiome Analysis. Biology. 2025; 14(7):831. https://doi.org/10.3390/biology14070831
Chicago/Turabian StyleGuan, Tangfei, Xin Yang, Canhui Hong, Peiyun Xiao, Yongshou Yang, Chenggui Zhang, and Zhengchun He. 2025. "Exploring the Efficacy and Potential Mechanisms of Topical Periplaneta americana (L.) Extract in Treating Androgenetic Alopecia in a Mouse Model: A Systems Pharmacology and Skin Microbiome Analysis" Biology 14, no. 7: 831. https://doi.org/10.3390/biology14070831
APA StyleGuan, T., Yang, X., Hong, C., Xiao, P., Yang, Y., Zhang, C., & He, Z. (2025). Exploring the Efficacy and Potential Mechanisms of Topical Periplaneta americana (L.) Extract in Treating Androgenetic Alopecia in a Mouse Model: A Systems Pharmacology and Skin Microbiome Analysis. Biology, 14(7), 831. https://doi.org/10.3390/biology14070831