Simple Summary
Cold stress is a major environmental factor adversely affecting seed germination in sweet corn, resulting in reduced germination rates and yield. Sweet corn is more susceptible to cold stress than other crops, especially during germination. This study aims to identify single nucleotide polymorphisms (SNPs) and candidate genes linked to cold tolerance during germination. We evaluated phenotypic traits associated with cold germination and conducted a genome-wide association analysis (GWAS). A total of nine SNPs were found to be significantly associated with cold germination. Fourteen candidate genes related to cold germination were identified within the confidence interval. These findings provide valuable theoretical and practical insights for understanding the genetic basis of germination traits and for breeding cold-tolerant sweet corn varieties.
Abstract
Sweet corn is highly susceptible to low temperatures, especially during seed germination, which severely affects plant growth and crop yield. This study used 100 sweet corn micro-core germplasms to evaluate two key germination traits under cold stress: seed storage material utilization efficiency (SRUE) and mobilization weight (WMSR). To investigate the genetic basis of cold germination in sweet corn, we selected the BLINK model for GWAS due to its ability to minimize false positives. A total of nine SNPs were found to be significantly associated with cold germination. These SNPs explained between 9.8% and 17.2% of the phenotypic variance (PVE). Within the confidence interval, 63 functionally annotated genes were identified. Fourteen candidate genes associated with cold germination were identified through GO functional analysis and the functional expression of homologous genes. A literature analysis indicated that these genes are primarily involved in seed germination, cold tolerance, and responses to other abiotic stresses. These findings enhance our understanding of the genetic and molecular mechanisms underlying cold germination, establishing a theoretical foundation for breeding cold-tolerant sweet corn varieties.
1. Introduction
Sweet corn is highly valued by consumers for its unique flavor and nutritional profile [1]. In recent years, the increasing frequency of extreme weather events because of global climate change has severely threatened sweet corn production. Compared to field corn, sweet corn exhibits significantly higher sensitivity to low temperatures [2,3]. According to statistics, global sweet corn production is reduced by 8–12% annually due to early spring low temperatures, resulting in direct economic losses of about USD 500 million [4,5]. In northern China, soil temperatures during the sowing period often drop below 15 °C. This cold stress significantly impairs the germination rate of sweet corn, disrupts proper seedling establishment, and, ultimately, leads to reduced crop yields [6,7,8]. Therefore, enhancing seed vigor and germination rates is crucial for ensuring successful seedling establishment and subsequent growth in sweet corn.
Low-temperature stress includes cold stress (15 °C) and freezing stress (<0 °C) [2]. Seed germination is a complex process that involves various metabolic reactions and signaling transduction pathways [9]. Cold stress induces physiological and biochemical alterations, including membrane rigidification, reactive oxygen species accumulation, protein denaturation, salicylic acid metabolism, and antioxidant enzyme activities [10]. Additionally, cold stress can adversely affect photosynthetic mechanisms and disrupt normal plant metabolism [11]. Although seed pretreatment with chemicals, such as salicylic acid, melatonin, and chitosan, can mitigate low-temperature damage to maize seed germination, it also significantly increases seed costs [12,13]. Therefore, genetic improvement represents a potentially effective strategy to enhance cold tolerance in sweet corn without additional costs.
The rapid development of high-throughput sequencing technologies has greatly improved the ability of genome-wide association studies (GWAS) to elucidate the genetic basis of quantitative traits and identify loci underlying complex traits [14]. Compared to traditional linkage analysis, GWAS demonstrates significant advantages in the breadth of study subjects, mapping accuracy, analytical throughput, cost efficiency, and result reliability [15]. Through association mapping, researchers have successfully identified multiple quantitative trait loci (QTLs) and candidate genes associated with cold germination in major crops, including rice [16], wheat [17], and maize [18,19]. Wang et al. [20] performed a GWAS on 295 rice germplasm lines under cold stress, identifying 67 QTLs linked to seedling cold tolerance. Through association analysis, four SNPs and 12 QTLs associated with cold tolerance were identified in maize seedlings, along with the discovery of a cold tolerance gene [21]. Wu et al. [2] identified 16 loci linked to cold tolerance in sweet corn through association mapping, along with six candidate genes associated with cold tolerance. The association mapping revealed 15 SNPs and four cold tolerance genes associated with seed germination under cold stress [7]. Zhao et al. [22] identified 76 SNP markers and 85 candidate genes linked to cold tolerance in wheat seedlings.
Despite identifying several QTLs and genes associated with cold germination in maize, studies focusing on sweet corn are still scarce, and the genetic mechanisms behind this trait remain unclear. This study used 100 sweet corn micro-core germplasms (inbred lines) as the association panel to evaluate two key germination traits under cold stress and conducted GWAS using the BLINK model. The objective of our research was to identify candidate genes associated with cold tolerance in sweet corn. These findings enhance our understanding of the genetic basis underlying cold germination in sweet corn, providing a solid theoretical foundation for the development of cold tolerance varieties.
2. Materials and Methods
2.1. Plant Materials and Phenotype Collection
In this study, 100 micro-core germplasms (inbred lines) from the Engineering Technology Institute of Maize Breeding in Anhui Province (Chuzhou Fengyang, China) were selected as experimental materials. These germplasms were collected from breeding programs in southeastern China and include tropical, subtropical, and temperate materials [23]. They have different genetic backgrounds and exhibit significant genetic variation in phenotypic traits related to tolerance to abiotic stress. Detailed information on the sources of these materials is provided in Supplementary Table S1. Before conducting the germination test, seed moisture content (MC) was calculated using the weight difference method. The dry seed weight was recorded as the initial seed weight (ISW). After weighing, the seeds were disinfected with 5% sodium hypochlorite for 10 min and rinsed four times with sterile water for the germination test. The seeds were evenly placed on the germination paper and germinated in the dark for 7 days under cold conditions at 15 °C (60% relative humidity) [24]. The moisture of the germination paper was maintained by regularly using distilled water. The experiment was performed with three biological replicates, each consisting of 50 healthy sweet corn seeds. After 7 days of germination, the seedlings and seeds were separated and dried in an oven at 105 ± 1 °C until a constant weight was achieved. The sample weights were recorded separately as seedling dry weight (SDW; g/seed) and residual seed dry weight (RSDW). The initial seed dry weight (ISDW), the weight of the mobilized seed reserve (WMSR; g/seed), and seed reserve utilization efficiency (SRUE; g/g) were calculated as follows [25]:
ISDW = ISW × (1 − MC);
WMSR = ISDW − RSDW;
SRUE = SDW/WMSR.
2.2. Phenotype Assessment and Processing
The phenotypic data for SRUE and WMSR were processed using Microsoft Excel 2019. Descriptive statistics, such as the range, average, standard deviation (SD), and coefficient of variation (CV), were calculated using IBM SPSS Statistics 24.0. The correlation coefficient was calculated, and the frequency distribution was visualized using the ggplot2 package. Heritability was calculated using the formula h2 = σ2g/(σ2g + σ2e/n), where σ2g and σ2e represent the genetic variance and residual variance, respectively, and n indicates the number of experimental replicates [26].
2.3. Genome-Wide Association Study
The present study was primarily based on previous research on population structure and included the following analyses [27]. During the genotype data quality control process, we excluded low-quality SNP markers with a missing rate > 20% and a minor allele frequency (MAF) < 0.05. A total of 36,747 high-quality SNPs were retained for subsequent association analysis. To account for population structure and kinship, the BLINK model was employed as the most appropriate approach for GWAS. Principal Component Analysis (PCA) and the kinship matrix (K) were included as covariates to control for false positives and false negatives. The genome-wide significance threshold for SNP identification was set at −log10(P) > 3.6 (p < 1.8 × 10⁻⁴) based on Bonferroni correction. Significant correlations were evaluated using Q-Q plots and Manhattan plots. The LD decay of the population was calculated using PopLDdecay 3.42 software with a decay distance of 200 kb [23].
2.4. Functional Annotation of Candidate Genes
The 200 kb upstream and downstream regions were used to identify candidate genes [28]. Genetic loci and gene annotation information were obtained from the B73 RefGen_v3 reference genome in the MaizeGDB database (https://maizegdb.org/; accessed on 4 December 2024). Functional annotation and collection of biological information for candidate genes were conducted using both the UniProt (http://www.uniprot.org/; accessed on 7 December 2024) and NCBI databases (http://www.ncbi.nlm.nih.gov/; accessed on 7 December 2024). GO and KEGG enrichment analyses of candidate genes were conducted using the OmicShare cloud platform (https://www.omicshare.com/; accessed on 15 December 2024) [29]. Gene expression data at different developmental stages of maize were obtained from the Maize GDB database. To minimize the noise interference from lowly expressed genes, FPKM ≥ 1 was used as the threshold for selecting candidate genes [30]. Gene expression levels were normalized using log2 (FPKM+1) [31]. Heatmaps were employed to assess the differential expression of candidate genes across various tissues and developmental stages. Protein–protein interaction networks for the candidate genes were analyzed using the STRING v12.0 data analysis platform (https://cn.string-db.org/; accessed on 18 December 2024), and the network was visualized using Cytoscape v3.10.2 software [32].
2.5. Linkage Disequilibrium and Allele Effect Analysis
Genotype data covering 200 kb flanking regions of significant SNPs were extracted for haplotype analysis. An r2 ≥ 0.8 threshold was used to define LD blocks, ensuring a high degree of linkage disequilibrium among the SNPs within the blocks [33]. The linkage disequilibrium heatmap was visualized using the R package LDheatmap (version 1.0-6). The allelic effects of significant SNPs were evaluated by integrating corresponding phenotypic and genotypic datasets, and the results were visualized using the ggplot2 package.
3. Results
3.1. Phenotypic Descriptions of Cold Germination in Sweet Corn
To elucidate the phenotypic variation characteristics of cold-germination-related traits in sweet corn, we conducted descriptive statistics and genetic parameter assessments for two germination traits. For the SRUE trait, the range of variation was 0.10 to 0.47 g/g, with a mean of 0.27 g/g, a standard deviation of 0.084, and a coefficient of variation of 31.11% (Table 1). For the WMSR trait, the phenotypic variation varied from 0.009 to 0.092 g/seed, with a mean of 0.041 and a coefficient of variation of 37.50%. Both SRUE and WMSR showed a normal distribution trend (Figure 1). Notably, the cold-tolerant line YNY9-4 exhibited the highest SRUE value (0.470), while the cold-sensitive line JT2 (M) showed the lowest (0.100). In WMSR, the extreme pair consisting of lines HT060 (0.092) and T9357 (0.009) exhibits a significant phenotypic difference (Supplementary Table S1). These differences indicate that cold stress has a varying impact on seed germination across different lines. The correlation coefficient between these two traits was low. Both traits exhibited high heritability (h2 > 90%) and significant coefficients of variation (CV > 30%), indicating abundant phenotypic variation within the study population. This variation was mainly controlled by genetic factors, indicating potential for genetic improvement and making the population suitable for further association analysis and breeding selection.

Table 1.
Phenotypic performance of cold germination in sweet corn.
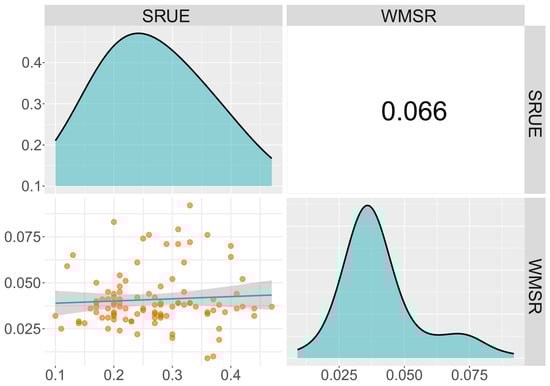
Figure 1.
The phenotypic frequency distribution and the correlation between the two germination traits. SRUE: seed reserve utilization efficiency (g/g); WMSR: weight of mobilized seed reserve (g/seed). The phenotypic frequency distributions of each trait are shown above the diagonal. The scatter plots and correlation coefficients between traits are illustrated in the regions below and above the diagonal. The blue line in the scatter plots represents the correlation trend.
3.2. Genome-Wide Association Analysis
The BLINK model was used to identify genetic loci associated with cold germination traits in sweet corn. Comprehensive genome-wide association analysis was performed based on Bonferroni correction, using a threshold of p < 1.8 × 10⁻⁴ (−log10P > 3.6), to evaluate the two germination traits, SRUE and WMSR (Supplementary Table S2). GWAS identified nine SNPs associated with cold germination located on chromosomes 1, 4, 7, 8, and 10 (Figure 2). Specifically, five SNPs were significantly associated with SRUE, explaining 11.3% to 15.1% of the phenotypic variation (Figure 2a,b). Among them, Affx-90948621 showed the strongest correlation with SRUE, with a p-value of 2.57 × 10⁻⁶, located on chromosome 8 and explaining 12.3% of the phenotypic variation. Four SNPs showed significant WMSR associations, accounting for 9.8–17.2% of phenotypic variation (Figure 2c,d). The most significantly associated SNP for WMSR was Affx-91309206, with a p-value of 5.32 × 10⁻⁶. This locus was located on chromosome 10 and explained 15.2% of the phenotypic variation. The PVE values of these SNPs ranged from 9.8% to 17.2%. The results indicate that the cold germination trait in sweet corn was regulated by multiple genetic loci, suggesting the complexity of its genetic basis. This provides important genetic information for future molecular-marker-assisted selection and cold tolerance improvement.
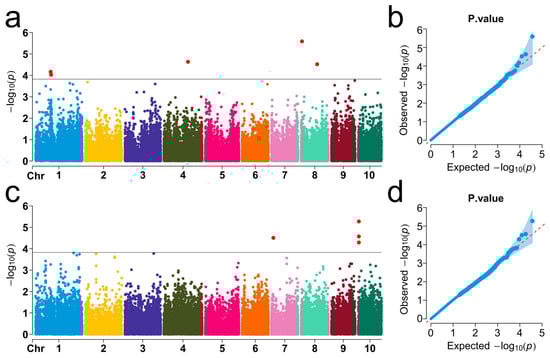
Figure 2.
Manhattan plots (left) and Q-Q plots (right) display significant SNPs associated with SRUE and WMSR. (a,b) The Manhattan plot and the Q-Q plot for SRUE, respectively. (c,d) The Manhattan plot and the Q-Q plot for WMSR, respectively. In the Manhattan plots, the X-axis indicates chromosomal positions, while the Y-axis indicates the −log10 (p-values) for each marker. The black horizontal line indicates the genome-wide significance threshold. Red dots indicate significant SNPs exceeding the threshold. In the Q-Q plots, the red diagonal line corresponds to the expected theoretical distribution.
3.3. Candidate Gene Analysis
The association analysis identified nine SNPs linked to cold germination in sweet corn, with 207 candidate genes located within the SNP confidence intervals. Among these, 63 genes had functional annotations (Supplementary Table S3). To further elucidate the functions of these genes, we conducted GO and KEGG pathway enrichment analyses. The results indicated that these genes were significantly enriched in GO terms related to stimulus response, stress response, binding, defense response, and protein binding (Figure 3, Supplementary Table S4). Additionally, they were notably enriched in pathways, including phenylpropanoid biosynthesis, endocytosis, SNARE interactions in vesicular transport, and phagosome (Figure 3). These findings suggest that these genes hold significant potential for further investigation and exploration. In particular, the genes enriched in stimulus response, stress response, and defense response may include candidate genes related to cold tolerance.
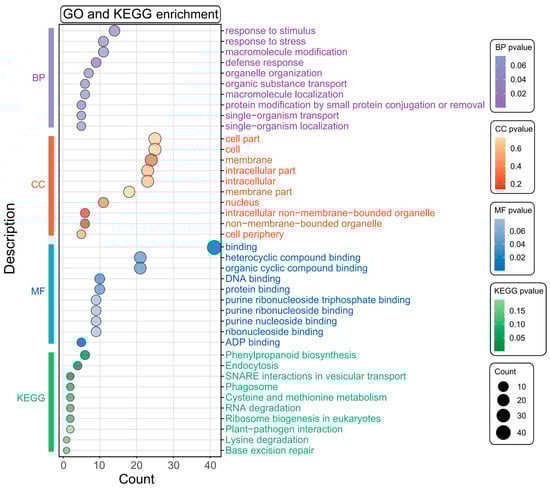
Figure 3.
The GO and KEGG enrichment analysis of candidate genes. The vertical bar on the left shows significantly enriched GO terms (BP: biological process; CC: cellular component; MF: molecular function) and KEGG pathways. The X-axis represents the number of genes, and the Y-axis represents the enriched terms. The size of the points and the color scale represent the number of enriched genes and the level of enrichment significance, respectively.
Based on functional expression profiles and GO functional analysis, we identified 14 candidate genes crucial for cold germination, along with their corresponding orthologs in Arabidopsis and rice (Table 2, Supplementary Table S3). Among them, seven genes with orthologs linked to seed germination in Arabidopsis were identified: GRMZM2G394528 (putative methyltransferase), AC226248.1_FG002 (putative receptor-like protein kinase), GRMZM2G010348 (cytochrome c), GRMZM2G077937 (disease resistance protein RPM1), GRMZM2G095164 (rapid alkalinization factor 1), GRMZM2G473138 (N-methyltransferase ATXR7), and GRMZM5G898755 (lipid transfer protein 1). Five genes were associated with cold stress response: GRMZM2G095114 (Sm-like protein 4), GRMZM2G303337 (sucrose phosphate synthase), GRMZM2G101928 (zinc-induced facilitator-like 1), GRMZM2G387760 (Sec1/munc18-like (SM) protein), and GRMZM2G021416 (serine/threonine-protein kinase). Additionally, GRMZM2G146004 (senescence-associated gene 21) and GRMZM2G304965 (pentatricopeptide repeat-containing protein) were involved in abiotic stress responses. Notably, the candidate gene GRMZM2G394528 identified at the Affx-91316634 locus is associated with seed germination. With a high phenotypic variation explained of 15.14%, this gene significantly impacts the phenotypic variation of cold germination traits. At the Affx-90243304 locus, two stress-related genes, GRMZM2G303337 and GRMZM2G304965, were identified. This locus explains 17.18% of the phenotypic variation, emphasizing the crucial role these genes play in influencing phenotypic differences under cold stress.
Table 2.
Candidate genes associated with cold germination and gene annotations.
To further investigate the expression characteristics of the candidate genes, we analyzed their dynamic expression patterns across various developmental stages using RNA-seq data. These genes exhibited significant variation in expression across different tissues (Figure 4, Supplementary Table S5). For example, the average expression levels of GRMZM2G304965 and GRMZM2G387760 were relatively low during the germination stage. In contrast, GRMZM2G095114, GRMZM2G095164, GRMZM2G146004, and GRMZM2G010348 exhibited significantly higher expression levels during germination. Notably, GRMZM2G010348 (cytochrome c) exhibits high expression across different plant tissues, and it enhances cold tolerance by regulating the levels of gibberellin and DELLA proteins in a synergistic manner [34]. GRMZM2G021416 encodes a serine/threonine protein kinase that is highly expressed in seedling leaves. Under cold induction, its transcriptional level is upregulated, enhancing plant cold tolerance by activating cold-responsive genes and regulating ROS homeostasis [35]. Additionally, the expression levels of GRMZM5G898755 and GRMZM2G021416 were generally low across different developmental stages, except in seedling-related tissues. GRMZM2G303337 has not detected gene expression data. These candidate genes play a critical role in seed germination, cold response, and the response to other abiotic stresses. These findings facilitate the investigation of cold-responsive mechanisms during the germination of sweet corn.
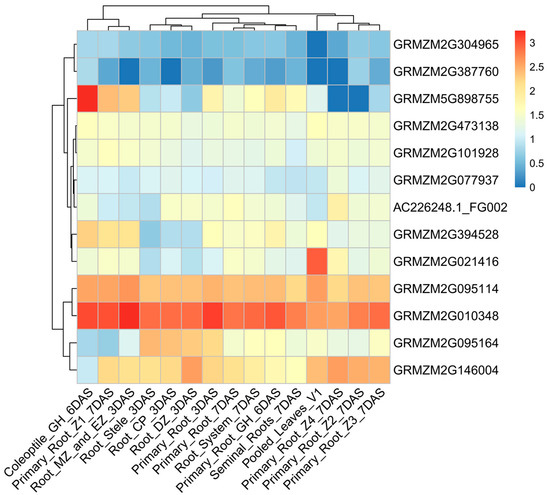
Figure 4.
Dynamic expression characteristics of candidate genes. The scale represents the relative expression level of the gene. The X-axis represents different developmental stages and tissues, while the Y-axis represents the candidate genes. The gradient from blue to red represents expression levels from low to high.
3.4. Construction of the Regulatory Network for Candidate Genes
The protein–protein interaction networks of the 14 candidate genes were constructed using the STRING database (https://cn.string-db.org/, accessed on 18 December 2024), with a moderate confidence threshold (interaction score > 0.4). Notably, 12 genes were identified through the control network and interacted with various functional proteins, forming a distinct cluster involved in regulating various biological networks (Figure 5, Table 2, Supplementary Table S6). In contrast, no significant interactions were detected for the proteins encoded by GRMZM2G394528 and GRMZM2G387760, with confidence scores below the threshold of 0.4. Among the genes involved in network interactions, GRMZM2G146004 (M3) serves as a hub node in the network, interacting with five proteins. This gene encodes a senescence-associated protein that cooperates with GST antioxidant enzymes to eliminate ROS, playing a protective role in stress responses [36]. GRMZM2G010348 (M6) was annotated as cytochrome c. It modulates the accumulation of DELLA proteins by interacting with GA, thereby influencing plant cold tolerance [37]. Also, it interacts with CYTc1 and CYTc1-1, participating in redox reactions. GRMZM2G473138 (M10) was annotated as N-methyltransferase ATXR7, which interacts with five proteins. Its interaction with HID1 is associated with the regulation of seed germination [38]. GRMZM2G021416 (M14) helps plants adapt to environmental stress by regulating stress responses and circadian rhythms [35]. Additionally, it interacts with APRR3 to regulate the circadian clock.
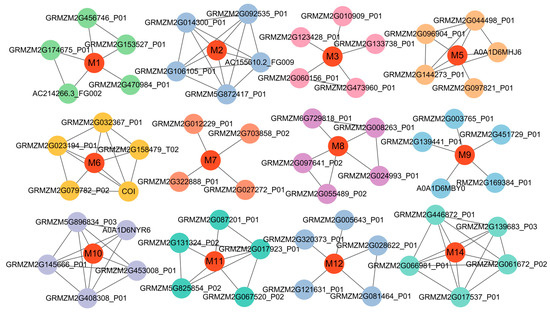
Figure 5.
The protein–protein interaction network among different candidate genes. The black lines represent the functional interactions between proteins. M1 to M14 represent the proteins encoded by the candidate genes. The circles represent proteins. Red nodes represent hub proteins with multiple interactions.
These findings indicated that cold-germination-related traits were regulated by DEELA, GA, HID1, and a range of complex regulatory factors.
3.5. Analysis of Linkage Disequilibrium and Allelic Variation Effects
To validate the reliability of the significant loci and investigate their genetic background, genotype data from the 200 kb upstream and downstream regions of the significant loci were extracted for linkage disequilibrium analysis. The results revealed that seven SNPs (Affx-90392808, Affx-90891906, Affx-90948621, Affx-91198795, Affx-115332496, Affx-90990901, and Affx-91309206) were located within a highly linked region (Figure 6a,c). The dominant alleles of SNPs within the linkage region were selected to evaluate the effects of these allelic variations. For SRUE, significant phenotypic differences were observed at the Affx-90891906, Affx-90392808, and Affx-91198795 loci (Figure 6b, Figure S1). Compared to the CC and AA alleles, the average SRUE increased by 0.06 to 0.07 g/g. For WMSR, the phenotypic differences between alleles were statistically significant (Figure 6d). When comparing the GG allele with the AA/TT alleles, the average increase in WMSR was recorded as 0.011 to 0.013 g/seed. Therefore, CC and GG can be considered superior alleles.
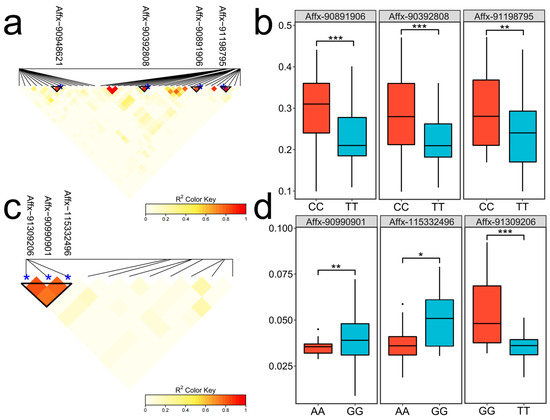
Figure 6.
Linkage disequilibrium heatmap and allele effects of SNPs. (a,c) Linkage disequilibrium heatmaps for SNPs associated with SRUE and WMSR, respectively. The triangular boxes indicate highly linked blocks. The blue dots indicate the positions of the SNPs. (b,d) The SNP allele effects of SRUE and WMSR, respectively; * p < 0.05; ** p < 0.01; *** p < 0.001.
4. Discussion
4.1. Identification of QTLs for Seed Germination Traits Under Cold Stress Using an Association Panel
Cold stress is a critical environmental factor impairing maize seed germination and seedling establishment [39]. Because of changes in climatic conditions, cold stress poses a threat to sweet corn production. To achieve better economic returns, farmers typically sow seeds in early spring. However, the low temperatures in early spring require seeds to have higher germination and emergence rates to adapt to this environment. Therefore, developing cold-resistant corn varieties and improving cold tolerance through gene modification is a crucial and feasible strategy.
With continuous updates and improvements to maize reference genome sequencing, GWAS has become an important research method for revealing the genetic basis of complex traits in maize [40]. Hu et al. [6] identified 17 genetic loci and 18 cold-tolerance-related genes during seed germination through GWAS. The association analysis identified thirty SNPs associated with seed germination tolerance under low-temperature conditions [41]. Through association mapping, Li et al. [42] identified 58 SNPs and discovered 36 candidate genes linked to seed germination. Additionally, GWAS revealed 14 SNPs associated with cold germination tolerance in maize [24]. This study identified nine SNPs significantly associated with cold germination across two germination traits, located on chromosomes 1, 4, 7, 8, and 10. The PVE values of these SNP loci all exceeded 5%, indicating a dominant effect on the target trait. To elucidate the genomic basis of cold germination in sweet corn, we performed comparative mapping between the loci identified herein and previously reported genomic regions. The Affx-90891906 and Affx-90392808 SNPs identified in this study fall within the qSRUE1 QTL interval reported by Cheng et al. [43], located between 94.1 and 103.8 Mb on chromosome 1. The Affx-91198795 locus on chromosome 8 was located 0.62 to 2.7 Mb away from the previously reported ss196425965, Affx-91281675, and Affx-90828720 [6,23]. Additionally, the Affx-115332496 locus on chromosome 7 was 1.9 Mb away from AX-86274990 reported by Wu et al. [2]. On chromosome 10, the distance between Affx-91309206 and SYN5516 was 2.8 Mb [41]. This study identified five genetic loci that overlap with regions reported in previous research, indicating that cold germination traits may be regulated by some conserved genetic factors (Figure 7). However, significant differences in the identified SNP loci were also observed. These differences may arise from variations in germplasm, environmental conditions, and the traits examined. Additionally, factors like false positive rates, resolution, and model selection in GWAS, along with stress conditions and sample size in experiments, may also contribute to these discrepancies [44,45]. Future research will explore these factors to clarify the functional roles of these loci and their interactions in the cold tolerance of sweet corn.
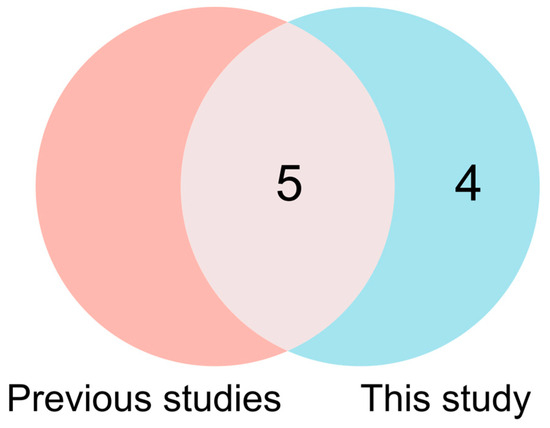
Figure 7.
Venn diagram showing the overlap of SNPs between previous studies and the current research. Red represents the results from previous studies, while blue indicates the results identified in this study.
The linkage disequilibrium analysis revealed that seven SNP loci were located within highly linked genomic regions. These linked SNPs showed significant differences in phenotypic performance. Specifically, individuals carrying the CC allele exhibited an increase of 0.06 to 0.07 g/g in SRUE compared to those with the AA allele. The GG allele significantly outperformed the AA and TT alleles in WMSR, with an increase of 0.011 to 0.013 g/seed. The results further suggest a possible association with the target traits. In the future, cold tolerance varieties can be developed by pyramidically accumulating superior alleles. These loci could contribute to understanding the biological mechanisms underlying cold germination.
4.2. Candidate Genes Involved in Cold Germination of Sweet Corn
In this study, 207 candidate genes were identified from nine SNPs, of which 63 had functional annotations. Functional expression analysis of these genes revealed that 14 genes were associated with cold germination, including 7 SRUE genes and 7 WMSR genes. For SRUE, GRMZM2G095114 was located at the Affx-90948621 locus and encodes Sm-like protein 4 (LSM4). LSM4 methylation significantly contributes to improving plant resilience under abiotic stress conditions [46]. The LSM2-8 complex helps plants regulate cold tolerance by precisely splicing the mRNA of key genes in response to cold stress [47]. The Affx-91198795 locus contains two candidate genes: AC226248.1_FG002 and GRMZM2G010348. AC226248.1_FG002 encodes a putative receptor-like protein kinase, which can phosphorylate the DEELA protein, regulating the stability and activity of the DELLA protein [48]. DELLA is a crucial negative regulator of GA signaling, primarily controlling seed germination by inhibiting GA signaling [49]. GA promotes seed germination by binding to its receptor GID1, which triggers the ubiquitination and degradation of DELLA proteins, thereby alleviating their inhibitory effect on plant growth [50,51]. Thus, it can be inferred that the AC226248.1_FG002 gene indirectly participates in GA signaling to regulate seed germination. Furthermore, the candidate gene GRMZM2G010348 was found to encode cytochrome c (CYTc). The absence of this gene delayed seedling growth and development, increased starch and glucose accumulation, reduced GA levels, and increased DELLA protein levels [34,37,52]. Low temperature induces the accumulation of DELLA proteins, which regulate plant growth and development, enabling plants to better cope with cold stress [53]. Therefore, it is suggested that this gene is involved in regulating cold stress tolerance.
For WMSR, the gene GRMZM2G303337 at the Affx-91309206 locus encodes sucrose phosphate synthase. This enzyme is primarily responsible for sucrose transport, and it is essential for sustaining and promoting the growth of seedlings and root apical meristems [54]. Under cold stress, overexpression of this gene modified sugar accumulation patterns, significantly increasing glucose and sucrose levels and reducing cellular damage [55,56]. These findings suggest that GRMZM2G403337 imparts cold tolerance through enhanced sugar accumulation and attenuated cellular damage. The gene GRMZM2G101928 at the Affx-90990901 locus was annotated as miR165a, which regulates ABA metabolism by inhibiting HD-ZIP III [57]. In stress responses, ABA is a key hormonal regulator under low-temperature conditions. Its accumulation can activate the expression of a series of cold-responsive genes, thus enhancing plant cold tolerance [58]. Additionally, overexpression of miR165a upregulates zinc/iron transporter genes, maintaining ion homeostasis and reducing oxidative damage under low temperatures [59]. The gene GRMZM2G021416 at the Affx-115332496 locus is homologous to OsWNK1 in rice. OsWNK1 exhibits differential expression under various abiotic stresses, with its transcript level significantly upregulated under cold stress [35]. This gene regulates endogenous rhythms and is essential for abiotic stress tolerance [60]. In summary, these candidate genes play a crucial role in seed germination, cold tolerance, and response to abiotic stresses.
5. Conclusions
In this study, nine SNPs were identified as significantly associated with cold germination. The confidence interval contained 207 candidate genes, 63 of which were functionally annotated. Fourteen candidate genes involved in cold germination were identified based on a literature analysis and functional characterization. These candidate genes are mainly involved in seed germination, cold tolerance, and responses to other abiotic stress. Because the functional prediction of candidate genes mainly relies on bioinformatics analysis and phenotypic traits are influenced by environmental factors, further evaluation in multi-environment trials is necessary. Future research will focus on the functional validation of candidate genes and the development of molecular markers for significant SNPs. This study advances our understanding of the genetic and molecular mechanisms underlying cold germination, establishing a theoretical foundation for breeding cold-tolerant sweet corn varieties.
Supplementary Materials
The following supporting information can be downloaded at https://www.mdpi.com/article/10.3390/biology14050580/s1, Figure S1: The allele variation effects of SNPs; Table S1: Material source information and phenotypic variations; Table S2: Results of the genome-wide association analysis; Table S3: Summary of candidate genes within the confidence interval; Table S4: GO and KEGG enrichment analyses of candidate genes; Table S5: Dynamic expression analysis of candidate genes; Table S6: Interaction and functional interactions among candidate genes.
Author Contributions
Conceptualization, X.C., C.W. and Y.Y.; methodology, X.C.; software, C.W. and Y.Y.; validation, A.R., Z.A. and J.L.; formal analysis, C.W. and Y.Y.; investigation, C.W. and Y.Y.; resources, X.C. and H.Y.; data curation, C.W. and Y.Y.; writing—original draft preparation, C.W., Y.Y., Z.A., A.R., J.L. and X.C.; writing—review and editing, X.C., C.W., Y.Y., Z.A. and H.Y.; visualization, C.W. and Y.Y.; supervision, X.C. and H.Y.; project administration, X.C.; funding acquisition, X.C. All authors have read and agreed to the published version of the manuscript.
Funding
This research was funded by the Emergency Management of the National Natural Science Foundation of China (31440066), Key Discipline Construction Funds for Crop Science of Anhui Sciences and Technology University (No. XK-XJGF001), the National Undergraduate Innovation and Entrepreneurship Training Program (202310879005), and the Research Development Fund of Anhui Science and Technology University (FZ230126).
Institutional Review Board Statement
Not applicable.
Informed Consent Statement
Not applicable.
Data Availability Statement
The original data can be found in this paper and Supplementary Materials.
Conflicts of Interest
The authors declare no conflicts of interest.
References
- Shankar, R.S.; Priya, P.B.; Bhadru, D.; Vanisri, S. Assessment of Genetic Variation and Character Association among Yield and Yield Attributing Traits in Sweet Corn (Zea mays L. saccharata) Inbred Lines. Int. J. Environ. Clim. Chang. 2023, 13, 1146–1154. [Google Scholar] [CrossRef]
- Wu, Z.; Wang, T.; Chen, J.; Zhang, Y.; Lv, G. Sweet corn association panel and genome-wide association analysis reveal loci for chilling-tolerant germination. Sci. Rep. 2024, 14, 10791. [Google Scholar] [CrossRef] [PubMed]
- Allam, M.; Revilla, P.; Djemel, A.; Tracy, W.F.; Ordás, B. Identification of QTLs involved in cold tolerance in sweet × field corn. Euphytica 2016, 208, 353–365. [Google Scholar] [CrossRef]
- Gong, F.; Yang, L.; Tai, F.; Hu, X.; Wang, W. “Omics” of maize stress response for sustainable food production: Opportunities and challenges. Omics 2014, 18, 714–732. [Google Scholar] [CrossRef]
- Dhaliwal, D.S.; Williams, M.M. Evidence of sweet corn yield losses from rising temperatures. Sci. Rep. 2022, 12, 18218. [Google Scholar] [CrossRef]
- Hu, G.; Li, Z.; Lu, Y.; Li, C.; Gong, S.; Yan, S.; Li, G.; Wang, M.; Ren, H.; Guan, H.; et al. Genome-wide association study Identified multiple Genetic Loci on Chilling Resistance During Germination in Maize. Sci. Rep. 2017, 7, 10840. [Google Scholar] [CrossRef] [PubMed]
- Zhang, Y.; Liu, P.; Wang, C.; Zhang, N.; Zhu, Y.; Zou, C.; Yuan, G.; Yang, C.; Gao, S.; Pan, G.; et al. Genome-wide association study uncovers new genetic loci and candidate genes underlying seed chilling-germination in maize. PeerJ 2021, 9, e11707. [Google Scholar] [CrossRef]
- Leipner, J.; Stamp, P. Chilling Stress in Maize Seedlings. In Handbook of Maize: Its Biology; Bennetzen, J.L., Hake, S.C., Eds.; Springer: New York, NY, USA, 2009; pp. 291–310. [Google Scholar]
- Han, C.; Yang, P. Studies on the molecular mechanisms of seed germination. Proteomics 2015, 15, 1671–1679. [Google Scholar] [CrossRef]
- Guo, X.; Liu, D.; Chong, K. Cold signaling in plants: Insights into mechanisms and regulation. J. Integr. Plant Biol. 2018, 60, 745–756. [Google Scholar] [CrossRef]
- Holá, D.; Langrová, K.; Kočová, M.; Rothová, O. Photosynthetic Parameters of Maize (Zea mays L.) Inbred Lines and F1 Hybrids: Their Different Response to, and Recovery from Rapid or Gradual Onset of Low-temperature Stress. Photosynthetica 2003, 41, 429–442. [Google Scholar] [CrossRef]
- Cao, Q.; Li, G.; Cui, Z.; Yang, F.; Jiang, X.; Diallo, L.; Kong, F. Seed Priming with Melatonin Improves the Seed Germination of Waxy Maize under Chilling Stress via Promoting the Antioxidant System and Starch Metabolism. Sci. Rep. 2019, 9, 15044. [Google Scholar] [CrossRef]
- Guan, Y.J.; Hu, J.; Wang, X.J.; Shao, C.X. Seed priming with chitosan improves maize germination and seedling growth in relation to physiological changes under low temperature stress. J. Zhejiang Univ. Sci. B 2009, 10, 427–433. [Google Scholar] [CrossRef] [PubMed]
- Dang, D.; Guan, Y.; Zheng, H.; Zhang, X.; Zhang, A.; Wang, H.; Ruan, Y.; Qin, L. Genome-Wide Association Study and Genomic Prediction on Plant Architecture Traits in Sweet Corn and Waxy Corn. Plants 2023, 12, 303. [Google Scholar] [CrossRef] [PubMed]
- Li, H.; Peng, Z.; Yang, X.; Wang, W.; Fu, J.; Wang, J.; Han, Y.; Chai, Y.; Guo, T.; Yang, N.; et al. Genome-wide association study dissects the genetic architecture of oil biosynthesis in maize kernels. Nat. Genet. 2013, 45, 43–50. [Google Scholar] [CrossRef]
- Yang, T.; Dong, J.; Zhao, J.; Zhang, L.; Zhou, L.; Yang, W.; Ma, Y.; Wang, J.; Fu, H.; Chen, J.; et al. Genome-wide association mapping combined with gene-based haplotype analysis identify a novel gene for shoot length in rice (Oryza sativa L.). Theor. Appl. Genet. 2023, 136, 251. [Google Scholar] [CrossRef] [PubMed]
- Zhang, Z.; Peng, C.; Xu, W.; Li, Y.; Qi, X.; Zhao, M. Genome-wide association study of agronomic traits related to nitrogen use efficiency in Henan wheat. BMC Genom. 2024, 25, 7. [Google Scholar] [CrossRef]
- Jin, Y.; Li, D.; Liu, M.; Cui, Z.; Sun, D.; Li, C.; Zhang, A.; Cao, H.; Ruan, Y. Genome-Wide Association Study Identified Novel SNPs Associated with Chlorophyll Content in Maize. Genes 2023, 14, 1010. [Google Scholar] [CrossRef]
- Baseggio, M.; Murray, M.; Wu, D.; Ziegler, G.; Kaczmar, N.; Chamness, J.; Hamilton, J.P.; Buell, C.R.; Vatamaniuk, O.K.; Buckler, E.S.; et al. Genome-wide association study suggests an independent genetic basis of zinc and cadmium concentrations in fresh sweet corn kernels. G3 2021, 11, jkab186. [Google Scholar] [CrossRef]
- Wang, D.; Liu, J.; Li, C.; Kang, H.; Wang, Y.; Tan, X.; Liu, M.; Deng, Y.; Wang, Z.; Liu, Y.; et al. Genome-wide Association Mapping of Cold Tolerance Genes at the Seedling Stage in Rice. Rice 2016, 9, 61. [Google Scholar] [CrossRef]
- Jin, Y.; Zhang, Z.; Xi, Y.; Yang, Z.; Xiao, Z.; Guan, S.; Qu, J.; Wang, P.; Zhao, R. Identification and Functional Verification of Cold Tolerance Genes in Spring Maize Seedlings Based on a Genome-Wide Association Study and Quantitative Trait Locus Mapping. Front. Plant Sci. 2021, 12, 776972. [Google Scholar] [CrossRef]
- Zhao, Y.; Li, J.; Zhao, R.; Xu, K.; Xiao, Y.; Zhang, S.; Tian, J.; Yang, X. Genome-wide association study reveals the genetic basis of cold tolerance in wheat. Mol. Breed. 2020, 40, 36. [Google Scholar] [CrossRef]
- Yu, Y.; Rizwan, A.; Sun, T.; Wang, D.; Cui, N.; Chen, L.; Yu, H.; Cheng, X. GWAS-Based Prediction of Genes Regulating the Weight of Mobilized Reserved Seeds in Sweet Corn. Agronomy 2024, 14, 2648. [Google Scholar] [CrossRef]
- Yu, T.; Zhang, J.; Cao, J.; Li, S.; Cai, Q.; Li, X.; Li, S.; Li, Y.; He, C.; Ma, X. Identification of Multiple Genetic Loci Related to Low-Temperature Tolerance during Germination in Maize (Zea maize L.) through a Genome-Wide Association Study. Curr. Issues Mol. Biol. 2023, 45, 9634–9655. [Google Scholar] [CrossRef]
- Soltani, A.; Gholipoor, M.; Zeinali, E. Seed reserve utilization and seedling growth of wheat as affected by drought and salinity. Environ. Exp. Bot. 2006, 55, 195–200. [Google Scholar] [CrossRef]
- Coles, N.D.; McMullen, M.D.; Balint-Kurti, P.J.; Pratt, R.C.; Holland, J.B. Genetic control of photoperiod sensitivity in maize revealed by joint multiple population analysis. Genetics 2010, 184, 799–812. [Google Scholar] [CrossRef]
- Huang, J.-Y.; He, W.; Hong, Z.-Q.; Li, Y.-X.; Zhou, B.; Cheng, X. Genome-wide association mapping of seed reserve utilization during early seedling growth of sweet corn under salt stress. Pak. J. Bot. 2023, 5, 32–40. [Google Scholar] [CrossRef]
- Ma, L.; Zhang, M.; Chen, J.; Qing, C.; He, S.; Zou, C.; Yuan, G.; Yang, C.; Peng, H.; Pan, G.; et al. GWAS and WGCNA uncover hub genes controlling salt tolerance in maize (Zea mays L.) seedlings. Theor. Appl. Genet. 2021, 134, 3305–3318. [Google Scholar] [CrossRef] [PubMed]
- Bai, L.; Wu, C.; Lei, S.; Zou, M.; Wang, S.; Zhang, Z.; Bao, Z.; Ren, Z.; Liu, K.; Ma, Q.; et al. Potential anti-gout properties of Wuwei Shexiang pills based on network pharmacology and pharmacological verification. J. Ethnopharmacol. 2023, 305, 116147. [Google Scholar] [CrossRef]
- Sharifi Alishah, M.; Darvishzadeh, R.; Ahmadabadi, M.; Piri Kashtiban, Y.; Hasanpur, K. Identification of differentially expressed genes in salt-tolerant oilseed sunflower (Helianthus annuus L.) genotype by RNA sequencing. Mol. Biol. Rep. 2022, 49, 3583–3596. [Google Scholar] [CrossRef]
- Gao, C.; Gao, K.; Yang, H.; Ju, T.; Zhu, J.; Tang, Z.; Zhao, L.; Chen, Q. Genome-wide analysis of metallothionein gene family in maize to reveal its role in development and stress resistance to heavy metal. Biol. Res. 2022, 55, 1. [Google Scholar] [CrossRef]
- Qu, Z.; Wu, Y.; Hu, D.; Li, T.; Liang, H.; Ye, F.; Xue, J.; Xu, S. Genome-Wide Association Analysis for Candidate Genes Contributing to Kernel-Related Traits in Maize. Front. Plant Sci. 2022, 13, 872292. [Google Scholar] [CrossRef] [PubMed]
- Alemu, A.; Batista, L.; Singh, P.K.; Ceplitis, A.; Chawade, A. Haplotype-tagged SNPs improve genomic prediction accuracy for Fusarium head blight resistance and yield-related traits in wheat. Theor. Appl. Genet. 2023, 136, 92. [Google Scholar] [CrossRef]
- Welchen, E.; Hildebrandt, T.M.; Lewejohann, D.; Gonzalez, D.H.; Braun, H.P. Lack of cytochrome c in Arabidopsis decreases stability of Complex IV and modifies redox metabolism without affecting Complexes I and III. Biochim. Biophys. Acta 2012, 1817, 990–1001. [Google Scholar] [CrossRef]
- Kumar, K.; Rao, K.P.; Biswas, D.K.; Sinha, A.K. Rice WNK1 is regulated by abiotic stress and involved in internal circadian rhythm. Plant Signal Behav. 2011, 6, 316–320. [Google Scholar] [CrossRef] [PubMed]
- Salleh, F.M.; Evans, K.; Goodall, B.; Machin, H.; Mowla, S.B.; Mur, L.A.; Runions, J.; Theodoulou, F.L.; Foyer, C.H.; Rogers, H.J. A novel function for a redox-related LEA protein (SAG21/AtLEA5) in root development and biotic stress responses. Plant Cell Environ. 2012, 35, 418–429. [Google Scholar] [CrossRef]
- Racca, S.; Welchen, E.; Gras, D.E.; Tarkowská, D.; Turečková, V.; Maurino, V.G.; Gonzalez, D.H. Interplay between cytochrome c and gibberellins during Arabidopsis vegetative development. Plant J. 2018, 94, 105–121. [Google Scholar] [CrossRef]
- Wang, Y.; Fan, Y.; Fan, D.; Zhou, X.; Jiao, Y.; Deng, X.W.; Zhu, D. The noncoding RNA HIDDEN TREASURE 1 promotes phytochrome B-dependent seed germination by repressing abscisic acid biosynthesis. Plant Cell 2023, 35, 700–716. [Google Scholar] [CrossRef] [PubMed]
- Hund, A.; Richner, W.; Soldati, A.; Fracheboud, Y.; Stamp, P. Root morphology and photosynthetic performance of maize inbred lines at low temperature. Eur. J. Agron. 2007, 27, 52–61. [Google Scholar] [CrossRef]
- Zhao, Y.; Wang, H.; Bo, C.; Dai, W.; Zhang, X.; Cai, R.; Gu, L.; Ma, Q.; Jiang, H.; Zhu, J.; et al. Genome-wide association study of maize plant architecture using F(1) populations. Plant Mol. Biol. 2019, 99, 1–15. [Google Scholar] [CrossRef]
- Zhang, H.; Zhang, J.; Xu, Q.; Wang, D.; Di, H.; Huang, J.; Yang, X.; Wang, Z.; Zhang, L.; Dong, L.; et al. Identification of candidate tolerance genes to low-temperature during maize germination by GWAS and RNA-seq approaches. BMC Plant Biol. 2020, 20, 333. [Google Scholar] [CrossRef]
- Li, Y.; Liang, Y.; Liu, M.; Zhang, Q.; Wang, Z.; Fan, J.; Ruan, Y.; Zhang, A.; Dong, X.; Yue, J.; et al. Genome-Wide Association Studies Provide Insights Into the Genetic Architecture of Seed Germination Traits in Maize. Front. Plant Sci. 2022, 13, 930438. [Google Scholar] [CrossRef] [PubMed]
- Cheng, X.X.; He, S.; Geng, G.H. Dynamic QTL analysis of seed reserve utilization in sh(2) sweet corn germination stages. Genet. Mol. Res. 2016, 15, 183–193. [Google Scholar] [CrossRef] [PubMed]
- Li, W.; Yu, Y.; Wang, L.; Luo, Y.; Peng, Y.; Xu, Y.; Liu, X.; Wu, S.; Jian, L.; Xu, J.; et al. The genetic architecture of the dynamic changes in grain moisture in maize. Plant Biotechnol. J. 2021, 19, 1195–1205. [Google Scholar] [CrossRef] [PubMed]
- Boakyewaa Adu, G.; Badu-Apraku, B.; Akromah, R.; Garcia-Oliveira, A.L.; Awuku, F.J.; Gedil, M. Genetic diversity and population structure of early-maturing tropical maize inbred lines using SNP markers. PLoS ONE 2019, 14, e0214810. [Google Scholar] [CrossRef]
- Agrofoglio, Y.C.; Iglesias, M.J.; Perez-Santángelo, S.; de Leone, M.J.; Koester, T.; Catalá, R.; Salinas, J.; Yanovsky, M.J.; Staiger, D.; Mateos, J.L. Arginine methylation of SM-LIKE PROTEIN 4 antagonistically affects alternative splicing during Arabidopsis stress responses. Plant Cell 2024, 36, 2219–2237. [Google Scholar] [CrossRef]
- Carrasco-López, C.; Hernández-Verdeja, T.; Perea-Resa, C.; Abia, D.; Catalá, R.; Salinas, J. Environment-dependent regulation of spliceosome activity by the LSM2-8 complex in Arabidopsis. Nucleic Acids Res. 2017, 45, 7416–7431. [Google Scholar] [CrossRef]
- Cao, D.; Cheng, H.; Wu, W.; Soo, H.M.; Peng, J. Gibberellin mobilizes distinct DELLA-dependent transcriptomes to regulate seed germination and floral development in Arabidopsis. Plant Physiol. 2006, 142, 509–525. [Google Scholar] [CrossRef]
- Xu, P.; Chen, H.; Li, T.; Xu, F.; Mao, Z.; Cao, X.; Miao, L.; Du, S.; Hua, J.; Zhao, J.; et al. Blue light-dependent interactions of CRY1 with GID1 and DELLA proteins regulate gibberellin signaling and photomorphogenesis in Arabidopsis. Plant Cell 2021, 33, 2375–2394. [Google Scholar] [CrossRef]
- Harberd, N.P. Botany. Relieving DELLA restraint. Science 2003, 299, 1853–1854. [Google Scholar] [CrossRef]
- Hussain, A.; Cao, D.; Cheng, H.; Wen, Z.; Peng, J. Identification of the conserved serine/threonine residues important for gibberellin-sensitivity of Arabidopsis RGL2 protein. Plant J. 2005, 44, 88–99. [Google Scholar] [CrossRef]
- Leasure, C.D.; Tong, H.; Yuen, G.; Hou, X.; Sun, X.; He, Z.H. ROOT UV-B SENSITIVE2 acts with ROOT UV-B SENSITIVE1 in a root ultraviolet B-sensing pathway. Plant Physiol. 2009, 150, 1902–1915. [Google Scholar] [CrossRef] [PubMed][Green Version]
- Achard, P.; Gong, F.; Cheminant, S.; Alioua, M.; Hedden, P.; Genschik, P. The cold-inducible CBF1 factor-dependent signaling pathway modulates the accumulation of the growth-repressing DELLA proteins via its effect on gibberellin metabolism. Plant Cell 2008, 20, 2117–2129. [Google Scholar] [CrossRef]
- Esparza-Reynoso, S.; Ruíz-Herrera, L.F.; Pelagio-Flores, R.; Macías-Rodríguez, L.I.; Martínez-Trujillo, M.; López-Coria, M.; Sánchez-Nieto, S.; Herrera-Estrella, A.; López-Bucio, J. Trichoderma atroviride-emitted volatiles improve growth of Arabidopsis seedlings through modulation of sucrose transport and metabolism. Plant Cell Environ. 2021, 44, 1961–1976. [Google Scholar] [CrossRef]
- Klemens, P.A.; Patzke, K.; Deitmer, J.; Spinner, L.; Le Hir, R.; Bellini, C.; Bedu, M.; Chardon, F.; Krapp, A.; Neuhaus, H.E. Overexpression of the vacuolar sugar carrier AtSWEET16 modifies germination, growth, and stress tolerance in Arabidopsis. Plant Physiol. 2013, 163, 1338–1352. [Google Scholar] [CrossRef] [PubMed]
- Dekkers, B.J.W.; Schuurmans, J.A.M.J.; Smeekens, S.C.M. Interaction between sugar and abscisic acid signalling during early seedling development in Arabidopsis. Plant Mol. Biol. 2008, 67, 151–167. [Google Scholar] [CrossRef]
- Yan, J.; Zhao, C.; Zhou, J.; Yang, Y.; Wang, P.; Zhu, X.; Tang, G.; Bressan, R.A.; Zhu, J.K. The miR165/166 Mediated Regulatory Module Plays Critical Roles in ABA Homeostasis and Response in Arabidopsis thaliana. PLoS Genet 2016, 12, e1006416. [Google Scholar] [CrossRef]
- Chen, K.; Li, G.J.; Bressan, R.A.; Song, C.P.; Zhu, J.K.; Zhao, Y. Abscisic acid dynamics, signaling, and functions in plants. J. Integr. Plant Biol. 2020, 62, 25–54. [Google Scholar] [CrossRef] [PubMed]
- Sinha, S.; Sahadevan, S.; Ohno, C.; Ram, H.; Heisler, M.G. Global gene regulatory network underlying miR165a in Arabidopsis shoot apical meristem. Sci. Rep. 2023, 13, 22258. [Google Scholar] [CrossRef]
- Nakamichi, N.; Murakami-Kojima, M.; Sato, E.; Kishi, Y.; Yamashino, T.; Mizuno, T. Compilation and characterization of a novel WNK family of protein kinases in Arabiodpsis thaliana with reference to circadian rhythms. Biosci. Biotechnol. Biochem. 2002, 66, 2429–2436. [Google Scholar] [CrossRef]
Disclaimer/Publisher’s Note: The statements, opinions and data contained in all publications are solely those of the individual author(s) and contributor(s) and not of MDPI and/or the editor(s). MDPI and/or the editor(s) disclaim responsibility for any injury to people or property resulting from any ideas, methods, instructions or products referred to in the content. |
© 2025 by the authors. Licensee MDPI, Basel, Switzerland. This article is an open access article distributed under the terms and conditions of the Creative Commons Attribution (CC BY) license (https://creativecommons.org/licenses/by/4.0/).