Article

Fgf21 Deficiency Delays Hair Follicle Cycling and Modulates miRNA–Target Gene Interactions in Mice

The State Key Laboratory of Reproductive Regulation and Breeding of Grassland Livestock, Inner Mongolia University, Hohhot 010031, China
*
Author to whom correspondence should be addressed.
These authors contributed equally to this work.
Biology 2025, 14(5), 526; https://doi.org/10.3390/biology14050526
Submission received: 2 April 2025 / Revised: 3 May 2025 / Accepted: 6 May 2025 / Published: 9 May 2025
(This article belongs to the Section Developmental and Reproductive Biology)

Simple Summary

This study explores how Fgf21 gene influences hair follicle growth. Using CRISPR/Cas9, we developed Fgf21 gene knockout mice, which showed a delayed shift from the telogen to anagen phase of the hair follicle cycle compared to normal mice. Through miRNA sequencing, we found specific miRNAs that are differentially expressed in these knockout mice. Further experiments confirmed that miR-134-5p directly targets the Vezf1 gene, and miR-136-5p targets the Map3k1 gene. These genes are involved in regulating hair follicle development. Our findings suggest that Fgf21 gene plays a crucial role in hair follicle growth by modulating the expression of target genes through miRNAs. This research deepens our understanding of the molecular mechanisms underlying hair follicle growth and could aid in developing novel therapies for hair-related disorders.

Abstract

Fibroblast growth factor 21 (Fgf21) is a key regulator of hair follicle development and cycling. Although microRNAs (miRNAs) are involved in this process, the specific mechanisms through which Fgf21 regulates hair follicle growth remain unclear. This study investigates the role of Fgf21 and its associated miRNAs in hair follicle growth and development. Using CRISPR/Cas9, we generated Fgf21 knockout mice (Fgf21/), which exhibited a delayed transition from the telogen to anagen phases compared to wild-type (WT) mice. miRNA sequencing identified differentially expressed miRNAs in Fgf21/ mice, with dual-luciferase assays confirming that miR-134-5p directly targets vascular endothelial zinc finger 1 (Vezf1) and miR-136-5p targets mitogen-activated protein kinase kinase kinase 1 (Map3k1). Real-time qPCR analysis revealed that Vezf1 and Map3k1 expression was higher in Fgf21/ mice than in WT mice during catagen, but lower during telogen. These findings indicate that Fgf21 plays a critical role in regulating hair follicle growth and may modulate Vezf1 and Map3k1 expression through miRNAs. This study provides novel insights into the molecular regulation of hair follicle growth and suggests potential therapeutic strategies for hair follicle-related disorders.

1. Introduction

Hair follicles are essential skin appendages that arise from the interactions between cells of different origins, including epithelial, mesenchymal, and neurodermal cells [1]. Hair follicles serve as the foundation for hair growth and provide structural support and protection to the skin [2]. Hair follicle formation is a complex process involving the coordinated actions of surrounding tissues and cells and is regulated by multiple signaling pathways and transcription factors [3].
In recent years, the molecular mechanisms underlying hair follicle development have gained considerable attention. The fibroblast growth factor (FGF) family plays a crucial regulatory role in this process. The FGF family comprises a large group of growth factors that regulate cell proliferation, apoptosis, migration, and differentiation [4,5]. Dysregulation of FGF family genes significantly affects hair follicle growth and development. For instance, Fgf18 is considered a key regulator of the hair follicle growth cycle, as Fgf18 knockout mice exhibit shortened telogen [6], whereas Fgf7 overactivation markedly inhibits hair follicle growth [7]. Fgf20 is essential for early dermal condensate formation [8,9], whereas Fgf9 and Fgfr2 IIIb are involved in hair follicle regulation [10,11]. Interactions between Fgf and Wnt signaling in the mesenchymal niche regulate the hair follicle cycle clock in mice [12], and Fgfr2 negatively regulates sonic hedgehog (Shh) during hair follicle development [13]. Members of the FGF and FGFR families regulate the entire hair follicle growth cycle in mice, with different genes expressed at various stages. During anagen, Fgf21 and its receptor Fgfr2 are expressed; during catagen, Fgfr1 and Fgfr4 are expressed; and during telogen, Fgf1, Fgf2, Fgf13, Fgf18, and Fgf20 are expressed [14]. These findings highlight the critical role of the FGF family in hair follicle growth and development.
Fgf21 was first isolated in 2000 by Nishimura et al. [15] and belongs to the FGF19 subfamily, which also includes Fgf19, Fgf21, and Fgf23 [16]. While Fgf21 has been recognized as a key regulator of hair follicle growth and development, its role in the miRNA regulatory network, particularly in the context of hair follicle growth and cell cycle regulation, remains underexplored. Therefore, elucidating the specific mechanisms by which Fgf21 regulates hair follicle growth and development, as well as its role in hair follicle cell cycle regulation, is crucial for understanding hair follicle biology and may provide new therapeutic strategies for related disorders.
MicroRNA sequencing technology has revealed the significant role of miRNAs in hair follicle growth, development, and transition between hair follicle cycles [17]. To investigate the role of Fgf21 in hair follicle growth and cycle regulation, our laboratory used CRISPR/Cas9 to develop a Fgf21 knockout mouse model. High-throughput miRNA sequencing found 93 differentially expressed miRNAs, with 10 selected for their potential roles in hair follicle regulation; Vezf1 and Map3k1 were confirmed as direct targets of miR-134-5p and miR-136-5p, respectively, and their expression within follicles was altered by Fgf21 during the first natural growth cycle of mouse hair follicles. These findings indicate that Fgf21 knockout induces changes in the miRNA expression profile and regulates Vezf1 and Map3k1 expression, thereby influencing hair follicle growth and development.

2. Materials and Methods

2.1. Animal Models and Sample Collection

This study used FVB strain, an outbred strain derived from Swiss mice and developed by the National Institutes of Health from the Friend Virus Susceptibility 1b (FV1b) inbred strain. We established a Fgf21 knockout mouse model using CRISPR/Cas9 technology. The mouse model was bred through intercrosses and reciprocal crosses of heterozygous and homozygous mice. All experimental animals were housed in a controlled environment with a temperature of 22–24 °C, humidity of 45–65%, and free access to food and water. Genomic DNA was extracted from mouse tail tips using a genomic DNA extraction kit (Tiangen Bio, Beijing, China) to confirm successful Fgf21/ model establishment. Genotyping was performed via PCR using the following primers: Fgf21-F:5′-GTTCCTGCCAAGTGTGTCAAATA-3′; Fgf21-R:5′-GACCACAGAAAGAGACTCACCG-3′. The reaction procedure was as follows: initial denaturation at 94 °C for 5 min, followed by 35 cycles of denaturation at 94 °C for 30 s, annealing at 56 °C for 30 s, and extension at 72 °C for 50 s. Finally, the reaction was held at 72 °C for 10 min and then cooled to 16 °C for 1 h. The genotype identification results are listed in Figure S1 in the Supplementary Materials.
Dorsal skin tissues of 8-week-old FVB Fgf21/ and WT mice were collected for miRNA sequencing. All animal experiments were conducted in strict accordance with the Guidelines for the Management and Use of Laboratory Animals established by the Laboratory Animal Research Center of Inner Mongolia University (SYXK2020-0006). The animal experiments in this study were approved and authorized by the Animal Ethics Committee of Inner Mongolia University (IMU-MOUSE-2020-047). These measures ensured scientific rigor and ethical compliance, providing a reliable model for investigating the role of Fgf21 in the hair follicle growth cycle.

2.2. Preparation of Hair Follicle Cycle-Synchronized Mouse Model

To assess the role of Fgf21 in the hair follicle growth cycle, we synchronized the hair follicle cycle in 8-week-old FVB mice using a physical depilation method. After inducing anesthesia, a mixture of rosin and paraffin was applied to the dorsal skin to induce depilation. Subsequently, we compared the hair growth rates between WT and Fgf21/ mice. Hair growth was monitored and photographed at 1-, 3-, 5-, 7-, 9-, 11-, 13-, 15-, 17-, 19-, and 21-days post-depilation to document the process in detail.
8-week-old mice are in the telogen phase of the hair follicle cycle [18]. After depilation, hair follicles synchronously transition to the anagen phase [19]. We use the model to study the transition from telogen to anagen in mice. For target gene validation in the hair follicle cycle, naturally cycling mice are selected. On postnatal day 6 (P6), hair follicles are in the anagen phase, characterized by active cell proliferation and hair shaft formation, while P5 is regarded as early anagen due to the continuity of follicular development [20]. P15 and P17 mice are in the catagen phase, which lasts until P19, followed by the resting telogen phase, with P20 being in early telogen [20]. Based on this information, skin tissue from P5 mice represents anagen, P16 represents catagen, and P20 represents telogen.

2.3. Real-Time Quantitative PCR (RT-qPCR)

In the RT-qPCR experiment, total RNA was extracted from fresh frozen samples. After collection, the samples were stored in liquid nitrogen tanks and RNA extraction was performed once all samples were collected. Total RNA was extracted from the dorsal skin tissues of 8-week-old WT and Fgf21/ mice using the RNAiso Plus reagent kit (Takara Bio Inc., Tokyo, Japan). The extracted RNA was reverse transcribed into cDNA using the PrimeScript Reverse Transcriptase Kit (Takara Bio Inc., Tokyo, Japan). Reverse transcription was performed with the GoScript Reverse Transcription System (Promega Corporation, Madison, WI, USA) on a C1000 Thermal Cycler (Bio-Rad Laboratories Inc., Hercules, CA, USA). RT-qPCR reactions were conducted on the C1000 Thermal Cycler using the GoTaq qPCR Master Mix (Promega Corporation, Madison, WI, USA). GAPDH and U6 were selected as internal reference genes to ensure the accuracy and comparability of the data. The primer sequences used for RT-qPCR are listed in Table S1 in the Supplementary Materials. Relative gene expression levels were calculated using the 2−ΔCT method, based on the difference between the CT values of the target genes and the reference genes.

2.4. miRNA Library Construction and High-Throughput Sequencing

miRNA sequencing libraries were constructed from the total RNA extracted from the fresh dorsal skin tissues of 8-week-old FVB mice using the TruSeq Small RNA Sample Preparation Kit (Illumina Inc., San Diego, CA, USA). PCR products of 140–160 bp were recovered using 6% polyacrylamide gel electrophoresis for library preparation. Single-end high-throughput sequencing was performed on an Illumina HiSeq 2000/2500 platform (Illumina Inc., San Diego, CA, USA).

2.5. Data Quality Control and miRNA Identification

The quality of raw miRNA sequencing data was assessed using Illumina FastQC (Illumina Inc., San Diego, CA, USA), and high-quality sequences meeting the Q30 standard were selected for further studies. These sequences were aligned to the miRBase 21.0 database (Memorial Sloan-Kettering Cancer Center, New York, NY, USA) using Bowtie (Johns Hopkins University, Baltimore, MD, USA) to identify and quantify known miRNAs. Sequences that did not match the known miRNAs were further aligned with the reference genome. The secondary structure of the successfully aligned sequences was predicted using RNAfold (University of Vienna, Vienna, Austria) to identify and analyze the structural features of the miRNAs.

2.6. Differential Expression Analysis of miRNAs

The expression levels of miRNAs were analyzed using RSEM (Harvard Medical School, Boston, MA, USA) based on sequencing data, with expression values normalized to transcripts per million (TPM). Differential expression analysis of the miRNAs was performed using DESeq2 (Bioconductor, Heidelberg, Germany). DESeq2 employs a negative binomial distribution model to evaluate the statistical significance of miRNA expression differences while accounting for sample variability. The analysis was performed using default parameters, a significance level of p-value < 0.05, and a fold-change cutoff of 2 for identifying upregulated and downregulated miRNAs. The Benjamani–Hochberg method was applied for multiple testing correction to enhance accuracy.

2.7. Target Gene Enrichment Analysis and Network Construction

To identify the target genes of differentially expressed miRNAs associated with hair follicle growth and development, we employed three prediction tools: TargetScan 8.0 (Whitehead Institute for Biomedical Research, Cambridge, MA, USA), miRanda 2.066 (Memorial Sloan-Kettering Cancer Center, New York, NY, USA), and miRDB 6.0 (University of Illinois, Chicago, IL, USA). Potential target genes were identified by intersecting the prediction results from these tools. Subsequently, GO and KEGG pathway enrichment analyses were performed on candidate target genes to elucidate their potential functions and associated biological pathways. In both GO and KEGG analyses, a significance threshold of p < 0.05 was set to identify significantly enriched terms. Cytoscape software 3.7.1 (Cytoscape Consortium, San Diego, CA, USA) was used to construct miRNA-GO/KEGG-target gene networks, enabling visualization of relationships among miRNAs, their target genes, and associated pathways.

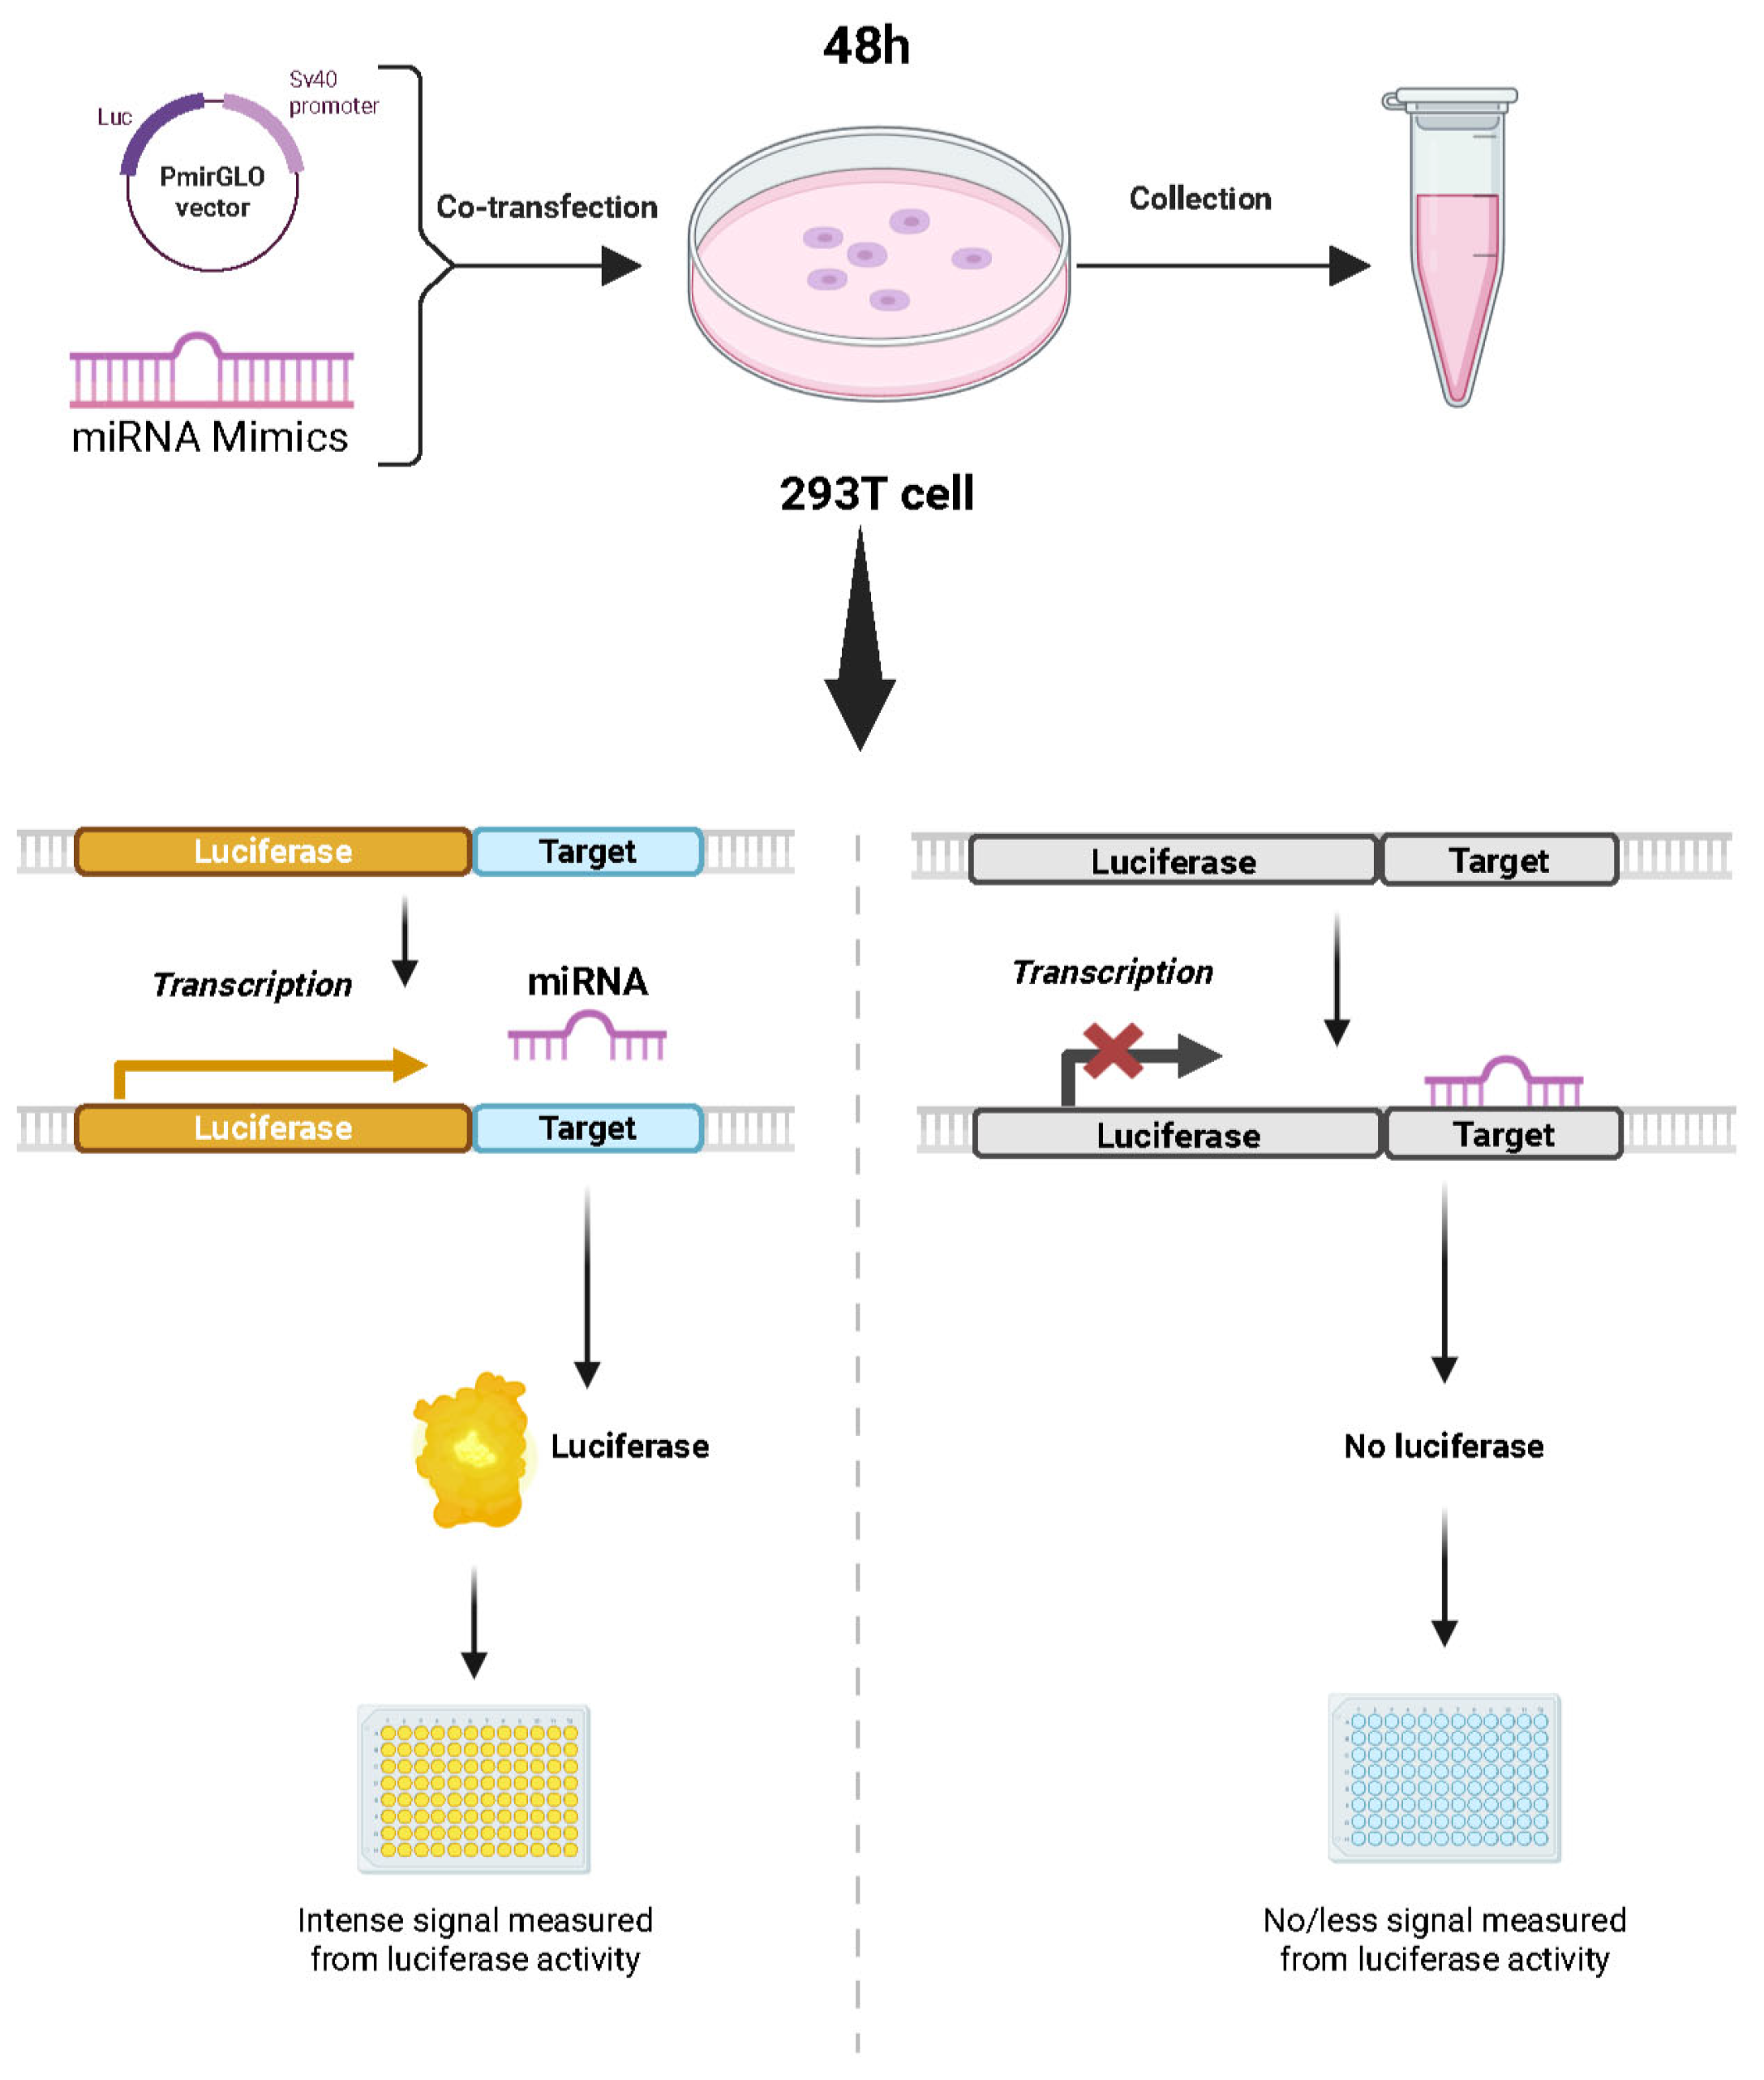
2.8. Validation of Target Relationships

To validate the targeting relationships between miR-134-5p and miR-136-5p and their target genes, we used the dual-luciferase reporter assay (Figure 1). The backbone vector was amplified in LB broth (AMP+) at 37 °C for 12 h. The bacterial culture was processed to remove debris, and the vector was purified and digested with XhoI and XbaI (New England Biolabs, Ipswich, MA, USA). The vector was linearized via 1% agarose gel electrophoresis. Target binding sites for miR-134-5p and miR-136-5p within the target genes’ 3′UTR were identified using TargetScan, and primers were designed (Supplementary Table S1). The target fragments were synthesized, annealed into double-stranded DNA, and ligated into the linearized vector. The ligation product was transformed into competent cells, cultured, and plated on LB agar (AMP+). Selected colonies were cultured, and plasmid DNA was extracted and sequenced to verify the construct. The confirmed recombinant plasmid was propagated in E·coli for subsequent transfection experiments.
The 293T cells were transfected in four groups: miR-134/136-5p mimics or NC mimics (RiboBio, Guangzhou, China) with WT or MUT target gene vectors. Cells (2 × 10⁵ per well) were seeded in 24-well plates and transfected at ~95% confluence. Transfection complexes were formed by mixing Solution A (50 µL Opti-MEM (Thermo Fisher Scientific, Waltham, MA, USA) with 2 µL Lipofectamine 2000 (Invitrogen, Carlsbad, CA, USA)) and Solution B (50 µL Opti-MEM with 1.25 µL mimics/NC and 300 ng vector) at a 1:1 ratio, incubating this for 5 min at room temperature, and diluting it to 500 µL with Opti-MEM and adding this to the cells. After 6 h incubation at 37 °C with 5% CO2, the medium was replaced. For detection, cells were washed three times with 1× DPBS (Thermo Fisher Scientific, Waltham, MA, USA), lysed with 100 µL 1× PLB (Promega, Madison, WI, USA) for 15 min at 145 rpm, then centrifuged at 4 °C and 12,000 rpm for 30 s. Luciferase activity was measured by mixing 10 µL supernatant with 50 µL Luciferase Assay Reagent (Promega, Madison, WI, USA) to read RLU1, followed by adding 50 µL Stop Reagent (Promega, Madison, WI, USA) to read RLU2. The ratio (RLU1/RLU2) was recorded.

2.9. Morphological Observation

The skin tissues used in H&E staining experiments were obtained from fresh samples. Dorsal skin tissues were cut into 1 cm2 pieces, rinsed with PBS, and immediately immersed in 4% paraformaldehyde for 24 h for fixation. After fixation, the samples were dehydrated using a graded ethanol series, cleared in xylene, and embedded in paraffin. Thin sections were then prepared and stained with H&E. Morphological observations were conducted using a microscope.

2.10. Immunofluorescence Staining

The skin tissues used in the immunofluorescence staining experiments were also obtained from fresh samples, which were rinsed with PBS and fixed in paraformaldehyde for 24 h before experimentation. Tissue sections were dewaxed in xylene and rehydrated using a graded ethanol series. These sections were subjected to heat-induced epitope retrieval in 0.01 M sodium citrate buffer to expose antigens. After antigen retrieval, the sections were blocked with blocking solution at room temperature for 1 h and then incubated with primary antibodies overnight at 4 °C. The primary antibodies used were anti-BCL2 (Bioss, Beijing, China, bsm-1174R, dilution 1:400), anti-KI67 (Bioss, Beijing, China, bsm-52455R, dilution 1:400), anti-VEZF1 (Bioss, Beijing, China, bs-12791R, dilution 1:400), and anti-MAP3K1 (Proteintech, Rosemont, IL, USA, 19970-1-AP, dilution 1:400). After the incubation period, sections were uniformly covered with the secondary antibody and incubated for 1 h in the dark, followed by three washes with PBS. Nuclei were counterstained with DAPI (Sigma, Saint Louis, MO, USA, D8417, dilution 1:1000) for 8–10 min at room temperature in the dark, with three additional washes with PBS. These sections were then mounted and examined to assess BCL2, KI67, MAP3K1, and VEZF1 expression in various hair follicle structures.

2.11. Statistical Analysis

Each experiment was conducted independently in triplicate. Data analysis was performed using the GraphPad Prism 8 software (GraphPad Software, San Diego, CA, USA). Student’s t-test was used to compare differences between the two groups. When evaluating differences among multiple groups, one-way analysis of variance (ANOVA) was performed. A p-value of <0.05 was considered statistically significant.

3. Results

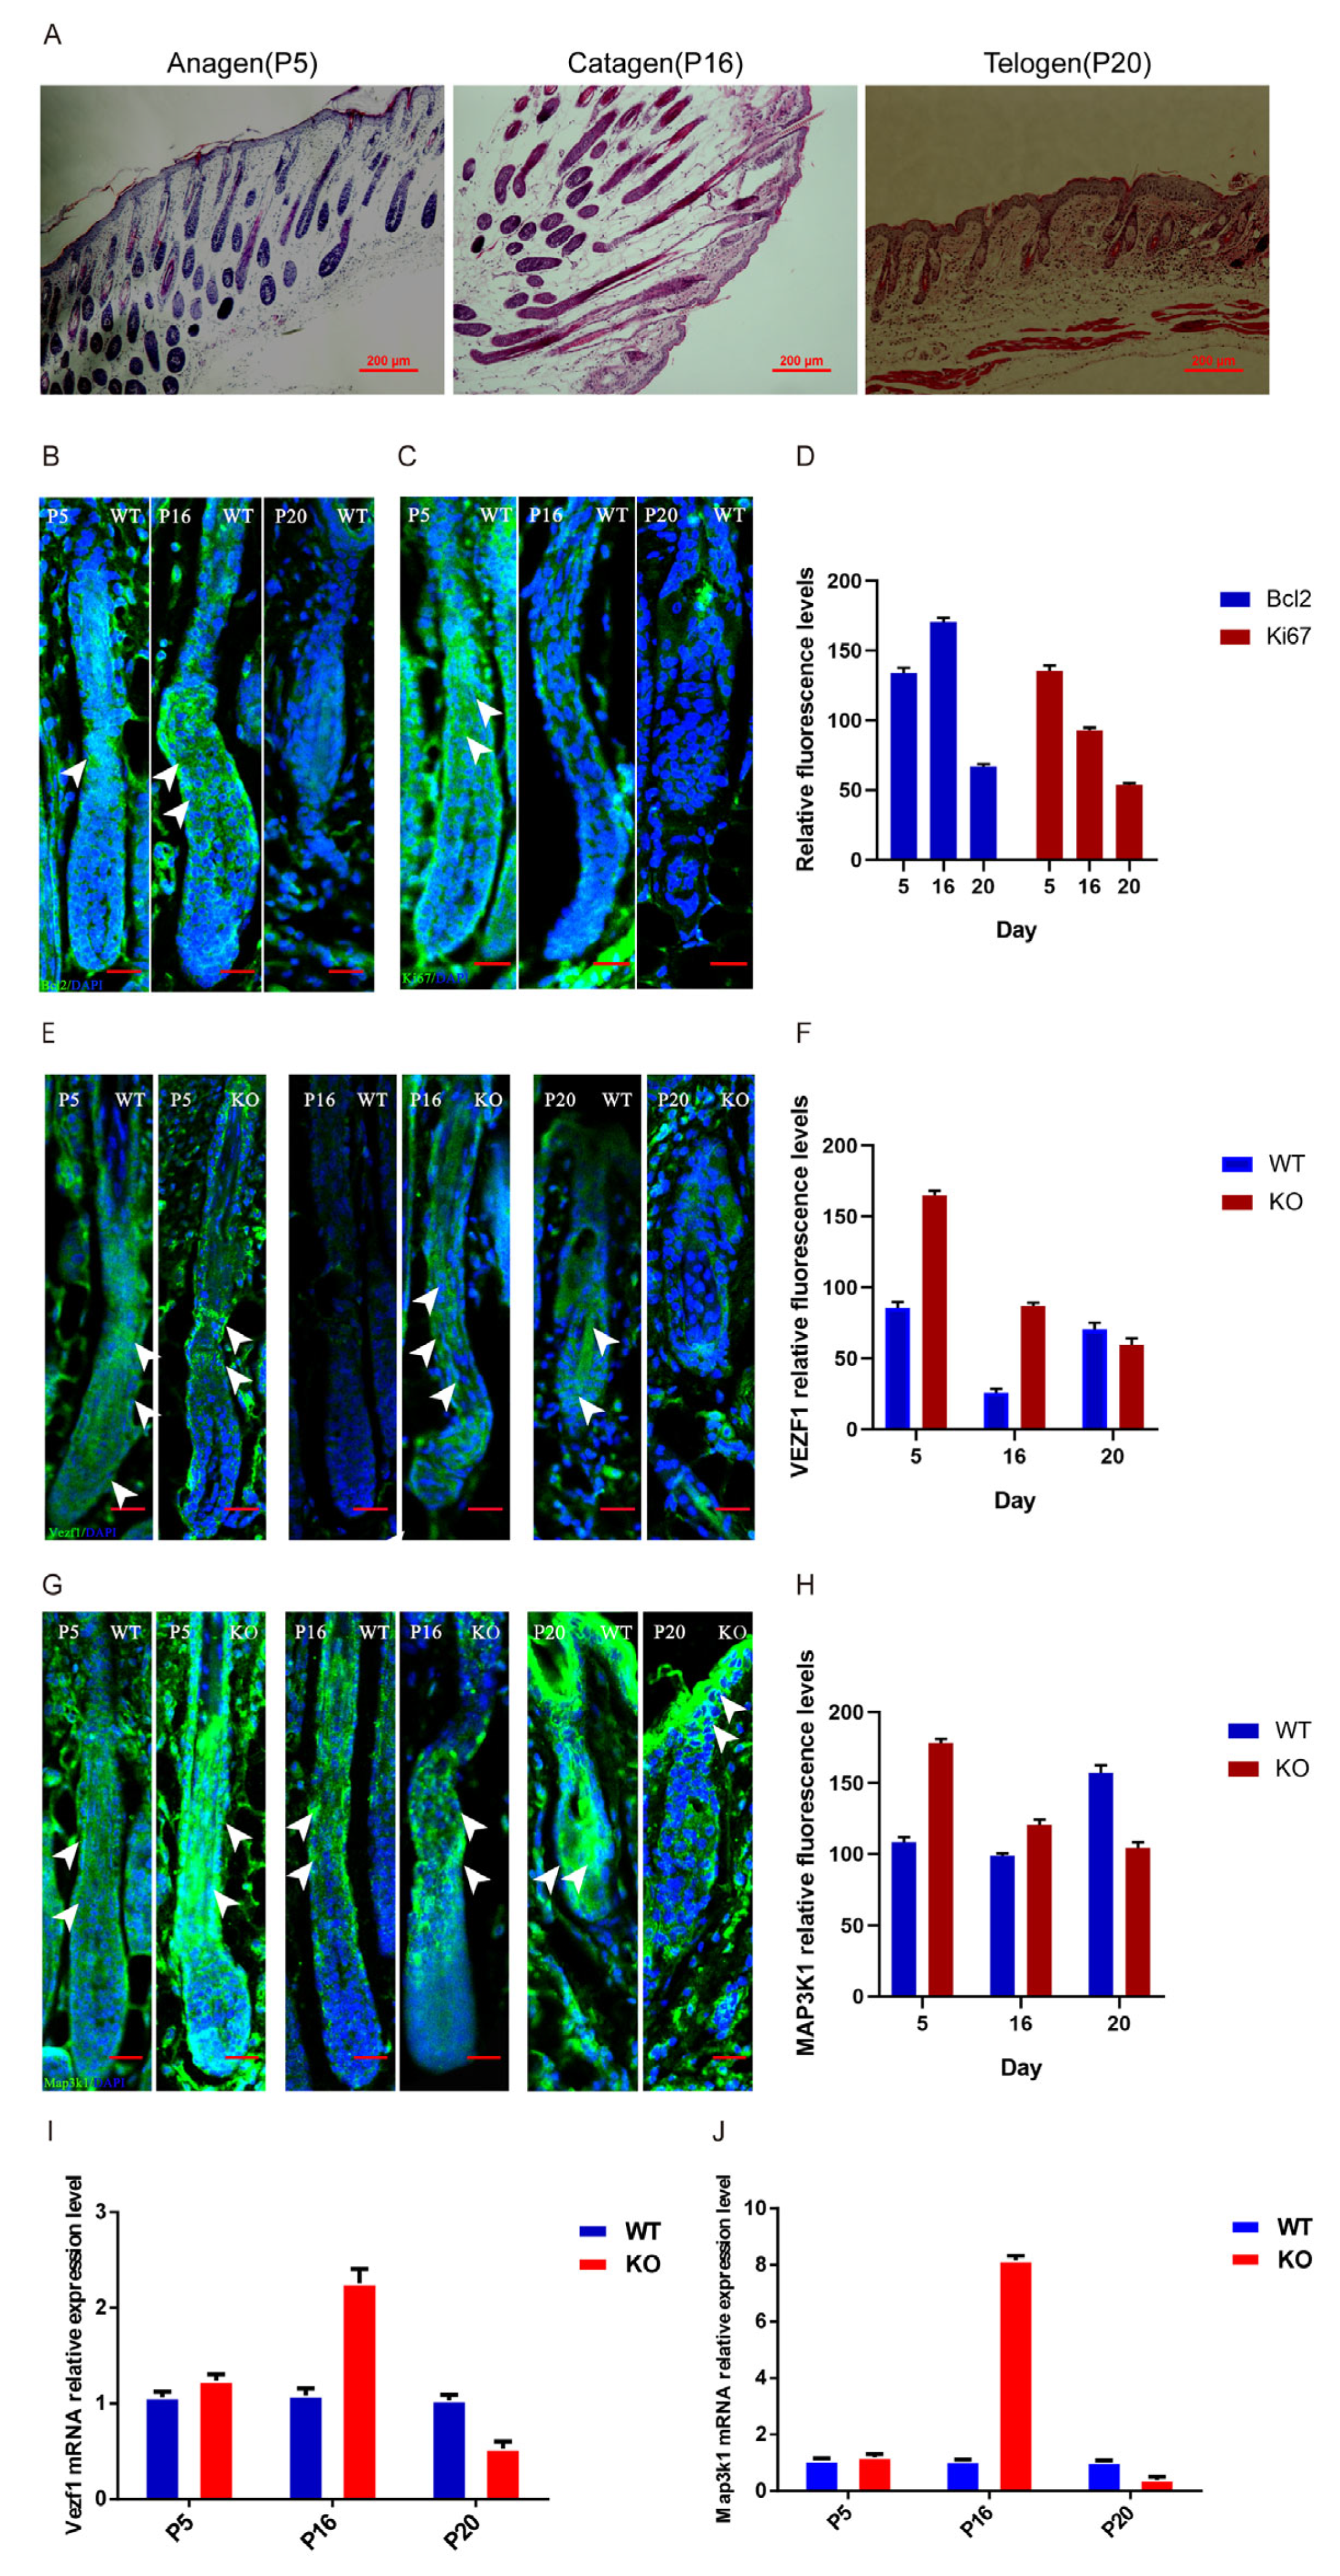
3.1. Fgf21 Knockout Delays the Transition from Telogen to Anagen in Hair Follicles

During telogen, the skin of friend virus B-type (FVB) mice typically appears pink, gradually turns pale pink, and begins to grow white hair at the onset of anagen. To investigate the role of Fgf21 in hair follicle cycle transition, we synchronized the hair follicle cycles of 8-week-old Fgf21/ and WT mice through depilation. Immediately after depilation, the skin of all the mice appeared pink, indicating that they were in the telogen phase, with no significant differences observed between the two groups. On day 7 post-depilation, both Fgf21/ and WT mice retained pink skin, confirming that they remained in the telogen phase. On day 9, while the skin of Fgf21/ mice remained pink, that of WT mice began to turn pale pink, indicating the initial entry into the anagen phase. By day 11, Fgf21/ mice showed no significant changes, whereas WT mice began to grow fine vellus hair. On day 13, Fgf21/ mice gradually turned pale pink, marking the initial entry into the anagen phase, whereas WT mice had already developed longer hair covering the skin (Figure 2A).
To further investigate the impact of Fgf21 knockout on hair follicle cycle transition, we performed hematoxylin and eosin (H&E) staining on depilated skin tissues of Fgf21/ and WT mice. The results were consistent with phenotypic observations. On day 7 post-depilation, both groups exhibited typical in the telogen phase features with shortened hair follicles and tightly packed cell layers between the inner and outer root sheaths, showing no significant differences. By day 9, WT mice began to show increased hair follicle length, enlarged dermal papilla, and the thickened dermis, indicating a transition to anagen, whereas Fgf21/ mice remained in telogen with shorter hair follicles and shrunken dermal papilla. By day 11, most hair follicles in WT mice had extended downward close to the adipose layer, with increased dermal thickness and dermal papilla enlargement, confirming their entry into the anagen phase. In contrast, Fgf21/ mice only began to extend their follicles into the dermis and indicated a transition to the anagen phase. By day 13, both groups exhibited increased follicle length and dermal thickening, confirming their eventual progression into the anagen phase. These results indicate that Fgf21 knockout delays the transition from telogen to anagen in hair follicles (Figure 2B).

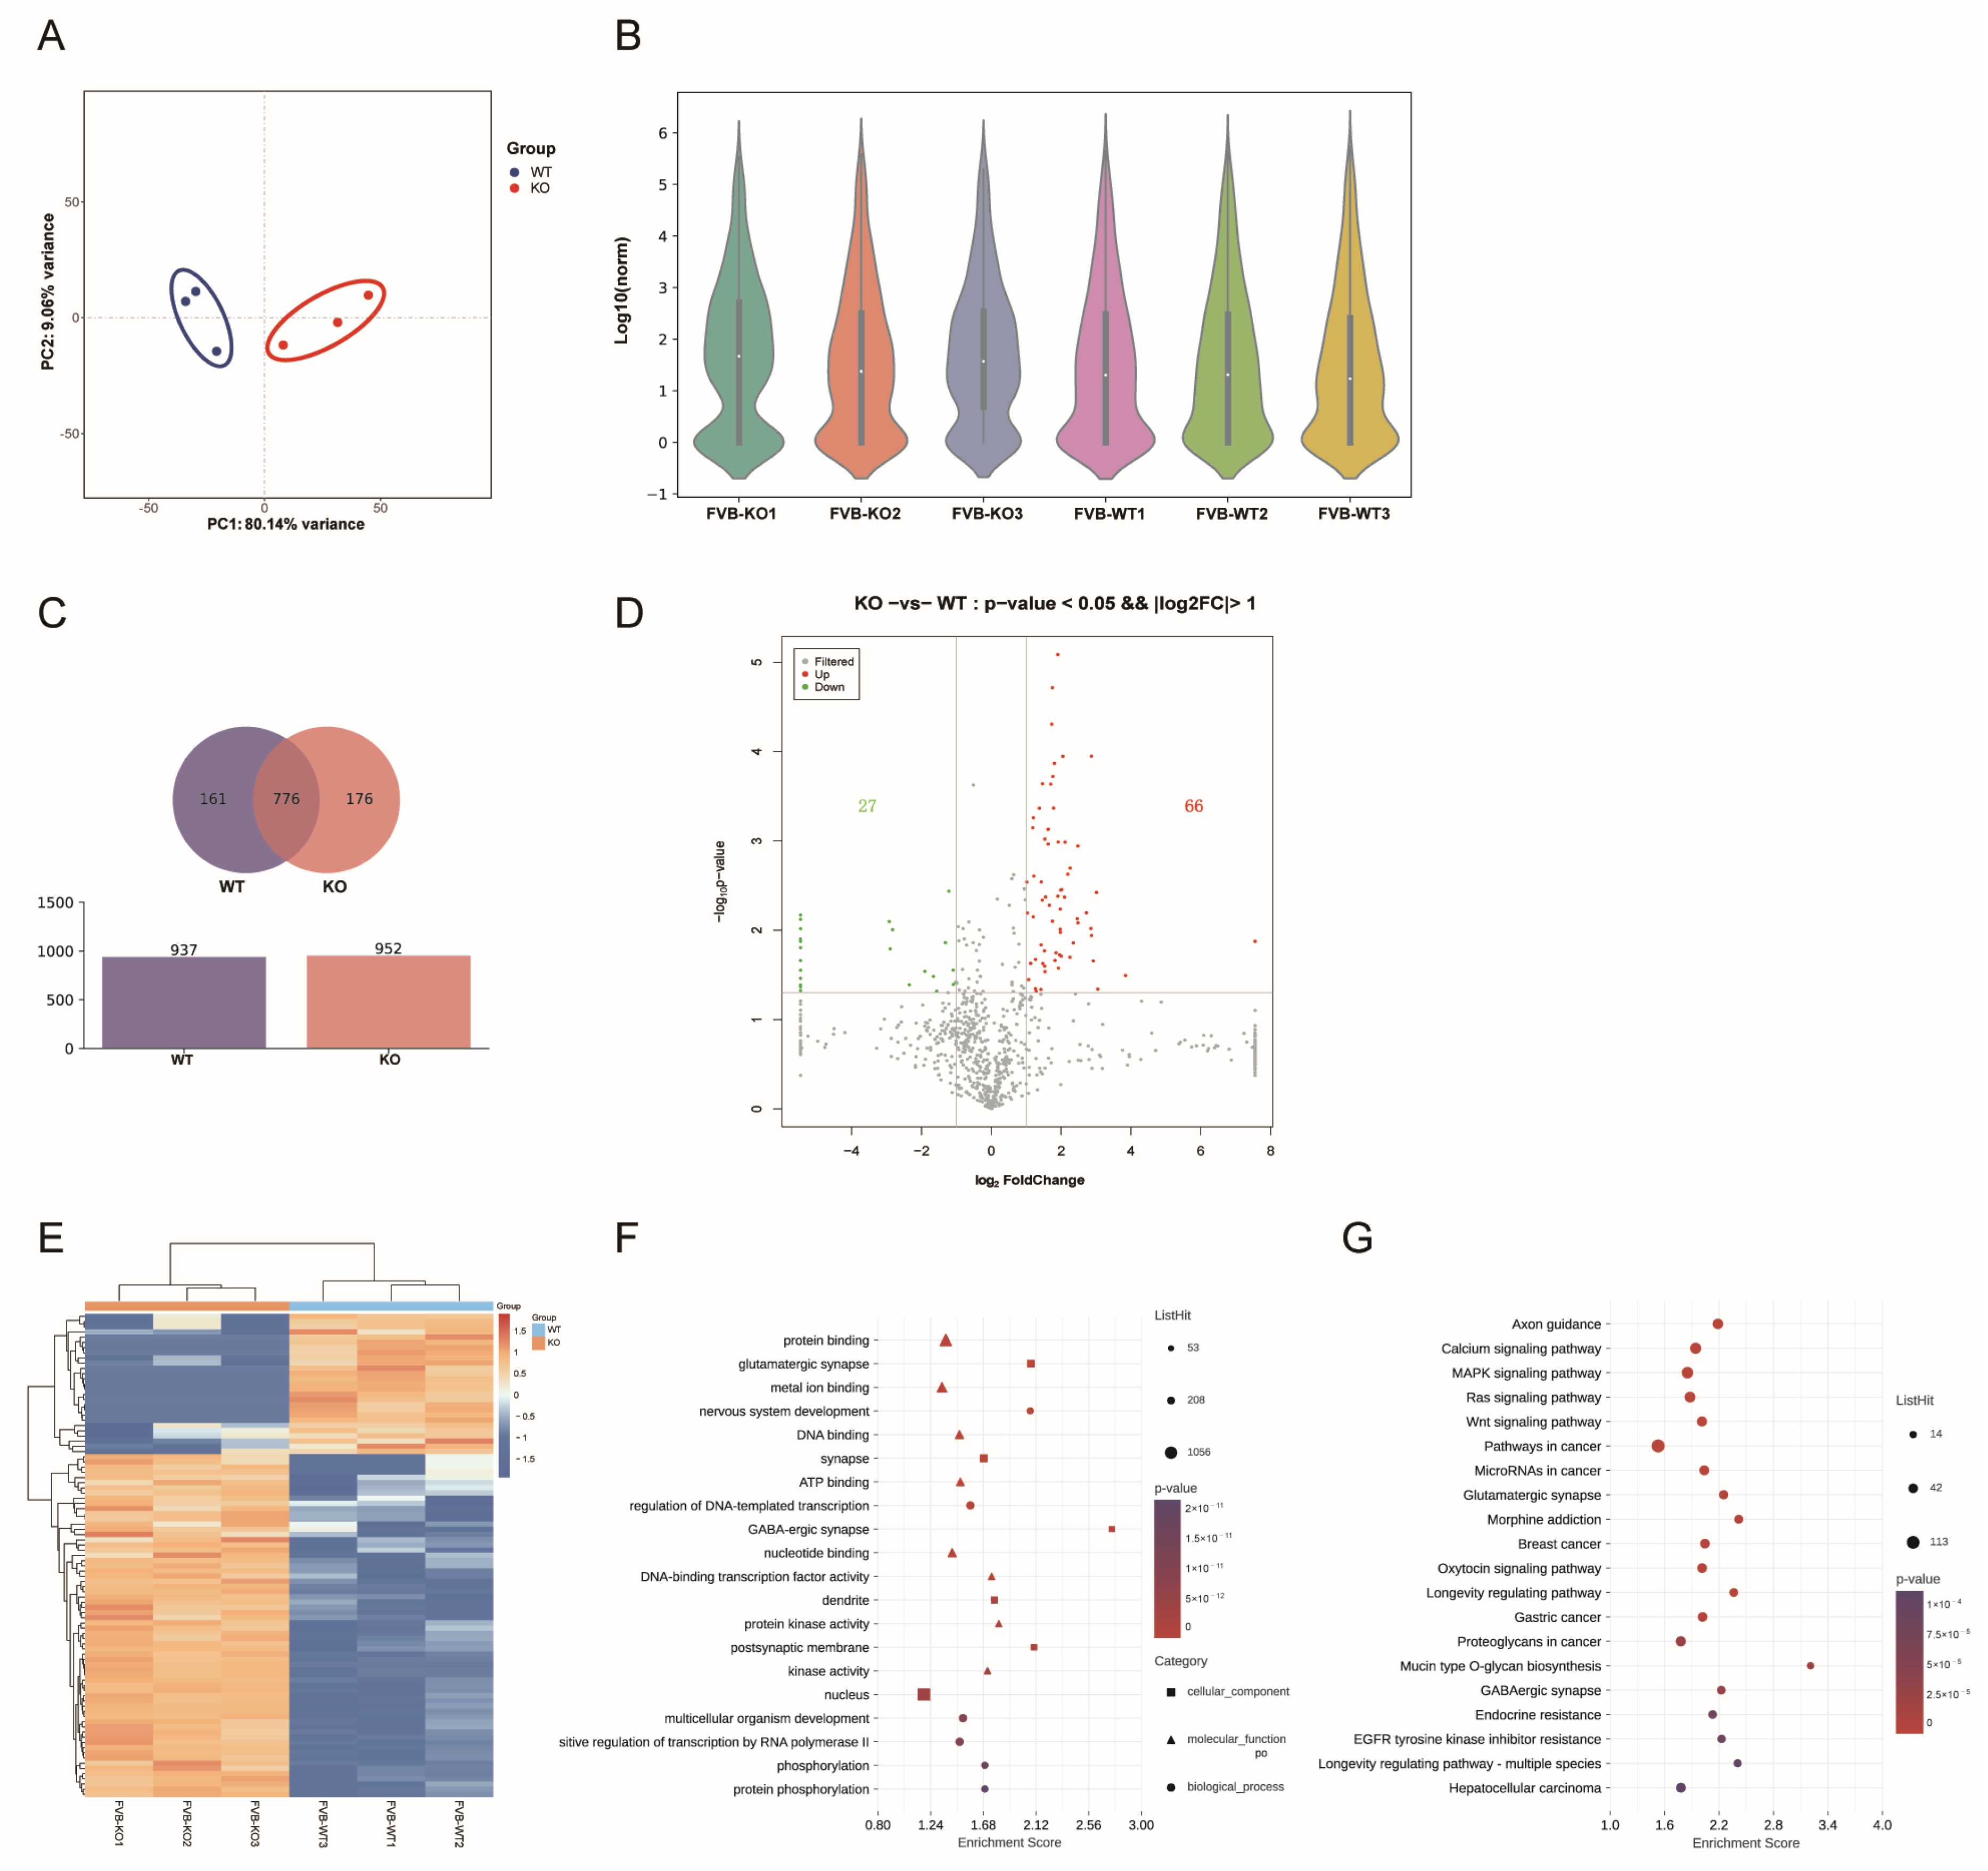
3.2. Expression Analysis and Functional Annotation of miRNAs

To investigate the impact of Fgf21 knockout on hair follicle growth and development, we performed miRNA sequencing of the dorsal skin tissues of Fgf21/ and WT mice, each with three biological replicates per group. After quality control and sequence alignment, we identified 937 miRNAs in the WT group and 952 miRNAs in the Fgf21/ group. Principal component analysis (PCA) revealed distinct differences in miRNA expression between the experimental and control groups, whereas the intra-group samples exhibited high reproducibility, indicating the consistency of experimental operations and reliability of the results (Figure 3A). Violin plots also illustrated the distribution of miRNA expression levels in each sample (Figure 3B).
A Venn diagram analysis of miRNAs from Fgf21/ and WT mice revealed that 776 miRNAs were commonly expressed between the two groups, 176 miRNAs were specifically expressed in the Fgf21/ group, and 161 miRNAs were specifically expressed in the WT group (Figure 3C). A comparative analysis of expression levels between the two groups identified 93 differentially expressed miRNAs, of which 66 were upregulated and 27 were downregulated. Volcano plots and hierarchical clustering heat maps also showed the distribution and clustering of such differentially expressed miRNAs (Figure 3D,E).
To further elucidate the functions of these differentially expressed miRNAs (DEmiRNAs), we performed Gene Ontology (GO) and Kyoto Encyclopedia of Genes and Genomes (KEGG) functional annotation and enrichment analysis of their target gene sets using miRanda 2.066 prediction software. GO analysis revealed that the host genes of the DEmiRNAs were primarily enriched in functions such as protein binding, DNA binding, nucleotide binding, multicellular organismal development, positive regulation of RNA polymerase II transcription, and protein phosphorylation (Figure 3F). KEGG analysis revealed that the target genes of DEmiRNAs were associated with several key signaling pathways during hair follicle development, including the MAPK signaling pathway, Ras signaling pathway, and Wnt signaling pathway (Figure 3G). These results suggest that miRNAs are likely involved in the molecular pathways of hair follicle development by regulating their target gene expression.

3.3. Clustering Analysis and Expression Level Detection of Hair Follicle-Related miRNAs

To further explore the effects of Fgf21 knockout on the expression of hair follicle-related miRNAs, we identified 10 miRNAs associated with hair follicle growth and development and performed clustering analysis on their expression levels (Figure 4A). The clustering heatmap revealed distinct miRNAs expression patterns between the two groups. Specifically, miR-423-5p and miR-186-5p were downregulated in Fgf21/ mice, whereas miR-409-5p, miR-127-3p, miR-134-5p, miR-381-3p, miR-152-3p, miR-434-5p, miR-369-3p, and miR-136-5p were upregulated. These results indicate that there are significant differences in miRNA expression levels between the dorsal skin tissues of WT and Fgf21/ mice.
To validate the accuracy of the miRNA sequencing results, we performed RT-qPCR analysis and selected miRNAs using U6 as an endogenous reference miRNA. The RT-qPCR results showed that the expression levels of miR-409-5p, miR-127-3p, miR-134-5p, miR-381-3p, miR-152-3p, miR-434-5p, miR-369-3p, and miR-136-5p were upregulated in Fgf21/ mice, whereas those of miR-186-5p and miR-423-5p were downregulated (Figure 4B–K). These findings are consistent with the trends observed in the sequencing data. These results further confirmed the role of Fgf21 in modulating the expression of hair follicle-related miRNAs.

3.4. Clustering Analysis and Network Construction of Target Genes

To elucidate the molecular mechanisms by which Fgf21 knockout influences hair follicle growth and development, we identified target genes for the 10 hair follicle-related miRNAs and performed GO and KEGG functional enrichment analysis. GO functional enrichment analysis revealed that the target genes are primarily involved in biological processes including regulation of transcription from the RNA polymerase II promoter, protein phosphorylation, and regulation of transcription from the DNA template. Subcellular localization analysis showed that the target genes were predominantly located in the cytoplasm, nucleus, and plasma membrane. In terms of molecular function, the target genes were primarily involved in binding to proteins, ATP, and DNA, as well as with protease activation (Figure 5A). KEGG pathway enrichment analysis indicated that the target genes were enriched in pathways related to signal transduction, cancer, and nervous, endocrine, and immune systems (Figure 5B).
By combining literature reports, we selected hair follicle-related target genes for GO and KEGG enrichment analyses. GO analysis revealed that these target genes are primarily enriched in biological processes such as protein binding, homologous protein binding, and the regulation of transcription from RNA polymerase II promoter, as well as in cellular components like the cytoplasm and nucleus. Consequently, we constructed a miRNAs–GO–target gene network association diagram (Figure 5C). KEGG analysis showed that these target genes were significantly enriched in hair follicle development-related pathways, including the Wnt signaling pathway, SNARE interactions in vesicular transport, ABC transporters, protein processing in the endoplasmic reticulum, the Notch signaling pathway, ubiquitin-mediated proteolysis, and the MAPK signaling pathway. We also constructed a miRNAs–KEGG–target gene network association diagram (Figure 5D). These network diagrams highlight the potential molecular processes through which Fgf21 may regulate hair follicle growth and development through miRNAs, providing new insights into the molecular basis of this process. Thus, miRNAs may serve as a potential therapeutic target for follicle-related diseases.

3.5. Functional Implications of miRNAs in Hair Follicle Development

To identify the potential target genes influenced by Fgf21 knockout, we used three prediction tools—TargetScan, miRanda, and miRDB—to predict target genes for the 10 hair follicle-related miRNAs (Figure 6A). By comparing the prediction results from these tools, we identified miR-134-5p and miR-136-5p as the miRNAs with the highest number of predicted target genes among the three software programs. Specifically, miR-134-5p had 39 predicted target genes, while miR-136-5p had 90. To further validate these findings, we constructed Venn diagrams to visualize the intersection of these target gene predictions for further experimental analysis (Figure 6B).
For miR-134-5p, we selected six high-scoring target genes associated with hair follicle development from the 39 predicted targets for dual-luciferase reporter assays. The results showed that Banf1, Golm1, Tspan18, Zmat2, and Antxr1 did not significantly interact with miR-134-5p (Figure 6C). However, Vezf1 showed a significant reduction in luciferase activity when co-transfected with miR-134-5p mimics compared to the negative control (NC) mimics (Figure 6D). Mutation assays further confirmed that Vezf1 is a target gene of miR-134-5p, as the mutant Vezf1 vector showed no significant changes in luciferase activity when co-transfected with miR-134-5p mimics and NC mimics (Figure 6E).
For miR-136-5p, we selected eight target genes that not only scored highly in the bioinformatics prediction but also have relevance to hair follicle growth. The results showed that Sumo2, Braf, Cbx4, Ppp2r2a, Yes1, Pcdh19, and Sema4c did not show significant interactions with miR-136-5p (Figure 6F). In contrast, Map3k1 exhibited a significant reduction in luciferase activity when co-transfected with miR-136-5p mimics compared to NC mimics (Figure 6G). Mutation assays further confirmed that Map3k1 is a target gene of miR-136-5p, as the mutant Map3k1 vector did not show significant changes in luciferase activity when co-transfected with miR-136-5p mimics and NC mimics (Figure 6H).

3.6. Fgf21 Regulates Expression and Localization of Vezf1 and Map3k1 in the Hair Follicle Growth Cycle

To characterize the hair follicle growth cycle, we examined the dorsal skin tissues of mice on postnatal day 5 (P5), 16 (P16), and 20 (P20). We observed the distribution of hair follicles with enlarged dermal papilla regions at P5 within the dermis and subcutaneous tissue, which is a feature of the anagen phase. At P16, the hair follicles extended through the epidermis, dermis, and subcutaneous tissue, with hair shafts reaching the epidermal surface, indicative of the catagen phase. Hair follicles were reduced in size and in a resting state at P20, which is a characteristic of the telogen phase. Therefore, we, respectively, define P5, P16, and P20 as the anagen, catagen, and telogen phases. These observations were consistent with the findings of Müller-Röver et al. [21] (Figure 7A).
Immunofluorescence staining was performed to detect the expression of the apoptosis marker BCL2 and the proliferation marker KI67, with quantification via ImageJ 1.45. During the anagen phase, KI67 exhibited the highest expression levels in hair follicle stem cells and throughout the hair follicle, while BCL2 was significantly expressed in the outer root sheath. In the catagen phase, KI67 expression was attenuated, and BCL2 expression was highest in both the outer and inner root sheaths. During the telogen phase, the expression levels of both KI67 and BCL2 were low (Figure 7B–D).
The expression levels and protein localization of Vezf1 and Map3k1 during the natural growth cycle of hair follicles in WT and Fgf21/ mice were examined using immunofluorescence staining and quantified via Image J. During the anagen phase, VEZF1 and MAP3K1 were expressed in the outer root sheath and inner root sheath of hair follicles. During the catagen phase, VEZF1 was expressed in the hair shaft, inner root sheath, and outer root sheath of hair follicles in Fgf21/ mice, with higher expression levels than WT mice. MAP3K1 was expressed in the outer and inner root sheaths of both WT and Fgf21/ mice. During the telogen phase, VEZF1 was predominantly expressed in the hair shaft of WT mice, whereas MAP3K1 was mainly expressed in the outer root sheath and the hair shaft of WT mice (Figure 7E–H).
RT-qPCR analysis revealed that during the anagen phase, Vezf1 and Map3k1 expression levels were not significantly different between WT and Fgf21/ mice (p > 0.05). However, in the catagen phase, Vezf1 expression in Fgf21/ mice was 2.27 times higher than in WT mice, while Map3k1 expression level was 8.3 times higher (p < 0.05). During the telogen phase, Vezf1 expression levels in Fgf21/ mice were 0.51 times lower than those in WT mice (Figure 7I,J), while the Map3k1 expression level was 0.5 times lower (p < 0.005). These results indicate that Fgf21 knockout alters the expression patterns, including the localization and expression levels, of VEZF1 and MAP3K1 during the hair follicle growth cycle, suggesting that Fgf21 may regulate hair follicle growth and cycle transition by modulating the expression of these genes.

4. Discussion

The hair follicle growth cycle, comprising the anagen, catagen, and telogen phases, is a complex and dynamic physiological process regulated by multiple signaling pathways. The FGF family plays crucial roles in the regulation of hair follicle growth and development. Specifically, the interaction between FGF and Wnt signaling pathways in the dermal papilla regulates the duration of the anagen phase through positive and negative feedback loops [12]. Fgf7, secreted by dermal papilla cells (DPCs), promotes the proliferation of DPCs and hair follicle stem cells via the Wnt signaling pathway and induces hair follicle stem cell (HFSC) differentiation [22]. Additionally, Fgf1 and Fgf2 promote hair growth, while Fgf5 induces catagen formation and reduces hair length. Fgf12 is expressed in the outer root sheath cells during anagen, and its knockdown delays the transition from telogen to anagen in mice and reduces the length of whisker hair follicle, whereas overexpression of Fgf12 increases the migration of the outer root sheath cells [23]. Fgf21, a relatively new member of the FGF family, produces a secreted protein [24]; however, its role in the hair follicle growth cycle has not yet been fully explored. In this study, we generated a Fgf21/ mouse model using the CRISPR/Cas9 system and performed high-throughput miRNA sequencing on the dorsal skin tissues of WT and Fgf21/ mice, identifying 93 differentially expressed miRNAs. We further selected 10 hair follicle-related miRNAs (miR-409-5p, miR-127-3p, miR-134-5p, miR-381-3p, miR-152-3p, miR-434-5p, miR-369-3p, miR-136-5p, miR-186-5p, and miR-423-5p) and validated their expression using RT-qPCR; the results were consistent with the sequencing data. Through synchronized hair follicle cycle experiments, we observed a delayed transition from telogen to anagen in Fgf21/ mice, indicating a crucial role for Fgf21 in the regulation of the hair follicle growth cycle. Liu et al. demonstrated that, compared to WT mice, Fgf21/ mice exhibit a slower hair regrowth rate, a significant reduction in hair shaft density, and markedly decreased expression levels of Erk and Akt [25]. Our findings reveal the role of Fgf21 in the hair follicle growth cycle, though the specific mechanisms require further investigation.
Vezf1, a zinc-finger transcription factor, is specifically expressed in vascular endothelial cells and plays a critical role in vascular development [26]. Liang et al. demonstrated that reduced expression of Vezf1 can disrupt the expression of genes related to vascular endothelial cells in human induced pluripotent stem cells (iPSCs) [27]. Consequently, iPSCs regulated by miR-495 exhibited upregulated Vezf1 expression, thereby promoting the proliferation of vascular endothelial cells [27]. Kuschnerus et al. found that miR-483-3p reduces Vezf1 expression, leading to increased apoptosis of vascular endothelial cells and diminished regenerative capacity mediated by M2 macrophages [28]. These findings suggest that Vezf1 may be regulated by multiple miRNAs, forming a complex regulatory network. In this study, we identified a targeting relationship between miR-134-5p and Vezf1, suggesting that miR-134-5p may influence Vezf1 expression in a manner distinct from miR-495 and miR-483-3p, thereby affecting the proliferation and regenerative capacity of vascular endothelial cells. Fgf21 regulates Vezf1 expression during the hair follicle cycle. Research shows Vezf1 can indirectly influence the VEGF pathway by regulating VEGF receptor expression. For example, Vezf1, with Etv2, activates Flt1 transcription [29]. Flt1, a major VEGF receptor, when upregulated, boosts VEGF signaling, promoting angiogenesis [30]. Vascular endothelial growth factor (VEGF), also known as the “vascular permeability factor”, is overexpressed in the outer root sheath keratinocytes of hair follicles, promoting the formation of perifollicular vasculature and enhancing hair regeneration [31]. Our study shows that Fgf21 plays a key role in regulating the hair follicle cycle. It likely modulates metabolic and proliferative processes via the FGF family, suggesting it may share functional similarities with VEGF in promoting hair follicle development. We observed that VEZF1 protein was present in the outer root sheath of WT mice during telogen, but absent in Fgf21/ mice. Since Vezf1 is essential for vascular development in mice [32], it may function similarly to VEGF by enhancing blood supply, thereby promoting hair follicle growth and development. Miyashita et al. showed that Vezf1 regulates the proliferation, formation, and migration of endothelial cells during vascular development [33]. Hair follicles, as skin appendages, rely on the vascular network of the dermal papilla to supply nutrients. In this study, we found that VEZF1 was expressed in the dermal papilla of WT mice during anagen and telogen, whereas no expression was detected in Fgf21/ mice. This suggests that Fgf21 deficiency may lead to the absence of Vezf1, thereby affecting proliferation and reconstruction of the vascular network in the dermal papilla. This, in turn, reduces the nutrient supply from the blood to the hair follicle, delaying the transition of hair follicles from telogen to anagen.
Map3k1, a member of the mitogen-activated protein kinase kinase kinase (MAP3K) family, plays a crucial role in cell proliferation and apoptosis. Research by Andrew Parker et al. has shown that Map3k1 regulates keratinocyte migration and actin stress fiber formation via the JNK signaling pathway, while also independently modulating cell proliferation and apoptosis through this pathway [34]. In our study, we observed a significant accumulation of MAP3K1 protein in the outer and inner root sheaths of hair follicles during the catagen phase in both WT and Fgf21/ mice. Based on Parker’s findings, we speculated that Map3k1 regulates apoptosis in hair follicle cells via the JNK signaling pathway during catagen. Epithelial–mesenchymal transition (EMT) is a key cellular process. Chang et al. demonstrated that Map3k1 is a target gene of miR-145-5p and that its overexpression negatively regulates miR-145-5p expression through the JNK signaling pathway, thereby inhibiting EMT in non-small cell lung cancer cells [35]. In this study, we validated the targeting relationship between miR-136-5p and Map3k1, suggesting that miR-136-5p may negatively regulate Map3k1 through the JNK signaling pathway, thereby affecting hair follicle growth and development. But it is uncertain whether this process depends on the regulation of the Fgf21. Sennett et al. demonstrated that the EMT between dermal cells and epithelial stem cells influences hair follicle induction and formation [1]. During the anagen phase of the hair follicle growth cycle, the interaction between mesenchymal dermal papilla cells and epithelial matrix cells induces hair shaft formation [1]. The hair shaft is formed by rapidly proliferating and differentiating matrix cells that further differentiate and migrate to form the inner root sheath, thereby determining the shape of the hair [36]. In our study, the MAP3K1 protein was detected in the hair bulb, outer root sheath, and inner root sheath of hair follicles during the anagen phase in both WT and Fgf21/ mice. However, during telogen, MAP3K1 expression levels were reduced in Fgf21/ mice. This suggests that Fgf21 deficiency may lead to decreased Map3k1 expression, thereby affecting the differentiation and migration of matrix cells and ultimately influencing the transition from telogen to anagen phase in hair follicles.
In summary, our data show that Fgf21 gene regulation leads to significant changes in the expression levels and protein localization of its target genes, Vezf1 and Map3k1, within hair follicles. However, the exact mechanisms by which Vezf1 and Map3k1 regulate hair follicle development are still unknown. Consequently, our next study will focus on investigating the specific functions of Vezf1 and Map3k1 in hair follicles.

5. Conclusions

Fgf21 knockout delays the transition from telogen to anagen in hair follicles. Dual-luciferase assays confirm that miR-134-5p directly targets Vezf1 and miR-136-5p targets Map3k1. We found that the expression levels and protein localization of the target genes Vezf1 and Map3k1 in hair follicles were significantly altered by Fgf21 treatment. The findings demonstrate that Fgf21 modulates miRNA expression profiles to regulate hair follicle development, providing theoretical insights for hair follicle biology research and the clinical management of hair growth disorders (Figure 8).

Supplementary Materials

The following supporting information can be downloaded at: https://www.mdpi.com/article/10.3390/biology14050526/s1, Figure S1: The Genotype identification of WT and Fgf21/ mice results. The band labeled “−/−” represents the Fgf21 knock out mice (634 bp). “WT” represents wild-type mice (743 bp). Experiments were repeated three times, and the results were consistent; Table S1: The information on the sequences of the primers used in this study.

Author Contributions

Y.L., Y.A. and X.G. formulated the experimental design. Y.L., Y.A., X.X. and T.U. conducted the experiments. Y.A., X.X. and Y.L. analyzed the data. Y.L. drafted the manuscript. Y.L. and Y.A. generated data handling and image analysis. D.L. provided general advice and revised the manuscript. All authors have read and agreed to the published version of the manuscript.

Funding

This research was funded by the National Natural Science Foundation of China (grant number U23A20226), the Science and Technology Major Project of the Inner Mongolia Autonomous Region of China to the State Key Laboratory of Reproductive Regulation and Breeding of Grassland Livestock (grant number 2021ZD0048), and the Science and Technology Plan Project of the Inner Mongolia Autonomous Region of China (grant number 2023KYPT0014).

Institutional Review Board Statement

The animal study was reviewed and approved on 10 December 2020 by the Experimental Animal Center, Institutional Animal Care and Use Committee of Inner Mongolia University (IMU-Mouse-2020-047). All animal experiments were conducted in strict accordance with the Guidelines for the Management and Use of Laboratory Animals established by the Laboratory Animal Research Center of Inner Mongolia University (SYXK2020-0006). The animal experiments in this study were approved and authorized by the BioethicsCommittee of Inner Mongolia University.

Informed Consent Statement

Not applicable.

Data Availability Statement

The original contributions presented in this study are included in the article/Supplementary Materials. Further inquiries can be directed to the corresponding author.

Acknowledgments

We gratefully acknowledge the laboratory members for their suggestions and critical reading of the manuscript. We would like to acknowledge the BIORender website for creating the experimental process charts and summary figure.

Conflicts of Interest

The authors declare that they have no competing interests.

Abbreviations

The following abbreviations are used in this manuscript:
ANOVAone-way analysis of variance
DPCdermal papilla cell
EMTepithelial–mesenchymal transition
FGFfibroblast growth factor
Fgf21fibroblast growth factor 21
FV1bfriend virus susceptibility 1b
FVBfriend virus B-type
GOgene ontology
H&Ehematoxylin and eosin
HFSChair follicle stem cell
iPSCinduced pluripotent stem cell
KEGGKyoto Encyclopedia of Genes and Genomes
Map3k1mitogen-activated protein kinase kinase kinase 1
miRNAmicroRNA
NCnegative control
PCAprincipal component analysis
RT-qPCRreal-time quantitative PCR
shhsonic hedgehog
TPMtranscripts per million
VEGFvascular endothelial growth factor
Vezf1vascular endothelial zinc finger 1
WTwild-type

References

  1. Sennett, R.; Rendl, M. Mesenchymal-epithelial interactions during hair follicle morphogenesis and cycling. Semin. Cell Dev. Biol. 2012, 23, 917–927. [Google Scholar] [CrossRef] [PubMed]
  2. Fan, S.M.; Tsai, C.F.; Yen, C.M.; Lin, M.H.; Wang, W.H.; Chan, C.C.; Chen, C.L.; Phua, K.K.L.; Pan, S.H.; Plikus, M.V.; et al. Inducing hair follicle neogenesis with secreted proteins enriched in embryonic skin. Biomaterials 2018, 167, 121–131. [Google Scholar] [CrossRef] [PubMed]
  3. Wang, X.; Liu, Y.; He, J.; Wang, J.; Chen, X.; Yang, R. Regulation of signaling pathways in hair follicle stem cells. Burn. Trauma 2022, 10, tkac022. [Google Scholar] [CrossRef]
  4. Kumar, V.; Goutam, R.S.; Park, S.; Lee, U.; Kim, J. Functional Roles of FGF Signaling in Early Development of Vertebrate Embryos. Cells 2021, 10, 2148. [Google Scholar] [CrossRef]
  5. Goutam, R.S.; Kumar, V.; Lee, U.; Kim, J. Exploring the Structural and Functional Diversity among FGF Signals: A Comparative Study of Human, Mouse, and Xenopus FGF Ligands in Embryonic Development and Cancer Pathogenesis. Int. J. Mol. Sci. 2023, 24, 7556. [Google Scholar] [CrossRef] [PubMed]
  6. Kimura-Ueki, M.; Oda, Y.; Oki, J.; Komi-Kuramochi, A.; Honda, E.; Asada, M.; Suzuki, M.; Imamura, T. Hair cycle resting phase is regulated by cyclic epithelial FGF18 signaling. J. Investig. Dermatol. 2012, 132, 1338–1345. [Google Scholar] [CrossRef]
  7. Krugluger, W.; Stiefsohn, K.; Moser, K.; Moser, C.; Laciak, K. Evaluation of Gene Expression Patterns in Micrografts Demonstrate Induction of Catagen-Like Processes During Storage. Dermatol. Surg. 2017, 43, 275–280. [Google Scholar] [CrossRef]
  8. Mok, K.W.; Saxena, N.; Heitman, N.; Grisanti, L.; Srivastava, D.; Muraro, M.J.; Jacob, T.; Sennett, R.; Wang, Z.; Su, Y.; et al. Dermal Condensate Niche Fate Specification Occurs Prior to Formation and Is Placode Progenitor Dependent. Dev. Cell 2019, 48, 32–48.e35. [Google Scholar] [CrossRef]
  9. Biggs, L.C.; Mäkelä, O.J.; Myllymäki, S.M.; Das Roy, R.; Närhi, K.; Pispa, J.; Mustonen, T.; Mikkola, M.L. Hair follicle dermal condensation forms via Fgf20 primed cell cycle exit, cell motility, and aggregation. Elife 2018, 7, e36468. [Google Scholar] [CrossRef]
  10. Jia, Q.; Zhang, S.; Wang, D.; Liu, J.; Luo, X.; Liu, Y.; Li, X.; Sun, F.; Xia, G.; Zhang, L. Regulatory Effects of FGF9 on Dermal Papilla Cell Proliferation in Small-Tailed Han Sheep. Genes 2023, 14, 1106. [Google Scholar] [CrossRef]
  11. Petiot, A.; Conti, F.J.; Grose, R.; Revest, J.M.; Hodivala-Dilke, K.M.; Dickson, C. A crucial role for Fgfr2-IIIb signalling in epidermal development and hair follicle patterning. Development 2003, 130, 5493–5501. [Google Scholar] [CrossRef]
  12. Harshuk-Shabso, S.; Dressler, H.; Niehrs, C.; Aamar, E.; Enshell-Seijffers, D. Fgf and Wnt signaling interaction in the mesenchymal niche regulates the murine hair cycle clock. Nat. Commun. 2020, 11, 5114. [Google Scholar] [CrossRef] [PubMed]
  13. Mukhopadhyay, A.; Krishnaswami, S.R.; Cowing-Zitron, C.; Hung, N.J.; Reilly-Rhoten, H.; Burns, J.; Yu, B.D. Negative regulation of Shh levels by Kras and Fgfr2 during hair follicle development. Dev. Biol. 2013, 373, 373–382. [Google Scholar] [CrossRef] [PubMed]
  14. Kawano, M.; Komi-Kuramochi, A.; Asada, M.; Suzuki, M.; Oki, J.; Jiang, J.; Imamura, T. Comprehensive analysis of FGF and FGFR expression in skin: FGF18 is highly expressed in hair follicles and capable of inducing anagen from telogen stage hair follicles. J. Investig. Dermatol. 2005, 124, 877–885. [Google Scholar] [CrossRef]
  15. Nishimura, T.; Nakatake, Y.; Konishi, M.; Itoh, N. Identification of a novel FGF, FGF-21, preferentially expressed in the liver. Biochim. Biophys. Acta 2000, 1492, 203–206. [Google Scholar] [CrossRef]
  16. Katoh, M.; Katoh, M. Evolutionary conservation of CCND1-ORAOV1-FGF19-FGF4 locus from zebrafish to human. Int. J. Mol. Med. 2003, 12, 45–50. [Google Scholar] [CrossRef]
  17. Liu, Z.; Yang, F.; Zhao, M.; Ma, L.; Li, H.; Xie, Y.; Nai, R.; Che, T.; Su, R.; Zhang, Y.; et al. The intragenic mRNA-microRNA regulatory network during telogen-anagen hair follicle transition in the cashmere goat. Sci. Rep. 2018, 8, 14227. [Google Scholar] [CrossRef]
  18. Li, Y.H.; Zhang, K.; Ye, J.X.; Lian, X.H.; Yang, T. Wnt10b promotes growth of hair follicles via a canonical Wnt signalling pathway. Clin. Exp. Dermatol. 2011, 36, 534–540. [Google Scholar] [CrossRef]
  19. Guo, M.; Jiang, J.; Zhang, A.; Yu, W.; Huang, X. Cholesterol promotes hair growth through activating sympathetic nerves and enhancing the proliferation of hair follicle stem cells. Mol. Med. 2025, 31, 86. [Google Scholar] [CrossRef]
  20. Veselá, B.; Matalová, E. Expression of apoptosis-related genes in the mouse skin during the first postnatal catagen stage, focused on localization of Bnip3L and caspase-12. Connect. Tissue Res. 2015, 56, 326–335. [Google Scholar] [CrossRef]
  21. Müller-Röver, S.; Handjiski, B.; van der Veen, C.; Eichmüller, S.; Foitzik, K.; McKay, I.A.; Stenn, K.S.; Paus, R. A comprehensive guide for the accurate classification of murine hair follicles in distinct hair cycle stages. J. Investig. Dermatol. 2001, 117, 3–15. [Google Scholar] [CrossRef] [PubMed]
  22. Wang, N.; Zhang, W.-d.; Zhong, Z.-y.; Zhou, X.-b.; Shi, X.-r.; Wang, X. FGF7 secreted from dermal papillae cell regulates the proliferation and differentiation of hair follicle stem cell1. J. Integr. Agric. 2023, in press. [Google Scholar] [CrossRef]
  23. Woo, J.; Suh, W.; Sung, J.H. Hair Growth Regulation by Fibroblast Growth Factor 12 (FGF12). Int. J. Mol. Sci. 2022, 23, 9467. [Google Scholar] [CrossRef] [PubMed]
  24. Flippo, K.H.; Potthoff, M.J. Metabolic Messengers: FGF21. Nat. Metab. 2021, 3, 309–317. [Google Scholar] [CrossRef]
  25. Liu, X.; Zhang, P.; Zhang, X.; Li, X.; Bai, Y.; Ao, Y.; Hexig, B.; Guo, X.; Liu, D. Fgf21 knockout mice generated using CRISPR/Cas9 reveal genetic alterations that may affect hair growth. Gene 2020, 733, 144242. [Google Scholar] [CrossRef]
  26. Xiong, J.W.; Leahy, A.; Lee, H.H.; Stuhlmann, H. Vezf1: A Zn finger transcription factor restricted to endothelial cells and their precursors. Dev. Biol. 1999, 206, 123–141. [Google Scholar] [CrossRef]
  27. Liang, J.; Huang, W.; Cai, W.; Wang, L.; Guo, L.; Paul, C.; Yu, X.Y.; Wang, Y. Inhibition of microRNA-495 Enhances Therapeutic Angiogenesis of Human Induced Pluripotent Stem Cells. Stem Cells 2017, 35, 337–350. [Google Scholar] [CrossRef]
  28. Kuschnerus, K.; Straessler, E.T.; Müller, M.F.; Lüscher, T.F.; Landmesser, U.; Kränkel, N. Increased Expression of miR-483-3p Impairs the Vascular Response to Injury in Type 2 Diabetes. Diabetes 2019, 68, 349–360. [Google Scholar] [CrossRef]
  29. Das, S.; Gupta, V.; Bjorge, J.; Shi, X.; Gong, W.; Garry, M.G.; Garry, D.J. ETV2 and VEZF1 interaction and regulation of the hematoendothelial lineage during embryogenesis. Front. Cell Dev. Biol. 2023, 11, 1109648. [Google Scholar] [CrossRef]
  30. Wang, F.; Yamauchi, M.; Muramatsu, M.; Osawa, T.; Tsuchida, R.; Shibuya, M. RACK1 regulates VEGF/Flt1-mediated cell migration via activation of a PI3K/Akt pathway. J. Biol. Chem. 2011, 286, 9097–9106. [Google Scholar] [CrossRef]
  31. Yano, K.; Brown, L.F.; Detmar, M. Control of hair growth and follicle size by VEGF-mediated angiogenesis. J. Clin. Investig. 2001, 107, 409–417. [Google Scholar] [CrossRef] [PubMed]
  32. Kuhnert, F.; Campagnolo, L.; Xiong, J.W.; Lemons, D.; Fitch, M.J.; Zou, Z.; Kiosses, W.B.; Gardner, H.; Stuhlmann, H. Dosage-dependent requirement for mouse Vezf1 in vascular system development. Dev. Biol. 2005, 283, 140–156. [Google Scholar] [CrossRef] [PubMed]
  33. Miyashita, H.; Kanemura, M.; Yamazaki, T.; Abe, M.; Sato, Y. Vascular endothelial zinc finger 1 is involved in the regulation of angiogenesis: Possible contribution of stathmin/OP18 as a downstream target gene. Arterioscler. Thromb. Vasc. Biol. 2004, 24, 878–884. [Google Scholar] [CrossRef]
  34. Parker, A.; Cross, S.H.; Jackson, I.J.; Hardisty-Hughes, R.; Morse, S.; Nicholson, G.; Coghill, E.; Bowl, M.R.; Brown, S.D. The goya mouse mutant reveals distinct newly identified roles for MAP3K1 in the development and survival of cochlear sensory hair cells. Dis. Models Mech. 2015, 8, 1555–1568. [Google Scholar] [CrossRef]
  35. Chang, Y.; Yan, W.; Sun, C.; Liu, Q.; Wang, J.; Wang, M. miR-145-5p inhibits epithelial-mesenchymal transition via the JNK signaling pathway by targeting MAP3K1 in non-small cell lung cancer cells. Oncol. Lett. 2017, 14, 6923–6928. [Google Scholar] [CrossRef]
  36. Paus, R.; Cotsarelis, G. The biology of hair follicles. N. Engl. J. Med. 1999, 341, 491–497. [Google Scholar] [CrossRef]
Figure 1. Diagram of the dual-luciferase reporter assay.
Biology 14 00526 g001
Figure 2. Effects of Fgf21 knockout on hair follicle cycle transition. (A) Time-series images showing the dorsal skin and hair development in WT and Fgf21/ mice from day 1 (P1) to 21 (P21) post-depilation. (B) H&E staining illustrating hair follicle structures in WT and Fgf21/ mice on day 7 (7 d); day 9 (9 d); day 11 (11 d); and day 13 (13 d) post-depilation. Scale bar = 1000 μm.
Biology 14 00526 g002
Figure 3. Expression analysis and functional annotation of miRNAs. (A) PCA plot of the distribution of miRNAs expression in dorsal skin tissues of WT and Fgf21/ mice. (B) Violin plots of the distribution of miRNAs expression in six different samples of WT and Fgf21/ mice. (C) Venn diagram comparing miRNAs expression between WT and Fgf21/ mice. A total of 776 miRNAs were commonly expressed between the two groups, with 176 miRNAs specifically expressed in Fgf21/ mice and 161 miRNAs specifically expressed in WT mice. (D) Volcano plot showing the differentially expressed miRNAs between the two groups. The plot highlights the 66 upregulated and 27 downregulated miRNAs. (E) Hierarchical clustering heatmap of DEmiRNAs, showing the expression patterns of differentially expressed miRNAs in the dorsal skin tissues of WT and Fgf21/ mice. Color gradations indicate relative changes in miRNAs expression levels, with yellow indicating upregulation and blue indicating downregulation. (F) GO functional annotation of target genes of DEmiRNAs. The bubble chart displays the top 20 most significantly enriched GO terms. (G) KEGG pathway enrichment analysis of target genes of DEmiRNAs. The bubble chart displays the top 20 most significantly enriched KEGG pathways.
Biology 14 00526 g003
Figure 4. Effects of Fgf21 knockout on the expression of hair follicle-related miRNAs and validation. (A) Hierarchical clustering heatmap of the expression patterns of 10 hair follicle-related miRNAs in the dorsal skin tissues of WT and Fgf21/ mice. Color changes denote relative changes in miRNA expression levels, with upregulation indicated by red and downregulation indicated by blue. (BK) RT-qPCR results indicating the relative expression levels of specific miRNAs in the dorsal skin tissues of WT and Fgf21/ mice. RT-qPCR results were consistent with the sequencing data trends. * p < 0.05, ** p < 0.01, *** p < 0.005. Each group included three mice, and experiments were repeated three times independently.
Biology 14 00526 g004
Figure 5. Clustering analysis and network construction of target genes. (A) GO functional analysis of target genes. (B) KEGG pathway enrichment of target genes. (C) miRNAs–GO–target gene network showing interactions between miRNAs and their target genes within GO terms. Green nodes represent target genes, purple nodes represent GO terms, and yellow nodes represent miRNAs. Lines indicate regulatory relationships between miRNAs and target genes, as well as associations between target genes and GO terms. (D) miRNAs–KEGG–target gene network showing interactions between miRNAs and their target genes within KEGG pathways. Green nodes represent target genes, purple nodes represent KEGG pathways, and yellow nodes represent miRNAs. Lines indicate regulatory relationships between miRNAs and target genes, as well as associations between target genes and KEGG pathways.
Biology 14 00526 g005
Figure 6. Target gene prediction and dual-luciferase reporter assay. (A) Bar chart shows the number of target genes for 10 miRNAs predicted by TargetScan, miRanda, and miRDB. (B) Venn diagram showing the predicted target genes of miR-134-5p and miR-136-5p, intersected from TargetScan, miRanda, and miRDB. Numbers indicate the number of target genes predicted by each software and their overlaps. (C) Bar chart showing the dual-luciferase reporter assay results for miR-134-5p and its potential target genes Banf1, Golm1, Tspan18, Zmat2, Antxr1, and Vezf1. Blue bars represent the NC mimics group and red bars represent the miR-134-5p mimics group. (D) Bar chart showing the dual-luciferase reporter assay results for Vezf1 3′UTR WT co-transfected with miR-134-5p mimics and Vezf1 3′UTR WT co-transfected with NC mimics. Blue bars represent the NC mimics group and red bars represent the miR-134-5p mimics group. (E) Bar chart showing the dual-luciferase reporter assay results for Vezf1 3′UTR MUT co-transfected with miR-134-5p mimics and Vezf1 3′UTR MUT co-transfected with NC mimics. Blue bars represent the NC mimics group and red bars represent the miR-134-5p mimics group. (F) Bar chart showing the dual-luciferase reporter assay results for miR-136-5p and its potential target genes Sumo2, Braf, Cbx4, Ppp2r2a, Yes1, Pcdh19, Sema4c, and Map3k1. Blue bars represent the NC mimics group and red bars represent the miR-136-5p mimics group. (G) Bar chart showing the dual-luciferase reporter assay results for Map3k1 3′UTR WT co-transfected with miR-136-5p mimics and Map3k1 3′UTR WT co-transfected with NC mimics. Blue bars represent the NC mimics group and red bars represent the miR-136-5p mimics group. (H) Bar chart showing the dual-luciferase reporter assay results for Map3k1 3′UTR MUT co-transfected with miR-136-5p mimics and Map3k1 3′UTR MUT co-transfected with NC mimics. Blue bars represent the NC mimics group and red bars represent the miR-136-5p mimics group. ** p < 0.01, *** p < 0.005. Each experiment was independently repeated three times.
Biology 14 00526 g006
Figure 7. Identification of the hair follicle growth cycle and the effects of Fgf21 on target gene expression. (A) Histological staining (H&E) showing the hair follicle structures of dorsal skin from P5, P16, and P20 mice. Scale bar = 200 μm. (B) Immunofluorescence staining showing the localization of BCL2 (green) in hair follicles of P5, P16, and P20 mice, with DAPI (blue) used for nuclear staining. Scale bar = 100 μm. (C) Immunofluorescence staining showing the localization of Ki67 (green) in hair follicles of P5, P16, and P20 mice, with DAPI (blue) used for nuclear staining. Scale bar = 100 μm. (D) Bar chart showing the quantification of BCL2 and KI67 fluorescence intensity in WT mice at P5, P16, and P20. (E) Immunofluorescence staining showing the localization of VEZF1 (green) in hair follicles of P5, P16, and P20 WT and Fgf21/ mice, with DAPI (blue) used for nuclear staining. Scale bar = 100 μm. (F) Bar chart showing the quantification of VEZF1 fluorescence intensity in WT and Fgf21/ mice at P5, P16, and P20. (G) Immunofluorescence staining showing the expression of MAP3K1 (green) in hair follicles of P5, P16, and P20 WT and Fgf21/ mice, with DAPI (blue) used for nuclear staining. Scale bar = 100 μm. (H) Bar chart showing the quantification of MAP3K1 fluorescence intensity in WT and Fgf21/ mice at P5, P16, and P20. (I) RT-qPCR analysis of Vezf1 expression in dorsal skin tissues from P5, P16, and P20 mice. (J) RT-qPCR analysis of Map3k1 expression in dorsal skin tissues from P5, P16, and P20 mice. P5, P16, and P20 correspond to postnatal days 5, 16, and 20 in mice, representing the anagen phase, catagen phase, and telogen phase of the hair follicle cycle, respectively. White arrows have been included to highlight protein expression sites throughout the hair follicle cycle. Each group included three mice, and the experiments were independently repeated three times.
Biology 14 00526 g007
Figure 8. Model for regulation of hair follicle cycle by Fgf21-related miRNAs.
Biology 14 00526 g008
Disclaimer/Publisher’s Note: The statements, opinions and data contained in all publications are solely those of the individual author(s) and contributor(s) and not of MDPI and/or the editor(s). MDPI and/or the editor(s) disclaim responsibility for any injury to people or property resulting from any ideas, methods, instructions or products referred to in the content.

