Article

Natural Selection Shaped Codon Usage Patterns in Wheat Dwarf Virus in Triticale

1
College of Ecological Environment and Resources, Qinghai Minzu University, Xining 810007, China
2
State Key Laboratory of Tibetan Medicine Research and Development, Qinghai University, Xining 810016, China
*
Authors to whom correspondence should be addressed.
Biology 2025, 14(5), 524; https://doi.org/10.3390/biology14050524
Submission received: 25 March 2025 / Revised: 20 April 2025 / Accepted: 3 May 2025 / Published: 9 May 2025

Simple Summary

In this study, we set out to explore the codon usage patterns and evolutionary dynamics of the wheat dwarf virus (WDV) in triticale, a crop combining wheat and rye. We analyzed ten WDV isolates, including two from triticale (WDVT), using various metrics such as relative synonymous codon usage (RSCU), effective number of codons (ENC), codon adaptation index (CAI), and codon bias index (CBI). Our results revealed weak codon preference in triticale-derived strains, with hierarchical GC content. Neutrality analysis and ENC-plot distributions indicated natural selection as the dominant force. We identified shared optimal codons UUC and UAC in highly expressed genes, which may play a significant role in virus adaptation. Furthermore, we found that WDVT strains form a distinct cluster with elevated genetic diversity, potentially driven by genomic recombination in the synthetic host. These findings provide a foundation for codon-based antiviral research and the development of agricultural strategies to combat WDV infections.

Abstract

Wheat dwarf virus (WDV) poses significant threats to gramineous crops, making it crucial to explore its codon usage patterns and evolutionary dynamics for effective disease control. This study analyzed ten WDV isolates, including two from triticale (WDVT_117 and WDVT_118), using metrics such as relative synonymous codon usage (RSCU), effective number of codons (ENC), codon adaptation index (CAI), and codon bias index (CBI). Neutrality plots, ENC-plots, and PR2-plots were employed to assess the role of mutation and selection. Results revealed weak codon preference in triticale-derived strains (CAI: 0.145–0.269; CBI: −0.042–0.111; ENC > 40), with hierarchical GC content. Neutrality analysis and ENC-plot distributions indicated natural selection as the dominant force, supported by T/C bias at the third codon position (PR2-plot). Shared optimal codons UUC and UAC in highly expressed genes may imply a potential significant role in virus adaptation. RSCU-based clustering and MP phylogenetic analysis revealed that WDVT strains form a distinct cluster with elevated genetic diversity, potentially driven by genomic recombination in the synthetic host. These findings demonstrate that WDVT balances mutational constraints and host adaptation through selective codon optimization. This study provides a foundation for codon-based antiviral research and the development of agricultural strategies to combat WDV infections.

1. Introduction

Triticale (× Triticosecale Wittm. ex A. Camus) is a crop artificially combined from the genera of wheat (Triticum spp.) and rye (Secale graine) by intergeneric sexual hybridization and doubling of the chromosome number of the hybrids, which has been widely planted all over the world [1,2]. It combines the high yield and high quality of wheat and the disease resistance, strong resistance, and high lysine content of rye, with huge hybrid advantages, and is a high-quality forage crop after alfalfa and forage corn [3,4]. Currently, triticale mainly exists as hexaploid (AABBRR) and octoploid (AABBDDRR) types [5,6]. The hexaploid type is formed by crossing tetraploid wheat (AABB) with rye and then doubling the chromosomes of the F1 hybrid, resulting in 21 pairs of chromosomes, 7 of which come from rye [7]. The octoploid type is created by crossing hexaploid common wheat (AABBDD) with rye and then doubling the chromosomes of the F1 hybrid. Octoploid triticale retains the high yield and seed quality of wheat, as well as the strong stress tolerance and high lysine content of rye, and can adapt to different climates and environmental conditions [3,4,5,6].
Wheat dwarf virus (WDV), a member of the Geminiviridae family and Mastrevirus genus, is a pathogen of gramineous plants transmitted by the leafhopper (Psammotettix alienus) in a persistent, non-propagative manner [8]. It is a twinned icosahedral virus with a circular ssDNA genome that encodes four proteins: V1 (movement protein), V2 (coat protein), and the replication-associated proteins RepA and Rep [8,9]. First found in western Czechoslovakia in 1961 [10], WDV has since been confirmed in Africa, Europe, and Asia [9,11]. It mainly affects gramineous crops like wheat (Triticum aestivum), barley (Hordeum vulgare), oat (Avena sativa), and triticale, causing severe stunting, leaf yellowing, reduced tillering, and significant yield losses [8,11,12].
In the genetic code, 61 codons encode the standard 20 amino acids (with 3 additional codons for termination). Tryptophan and methionine are each encoded by a single codon, while the remaining 18 amino acids are typically encoded by multiple synonymous codons. The usage of synonymous codons is not random, leading to differences in usage frequency, known as synonymous codon usage bias (SCUB) [13,14,15]. SCUB may be caused by various factors during evolution and also serves as a fine-tuning mechanism for gene expression [14,16]. It is widespread in different species, tissues, and genes and is significant for gene expression regulation, genome evolution, and bioinformatics research [15,17,18,19]. For viruses, codon usage bias is closely related to natural selection, mutation pressure, optimal host selection, and drug sensitivity [20,21,22].
The SCUB of WDVT has not been reported to date. To address this gap, this study compared and analyzed the codon usage characteristics and driving factors of two available WDVT genomes, aiming to reveal WDVT’s codon usage bias and explore whether mutation or selection is the main driver of these bias.

2. Materials and Methods

2.1. Acquisition of Genetic Information of WDV in Triticale

This study retrieved the genomic sequences of all publicly available wheat dwarf virus isolates from triticale (WDVT) from the NCBI database (https://www.ncbi.nlm.nih.gov/, accessed on 13 November 2024), totaling two. Additionally, we obtained eight other isolates from diverse hosts and the intermediate vector, the leafhopper (Psammotettix alienus). These eight isolates encompass all currently known and publicly documented host types, including the intermediate host. Table 1 presents the details of these isolates (Table 1).
The GenBank Feature Extractor tool in the Sequence Manipulation Suite (SMS) (https://www.bioinformatics.org/sms2/genbank_feat.html; accessed on 13 November 2024) was used to extract protein coding sequences (coding sequence; CDS) from the wheat dwarf virus genome of wheat rye origin.

2.2. Codon Base Composition Analysis

CUSP software (https://www.bioinformatics.nl/cgi-bin/emboss/cusp, accessed on 14 November 2024) was used to calculate the GC frequencies at the three positions (GC1, GC2, and GC3) of each codon in the coding sequences (CDSs), the average GC frequency at the third position (GCall), and the frequency of GC at the third position of synonymous codons (GC3s). Additionally, the frequencies of each base (A3s, T3s, C3s, and G3s) at the third position of codons in the CDS were calculated using the Condon W1.4.2 software [23].

2.3. Calculation of Codon Usage Indexes

Relative Synonymous Codon Usage (RSCU) measures the usage frequency of a specific synonymous codon relative to its expected frequency [24]. The expected frequency is the average usage of all codons for the amino acid encoded by that codon. An RSCU of 1 indicates no usage preference, while values greater than 1 suggest higher usage frequency and values less than 1 indicate lower usage frequency.
The effective number of codons (ENC) reflects the degree of codon usage bias in a gene, ranging from 20 to 61 [25]. An ENC of 20 means only one codon is used for each amino acid, while an ENC of 61 indicates that all codons are used equally. Lower ENC values signify stronger codon usage bias.
The codon adaptation index (CAI) assesses the similarity between the codon usage of a gene and the optimal codon usage of the host organism, with values ranging from 0 to 1 [26]. A higher CAI value indicates better adaptation of the virus to the host’s codon usage.
The codon bias index (CBI) quantifies the extent to which a gene uses a set of optimal codons [27]. In genes with extreme codon bias, CBI equals 1.0, while in genes with random codon usage, CBI equals 0.0. Negative CBI values can occur due to random variations. CBI reflects the composition of highly expressed codons in a gene and correlates well with ENC values for the host’s own genes, indicating the potential expression level of foreign genes in the host.
The CDS sequences of the two WDVT were combined and analyzed using Condon W1.4.2 to calculate the overall RSCU and generate RSCU bar charts. The RSCU, ENC, CAI, and CBI values for each CDS of the two WDVT were also calculated using Condon W1.4.2. Finally, Pearson correlation analysis was performed to examine the correlations between CAI, CBI, ENC, GC1, GC2, GC3, and CDS length for the two strains.

2.4. Neutrality Plot Analysis

The neutrality plot is used to analyze the correlation between the average GC content at the first and second codon positions (GC12) and the GC content at the third codon position (GC3). This helps in understanding the factors affecting codon usage patterns and biases [28,29]. In this analysis, GC12 and GC3 values are plotted on the y-axis and x-axis, respectively, to create a two-dimensional scatter plot. The correlation between the two variables is analyzed by calculating the slope of the regression curve. A slope close to 1 indicates a significant correlation between GC12 and GC3, suggesting that codon usage is more influenced by mutation. Conversely, a slope close to 0 indicates no significant correlation, implying that natural selection is the primary factor affecting codon usage. Genes influenced primarily by mutation will be distributed along the diagonal, while those more affected by selection pressure will be scattered around the diagonal [29,30].

2.5. ENC-Plot Analysis

The ENC-plot analysis is a method used to assess the impact of base composition on codon usage bias [31]. This is achieved by creating a two-dimensional scatter plot with GC3 on the x-axis and ENC on the y-axis. It helps determine whether codon usage in genes is influenced by mutation or selection. If the genes are distributed along or fall near the standard curve (1), it indicates that they are affected by mutation only; otherwise, it indicates that they are affected by selection [32].
E N C = 2 + G C 3 + 29 G C 3 2 + ( 1 G C 3 ) 2

2.6. PR2-Plot Analysis

The PR2-plot is used to assess whether mutation pressure and natural selection influence nucleotide composition in DNA strands. In this plot, the y-axis represents the A3/(A3 + T3) ratio, and the x-axis represents the G3/(G3 + C3) ratio. Each point on the plot corresponds to a gene’s base composition. The center of the plot represents the state where codons are used without preference (A=T and C=G). The vector distance of other points from the center indicates the direction and extent of the bias [29].

2.7. Identification of the Optimal Codons

Optimal codons are most frequently used in highly expressed genes of a species [31]. Referencing the ENC, we select the top and bottom 10% of genes to create high RSCU datasets (hRSCU) and low RSCU datasets (lRSCU). The RSCU values are calculated using Codon W1.4.2 software, and the ΔRSCU (ΔRSCU = hRSCU − lRSCU) is then determined. Codons with ΔRSCU ≥ 0.08 in high- and low-expression gene sets, and with RSCU > 1, are identified as optimal codons [32].

2.8. RSCU Clustering and Phylogenetic Analysis

The RSCU values of each gene of 10 different sources of WDV strains were calculated separately, followed by the calculation of the distance between the data using the maximum parsimony (MP) difference method and the plotting of tree clusters and heat maps of RSCU values. The complete sequences of the WDV genomes of the 10 WDV strains were collated, and a phylogenetic tree (bootstrap = 1000) was constructed based on the MP method using MEGA11 [33].

3. Results

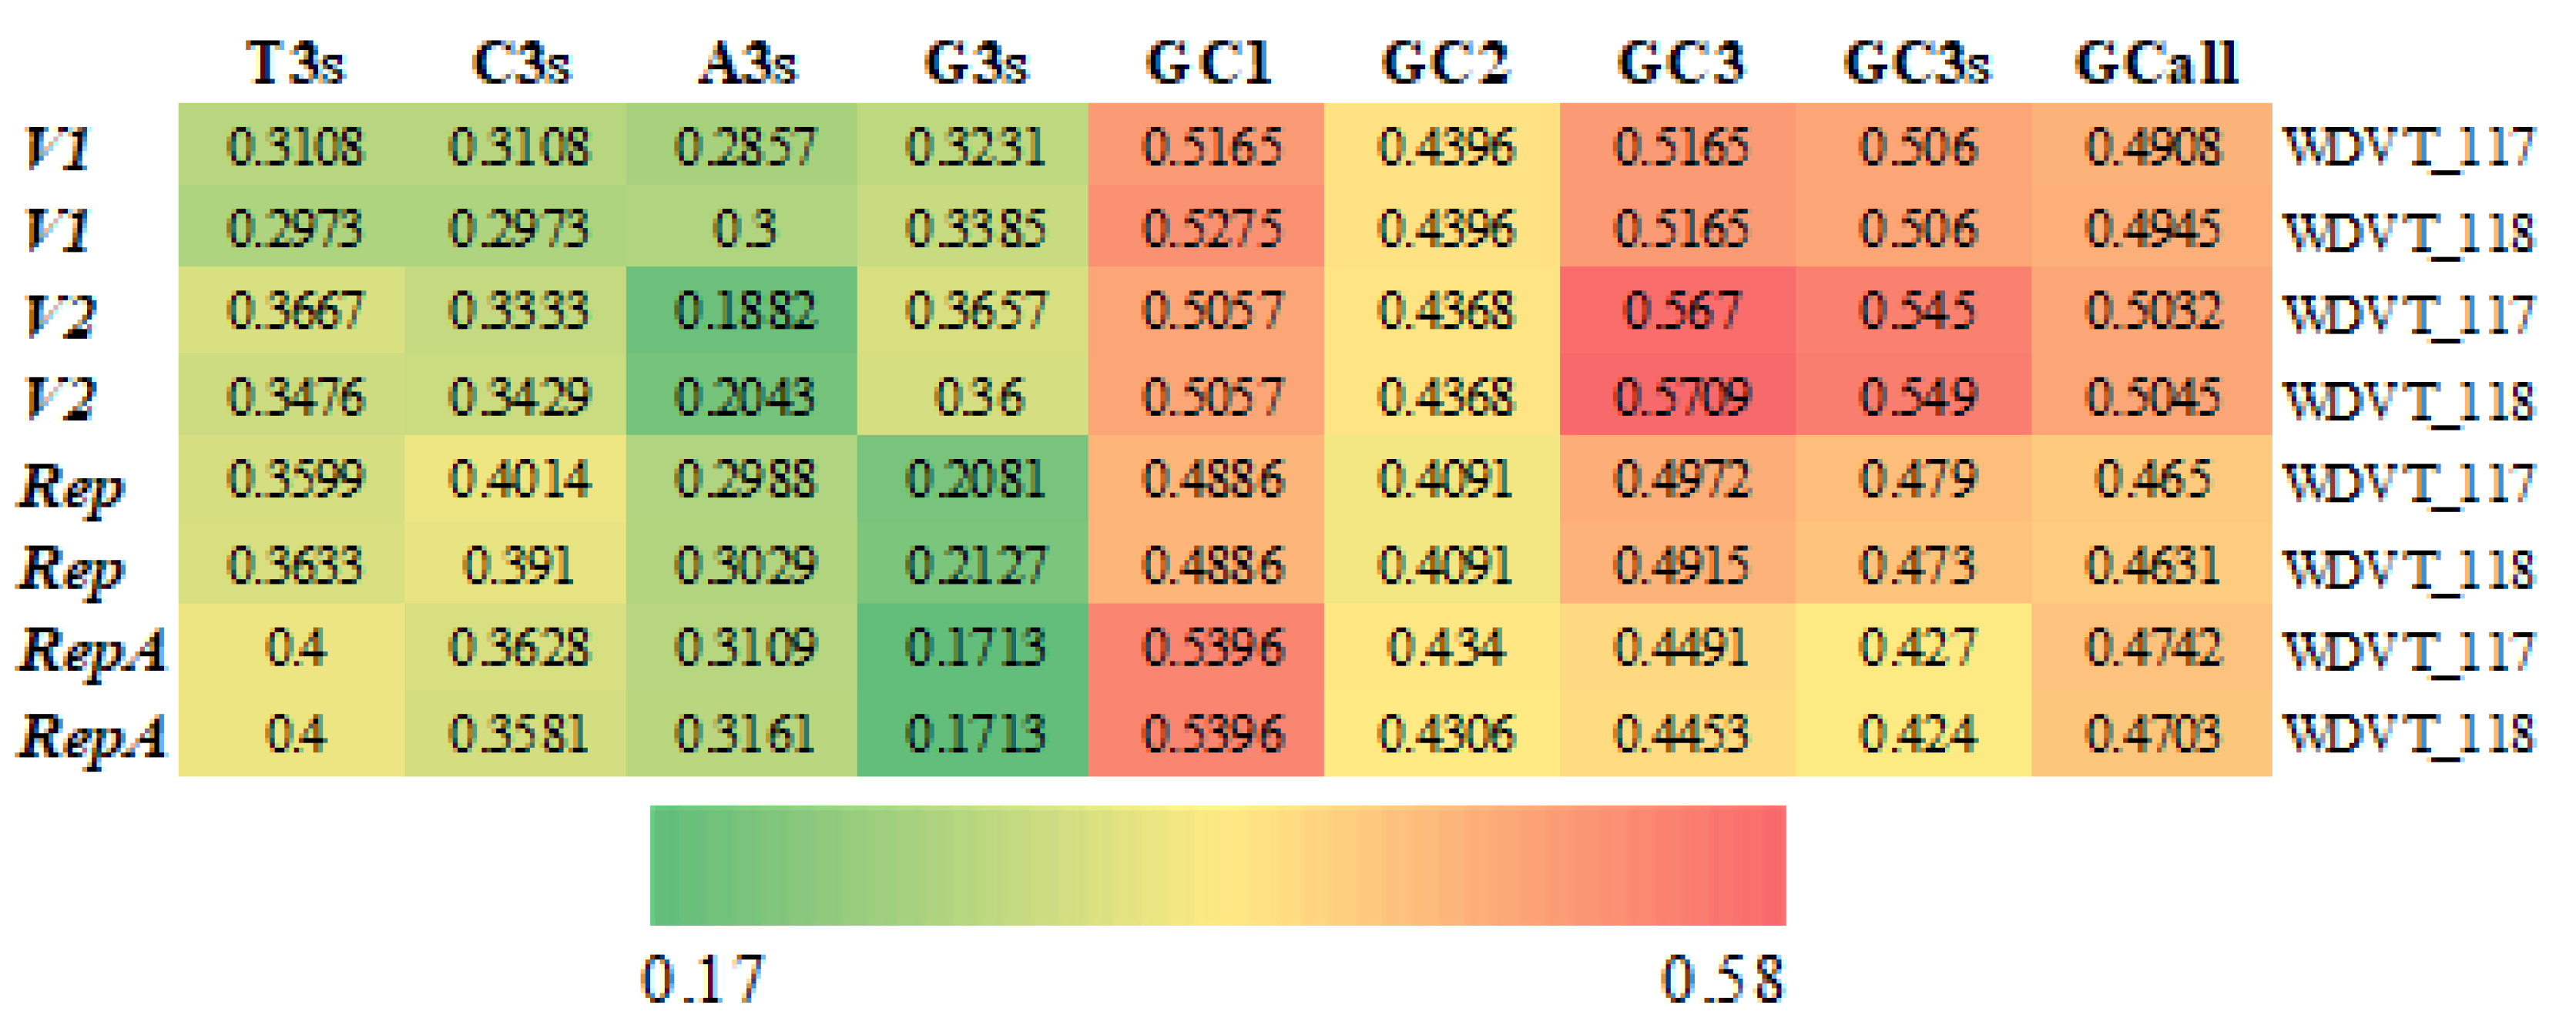
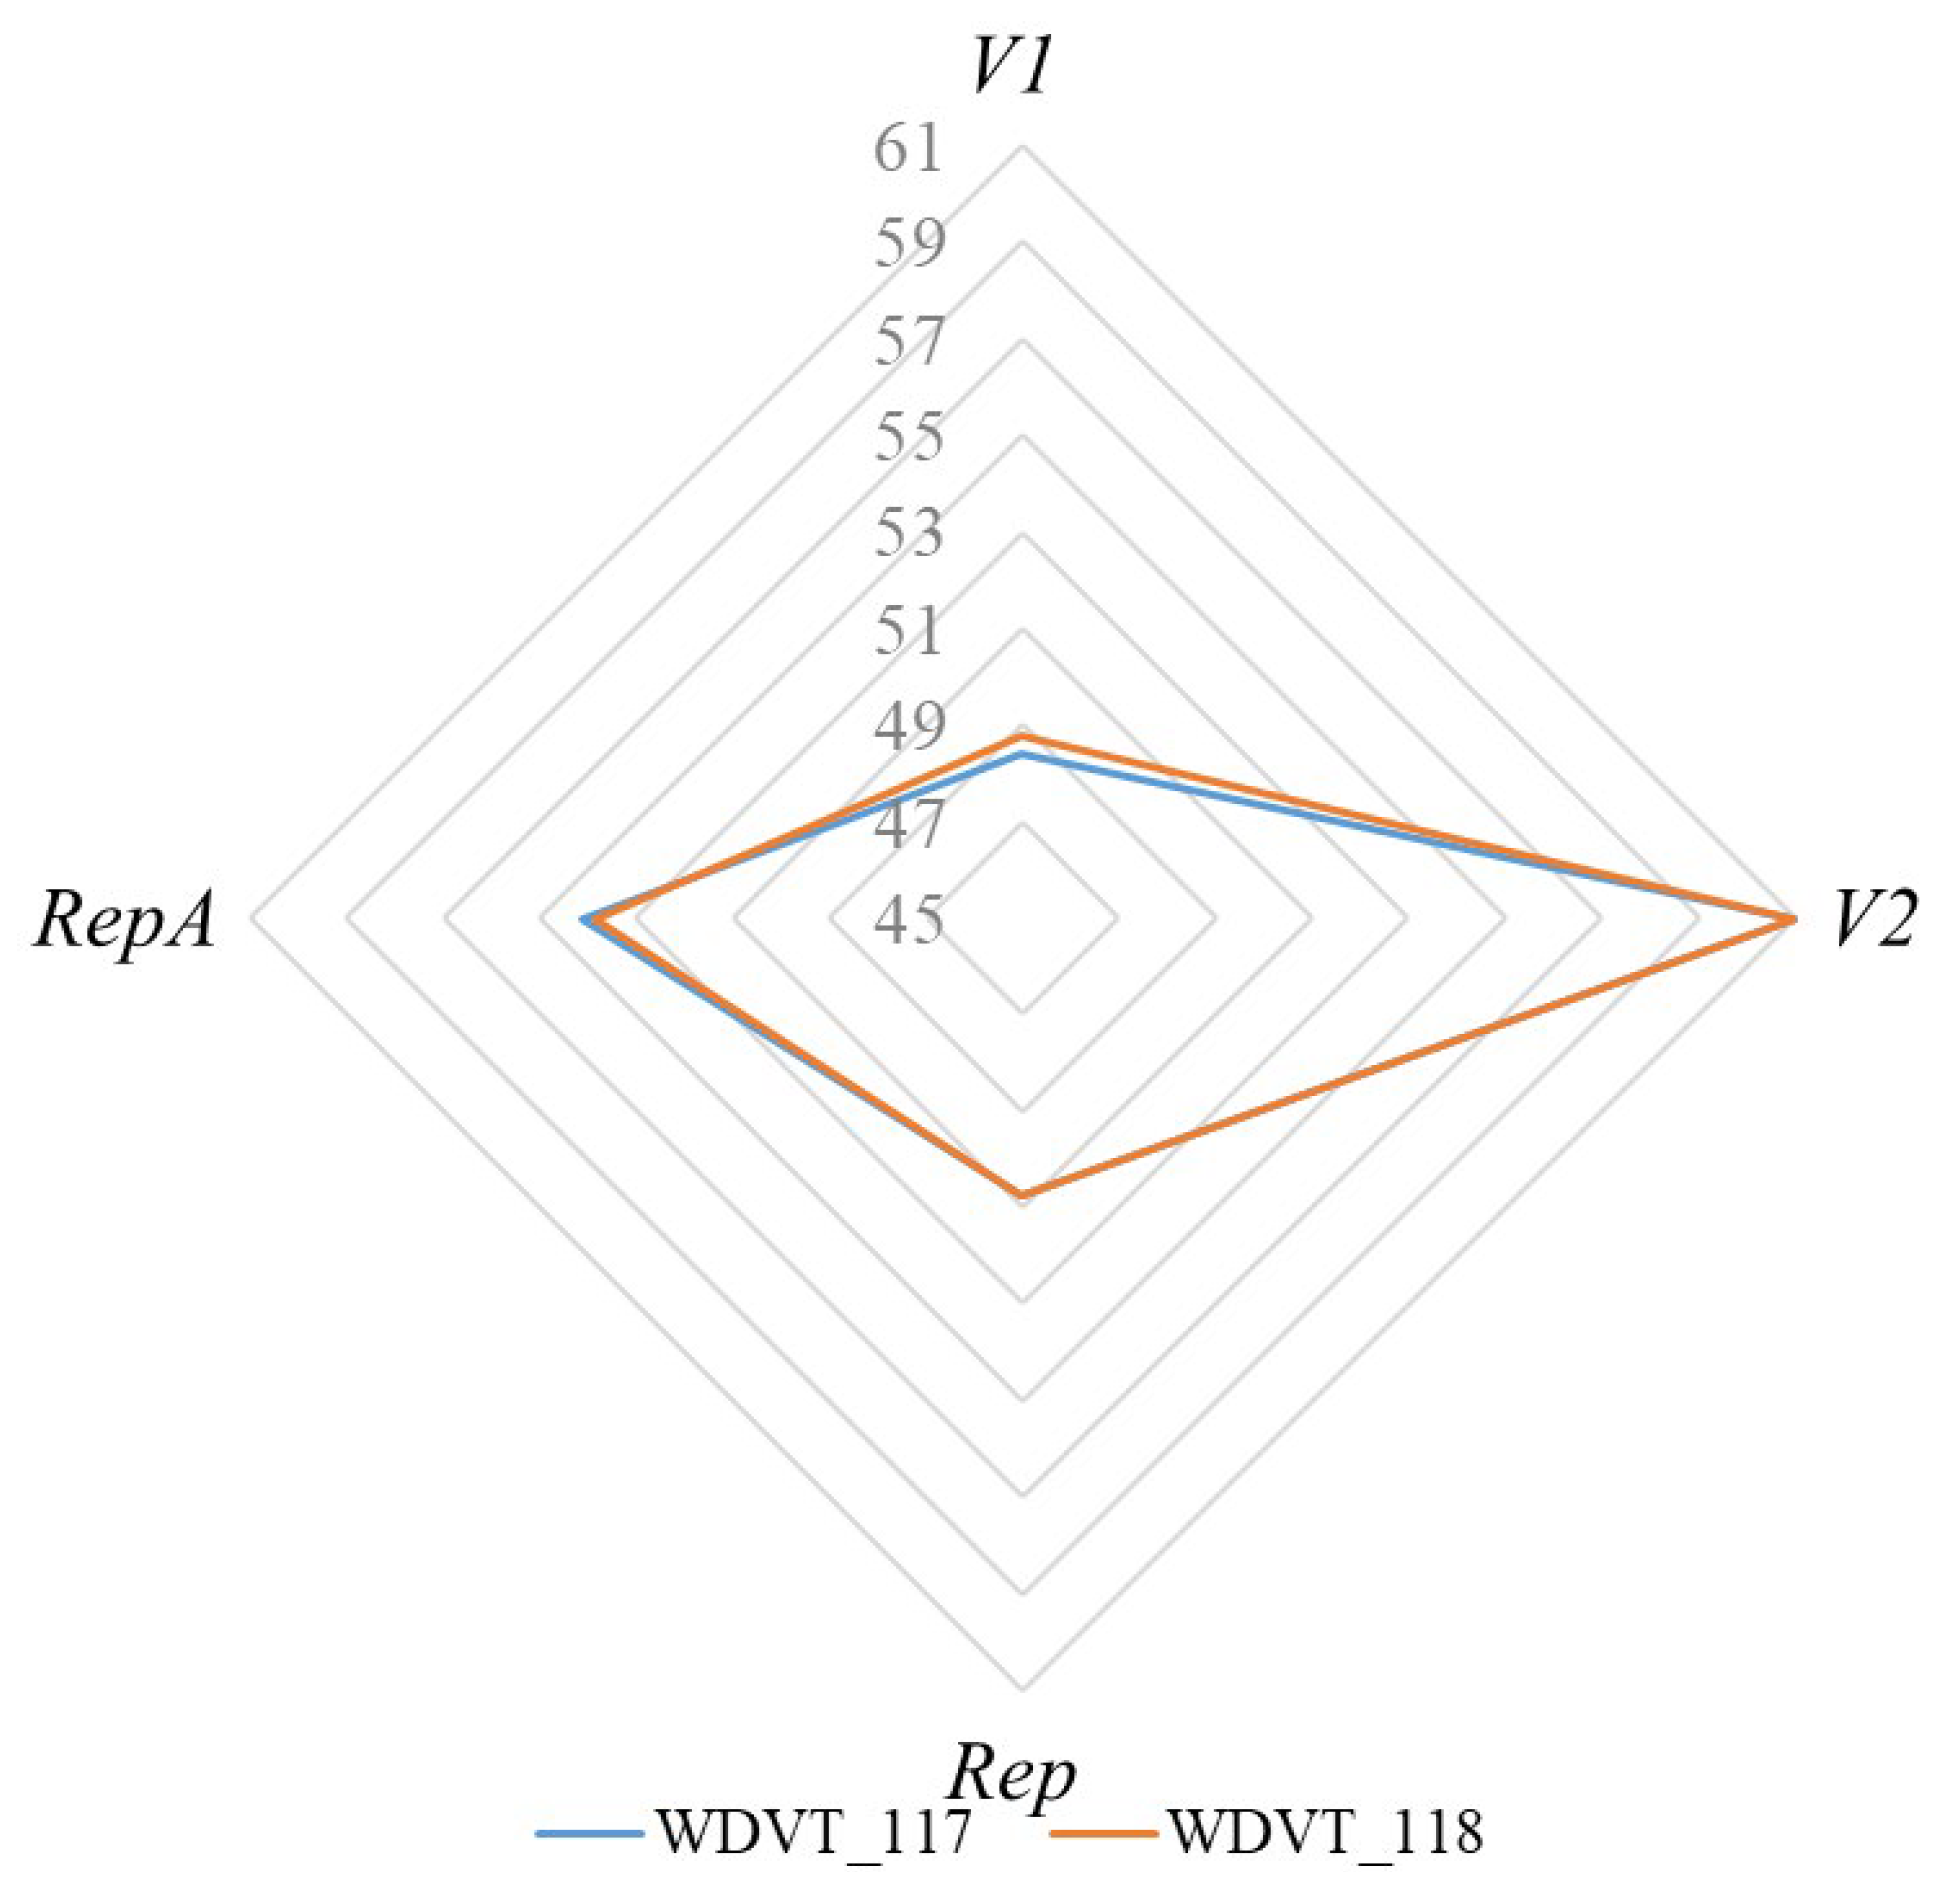
3.1. Codon Composition

The two WDVT genomes, WDVT-117 and WDVT-118, have the same gene types and lengths (Table 2). Key indicators of their codon base composition, including A3s, T3s, C3s, G3s, GC1, GC2, GC3, GC3s, and GCall, were calculated (Figure 1). Notably, G3s and A3s are lower than T3s and C3s, and GC1 is generally higher than GC2 and GC3.

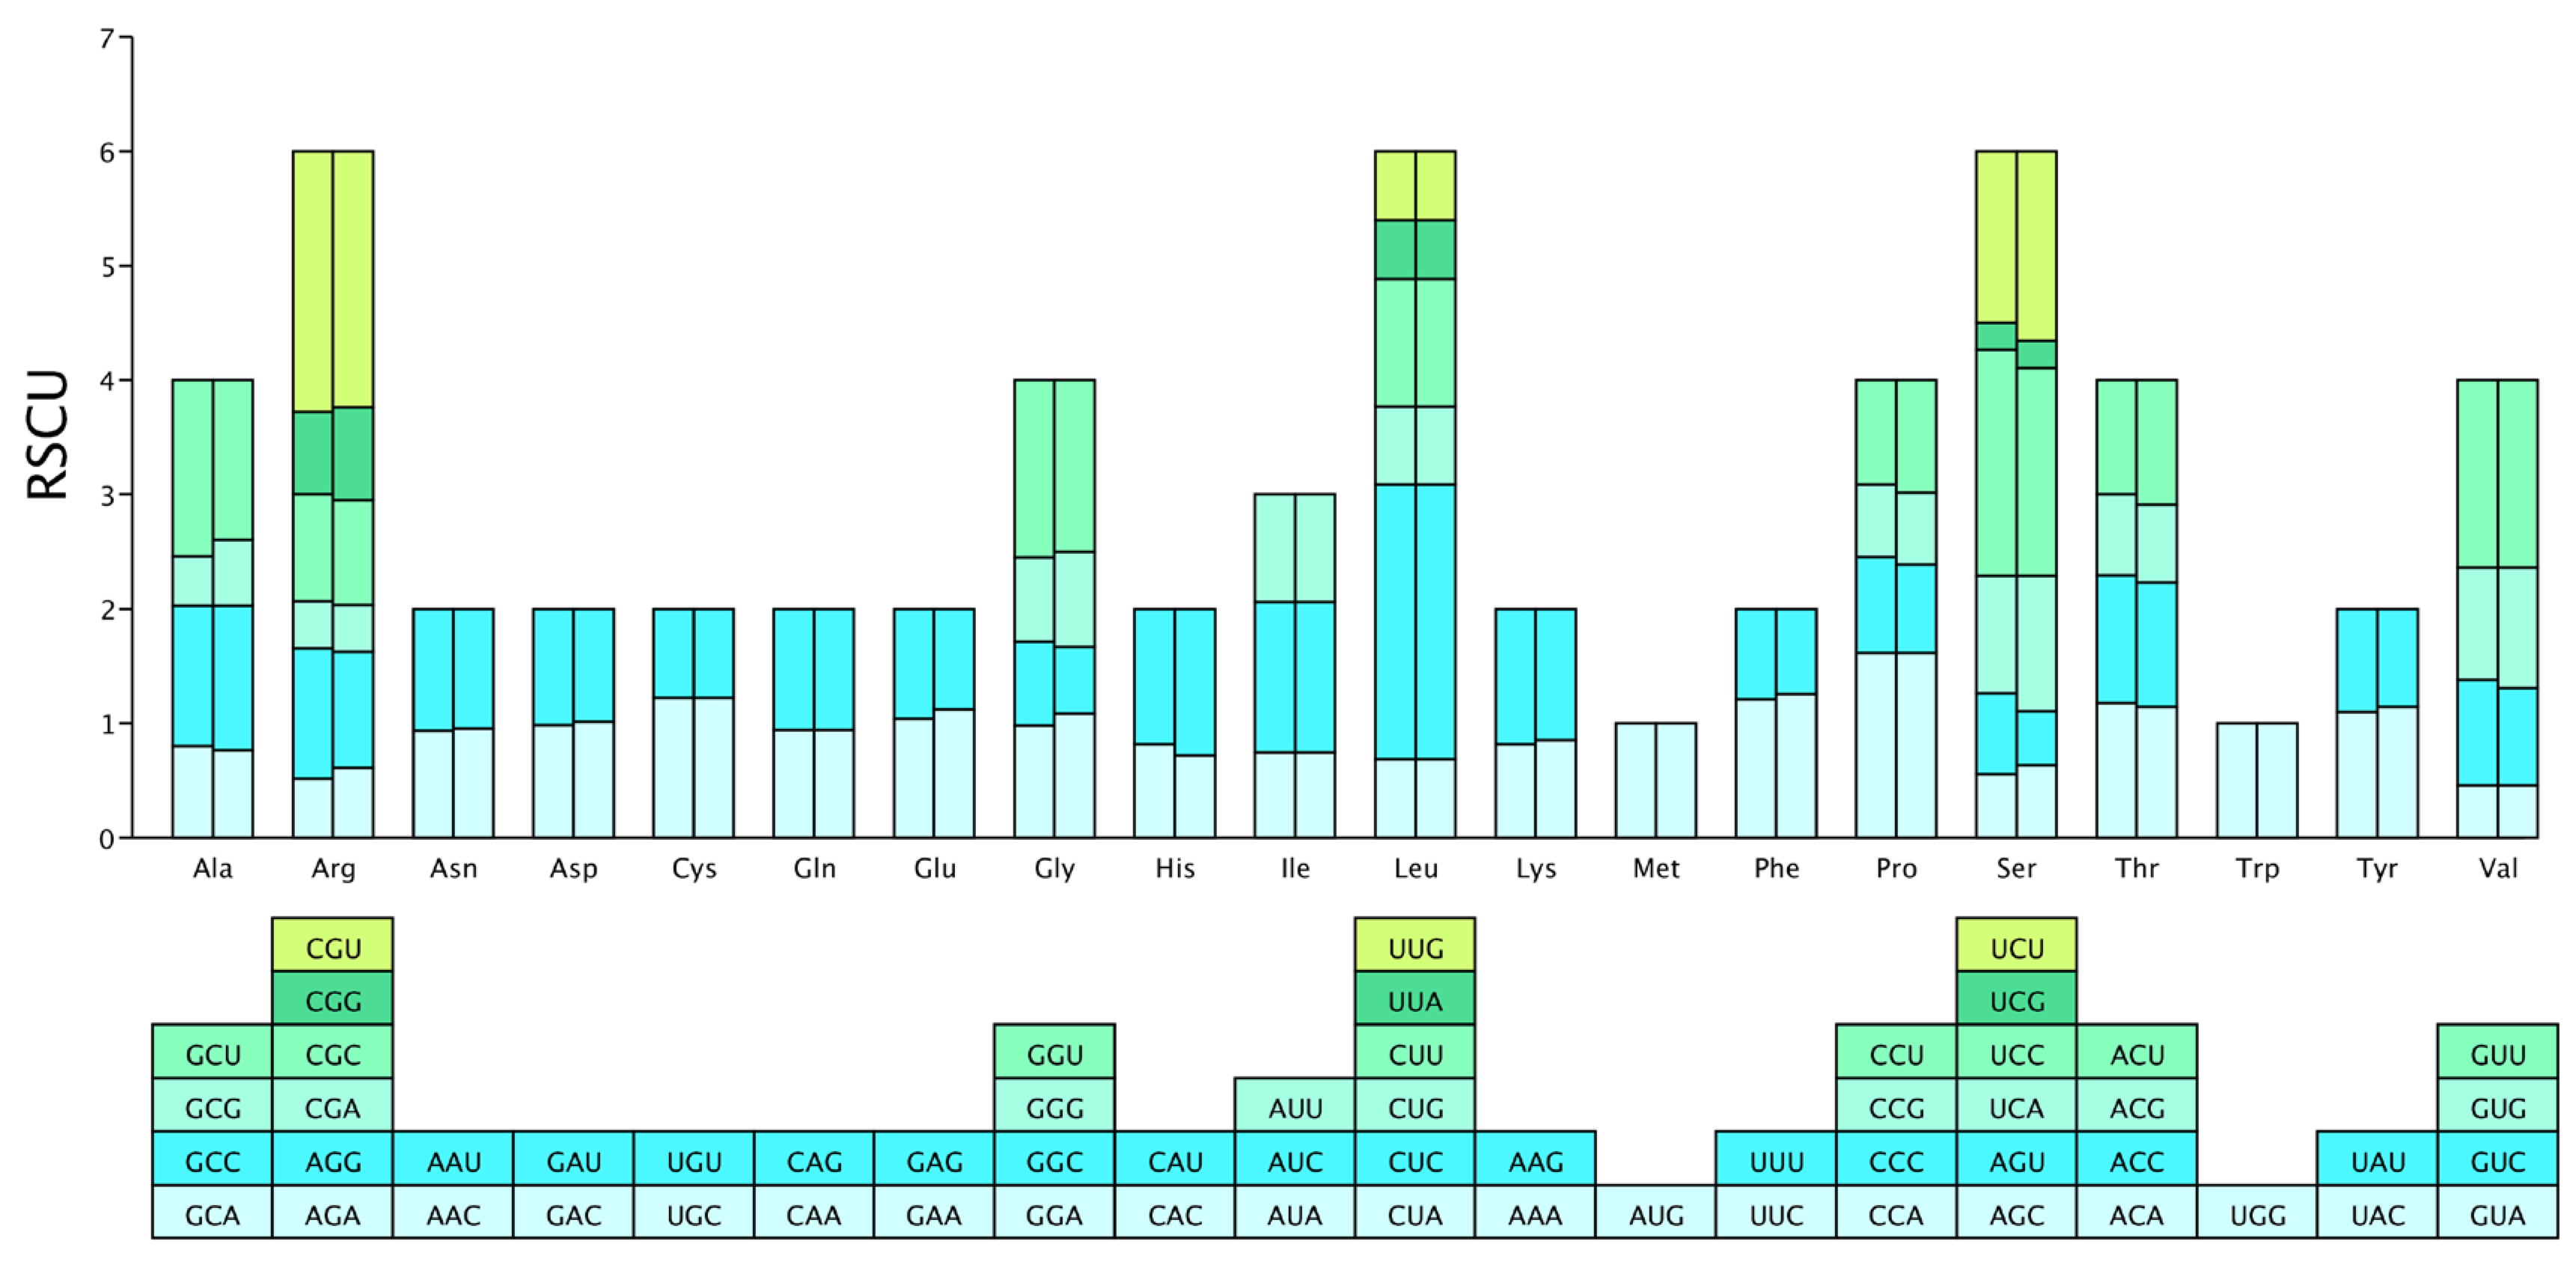
3.2. Synonymous Codon Usage Features

On the genomes of the two WDVT strains, Arg, Leu, and Ser have the most synonymous codons, each encoded by six codons; Ala, Gly, Pro, Thr, and Val are each encoded by four codons; Ile is unique in being encoded by three codons; Met and Trp are each encoded by a single codon; and the remaining amino acids are each encoded by two codons (Figure 2). The RSCU values of the codons in the genomes of the two wheat dwarf virus strains show a high degree of similarity, as intuitively displayed by the RSCU bar chart, with some differences also present.
The effective number of codons (ENC) is used to assess codon usage bias. The ENC values for the CDSs of WDVT_117 and WDVT_118 ranged from 48.39 to 61 and 48.76 to 61, with average values of 53.58 and 53.60, respectively. The highest ENC value (61) was found in the V2 gene for both strains, while the lowest values were in V1 (48.39 for WDVT_117 and 48.76 for WDVT_118) (Figure 3).
In WDVT_117, the CAI of the four CDS ranges from 0.155 to 0.267 (average: 0.237), and the CBI ranges from −0.026 to 0.1 (average: 0.052). In WDVT_118, the CAI ranges from 0.145 to 0.269 (average: 0.236), and the CBI ranges from −0.042 to 0.111 (average: 0.056) (Table 3).

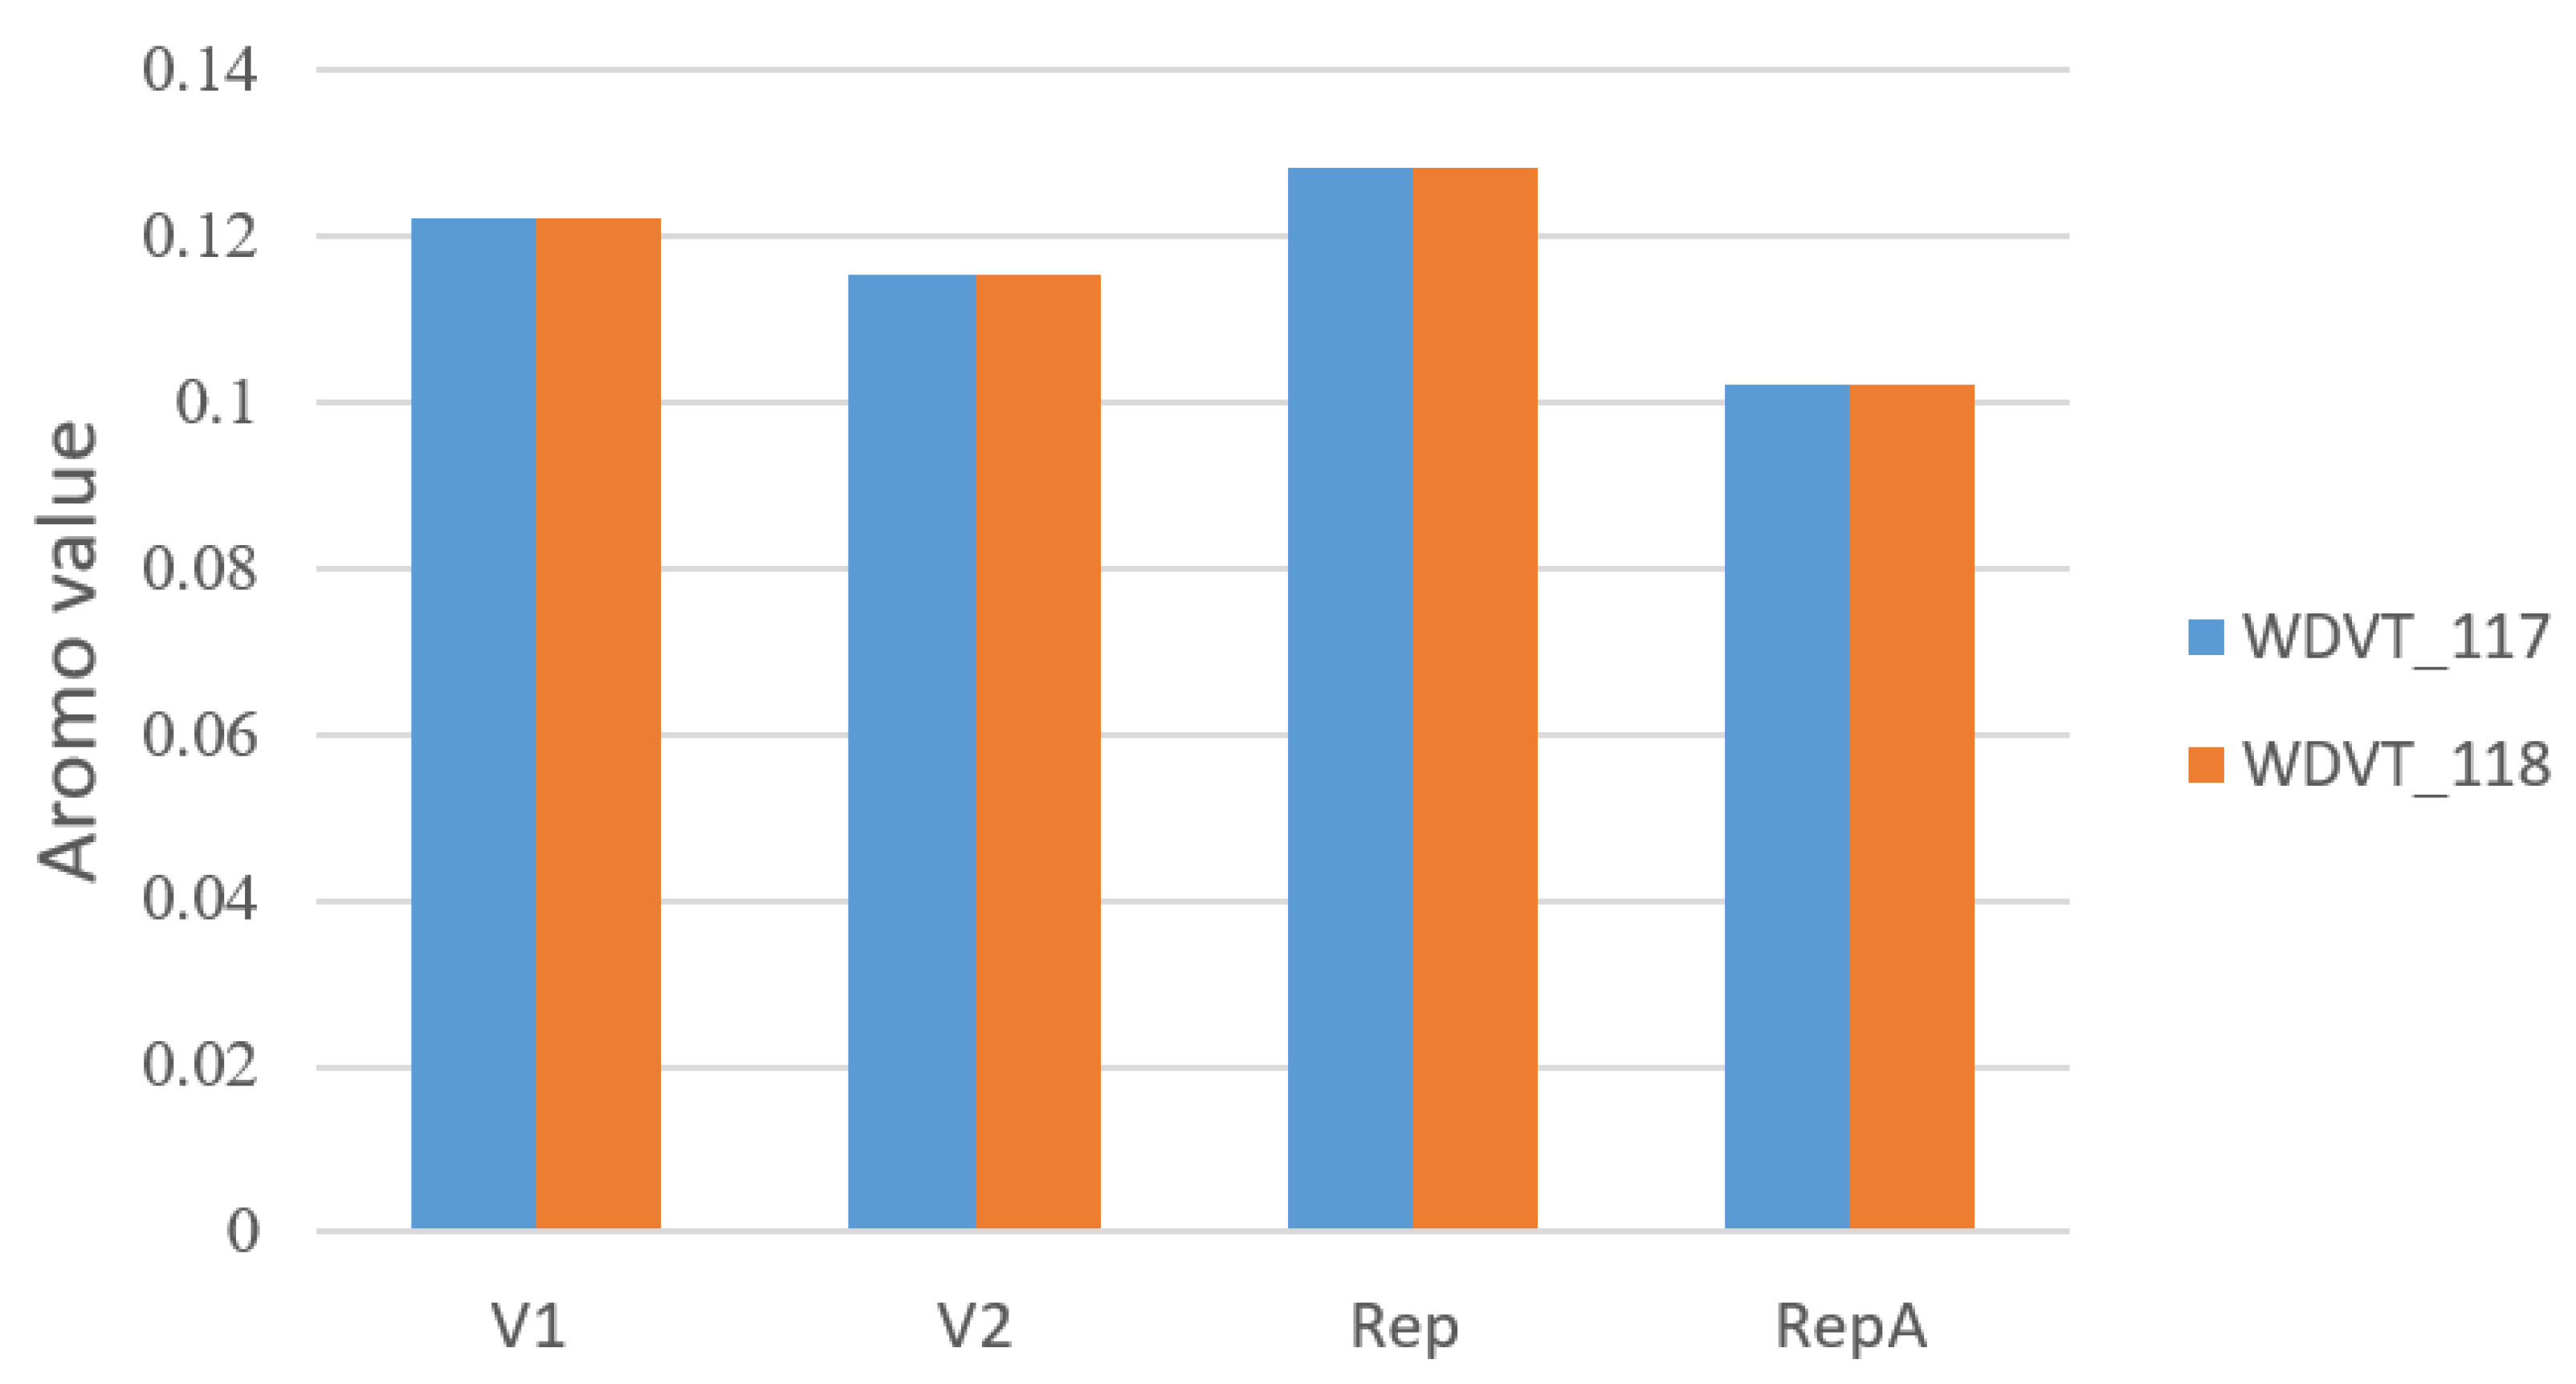
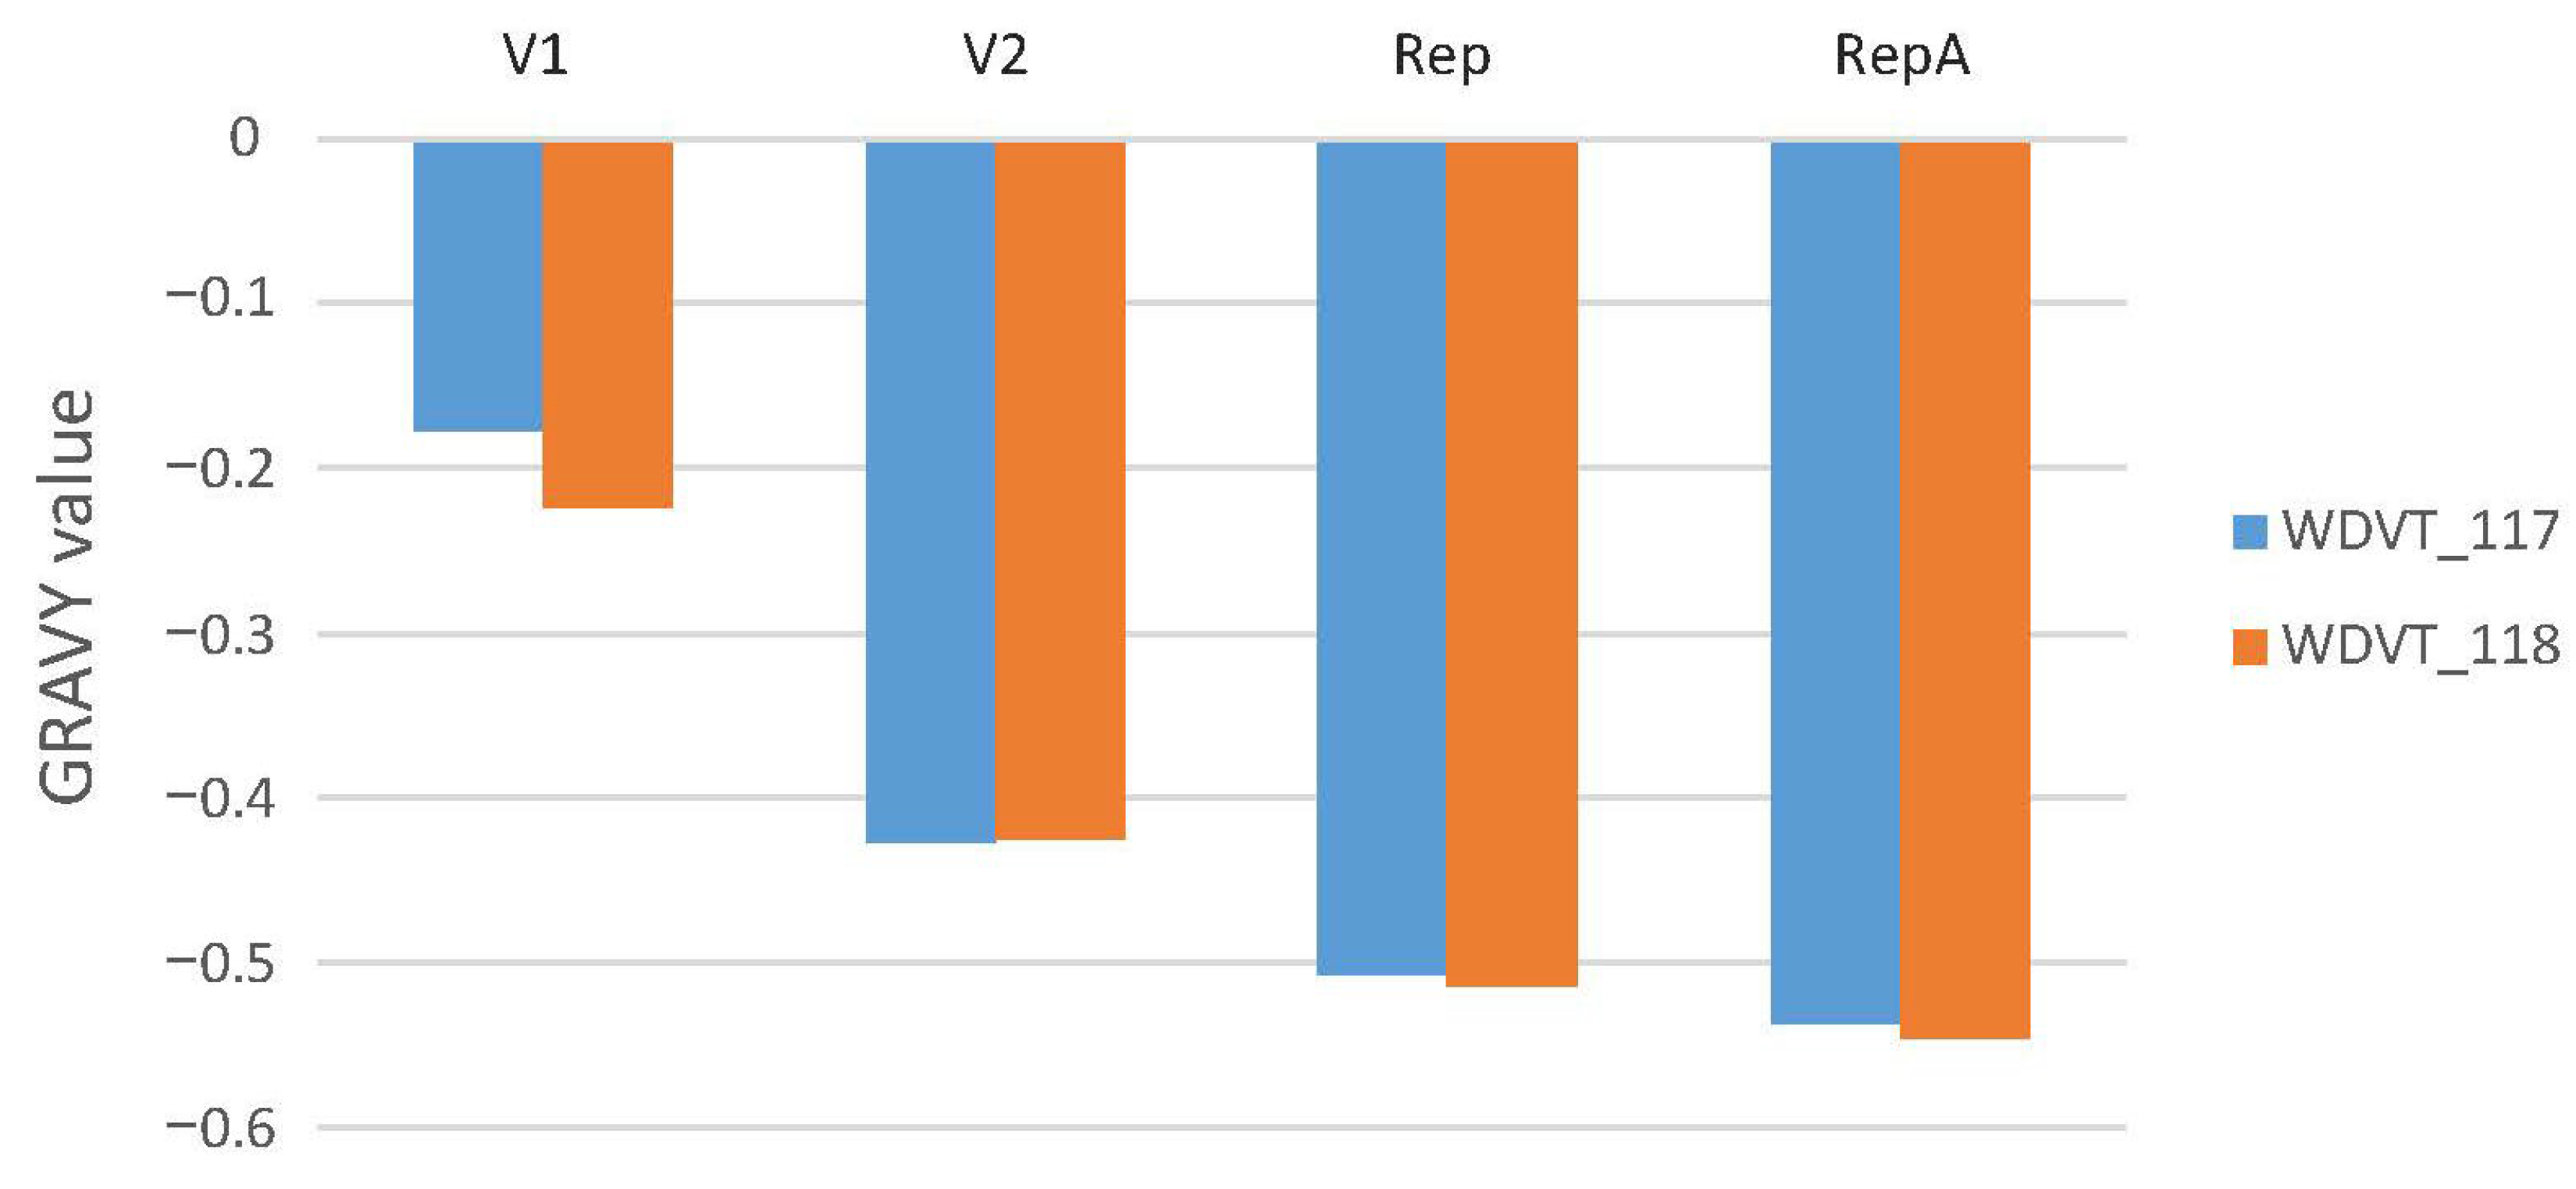
3.3. Amino Acid Usage

Aromatic Amino Acid Proportion (Aromo): Aromo measures the proportion of aromatic amino acids (Phe, Tyr, Trp) in gene translation, indicating their relative content in proteins. In the four peptides V1, V2, Rep, and RepA, the aromatic amino acid proportions are similar between the two viral strains. WDVT_117 and WDVT_118 show similar Aromo features: RepA has the lowest Aromo, while Rep has the highest. Aromo values range from 0.102 to 0.129 (Figure 4).
Grand Average of Hydropathicity (GRAVY): GRAVY measures protein hydrophilicity or hydrophobicity. Negative GRAVY values for all categories in both strains indicate overall hydrophilicity. In V1 protein, WDVT_118 has a lower value than WDVT_117, indicating slightly stronger hydrophilicity. In V2 protein, WDVT_117 has a lower GRAVY value than WDVT_118, suggesting more hydrophilic amino acids or fewer hydrophobic ones. In Rep, WDVT_118 has a lower value, indicating more hydrophilic amino acids. In RepA, WDVT_118 has a lower value, indicating stronger hydrophilicity. Data show that WDVT_118 is more hydrophilic than WDVT_117 (Figure 5).

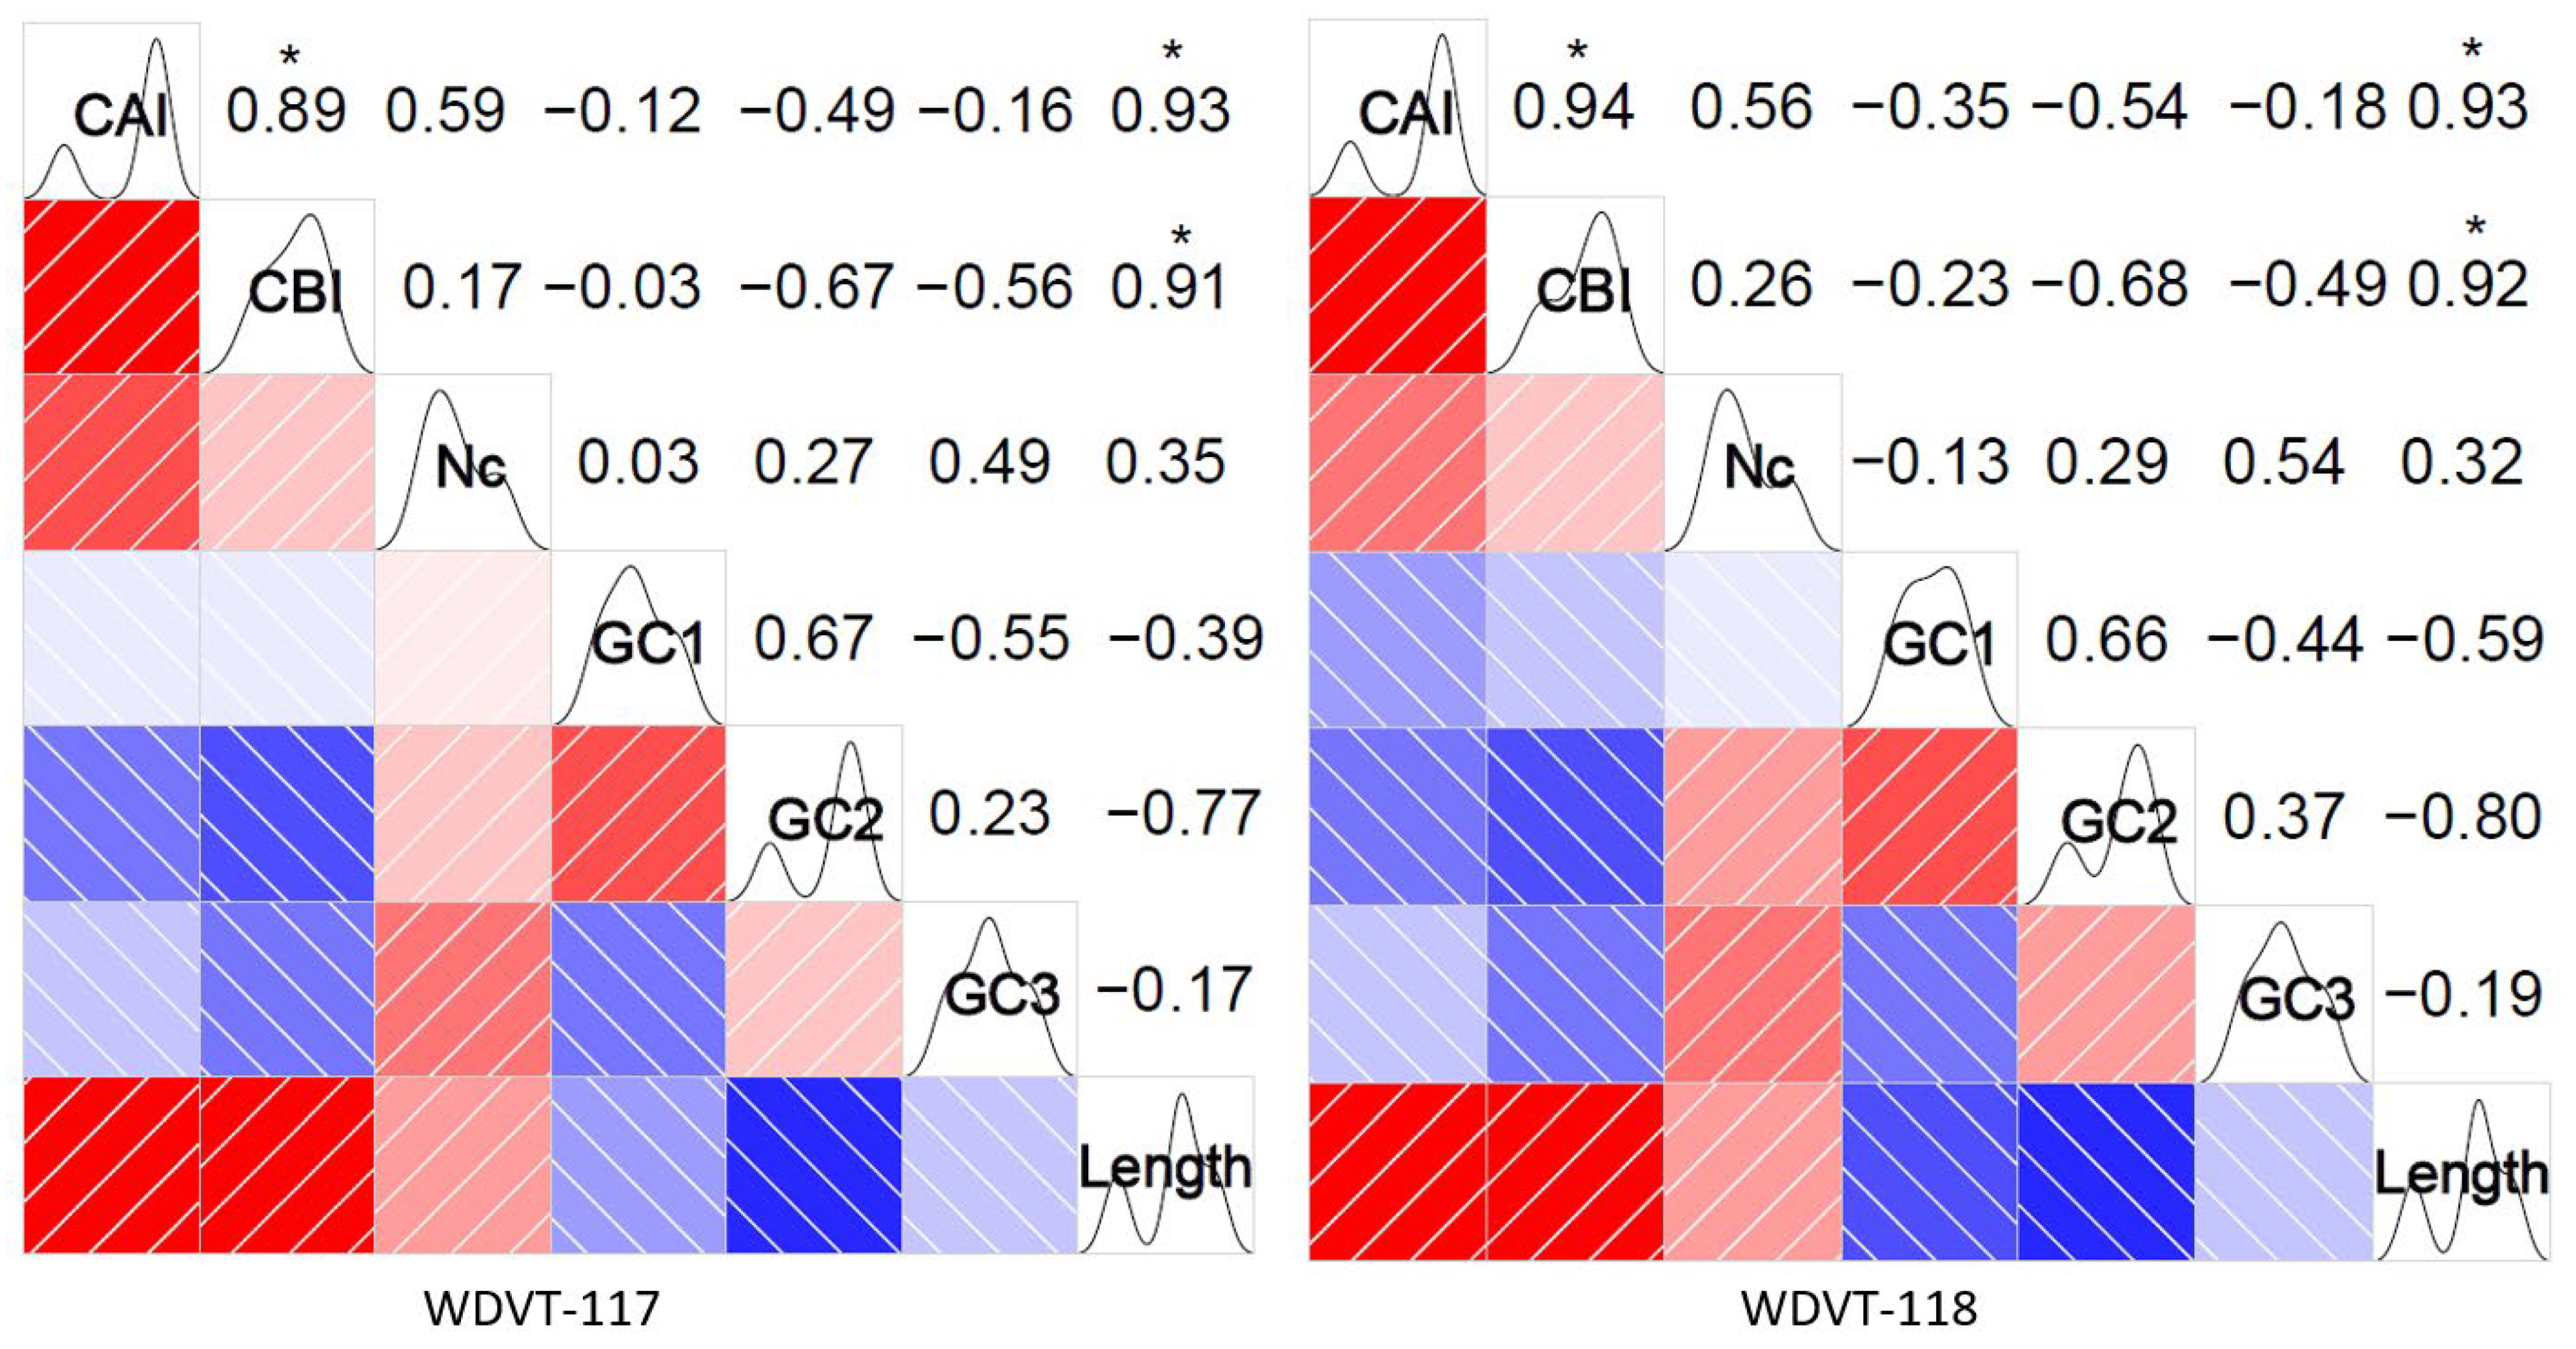
3.4. Correlation Among Indexes

In the correlation matrix generated by Pearson’s method (Figure 6), red denotes a positive correlation and blue denotes a negative correlation. Values closer to 1 indicate stronger correlation, with 0.85–1.0 considered very strong. Analysis of WDVT-117 and WDVT-118 revealed a high degree of consistency in the correlation between codon-usage-related indexes in their genomes:
(a)
CAI is very strongly positively correlated with CBI and length (significant at p < 0.05, t-tests), moderately positively correlated with ENC (significant at p < 0.05), and moderately negatively correlated with GC2. It has very weak negative correlations with GC1 and GC2.
(b)
CBI is very weakly positively correlated with ENC, very weakly negatively correlated with GC1, strongly negatively correlated with GC2, moderately negatively correlated with GC3, and very strongly positively correlated with length (significant at p < 0.05).
(c)
ENC has very weak positive and negative correlations with GC1, weak positive correlations with GC2 and length, and a moderate positive correlation with GC3.
(d)
GC1 is strongly positively correlated with GC2, moderately negatively correlated with GC3, and weakly negatively correlated with length.
(e)
GC2 has weak positive correlations with GC3 and length and strong negative correlations with length.
(f)
GC3 has very weak negative correlations with length.
Figure 6. Correlation analysis of CAI, CBI, ENC, GC1, GC2, GC3, and length. * indicates significant correlation at the 0.05 level (t-tests). Red indicates a positive correlation, and blue indicates a negative correlation. The intensity of the color represents the strength of the correlation.
Biology 14 00524 g006

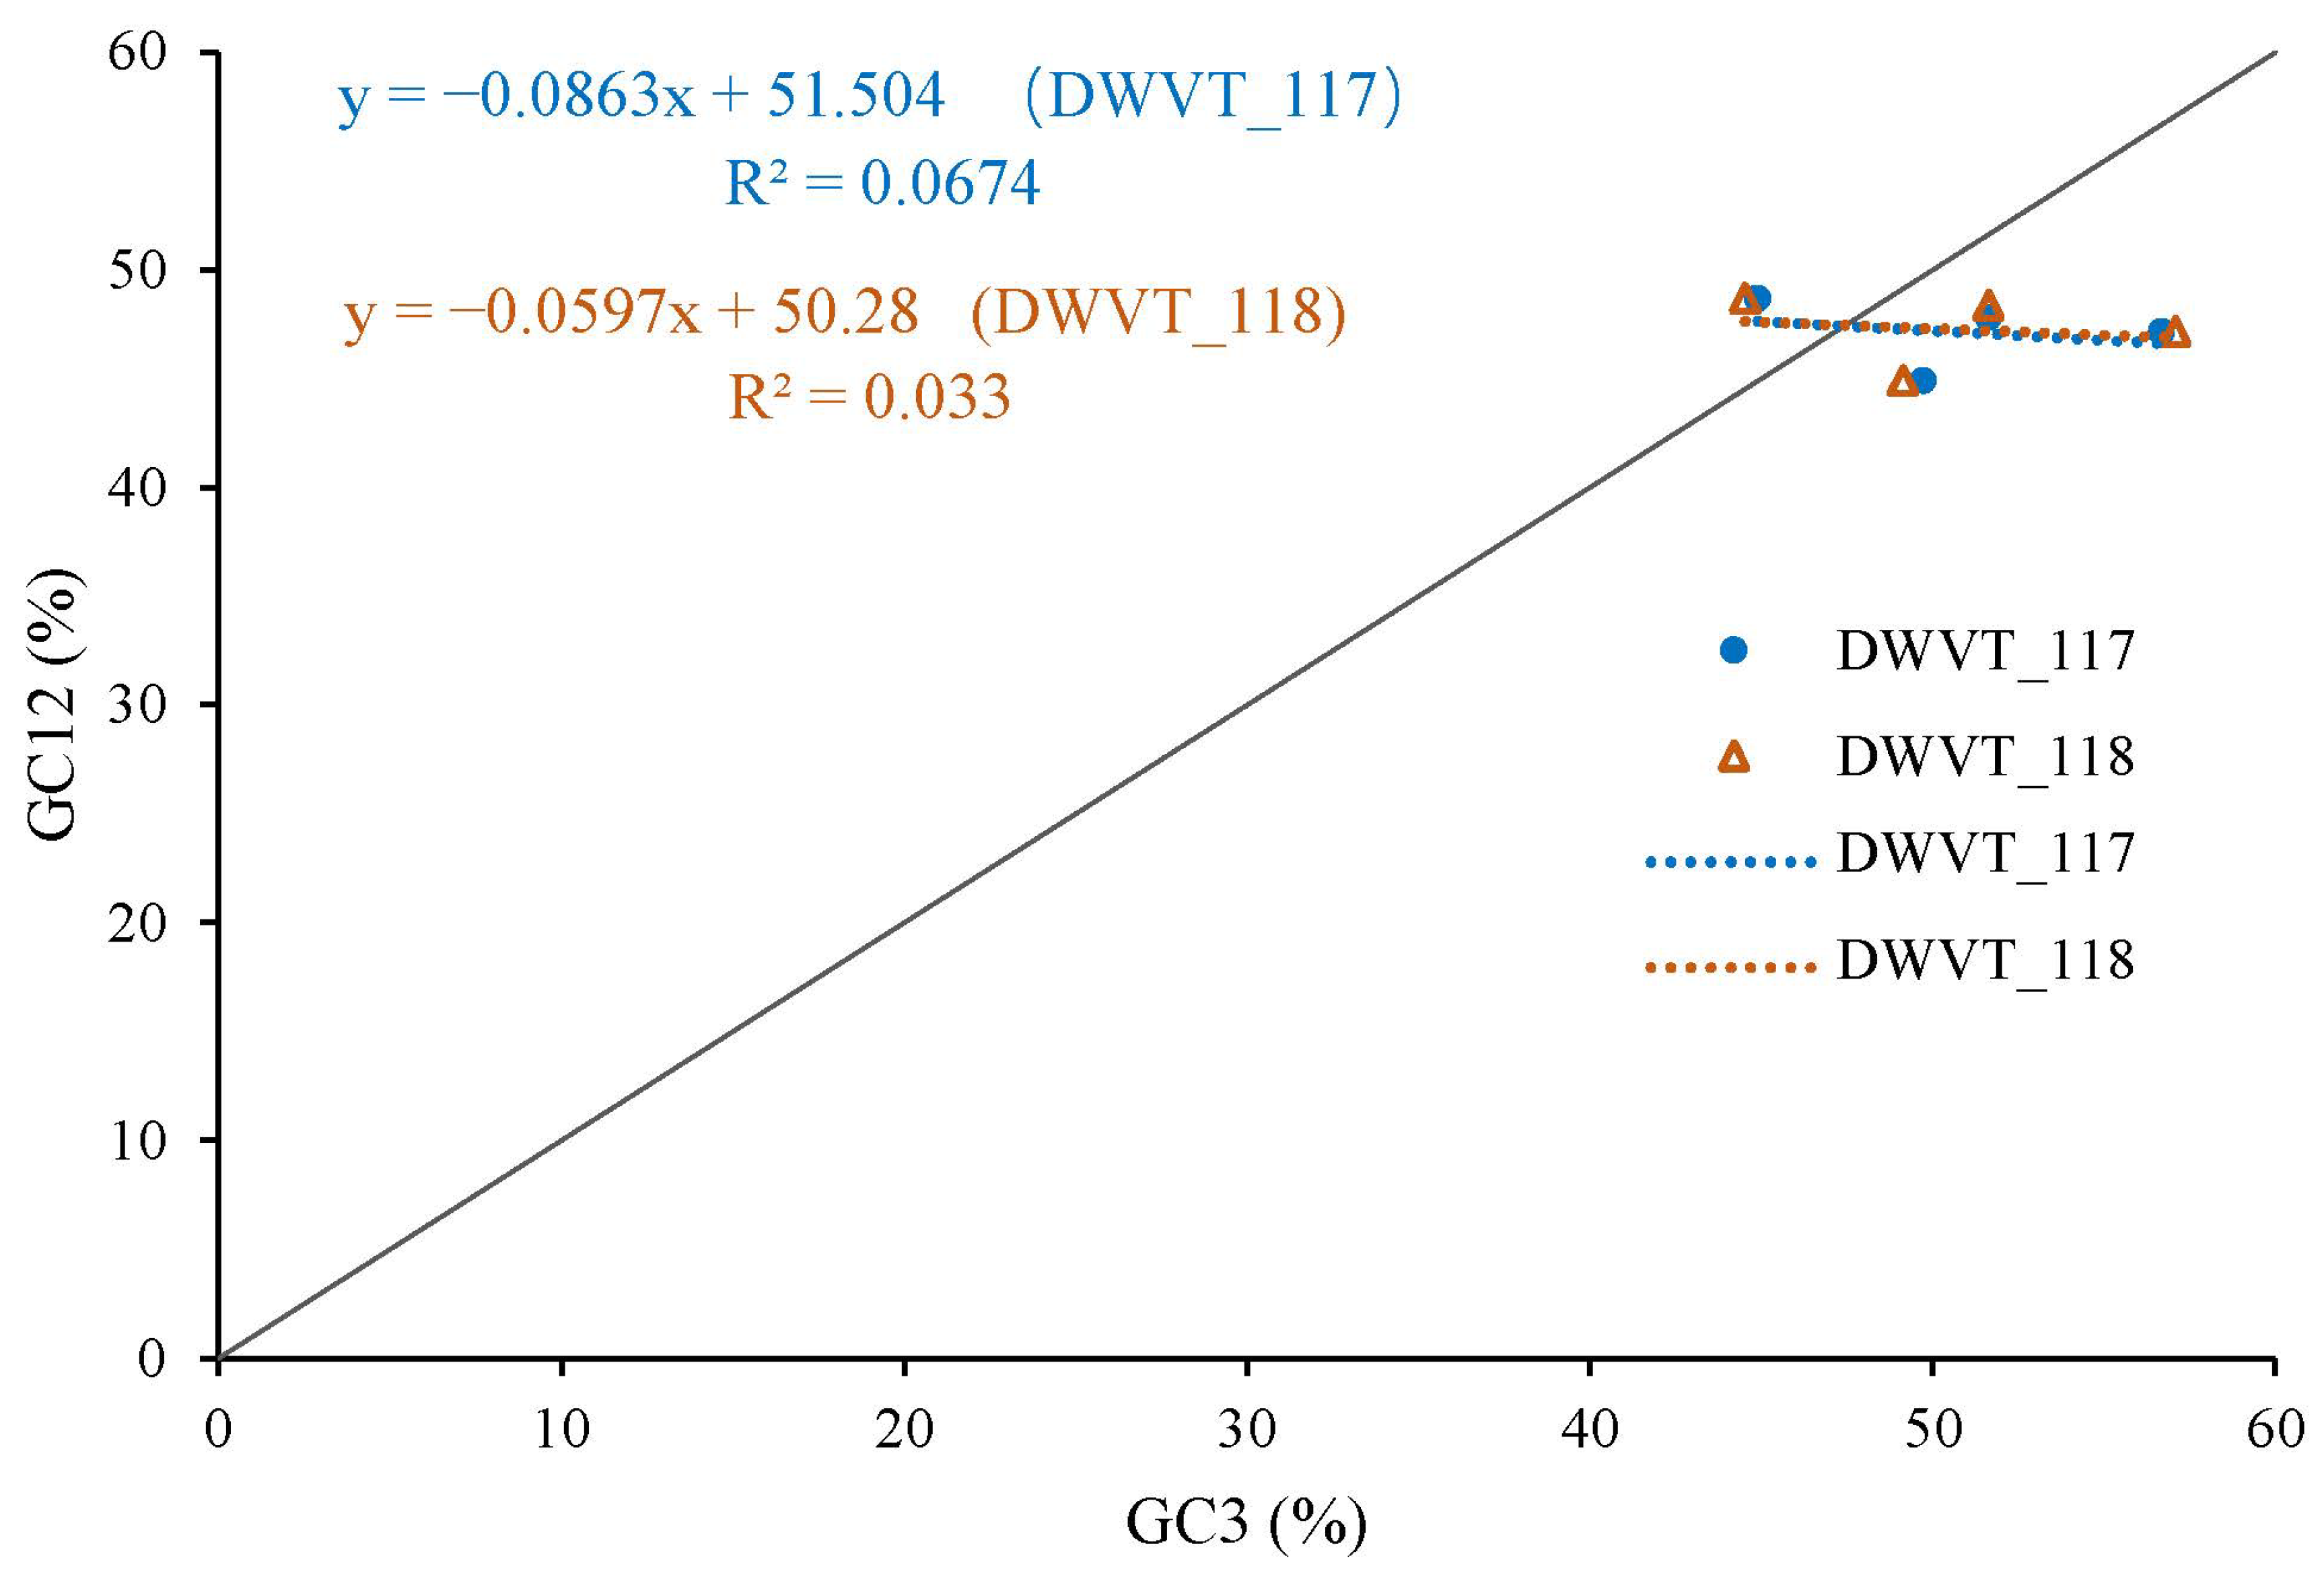
3.5. Neutrality Plot Analysis Reveals Natural Selection Dominance

The magnitude of natural selection and mutation pressure in CUB was examined using a neutrality plot (GC12 vs. GC3). The slopes of the two regression lines (WDVT_117: y= −0.0863x + 51.504; WDVT_117: y = −0.0578x + 50.28) were close to zero, with R2 values of 0.0674 and 0.033, respectively (Figure 7). The narrow range of GC3 values and the absence of a significant correlation between GC12 and GC3 indicate the minimal influence of mutation pressure. This weak negative correlation suggests that natural selection predominantly shapes the codon usage pattern.

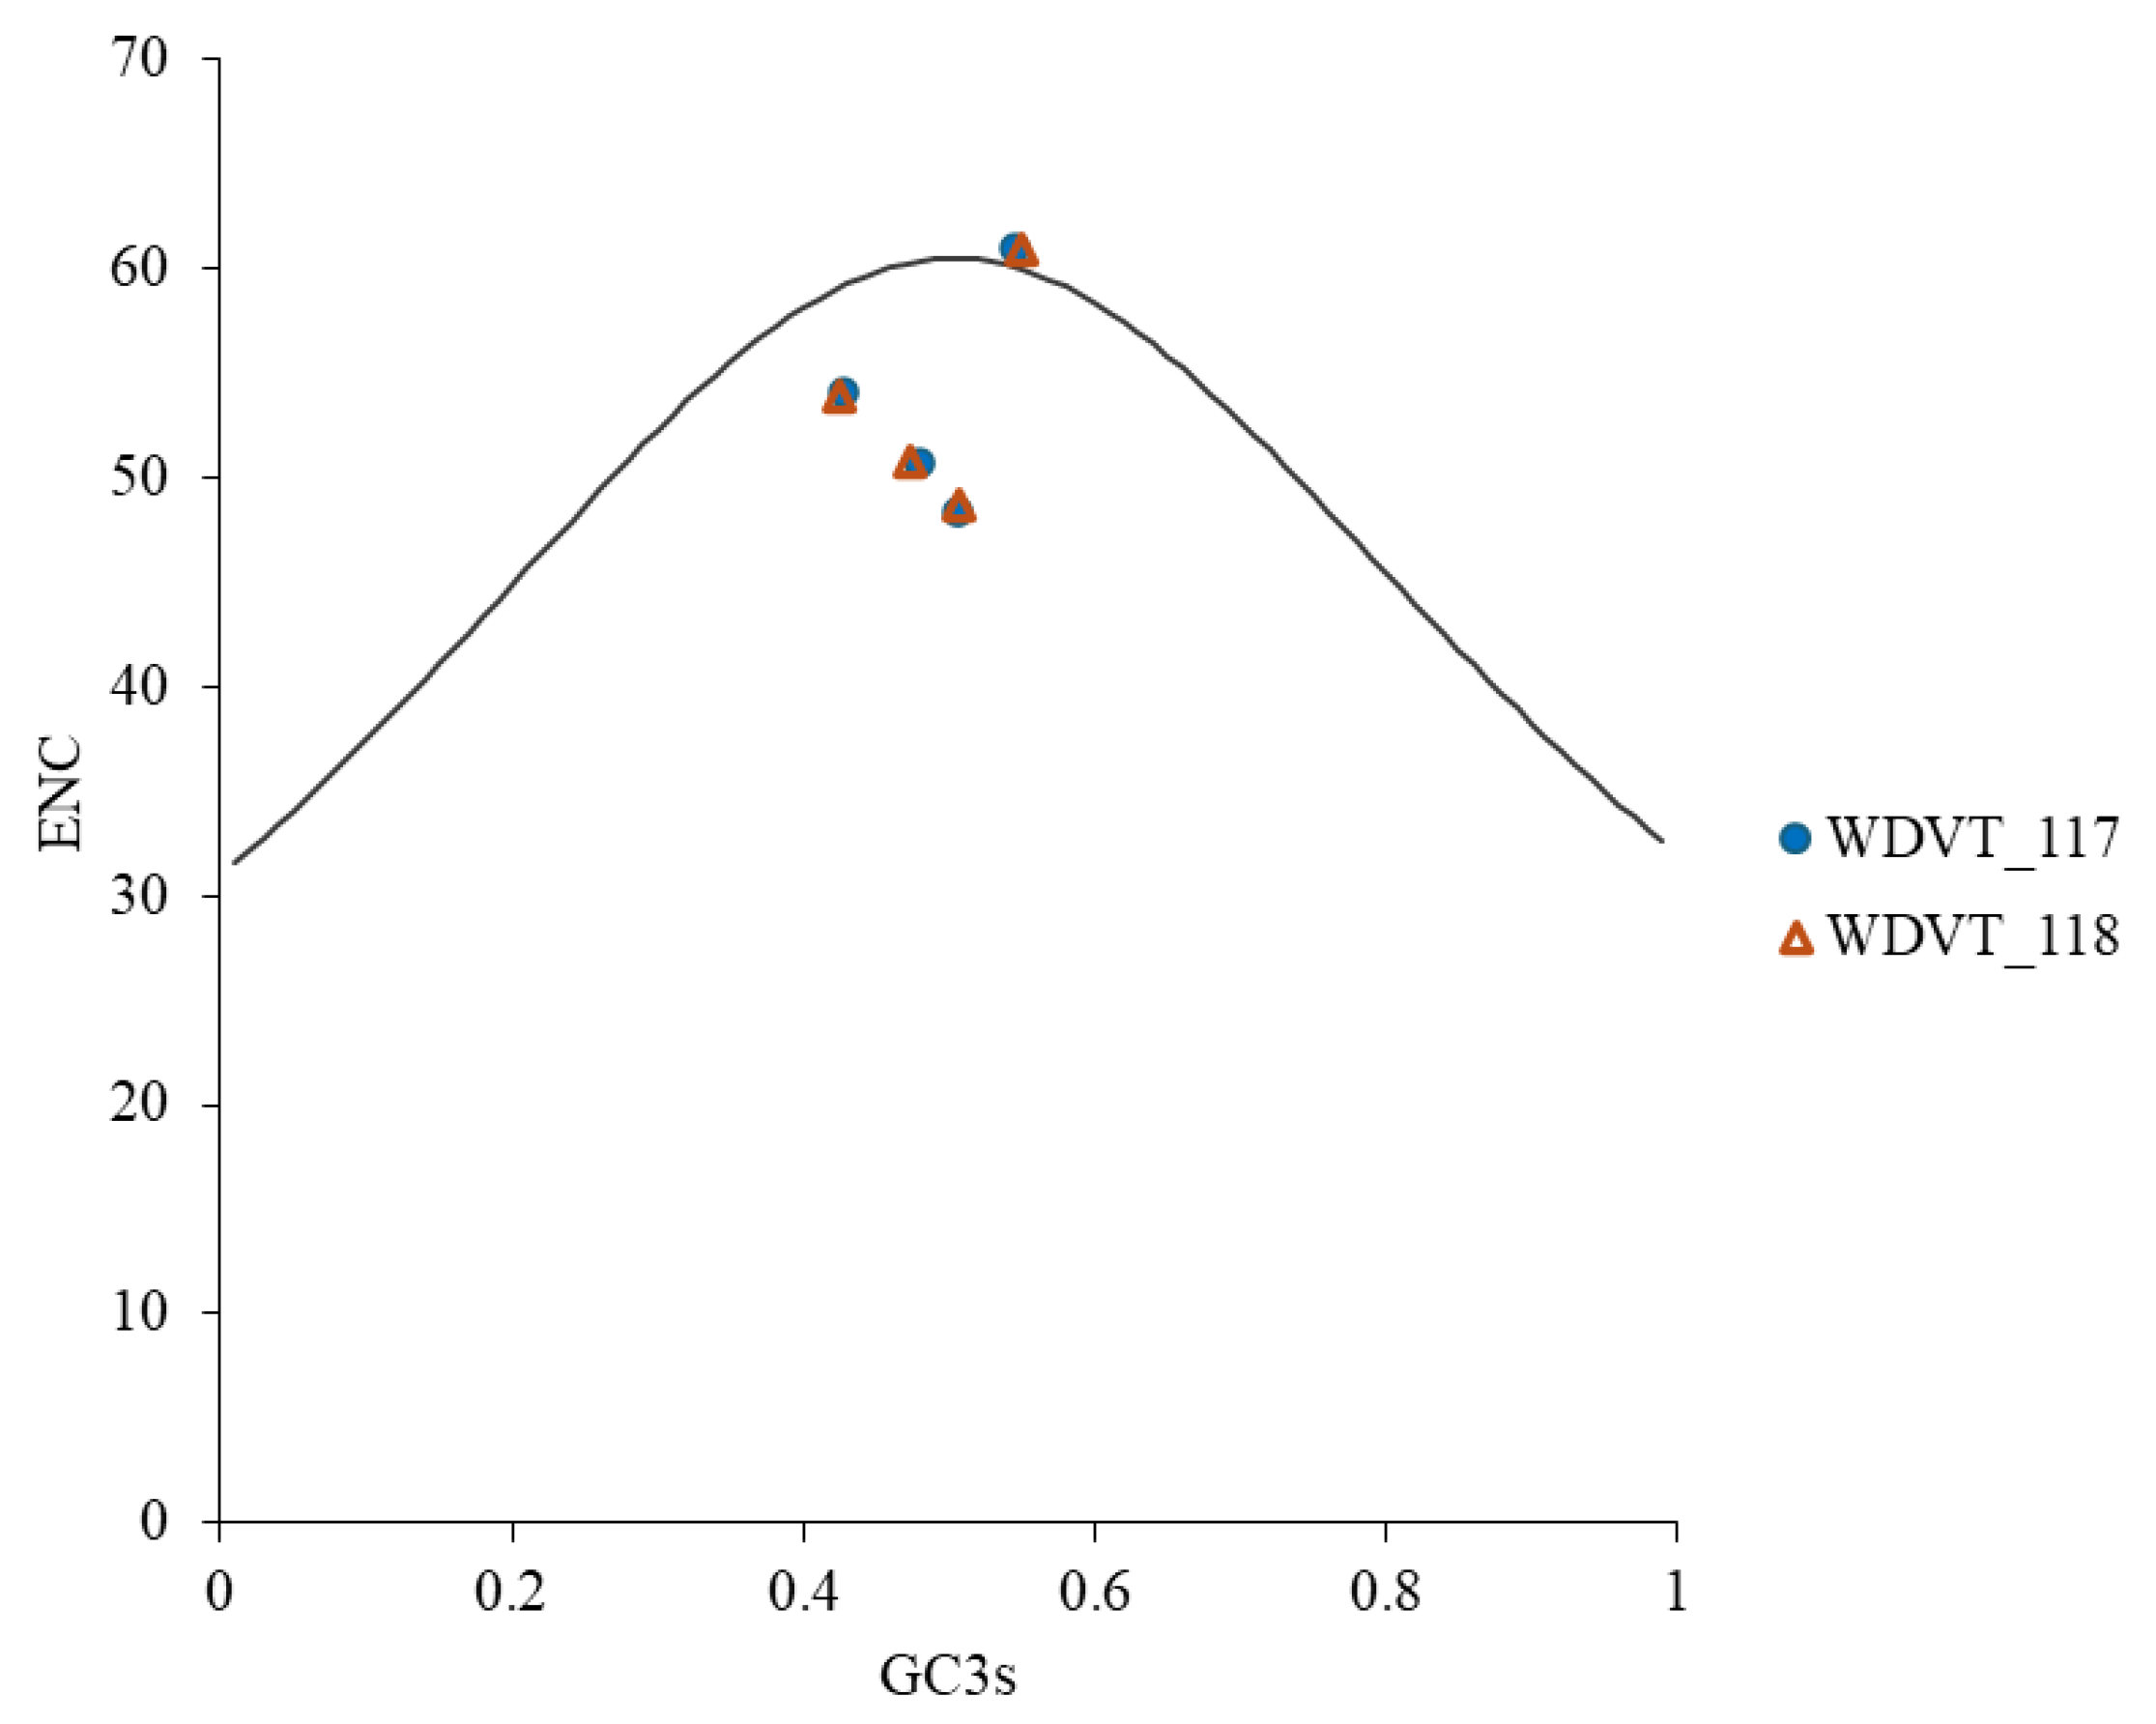
3.6. ENC-Plot Analysis Reveals Selection Pressure in WDV Codon Usage

ENC-plot analysis, with GC3s on the x-axis and ENC on the y-axis, was used to evaluate the influence of natural selection and mutation on codon usage bias in WDV from triticale. Most genes were found below the standard curve (Figure 8), suggesting that codon usage bias is influenced by both mutation and natural selection, with the latter being more significant.

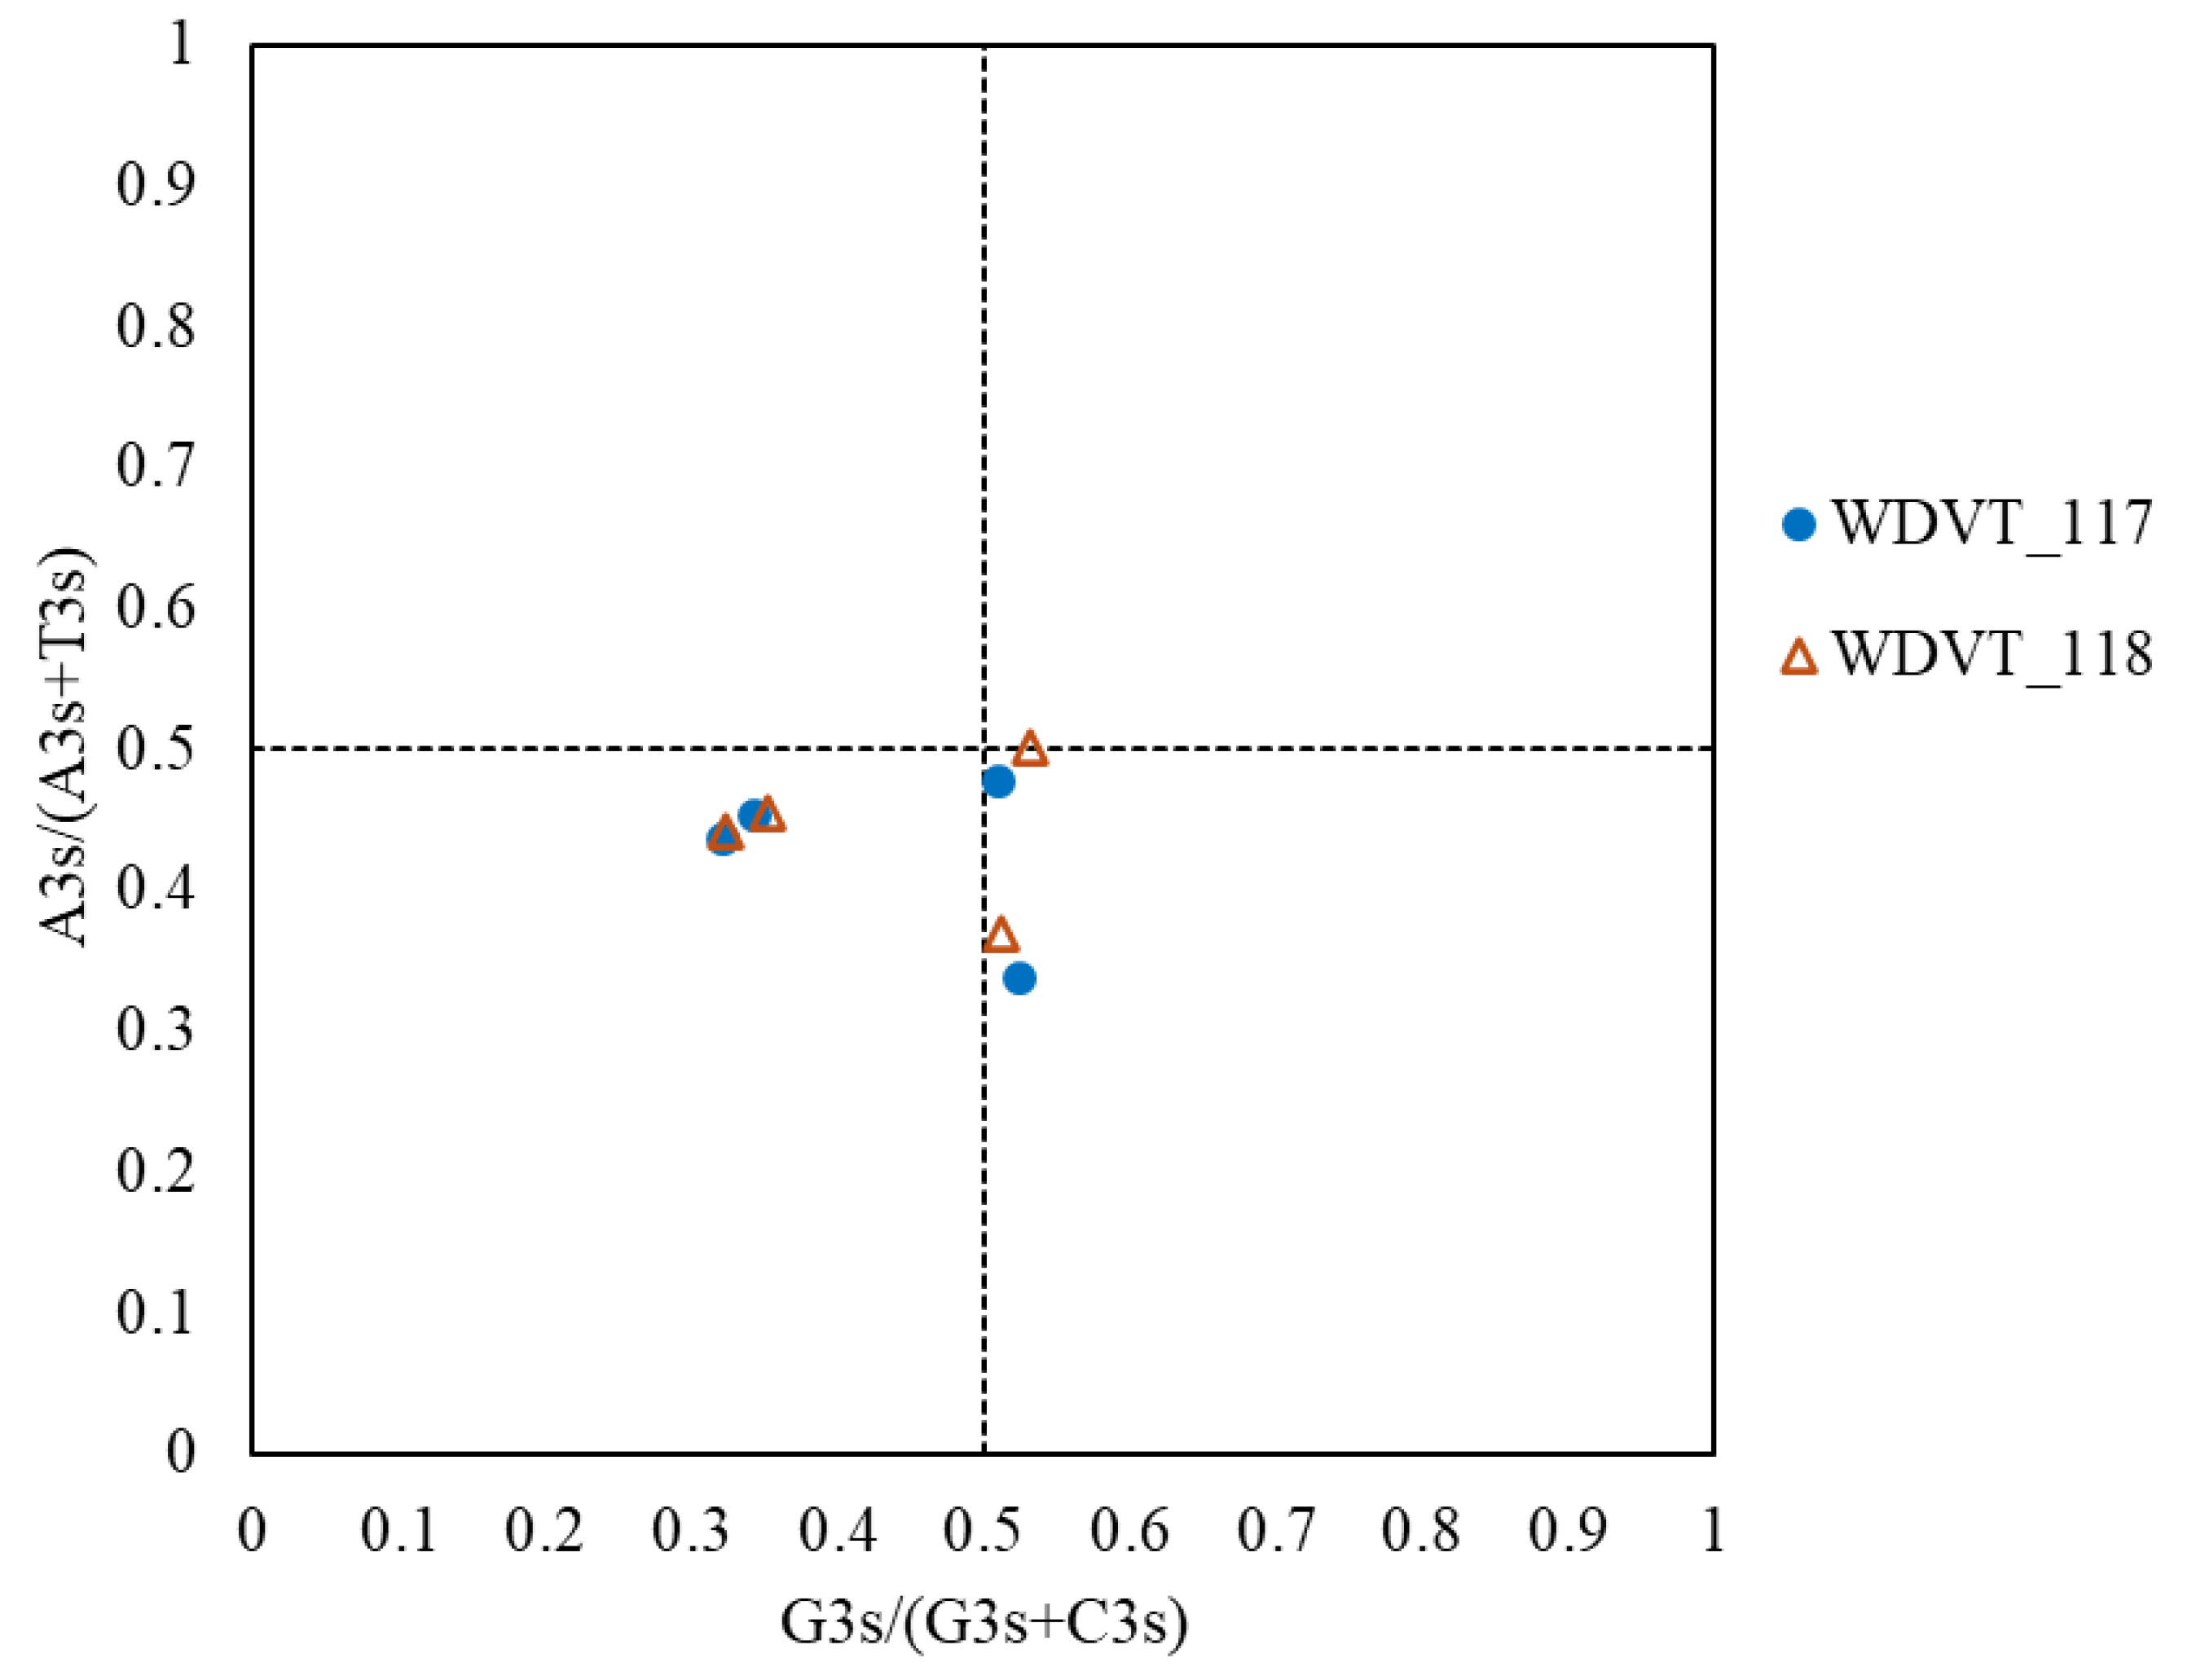
3.7. PR2-Plot Analysis Reveals Codon Usage Bias

PR2-plot analysis further investigated codon usage bias in WDV proteins from triticale. Results showed that the four genes are mainly distributed with A3s/(A3s + T3s) < 0.5, with vectors biased downward and to the sides, more so to the left (Figure 9). This indicates a higher content of T and C in the third base of synonymous codons, revealing imbalanced usage frequencies of codon bases A3, T3, G3, and C3.

3.8. Optimal Codons

Screening by ENC identified V2 as the low-expression gene and V1 as the high-expression gene in both viral strains. RSCU values of V2 and V1 codons were used to establish low-expression (lRSCU) and high-expression (hRSCU) codon sets, respectively. ΔRSCU values were then calculated. The optimal codons of WDVT-117 and WDVT-118 are both UUC and UAC (Table 4).

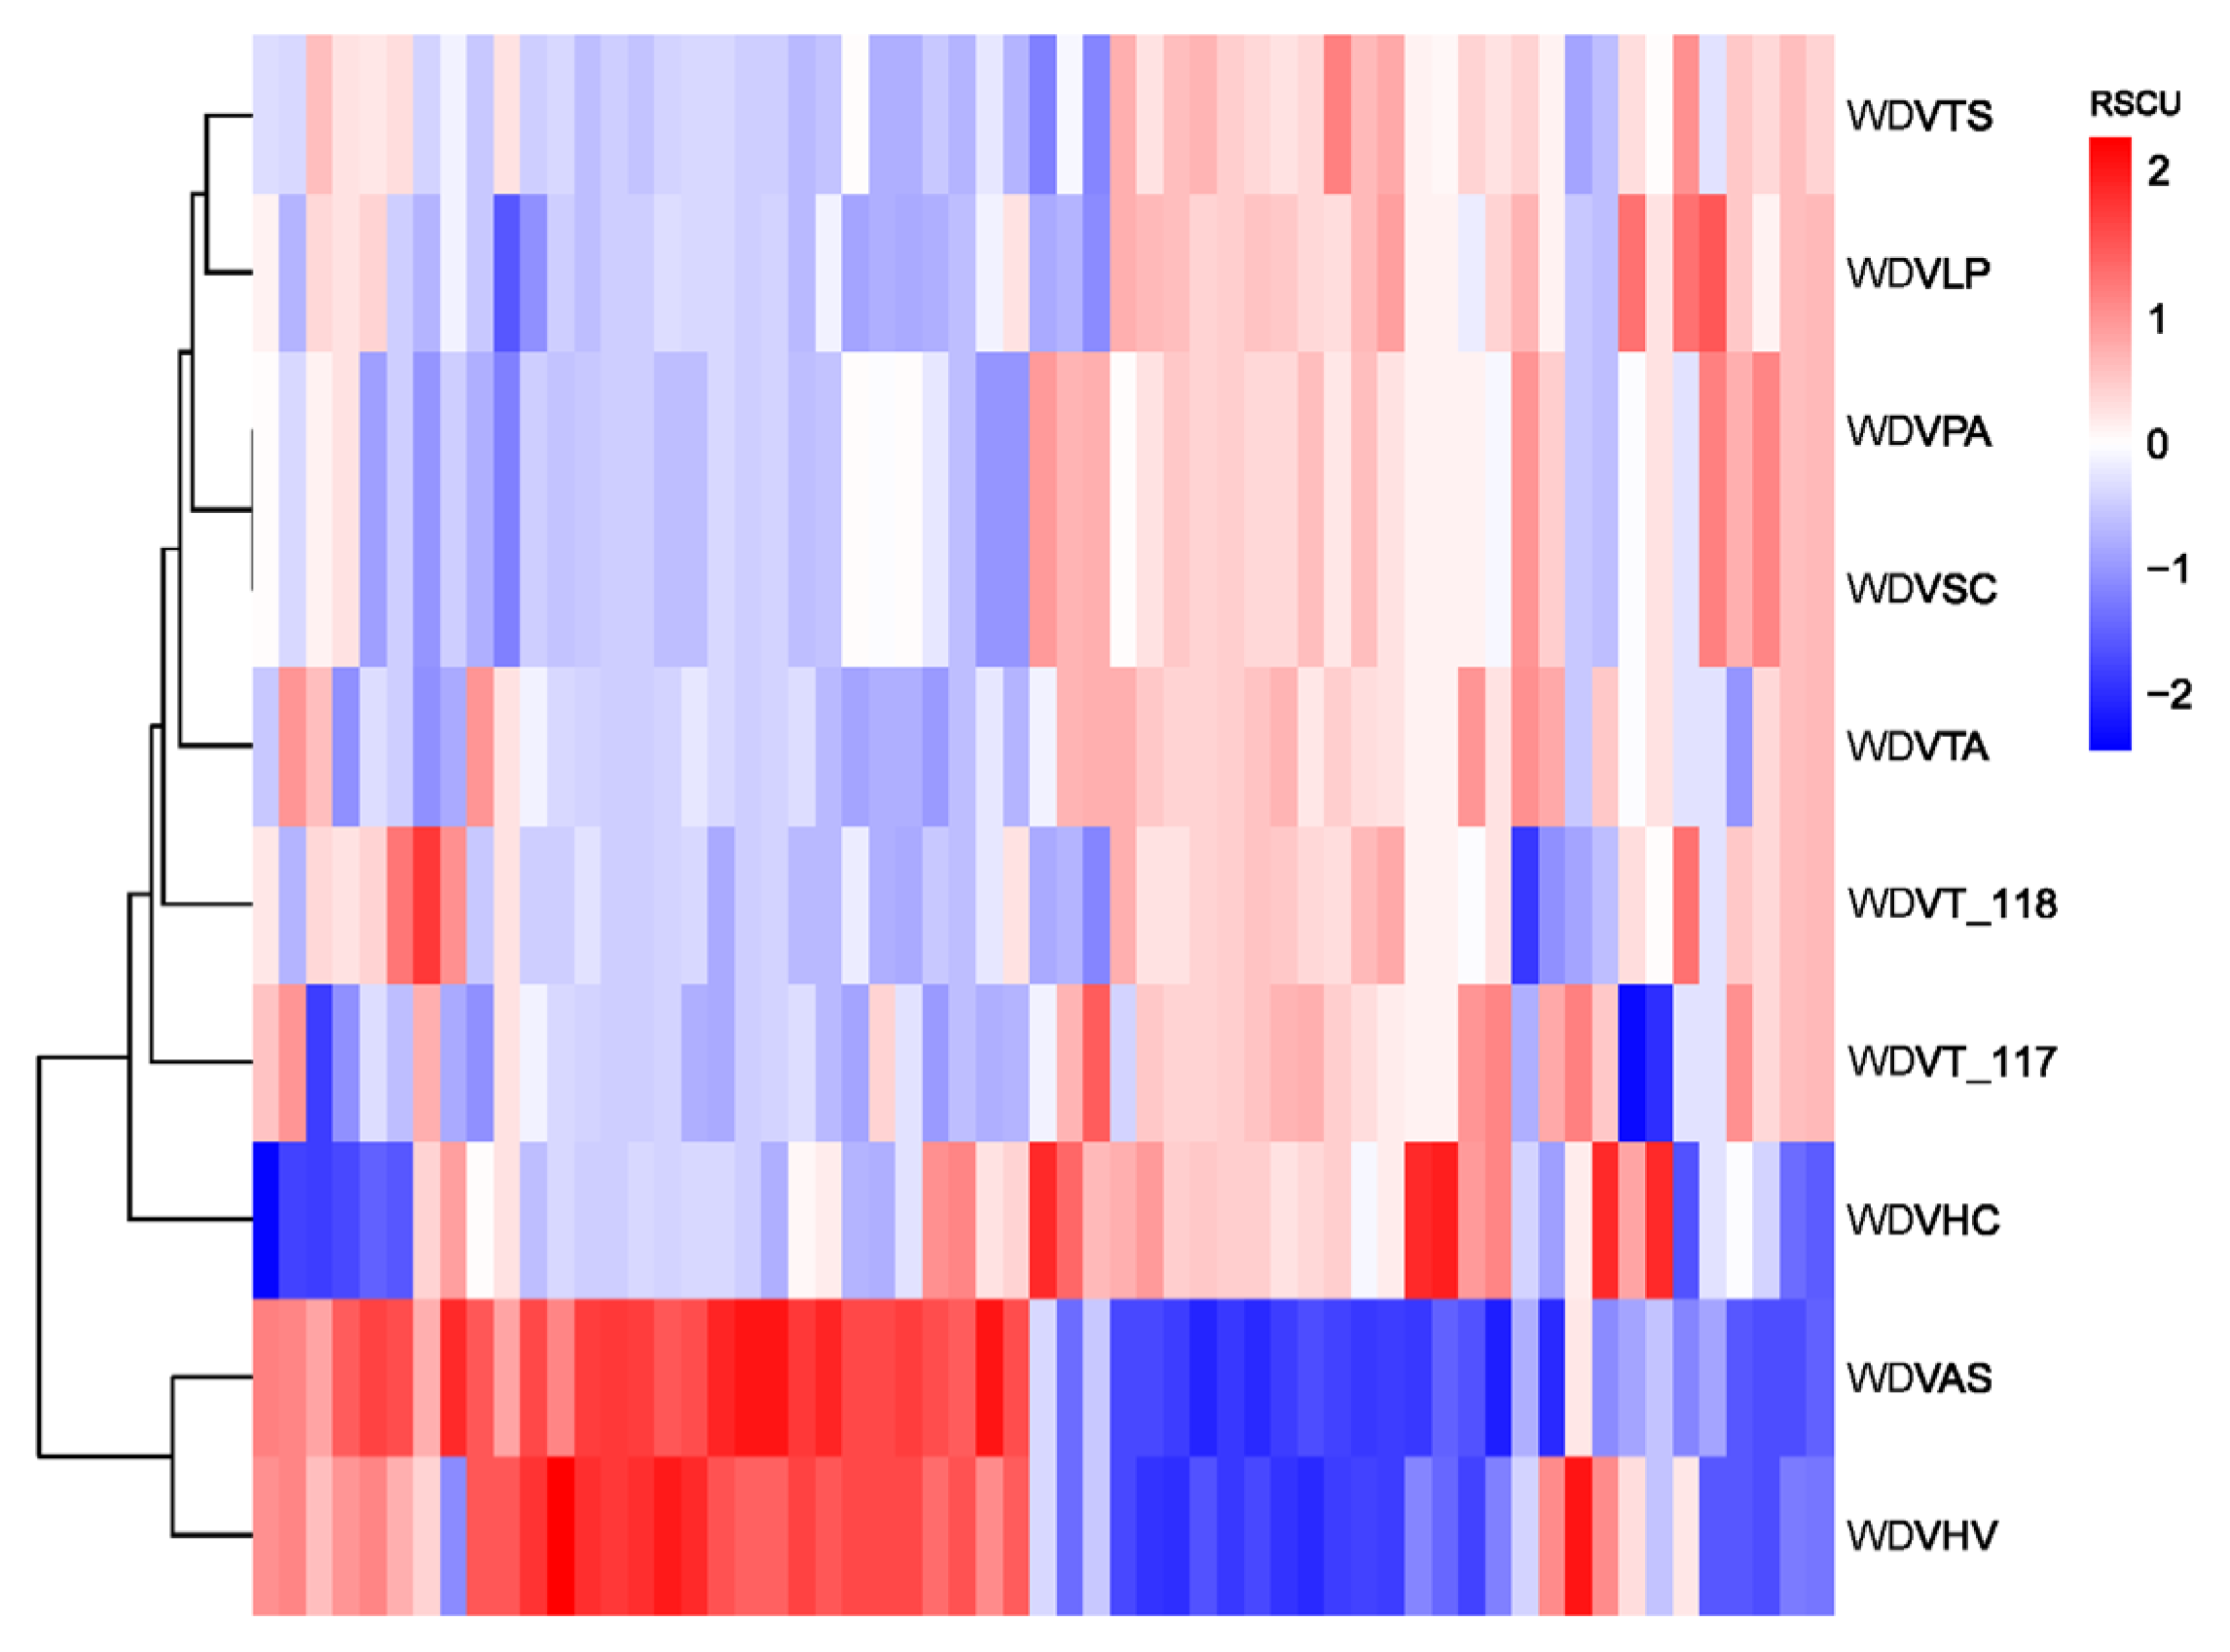
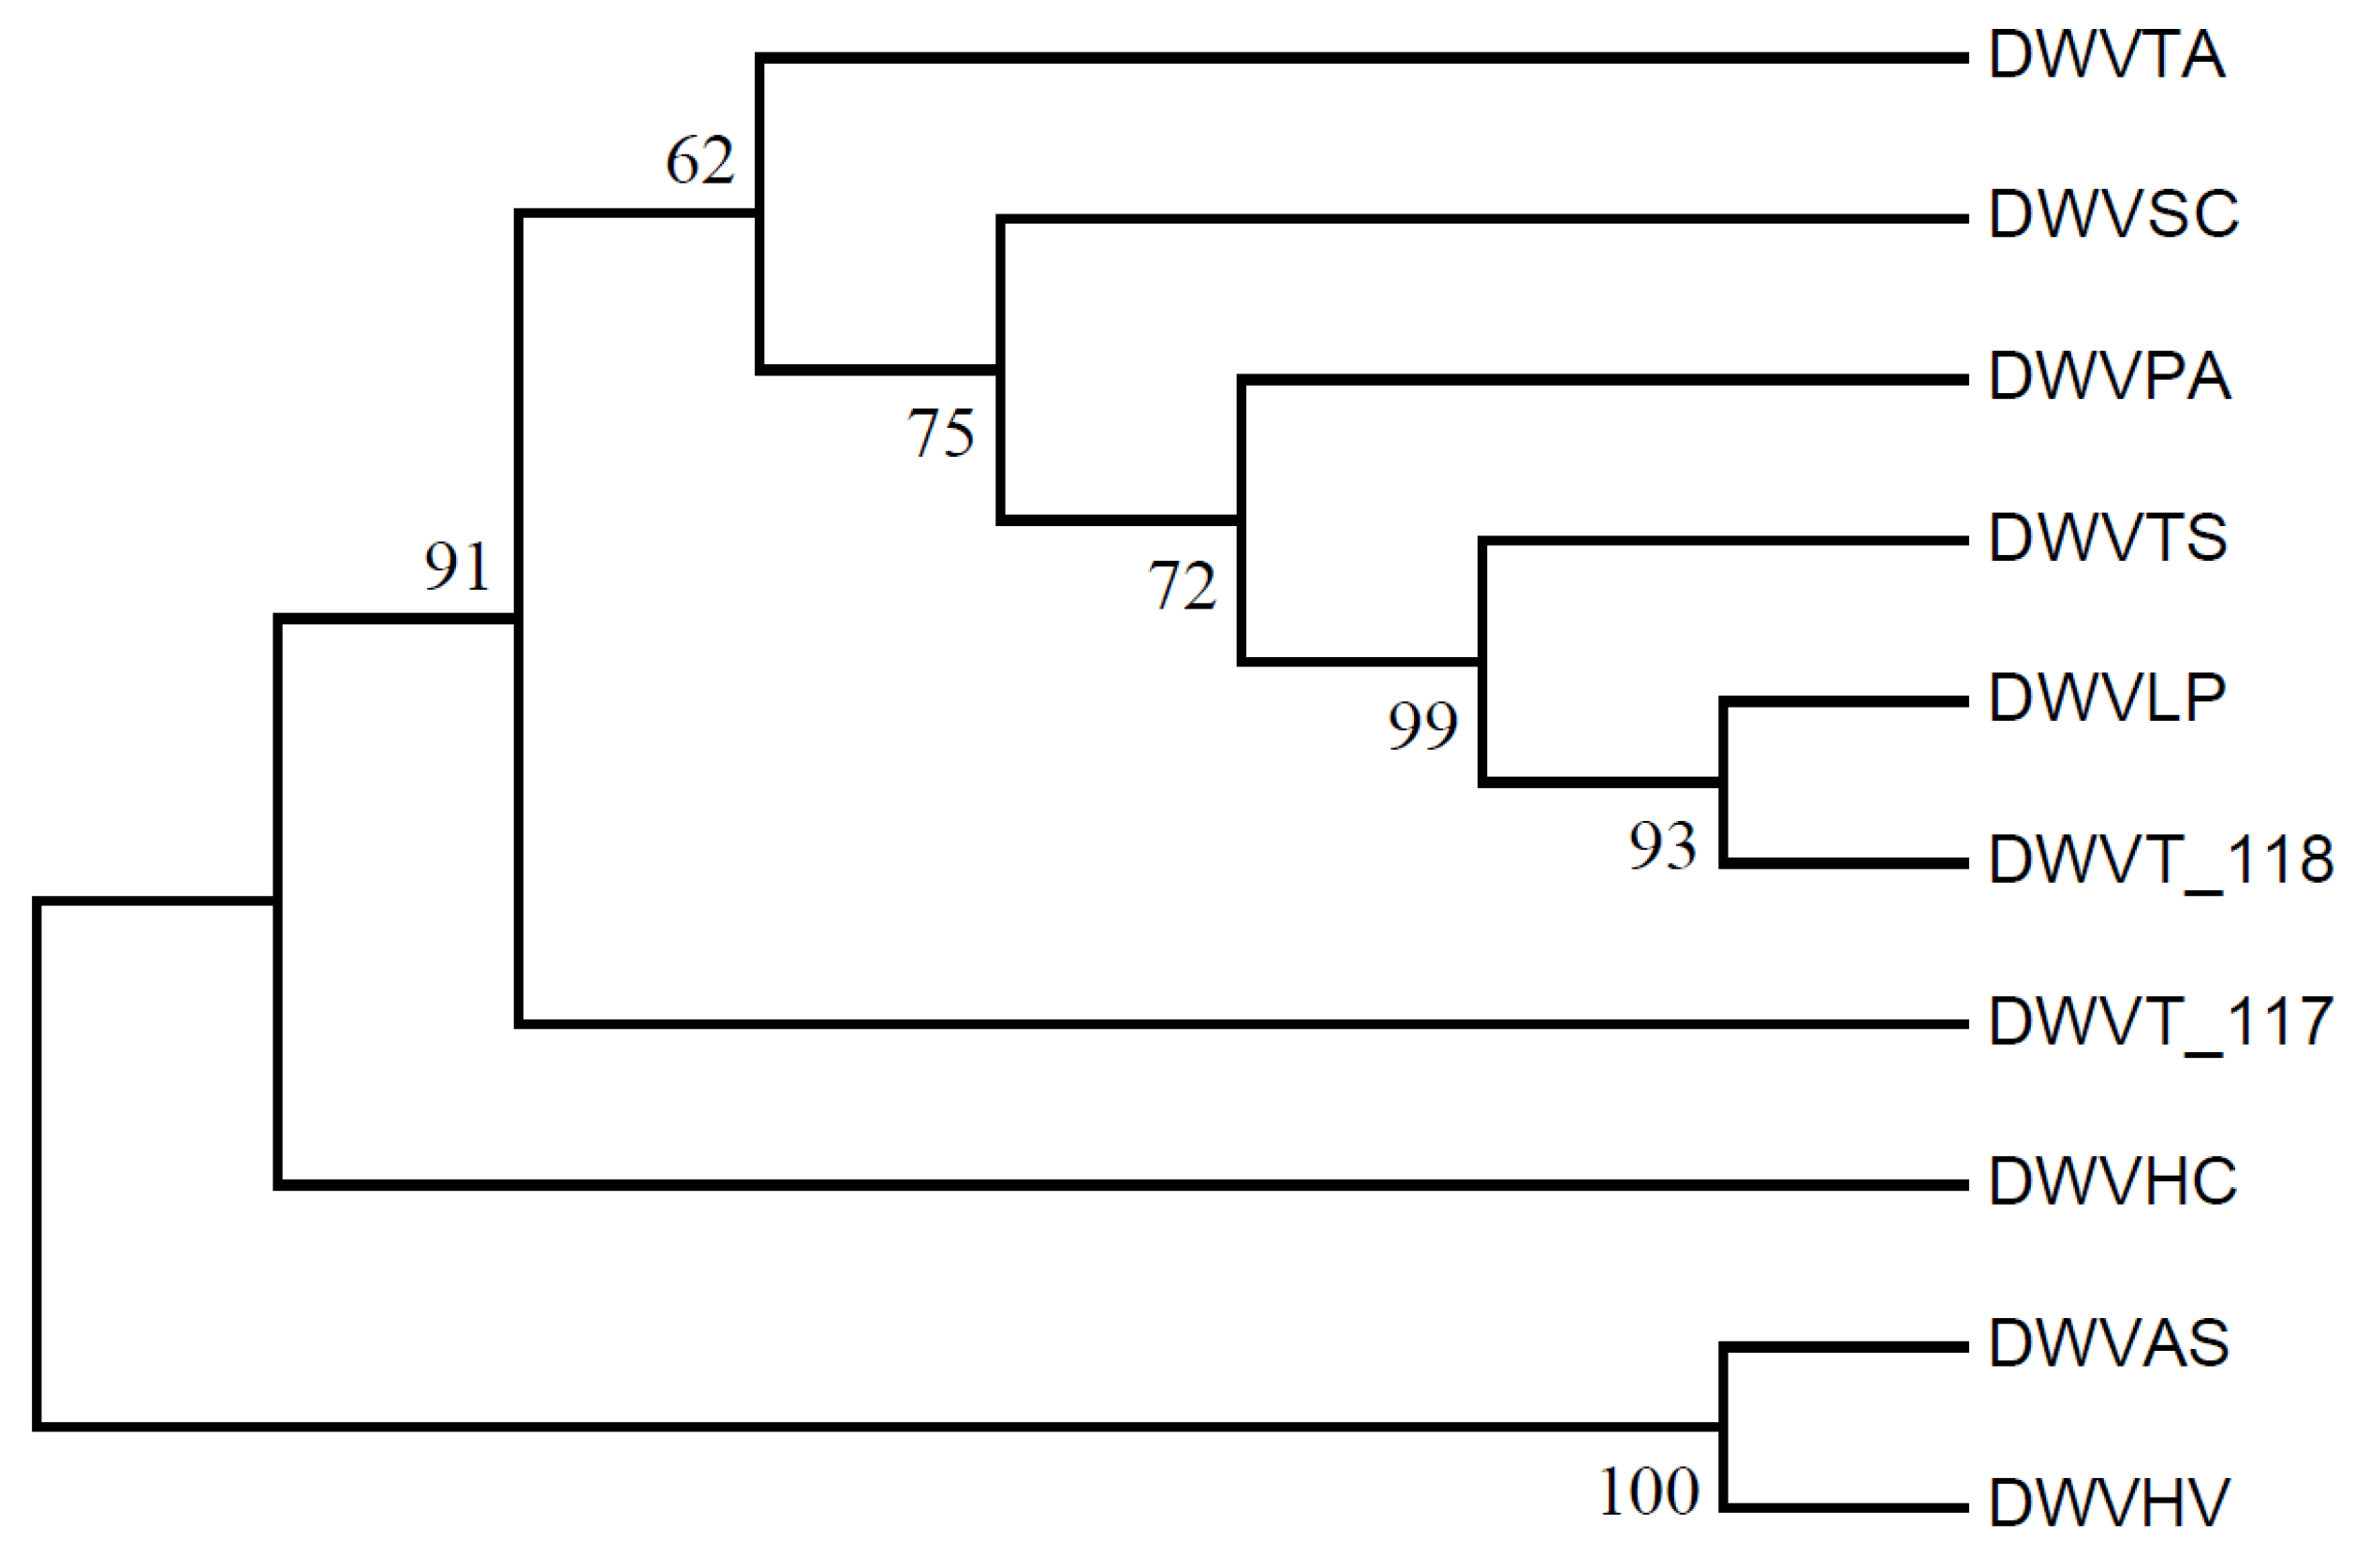
3.9. Phylogenetic Analysis and RSCU Clustering

Clustering based on RSCU values of genes from ten WDV strains revealed that the barley and oat isolates (WDVHV and WDVAS) formed one cluster, while the others, including triticale isolates WDVT_117 and WDVT_118, formed another, with the barley grass isolate (WDVHC) at its base. Notably, WDVT_117 and WDVT_118 did not cluster together in subordinate branches (Figure 10). A phylogenetic tree constructed using the maximum likelihood method based on the genome sequences of the ten stains also showed WDVHV and WDVAS in one cluster, WDVHC in another, and WDVT_117 and WDVT_118 in separate subordinate branches (Figure 11).

4. Discussion

Codon usage bias is widespread in various organisms and plays a significant role in gene expression regulation and species evolution [13,14,15,16,17,18,19,20,26,28,34,35]. According to the neutral evolution theory, the accumulation of high-frequency mutations in genomes may lead to the non-random distribution of specific codons [36,37,38,39,40]. Natural selection drives the formation of codon bias by optimizing translation efficiency, such as the adaptation of highly expressed genes to host tRNA abundance [34,40,41,42,43,44]. Additionally, genetic drift and interactions with multiple factors further shape codon usage patterns [14,15,16,45,46]. As obligate intracellular parasites, the codon usage evolution of viruses is closely related to host adaptation [47]. This study focuses on the codon usage characteristics of WDVT and systematically explores its evolutionary drivers.
The genomes of the 10 WDV strains analyzed range from 2734 to 2750 nt in length. Notably, the triticale-derived isolates WDVT_117 (2750 nt) and WDVT_118 (2748 nt) exhibit highly conserved gene compositions, with no significant differences in the GRAVY and Aromo index of their encoded proteins. Importantly, the G/A content at the third base position of their CDS is significantly lower than that of T/C (mean GC3s: 0.48), and follows a hierarchical decrease in the order GC1 > GC3 > GC2. This pattern is consistent with that observed in other viruses such as porcine circovirus [48], Zika virus [49], Pestivirus [50], and five species of silkworm viruses [51], suggesting similar evolutionary pressures or mechanisms in codon usage. However, it differs from viruses like rice yellow mottle virus [52]. Additionally, the relationship between GC1, GC2, and GC3 in different individuals of Soybean Mosaic Virus [53] shows marked differences, indicating that distinct viruses may exhibit significant variations in codon usage bias. This supports the hypothesis that the evolution of codon usage bias in plant DNA viruses is driven by host-selection pressure while retaining inherent genomic constraints [54].
The CAI values of WDVTs are generally low (WDVT_117: 0.155–0.267; WDVT_118: 0.145–0.269), indicating low matching with the codon usage of host high-expression genes. Research shows that Mastrevirus activates its gene transcription by hijacking the host’s epigenetic mechanisms, such as DNA methylation modification [55,56]. This mechanism may reduce the virus’s dependence on host optimal codons, instead balancing gene expression efficiency and host defense evasion through epigenetic regulation, leading to lower CAI values [56]. The V1 gene has the lowest CAI values in both strains (WDVT-117: 0.155; WDVT-118: 0.145), much lower than other genes. This is likely related to the function of movement protein V1, which mediates virus particle transport between cells [26,57,58], so it does not need to match the codon usage of specific host high-expression genes. The CBI values of both strains are generally low (WDVT_117: −0.026 to 0.100; WDVT_118: −0.042 to 0.111), indicating poor adaptation to host-preferred codons [27]. ENC values are in the high range, above 40, with V2 having the highest ENC value of 61 [25]. This aligns with the overall low CAI and CBI values, all suggesting weak codon usage bias. UUC and UAC were identified as the shared optimal codons in both WDVT strains, and its high usage in highly expressed genes implies a potential significant role in virus adaptation [47,48,49,50,51,52,53,54].
Despite the WDVT genome containing only four genes, the correlation coefficients among some codon indexes still reveal certain trends. The extremely strong positive correlations between CAI and CBI, and between CAI and CDS length, suggest that during gene elongation, viruses may need to co-optimize codon selection to maintain host tRNA compatibility [59]. The strong positive correlation between GC1 and GC2 indicates similar constraints on the first two bases, while the strong negative correlation between GC2 and CDS length suggests selective reduction in GC content during gene elongation. Results from neutrality plot, ENC-plot, and PR2-plot analyses consistently show that codon usage bias in WDVT is jointly influenced by mutation and natural selection, with natural selection being the dominant factor. Functional optimizations such as translation efficiency and tRNA abundance adaptation may drive the natural selection [24,25,59,60].
WDV has a broad spectrum of graminaceous crop infestation [61]. Cluster analysis based on RSCU values and the construction of an MP phylogenetic tree show that strains from barley and oats form one cluster, while those from triticale and others form another. This indicates that the genetic relationships among WDV strains do not align with the phylogenetic relationships of their hosts. This suggests that the WDV strains infecting triticale may have a high degree of genetic diversity, potentially accelerated by genomic recombination or epigenetic interactions in the artificially synthesized host triticale [11]. The biodiversity of the virus may be responsible for its broad attack capability.
Our current understanding of WDVT codon usage patterns remains constrained by two critical limitations: the scarcity of viral genomic data (only two triticale-derived isolates available) and the absence of a complete reference genome for its host, triticale. Viral codon usage is shaped by complex interactions between host-specific factors—including tRNA pool adaptation, transcriptional mechanisms, immune pressures, and genomic nucleotide composition—and evolutionary pressures from virus–host coevolution [62,63,64]. However, the lack of triticale’s genome impedes precise analysis of key indices such as the CAI and identification of optimal codons, which are essential for elucidating how WDVT balances mutational constraints with host adaptation strategies. For instance, comparative analysis of host and viral nucleotide composition could reveal whether WDVT codon bias aligns with triticale’s genomic signatures, a hallmark of host-driven selection. Therefore, future research must prioritize (1) expanding the WDVT genomic dataset to capture strain-specific variations and evolutionary trends, and (2) obtaining triticale’s genome to systematically evaluate how its genomic architecture and molecular machinery shape WDVT codon usage. These advancements will provide a robust framework to dissect the adaptive mechanisms driving WDVT evolution and its ecological success in triticale systems.

5. Conclusions

In this study, we investigated into the codon usage patterns and evolutionary forces at play in WDVT. Through comprehensive analysis of ten WDV isolates, including two WDVT, we uncovered several key insights. The WDVT strains exhibited weak SCUB, with natural selection emerging as the predominant force shaping their codon usage patterns, as evidenced by neutrality analysis and ENC-plot distributions. Shared optimal codons (UUC and UAC) in highly expressed genes were identified, potentially playing a crucial role in virus adaptation. Furthermore, WDVT strains formed a distinct cluster with elevated genetic diversity, possibly driven by genomic recombination in the synthetic host.
These findings enhance our understanding of the evolutionary dynamics of WDVT, providing a foundation for codon-based antiviral research. By clarifying the codon usage patterns and the factors influencing them, we can potentially develop more effective strategies to combat WDV infections in triticale. This is crucial given the importance of triticale as a high-quality forage crop with significant agricultural value. Our study also highlights the need for further research to expand the WDVT genomic dataset and obtain triticale’s genome to gain a more comprehensive understanding of the virus-host interactions and evolutionary mechanisms. Overall, this work contributes to the broader field of viral evolution and host-pathogen interactions, offering valuable insights for agricultural research and crop protection.

Author Contributions

Conceptualization, J.W. and J.L. (Jing Liu); methodology, J.W.; software, J.D.; validation, J.L. (Jiaqian Liu), X.L. and B.G.; formal analysis, H.W.; data curation, J.W.; writing—original draft preparation, J.W. and J.D.; writing—review and editing, J.W., X.L. and C.Z.; visualization, J.L. (Jiaqian Liu); supervision, H.W.; project administration, J.W.; funding acquisition, J.W. and H.W. All authors have read and agreed to the published version of the manuscript.

Funding

This research was funded by the Qinghai Provincial Department of Science and Technology (Qinghai Provincial Science and Technology Major Project, grant number 2023-SF-A5).

Institutional Review Board Statement

Not applicable.

Informed Consent Statement

Not applicable.

Data Availability Statement

The datasets used and/or analyzed during the current study can be obtained from the corresponding authors upon reasonable request. The datasets analyzed during the current study are available on the website at https://www.scidb.cn/en/s/Nr2eim (accessed on 12 December 2024).

Conflicts of Interest

The authors declare no conflicts of interest.

Abbreviations

The following abbreviations are used in this manuscript:
RSCURelative synonymous codon usage
WDVWheat dwarf virus
WDVTWheat dwarf virus isolates from triticale
CAICodon adaptation index
SCUBSynonymous codon usage bias
CBICodon bias index
ENCEffective number of codons
CDSCoding sequences
AromoAromatic amino acid proportion
GRAVYGrand average of hydropathicity
MPMaximum parsimony

References

  1. Mergoum, M.; Singh, P.K.; Pena, R.J.; Pea, R.J.; Lozano-del Río, A.J.; Gómez, H. Triticale: A “new” crop with old challenges. In Cereals; Springer: New York, NY, USA, 2009; pp. 267–287. [Google Scholar]
  2. Zhu, F. Triticale: Nutritional composition and food uses. Food Chem. 2018, 241, 468–479. [Google Scholar] [CrossRef] [PubMed]
  3. McGoverin, C.M.; Snyders, F.; Muller, N.; Botes, W.; Fox, G.; Manley, M. A review of triticale uses and the effect of growth environment on grain quality. J. Sci. Food Agric. 2011, 91, 1155–1165. [Google Scholar] [CrossRef] [PubMed]
  4. Wang, W.Q.; Liu, J.; Tian, X.H.; Du, W.H. Evaluations on the adaptability of Triticosecale wittmack “Gannong NO.4” in different regions of Qinghai Province. Acta Agrestia Sin. 2020, 28, 1626–1634. [Google Scholar]
  5. Hammouda, D.; Baaziz, N.; Khalfallah, N. Genetic characterization of octoploid (AABBDDRR) and hexaploid (AABBRR) triticales. Eur. Sci. J. 2015, 11, 284–296. [Google Scholar]
  6. Wang, B.L.; Chen, Q.F.; Men, W.Q.; Tian, X.B.; Miao, J.N.; He, J.Q.; Zhao, Y.; Li, H.H.; Liu, W.X. Analysis of chromosome compasition of different plant heights. J. Henan Agric. Univ. 2021, 55, 631–638. [Google Scholar]
  7. Yang, T.; Chen, X.Y.; Sui, J.S.; Wang, W.; Yang, C.M.; Peng, Z.; Geng, G.D.; Zhang, Q.Q.; Zhang, S.Q. Chromosomic analysis of hexaploid triticale by fluorescence in situ hybridization. J. Southwest Univ. (Nat. Sci. Ed.) 2019, 41, 42–48. [Google Scholar]
  8. Parizipour, M.H.G.; Ramazani, L.; Sardrood, B.P. Temperature affected Transmission, Symptom Development and Accumulation of Wheat Dwarf Virus. Plant Prot. Sci. 2018, 54, 222–233. [Google Scholar] [CrossRef]
  9. Mishchenko, L.T.; Dunich, A.A.; Mishchenko, I.A.; Dashchenko, A.V.; Kozub, N.O.; Kyslykh, T.M.; Molodchenkova, O.O. Wheat dwarf virus in Ukraine: Occurrence, molecular characterization and impact on the yield. J. Plant Dis. Prot. 2022, 129, 107–116. [Google Scholar] [CrossRef]
  10. Vacke, J. Wheat dwarf virus disease. Biol. Plant. 1961, 3, 228–233. [Google Scholar] [CrossRef]
  11. Pfrieme, A.K.; Will, T.; Pillen, K.; Stahl, A. The Past, Present, and Future of Wheat Dwarf Virus Management—A Review. Plants 2023, 12, 3633. [Google Scholar] [CrossRef]
  12. Wang, X.F.; Liu, Y.; Han, C.G.; Wu, Y.F.; Zhao, Z.H. Present situation and development strategies for the research and control of wheat viral diseases. Plant Prot. 2010, 36, 13–19. [Google Scholar]
  13. Murray, E.E.; Lotzer, J.; Eberle, M. Codon usage in plant genes. Nucleic Acids Res. 1989, 17, 477–498. [Google Scholar] [CrossRef] [PubMed]
  14. Quax, T.E.F.; Claassens, N.J.; Söll, D.; Oost, J. Codon bias as a means to fine-tune gene expression. Mol. Cell 2015, 59, 149–161. [Google Scholar] [CrossRef] [PubMed]
  15. Parvathy, S.T.; Udayasuriyan, V.; Bhadana, V. Codon usage bias. Mol. Biol. Rep. 2022, 49, 539–565. [Google Scholar] [CrossRef]
  16. Kurland, C.G. Codon bias and gene expression. FEBS Lett. 1991, 285, 165–169. [Google Scholar] [CrossRef]
  17. Li, X.Z.; Song, H.; Zhang, Z.H.; Xu, H.F.; Liu, X.; Li, Y.L.; Li, C.J. Analysis of codon usage bias in the genome of Epichloë gansuensis. Acta Prataculturase Sin. 2020, 29, 67–77. [Google Scholar]
  18. Gao, S.Y.; Li, Y.Y.; Yang, Z.Q.; Dong, K.H.; Xia, F.S. Codon usage bias analysis of the chloroplast genome of Bothriochloa ischaemum. Acta Prataculturase Sin. 2023, 32, 85–95. [Google Scholar]
  19. Yang, G.F.; Su, K.L.; Zhao, Y.R.; Song, Z.B.; Sun, J. Analysis of codon usage in the chloroplast genome of Medicago truncatula. Acta Prataculturase Sin. 2015, 24, 171–179. [Google Scholar]
  20. Komar, A.A. The Yin and Yang of codon usage. Hum. Mol. Genet. 2016, 25, R77–R85. [Google Scholar] [CrossRef]
  21. Schaefer, S. Hepatitis B virus genotypes in Europe. Hepatol. Res. 2007, 37, S20–S26. [Google Scholar] [CrossRef]
  22. Wu, W.Q.; Hu, Y.; Hu, J.L.; Huang, A.L.; Tu, Z. Codon usage bias of the hepatitis B virus and factors influencing it. J. Pathog. Biol. 2020, 15, 1404–1410. [Google Scholar]
  23. Meade, J.C.; Shah, P.H.; Lushbaugh, W.B. Trichomonas vaginalis: Analysis of codon usage. Exp. Parasitol. 1997, 87, 73–74. [Google Scholar] [CrossRef] [PubMed]
  24. Sharp, P.M.; Li, W.H. An evolutionary perspective on synonymous codon usage in unicellular organisms. J. Mol. Evol. 1986, 24, 28–38. [Google Scholar] [CrossRef] [PubMed]
  25. Wright, F. The ‘effective number of codons’ used in a gene. Gene 1990, 87, 23–29. [Google Scholar] [CrossRef]
  26. Sharp, P.M.; Li, W.H. The codon adaptation index-a measure of directional synonymous codon usage bias, and its potential applications. Nucleic Acids Res. 1987, 15, 1281–1295. [Google Scholar] [CrossRef]
  27. Bennetzen, J.L.; Hall, B.D. Codon selection in yeast. J. Biol. Chem. 1982, 257, 3026–3031. [Google Scholar] [CrossRef]
  28. Biswas, K.K.; Palchoudhury, S.; Chakraborty, P.; Bhattacharyya, U.K.; Ghosh, D.K.; Debnath, P.; Ramadugu, C.; Keremane, M.K.; Khetarpal, R.K.; Lee, R.F. Codon usage bias analysis of Citrus tristeza virus: Higher codon adaptation to Citrus reticulata host. Viruses 2019, 11, 331. [Google Scholar] [CrossRef]
  29. Sueoka, N. Translation-coupled violation of Parity Rule 2 in human genes is not the cause of heterogeneity of the DNA G+C content of third codon position. Gene 1999, 238, 53–58. [Google Scholar] [CrossRef]
  30. Sueaoka, N. Directional mutation pressure and neutral molecular evolution. Proc. Natl. Acad. Sci. USA 1988, 85, 2653–2657. [Google Scholar] [CrossRef]
  31. Lin, Z.C.; Yang, S.H.; Mallavia, L.P. Codon usage and nucleotide composition in Coxiella burnetii. Gene 1997, 198, 171–180. [Google Scholar] [CrossRef]
  32. Ling, L.Z.; Zhang, S.D.; Yang, T. Analysis of Codon Usage Bias in Chloroplast Genomes of Dryas octopetala var. asiatica (Rosaceae). Genes 2024, 15, 899. [Google Scholar] [PubMed]
  33. Tamura, K.; Stecher, G.; Kumar, S. MEGA11: Molecular evolutionary genetics analysis version 11. Mol. Biol. Evol. 2021, 38, 3022–3027. [Google Scholar] [CrossRef] [PubMed]
  34. Chamary, J.V.; Parmley, J.L.; Hurst, L.D. Hearing silence: Non-neutral evolution at synonymous sites in mammals. Nat. Rev. Genet. 2006, 7, 98–108. [Google Scholar] [CrossRef] [PubMed]
  35. Wu, X.K.; Xu, M.Z.; Yang, J.R.; Lu, J. Genome-wide impact of codon usage bias on translation optimization in Drosophila melanogaster. Nat. Commun. 2024, 15, 8329. [Google Scholar] [CrossRef]
  36. Chen, S.L.; Lee, W.; Hottes, A.K.; Shapiro, L.; Mcadams, H.H. Codon usage between genomes is constrained by genome-wide mutational processes. Proc. Natl. Acad. Sci. USA 2004, 101, 3480–3485. [Google Scholar] [CrossRef]
  37. Galtier, N.; Piganeau, G.; Mouchiroud, D.; Duret, L. GC-content evolution in mammalian genomes: The biased gene conversion hypothesis. Genetics 2001, 159, 907–911. [Google Scholar] [CrossRef]
  38. Lin, Y.S.; Byrnes, J.K.; Hwang, J.K.; Li, W.H. Codon-usage bias versus gene conversion in the evolution of yeast duplicate genes. Proc. Natl. Acad. Sci. USA 2006, 103, 14412–14416. [Google Scholar] [CrossRef]
  39. Sharp, P.M.; Averof, M.; Lloyd, A.T.; Matassi, G.; Peden, J.F. DNA sequence evolution: The sounds of silence. Philos. Trans. R. Soc. Lond. Ser. B Biol. Sci. 1995, 349, 241–247. [Google Scholar]
  40. Duret, L. Evolution of synonymous codon usage in metazoans. Curr. Opin. Genet. Dev. 2002, 12, 640–649. [Google Scholar] [CrossRef]
  41. Lu, J.; Wu, C.I. Weak selection revealed by the whole-genome comparison of the X chromosome and autosomes of human and chimpanzee. Proc. Natl. Acad. Sci. USA 2005, 102, 4063–4067. [Google Scholar] [CrossRef]
  42. Shen, X.K.; Song, S.L.; Li, C.; Zhang, J.Z. Synonymous mutations in representative yeast genes are mostly strongly non-neutral. Nature 2022, 606, 725–731. [Google Scholar] [CrossRef] [PubMed]
  43. Hershberg, R.; Petrov, D.A. Selection on codon bias. Annu. Rev. Genet. 2008, 42, 287–299. [Google Scholar] [CrossRef] [PubMed]
  44. Akashi, H.; Eyre-Walker, A. Translational selection and molecular evolution. Curr. Opin. Genet. Dev. 1998, 8, 688–693. [Google Scholar] [CrossRef] [PubMed]
  45. Kimura, M. Preponderance of synonymous changes as evidence for the neutral theory of molecular evolution. Nature 1977, 267, 275–276. [Google Scholar] [CrossRef]
  46. Shah, P.; Gilchrist, M.A. Explaining complex codon usage patterns with selection for translational efficiency, mutation bias, and genetic drift. Proc. Natl. Acad. Sci. USA 2011, 108, 10231–10236. [Google Scholar] [CrossRef]
  47. Wong, E.H.; Smith, D.K.; Rabadan, R.; Poon, P.L.L. Codon usage bias and the evolution of influenza A viruses. Codon Usage Biases of Influenza Virus. BMC Evol. Biol. 2010, 10, 253. [Google Scholar] [CrossRef]
  48. Xu, X.; Ding, T.Y.; Yu, W.; Jiang, Y.H.; Quan, Y.P. Analysis of codon usage bias in porcine circovirus gene. Chin. J. Prev. Vet. Med. 2018, 40, 471–475. [Google Scholar]
  49. Zhan, J.F.; Luo, H.; Hu, S.S.; Wu, Q.; Yao, H.P. Genome codon bias analysis of Zika virus. Genom. Appl. Biol. 2017, 36, 426–432. [Google Scholar]
  50. Wang, G.C.; Qiao, J.; Meng, Q.L.; Liu, Y.C.; Yang, H.B.; He, Z.H.; Peng, Y.L.; Xie, K.; Chen, C.F. Analysis of synonymous codon preferences of poly protease genes in three viruses of Flaviviridae Pestivirus genus. J. Northwest A&F Univ. (Nat. Sci. Ed.) 2015, 43, 7–13. [Google Scholar]
  51. Shi, S.L.; Li, M.M.; Jiang, Y.R.; Yang, R.S.; Qin, L. Analysis on codon and codon-pair usage pattern in five Silkworm viruses. Sci. Seric. 2012, 38, 0273–0280. [Google Scholar]
  52. Rahman, S.U.; Nawaz, S.; Ullah, S.; Rahman, I.U.; Haq, M.I.U.; Khan, M.A.; Al-Ghamdi, A.A.; Al-Hemaid, F.M.; Elshikh, M.S.; Aljowaie, R.M.; et al. Study of codon usage patterns and influencing factors in rice yellow mottle virus based on coding sequence data. Agronomy 2022, 12, 1990. [Google Scholar] [CrossRef]
  53. Yuan, Y.Y.; Huang, S.H.; Wang, C.K.; Zhi, H.J. Analysis on codon usage and evolution of Soybean Mosaic virus. Soybean Sci. 2014, 33, 801–807. [Google Scholar]
  54. Simón, D.; Cristina, J.; Musto, H. Nucleotide composition and codon usage across viruses and their respective hosts. Front. Microbiol. 2021, 12, 646300. [Google Scholar] [CrossRef] [PubMed]
  55. Chen, Z.Q.; Zhao, J.H.; Chen, Q.; Zhang, Z.H.; Li, J.; Guo, Z.X.; Xie, Q.; Ding, S.W.; Guo, H.S. DNA geminivirus infection induces an imprinted E3 ligase gene to epigenetically activate viral gene transcription. Plant Cell 2020, 32, 3256–3272. [Google Scholar] [CrossRef]
  56. Hu, T.; Li, C.; Liu, H.; Su, C.; Wang, Y.; Li, F.; Zhou, X. Geminivirus βV1 protein activates bZIP17/28-mediated UPR signaling to facilitate viral pathogenicity but its activity is attenuated by autophagic degradation in plants. Plant Commun. 2024, 26, 101198. [Google Scholar] [CrossRef]
  57. Boulton, M.I.; Pallaghy, C.K.; Chatani, M.; MacFarlane, S.; Davies, J.W. Replication of maize streak virus mutants in maize protoplasts: Evidence for a movement protein. Virology 1993, 192, 85–93. [Google Scholar] [CrossRef]
  58. Kotlizky, G.; Boulton, M.I.; Pitaksutheepong, C.; Davies, J.W.; Epel, B.L. Intracellular and intercellular movement of maize streak geminivirus V1 and V2 proteins transiently expressed as green fluorescent protein fusions. Virology 2000, 274, 32–38. [Google Scholar] [CrossRef]
  59. Chen, F.; Wu, P.; Deng, S.Y.; Zhang, H.; Hou, Y.T.; Hu, Z.; Zhang, J.Z.; Chen, X.S.; Yang, J.R. Dissimilation of synonymous codon usage bias in virus–host coevolution due to translational selection. Nat. Ecol. Evol. 2020, 4, 589–600. [Google Scholar] [CrossRef]
  60. Hao, J.; Liang, Y.Y.; Wang, T.; Su, Y.J. Correlations of gene expression, codon usage bias, and evolutionary rates of the mitochondrial genome show tissue differentiation in Ophioglossum vulgatum. BMC Plant Biol. 2025, 25, 134. [Google Scholar] [CrossRef]
  61. Stanković, I.; Zečević, K.; Ristić, D.; Vučurović, I.; Krstić, B. Molecular characterization of wheat dwarf virus isolates from Serbia based on complete genome sequences. Front. Microbiol. 2024, 15, 1469453. [Google Scholar] [CrossRef]
  62. Pintó, R.M.; Burns, C.C.; Moratorio, G. Codon usage and dinucleotide composition of virus genomes: From the virus-host interaction to the development of vaccines. Front. Microbiol. 2021, 12, 791750. [Google Scholar] [CrossRef] [PubMed]
  63. Mordstein, C.; Cano, L.; Morales, A.C.; Young, B.; Ho, A.T.; Rice, A.M.; Liss, M.; Hurst, L.D.; Kudla, G. Transcription, mRNA export, and immune evasion shape the codon usage of viruses. Genome Biol. Evol. 2021, 13, evab106. [Google Scholar] [CrossRef] [PubMed]
  64. Su, S.; Ni, Z.; Lan, T.; Ping, P.; Tang, J.; Yu, Z.; Hutvagner, G.; Li, J. Predicting viral host codon fitness and path shifting through tree-based learning on codon usage biases and genomic characteristics. Sci. Rep. 2025, 15, 12251. [Google Scholar] [CrossRef] [PubMed]
Figure 1. Frequency heat map of bases.
Biology 14 00524 g001
Figure 2. RSCU bar chart. Each amino acid corresponds to two stacked bars in the chart: the left bar represents WDVT_117, and the right bar represents WDVT_118, showing the RSCU values of synonymous codons for each amino acid in the respective strains. Each color in the stacked bars corresponds to a specific synonymous codon for the amino acids. The same colors are used in the RSCU bar chart above to represent the RSCU values of the respective codons.
Biology 14 00524 g002
Figure 3. ENC radar map.
Biology 14 00524 g003
Figure 4. Bar chart of Aromo values.
Biology 14 00524 g004
Figure 5. Bar chart of GRAVY values.
Biology 14 00524 g005
Figure 7. Neutrality plot analysis of WDV from triticale.
Biology 14 00524 g007
Figure 8. ENC-plot analysis of WDV proteins from triticale.
Biology 14 00524 g008
Figure 9. PR2-plot analysis of WDV proteins from triticale.
Biology 14 00524 g009
Figure 10. Clustering based on RSCU values.
Biology 14 00524 g010
Figure 11. Phylogenetic tree of WDV strains.
Biology 14 00524 g011
Table 1. Information on wheat dwarf virus genomes.
HostAccession NumberGenome LengthDesignation
Triticum aestivumHF968638.12750 ntWDVTA
Hordeum vulgareHG422315.12735 ntWDVHV
Lolium perenneHG422316.12750 ntWDVLP
Secale cerealeHG422318.12749 ntWDVSC
Psammotettix alienusAM040733.12750 ntWDVPA
Avena sativaAM296018.12734 ntWDVAS
Triticum speltaKJ473696.12748 ntWDVTS
Hordeum vulgare var. coelesteKJ536149.12750 ntWDVHC
× TriticosecaleKJ473702.12750 ntWDVT_117
× TriticosecaleKJ473703.12748 ntWDVT_118
Table 2. CDS of wheat dwarf virus from triticale.
GeneProductionLength (nt)
V1movement protein273
V2coat protein783
Repreplication-associated protein1056
RepAreplication-associated protein A795
Table 3. CAI and CBI for each gene of WDVT.
GeneWDVT_117WDVT_118
CAICBICAICBI
V10.155−0.0260.145−0.042
V20.2610.0350.2620.05
Rep0.2670.10.2690.106
RepA0.2660.0980.2690.111
Average0.2370.0520.2360.056
Table 4. Analysis of optimal codons.
Amino AcidCodonWDVT_117WDVT_118
hRSCUlRSCUΔRSCUhRSCUlRSCUΔRSCU
AlaGCA0.50.8889−0.38890.50.7059−0.2059
AlaGCC20.88891.111120.94121.0588
AlaGCG0.50.6667−0.16670.50.9412−0.4412
AlaGCU11.5556−0.555611.4118−0.4118
CysUGC01.2−1.201.2−1.2
CysUGU20.81.220.81.2
AspGAC1.50.8750.6251.50.8750.625
AspGAU0.51.125−0.6250.51.125−0.625
GluGAA0.66671.1−0.43330.66671.2−0.5333
GluGAG1.33330.90.43331.33330.80.5333
PheUUC11.0909−0.090911.0909−0.0909
PheUUU10.90910.090910.90910.0909
GlyGGA0.57141.5−0.92861.33331.5−0.1667
GlyGGC0.57141−0.428601−1
GlyGGG0.57140.50.07140.66670.50.1667
GlyGGU2.285711.2857211
HisCAC00.75−0.7500.6667−0.6667
HisCAU01.25−1.2501.3333−1.3333
IleAUA1.80.751.051.80.751.05
IleAUC01.5−1.501.5−1.5
IleAUU1.20.750.451.20.750.45
LysAAA0.51.3333−0.83330.51.3333−0.8333
LysAAG1.50.66670.83331.50.66670.8333
LeuCUA0.60.50.10.60.50.1
LeuCUC0.63−2.40.63−2.4
LeuCUG0.60.250.351.20.250.95
LeuCUU1.21.5−0.31.21.5−0.3
LeuUUA1.80.251.551.80.251.55
LeuUUG1.20.50.70.60.50.1
MetAUG110110
AsnAAC01−101.1111−1.1111
AsnAAU21120.88891.1111
ProCCA02−202−2
ProCCC1.14290.66670.47621.14290.66670.4762
ProCCG1.71430.22221.49211.71430.22221.4921
ProCCU1.14291.11110.03181.14291.11110.0318
GlnCAA1.33331.27270.06061.33331.27270.0606
GlnCAG0.66670.7273−0.06060.66670.7273−0.0606
ArgAGA10.750.250.85710.750.1071
ArgAGG30.752.252.57140.751.8214
ArgCGA1010.857100.8571
ArgCGC01.125−1.12501.125−1.125
ArgCGG10.3750.6251.71430.3751.3393
ArgCGU03−303−3
SerAGC00.6207−0.620700.6207−0.6207
SerAGU00.6207−0.620700.4138−0.4138
SerUCA01.0345−1.034501.2414−1.2414
SerUCC61.86214.137961.65524.3448
SerUCG000000
SerUCU01.8621−1.862102.069−2.069
ThrACA1.33331.4118−0.07851.33331.33330
ThrACC20.94121.058820.88891.1111
ThrACG00.4706−0.470600.4444−0.4444
ThrACU0.66671.1765−0.50980.66671.3333−0.6666
ValGUA0.80.36360.43640.80.36360.4364
ValGUC00.3636−0.363600.3636−0.3636
ValGUG1.60.72730.87271.60.72730.8727
ValGUU1.62.5455−0.94551.62.5455−0.9455
TrpUGG110110
TyrUAC1.61.16670.43331.61.16670.4333
TyrUAU0.40.8333−0.43330.40.8333−0.4333
Disclaimer/Publisher’s Note: The statements, opinions and data contained in all publications are solely those of the individual author(s) and contributor(s) and not of MDPI and/or the editor(s). MDPI and/or the editor(s) disclaim responsibility for any injury to people or property resulting from any ideas, methods, instructions or products referred to in the content.

