Article

Synergistic Toxicity of Combined Exposure to Acrylamide and Polystyrene Nanoplastics on the Gut–Liver Axis in Mice

1
College of Life Sciences and Agronomy, Zhoukou Normal University, Zhoukou 466001, China
2
College of Biological Engineering, Henan University of Technology, Zhengzhou 450001, China
3
School of Mechanical and Electrical Engineering, Zhoukou Normal University, Zhoukou 466001, China
*
Authors to whom correspondence should be addressed.
Biology 2025, 14(5), 523; https://doi.org/10.3390/biology14050523
Submission received: 23 March 2025 / Revised: 6 May 2025 / Accepted: 7 May 2025 / Published: 9 May 2025
(This article belongs to the Section Toxicology)

Simple Summary

Acrylamide (AA) and nanoplastics (NPs) are two common food contaminants and have been proven to exhibit multiple toxic effects. They have a high probability of coexisting due to the similar sources. Thus, our study aims to investigate the combined toxicity of AA and NPs on mammals from the perspective of the gut–liver axis. By exposing mice to AA, polystyrene NPs (PS-NPs), and AA + PS-NPs for 10 weeks, we observed that combined exposure to AA and PS-NPs resulted in more significant adverse effects than single exposures, including more severe colon and liver damage, liver metabolic disorders, and gut microbiota dysbiosis. Correlation analysis showed that the synergistic toxicity induced by AA + PS-NPs may be attributed to a decrease in short-chain fatty acid (SCFA)-producing bacteria and an increase in pathogenic bacteria. These findings provide novel insights into the understanding of the combined exposure to these two contaminants, serving as a reference for future research assessing the health risks associated with their simultaneous intake.

Abstract

Acrylamide (AA) and nanoplastics (NPs) are common food toxicants. However, their combined toxicity and health risks call for further studies. This study aimed to investigate the combined toxicity of AA and polystyrene NPs (PS-NPs) in mice through drinking water exposure. Co-exposure to AA and PS-NPs aggravated colon and liver damage, including more severe inflammatory infiltration, higher levels of colonic and hepatic pro-inflammatory cytokines, and elevated serum content of lipopolysaccharide and activities of diamine oxidase, alanine aminotransferase, and aspartate aminotransferase compared to single exposures. Co-exposure also significantly downregulated the expression of colonic tight-junction genes ZO-1 and Claudin-5. Metabolomics revealed that co-exposure induced more profound metabolic disorders in the liver, particularly affecting amino acid and carbohydrate metabolism. 16S amplicon sequencing showed that co-exposure caused more drastic gut microbiota dysbiosis, characterized by a decrease in beneficial bacteria (unclassified_f__Oscillospiraceae, Roseburia, UCG-005, Ruminiclostridium, unclassified_o__Clostridia_UCG-014, Fournierella, and Acetatifactor) and an increase in pathogenic bacteria (Eubacterium_xylanophilum_group and Eubacterium_nodatum_group). Correlation analysis indicated a negative correlation between beneficial bacteria and intestinal-liver toxicity indicators and a positive correlation between pathogenic bacteria and these indicators. Overall, our findings showed that AA and PS-NPs exerted synergistic toxicity to the gut–liver axis in mammals, highlighting the higher health risks of their combined ingestion.

1. Introduction

During food thermal processing, some hazardous substances are spontaneously generated, of which acrylamide (AA) is the most representative. AA is prevalent in foods, particularly potato chips, bakery products, coffee, and others [1]. In certain items, AA content exceeds 6 mg/kg, well above the European Union standard (Commission Regulation (EU) 2017/2158 [2]) [3]. Moreover, AA can be detected in drinking water and cigarette smoke [4,5]. Epidemiological evidence shows that AA intake is closely associated with cancer, type 2 diabetes, cardiovascular disease, and depressive symptoms [6,7,8,9]. Toxicological studies have indicated that AA induces carcinogenicity, genotoxicity, neurotoxicity, hepatotoxicity, cardiovascular toxicity, and reproductive toxicity [10]. Our previous studies also showed that AA caused glucose metabolism disorders and intestinal damage [11,12,13]. Significant efforts have been made to reduce AA levels in food products [14]. However, preventing AA formation completely is challenging owing to the inherent presence of reducing sugars and asparagine in food [3].
In addition to AA, some exogenous contaminants have been found in foods, such as microplastics (MPs) and nanoplastics (NPs). Numerous studies show that MPs/NPs can be detected in sea salt, aquatic products, honey, fruits, vegetables, and bottled water [15]. Several recent studies have reported that MPs/NPs can be released from plastic disposable cups, food containers, food pouches, and food packaging materials [16,17,18]. Another study also provides evidence of atmospheric MPs/NPs [19]. These findings highlight the pervasiveness of MPs/NPs in the environment and imply that human exposure to these is inevitable. The presence of MPs/NPs has been increasingly confirmed in human tissues, including blood, breast milk, semen, feces, and placenta [20]. Toxicological studies indicate that MPs/NPs can trigger oxidative stress, inflammation, immunosuppression, neurological dysfunction, gut microbiota imbalance, and metabolic disorders [21]. A recent epidemiological investigation reveals a positive correlation between MPs and inflammatory bowel disease severity [22]. Therefore, the potential health risks posed by MPs/NPs to humans cannot be ignored, especially NPs, because of their larger surface area, smaller size, and higher biological permeability, potentially causing more severe toxic effects than those of MPs [23].
As MPs/NPs and AA share common sources (food, water, and air), the risk of humans simultaneously ingesting them is significantly increased. The individual toxic effects of AA and MPs/NPs are well studied; however, research on their combined exposure remains lacking. Only one study has reported the effects of combined AA and PS-NP exposure on zebrafish, demonstrating that co-exposure resulted in more pronounced embryonic developmental inhibition and more severe motor behavioral abnormalities compared to AA exposure alone [24]. The gut–liver axis plays a critical role in maintaining host health by protecting host against hazardous substances [25]. An imbalance in its homeostasis can facilitate the movement of metabolites and gut flora components to the liver, thus leading to liver inflammation and damage [26]. Many toxic contaminants, including AA and MPs/NPs, have been reported to adversely affect the gut–liver axis [12,27]. Therefore, this study aimed to investigate the combined toxicity and underlying mechanism of AA and polystyrene NP (PS-NP) exposure in mice from the perspective of the gut–liver axis through microbial diversity assessment, metabolomics analysis, histopathological observations, and biochemical analysis. Our findings could elucidate the combined toxic effects of AA and NPs on mammals, providing a novel theoretical basis for evaluating potential health risks associated with their combined toxicity.

2. Materials and Methods

2.1. Materials and Reagents

AA (purity ≥ 99.9%, Cas No. 79-06-1) was purchased from Macklin (Shanghai, China), and 50 nm polystyrene NPs suspension (PS-NPs, 50 mg/mL in ultrapure water) was acquired from Zhongkeleiming (Beijing, China). Scanning electron microscopy (SEM) and Zeta potential analysis revealed that the PS-NPs exhibited a spherical morphology with an average diameter of 78.9 ± 8.6 nm and a surface charge of −15.9 mV (Figure S1). SPF-grade female C57BL/6N mice (6 weeks old) were purchased from Vital River (Beijing, China). Commercial kits for alanine aminotransferase (ALT) and aspartate aminotransferase (AST) were obtained from Boxbio (Beijing, China). ELISA kits for diamine oxidase (DAO), tumor necrosis factor-α (TNF-α), interleukin-1β (IL-1β), IL-6, and IL-17A were purchased from Elabscience (Wuhan, China). Another ELISA kit for lipopolysaccharide (LPS) was obtained from CUSABIO (Wuhan, China).

2.2. Animal Experimental Design

Female mice were acclimated for 1 week in a standard animal facility (25 °C and 50% relative humidity). The reason for selecting females in this study is based on a previous report which indicates that females may be more prone to absorb AA than males [28]. The mice were randomly divided into four groups, control, AA exposure (AA), PS-NP exposure (PS-NP), and AA + PS-NP co-exposure (AA + PS-NP) groups, with six mice per group. Mice in the AA and PS-NP groups were administered drinking water containing 20 μg/mL AA and 10 μg/mL PS-NPs, respectively. The AA + PS-NP group drank water containing AA and PS-NPs, while the control group drank water without these additives. AA was dissolved in distilled water to achieve a final concentration of 20 μg/mL. The PS-NP suspension was added to distilled water or 20 μg/mL AA solution to achieve a final concentration of 10 μg/mL. These solutions were sterilized via 0.22 μm membrane filtration prior to animal administration and did not contain any endotoxin. Water consumption was recorded every 5–6 days. All animals were fed an SPF-grade standard diet from KeAo Xieli Feed Co., Ltd. (Beijing, China) with composition details in Supplementary Table S1. Based on water consumption (Table S2), the daily intake of AA per mouse was approximately equivalent to 4.0 mg/kg·bw/day for the AA group and the AA + PS-NP group. The daily intake of PS-NPs per mouse was approximately equivalent to 2.0 mg/kg·bw/day for the PS-NPs group and the AA + PS-NPs group. The selection of AA concentration was based on the high exposure population of AA and our previous study [13], while the selection of PS-NP concentration was based on a previous study, which reported that humans may consume 0.1–5 g of MPs/NPs weekly, equivalent to a daily intake of 0.24–11.9 mg/kg·bw [29]. Detailed reasons for dosage selection have been provided in the Supplementary Methods.
After 10 weeks, all mice were fasted for 8 h and euthanized via intraperitoneal injection of tribromoethanol (350 mg/kg) (Cas No. 75-80-9, Sigma-Aldrich, Saint Louis, MO, USA) following the AVMA Guidelines for the Euthanasia of Animals. Blood was collected via eyeball extirpation, a common method for collecting blood from rodents [30,31], and centrifuged at 800× g for 10 min at 4 °C to obtain serum. Serum, cecal contents, and a portion of liver and colon samples were frozen in liquid nitrogen and stored at −80 °C for subsequent analysis. The remaining liver and colon tissues were fixed in 4.0% paraformaldehyde for histopathological analysis.

2.3. Biochemical Analyses of Serum, Liver, and Colon

Serum levels of liver injury markers (ALT and AST activities) and intestinal damage markers (DAO activity and LPS content) were measured following the manufacturer′s procedures. The liver and colon tissues were homogenized with PBS (0.01 M, pH 7.4) containing proteinase inhibitor and centrifuged for 10 min at 4 °C, 8000× g. The levels of inflammatory markers TNF-α, IL-1β, IL-6, and IL-17A in these homogenates were determined using ELISA kits. The absorbance was measured using a SpectraMax i3x microplate reader (Molecular Devices, San Jose, CA, USA).

2.4. Histopathological Analyses of the Liver and Colon

After 24 h of fixation, the liver and colon tissues were embedded in paraffin and sectioned into 5 μm thick slices. Liver sections were stained with hematoxylin and eosin (H&E), while colon sections were stained with H&E or Alcian blue and periodic acid–Schiff (AB-PAS). Histopathological observations were performed using a microscope slide scanner (3DHISTECH, Budapest, Hungary).

2.5. Real-Time Quantitative PCR (RT-qPCR) Analysis

Total RNA from the liver and colon samples was extracted, assessed, and reverse-transcribed into cDNA, as previously described [12]. RT-qPCR was performed using the ChamQ SYBR qPCR Master Mix kit (Vazyme, Nanjing, China) in a CFX96 RT-PCR System (BioRad, Hercules, CA, USA). Glyceraldehyde-3-phosphate dehydrogenase (GAPDH) served as the housekeeping gene, and the relative target gene mRNA levels were calculated using the 2−ΔΔCt method. Supplementary Table S3 lists the primer sequences.

2.6. Untargeted Metabolomics of Liver and Bioinformatics Analysis

Liver samples were extracted as previously described [12]. The resulting supernatants were analyzed using ultrahigh-performance liquid chromatography tandem mass spectrometry (UPLC-MS/MS). Details on the UPLC-MS/MS analysis are provided in the Supplementary Methods. Raw data from UPLC-MS/MS were processed into a final data matrix for subsequent analyses, with detailed procedures provided in the Supplementary Methods. Principal component analysis (PCA) and orthogonal projections to latent structure discriminant analysis (OPLS-DA) were performed using the R package ropls. Differential metabolites (DMs) between the control and different exposure groups were identified based on the criteria of variable importance in the projection (VIP) > 1.0 and p < 0.05. Pathway topology analysis of DMs was conducted using the Kyoto Encyclopedia of Genes and Genomes (KEGG) database, with key metabolic pathways identified at a critical value threshold of ≥0.10.

2.7. 16S rRNA Amplicon Sequencing of Cecal Contents and Bioinformatics Analysis

Total DNA was extracted using the HiPure Stool DNA Mini Kit B (Magen Biotech, Guangzhou, China). The V3-V4 region of the 16S rRNA gene was amplified using universal primers 338F (5′-ACTCCTACGGGAGGCAGCAG-3′) and 806R (5′-GGACTACHVGGGTWTCTAAT-3′). PCR products were quantified using QuantiFluor™-ST (Promega, Madison, WI, USA). The sequencing library was constructed and sequenced on the NovaSeq 6000 System (Illumina, San Diego, CA, USA) by Origingene (Shanghai, China). The raw sequencing reads were quality filtered using fastp, merged with FLASH, and denoised using the DADA2 plugin in Qiime2 (v2022.2) to generate a bacterial amplicon sequence variants (ASVs) table. ASV taxonomic assignment was conducted using the Qiime2 and SILVA 16S rRNA database. Based on the ASV data, alpha diversity was analyzed using Mothur (v2022), and beta diversity was analyzed using the R package vegan (v 3.3.1). Additionally, linear discriminant analysis effect size (LEfSe) was used to identify significantly different taxa (phylum to genera) between groups (LDA score > 2.5, p < 0.05). All bioinformatic analyses were performed using the Majorbio cloud platform (https://cloud.majorbio.com, accessed on 15 July 2024).

2.8. Statistical Analysis

Data are presented as means ± standard deviation (SD) and were analyzed using SPSS Statistics 19.0 (IBM, Armonk, NY, USA). Normality tests (Kolmogorov–Smirnov) and equal variance tests (Levene median) were conducted prior to testing for differences between groups. All data followed a normal distribution. One-way ANOVA, followed by Tukey’s test (for equal variances) or Tamhane’s T2 test (for unequal variances), was used to assess significant differences between the control and different exposure groups. Correlations between the microbiota and intestinal–liver damage indicators were analyzed using Spearman′s correlation analysis. p < 0.05 was considered statistically significant.

3. Results

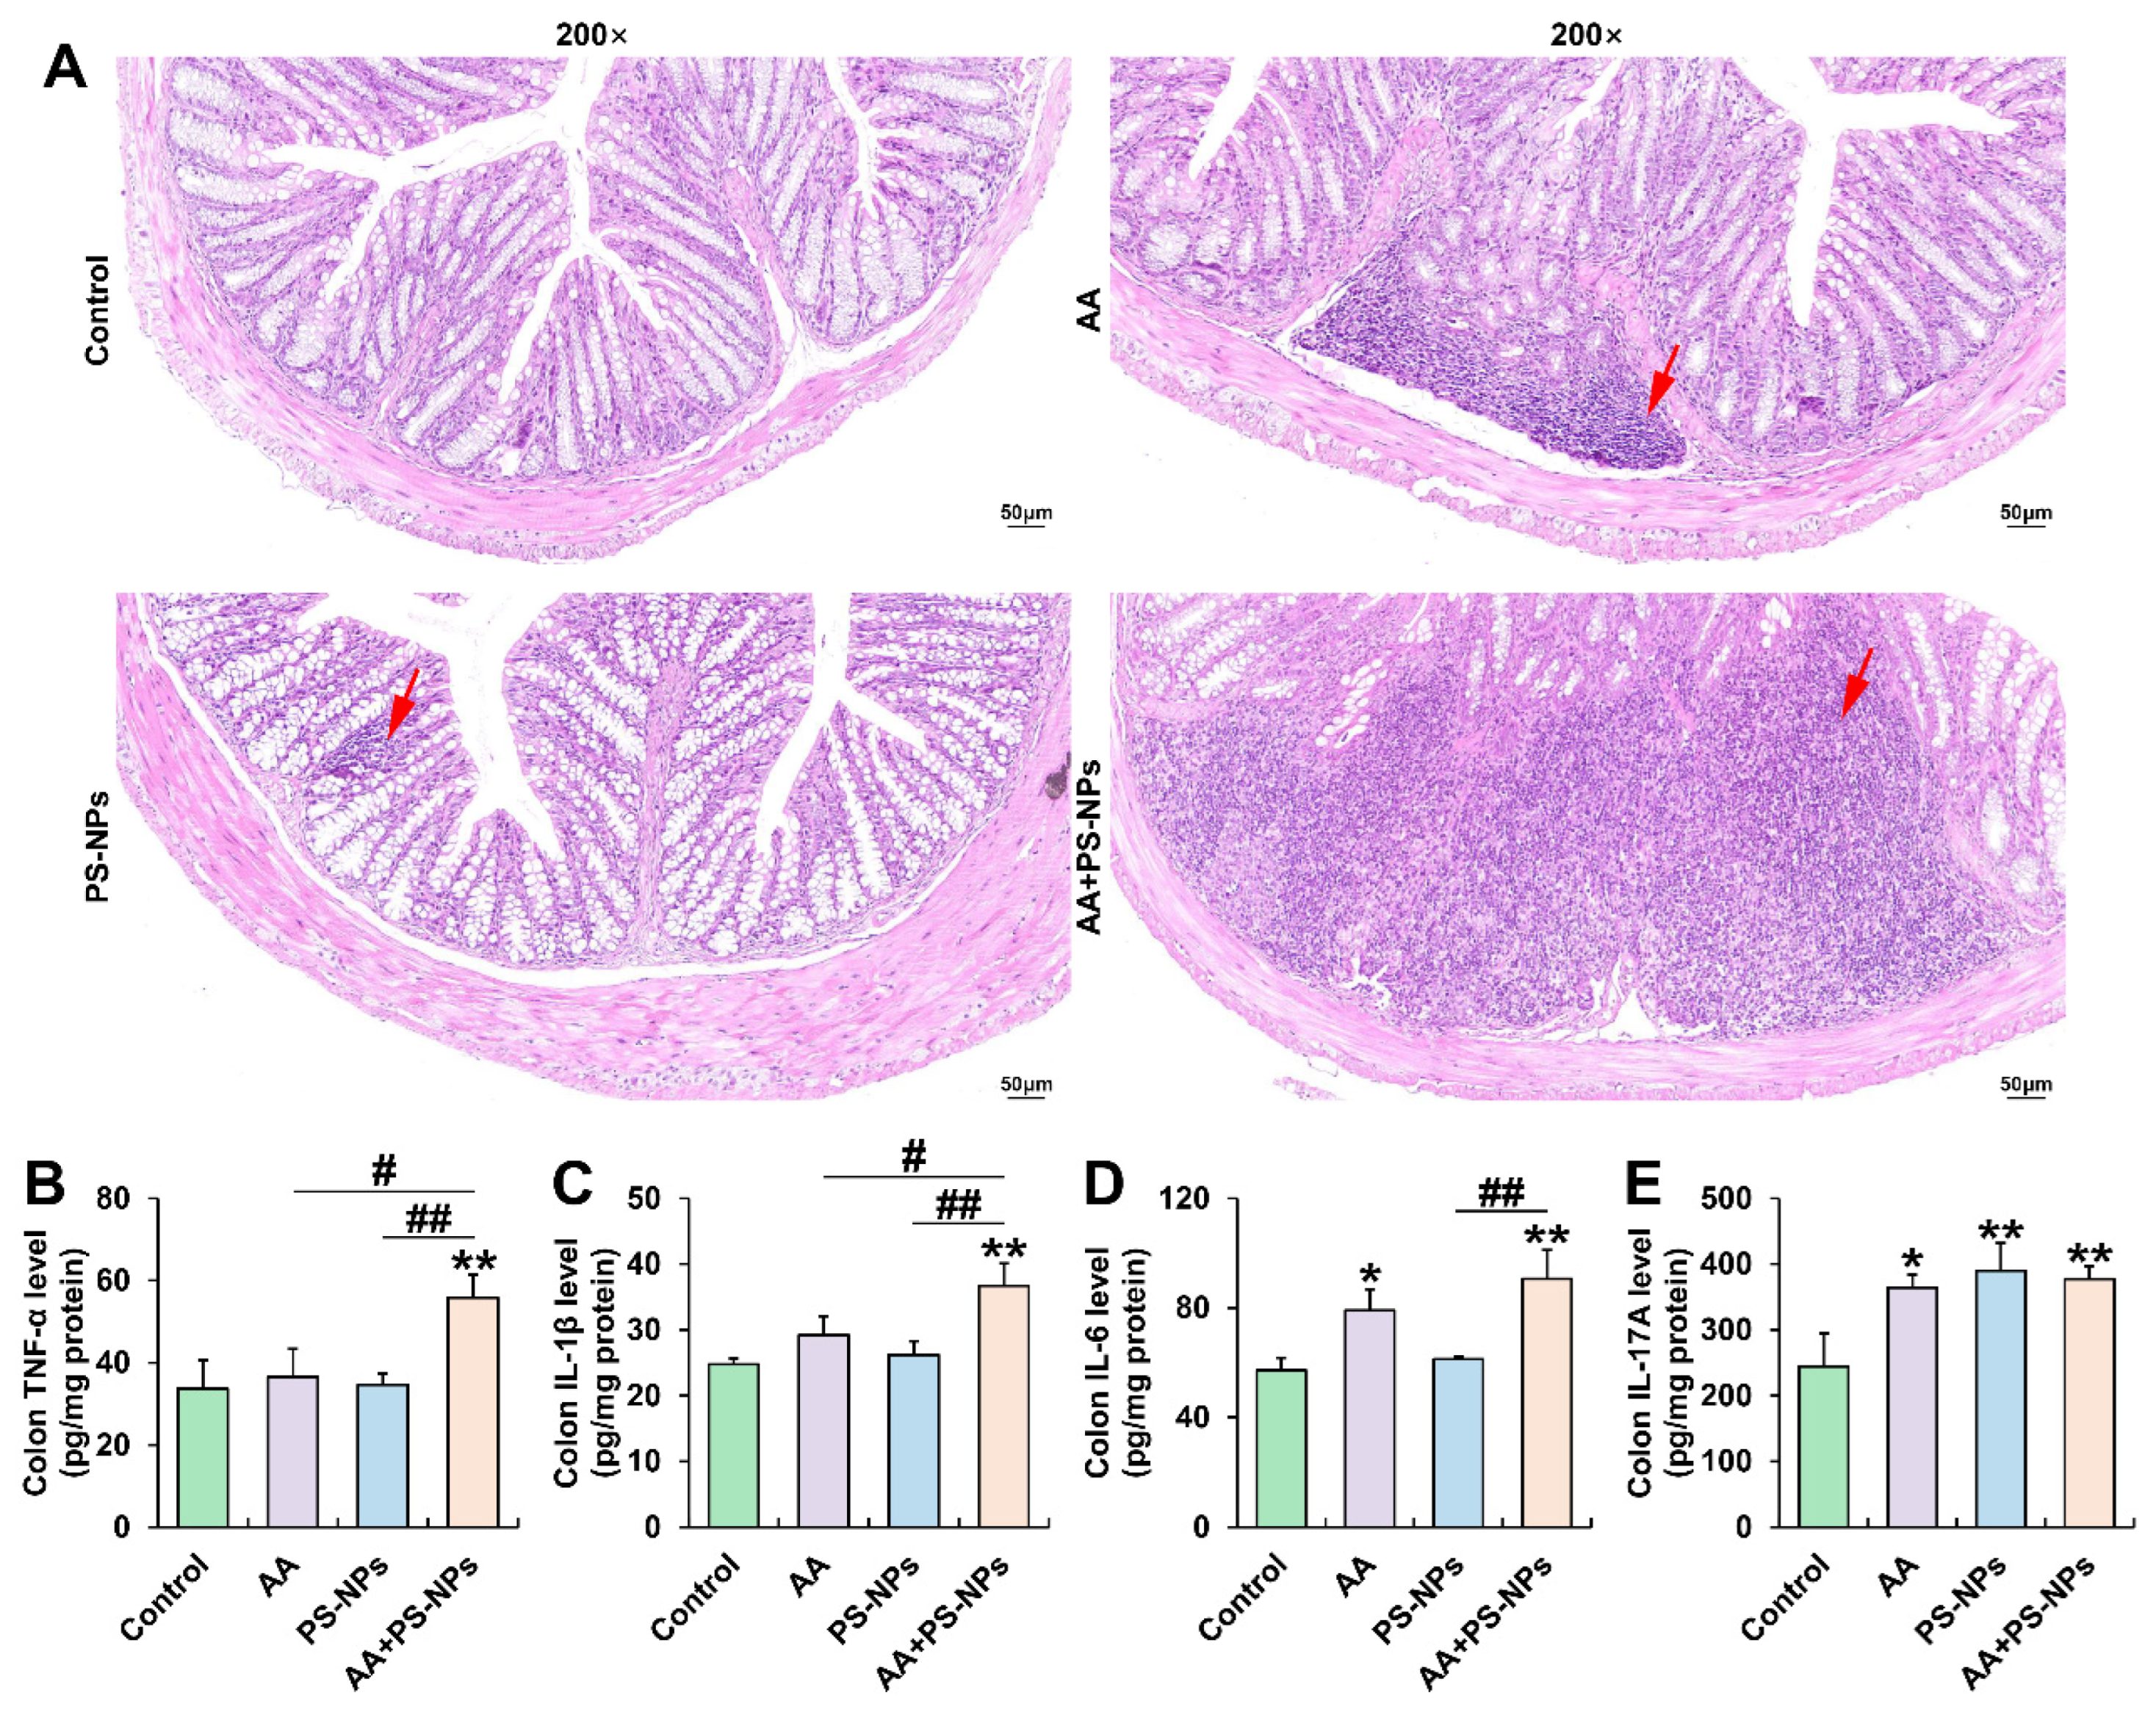
3.1. Co-Exposure to AA and PS-NPs Aggravates Colonic Inflammation in Mice

Exposure to AA and PS-NPs individually resulted in moderate inflammatory infiltration in the colon compared with that in the control group. However, combined exposure to AA and PS-NPs caused severe colonic inflammatory infiltration (Figure 1A). Furthermore, AA exposure significantly increased colonic IL-6 and IL-17A levels, whereas PS-NP exposure significantly increased only IL-17A levels compared with that of the control group (Figure 1D,E). Co-exposure to AA and PS-NPs increased TNF-α, IL-1β, IL-6, and IL-17A levels, with TNF-α and IL-1β levels being higher than those observed under the two single exposure conditions and IL-6 levels being higher than those after PS-NP exposure alone (Figure 1B–D).

3.2. Co-Exposure to AA and PS-NPs Damages Colonic Barrier Function in Mice

Serum LPS content showed an increasing trend with AA or PS-NP exposure alone and significantly increased under AA + PS-NP co-exposure compared to those in the control group (Figure 2A). Similarly, serum DAO activity exhibited a rising trend under AA exposure alone and significantly increased after PS-NP exposure and AA + PS-NP co-exposure compared to that in the control group (Figure 2B). Combined exposure resulted in a higher serum LPS content than that after the two single exposure conditions and a higher serum DAO activity than that after AA exposure alone (Figure 2A,B).
Colonic AB-PAS staining showed no significant differences in the coverage ratio of mucus secretion between the control, AA, and PS-NPs groups. However, co-exposure to AA and PS-NPs significantly increased mucus coverage compared with that in the control, AA and PS-NPs groups (Figure 2C,D). Furthermore, AA, PS-NP, and AA + PS-NP exposures significantly downregulated colonic tight-junction (TJ) protein ZO-1 and Claudin-5 mRNA levels compared with those in the control group (Figure 2E).

3.3. Co-Exposure to AA and PS-NPs Exacerbates Liver Injury and Inflammation in Mice

PS-NP and AA + PS-NP exposures significantly elevated serum ALT and AST activities compared with those in the control group, while AA exposure significantly elevated only ALT activity (Figure 3A,B). Notably, co-exposure to AA + PS-NPs led to higher ALT activity than that due to AA or PS-NP exposure alone (Figure 3A). Histopathological analysis of the liver revealed mild inflammatory infiltration under AA or PS-NP exposure and more obvious cell inflammation under AA + PS-NP co-exposure (Figure 3C). Furthermore, AA exposure significantly elevated TNF-α levels, while PS-NP exposure significantly elevated IL-6 levels compared with those in the control group (Figure 3D,F). Co-exposure to AA and PS-NPs specifically resulted in higher levels of multiple inflammatory cytokines, including TNF-α, IL-6, and IL-17A, than those observed under single exposure conditions (Figure 3D,F,G).

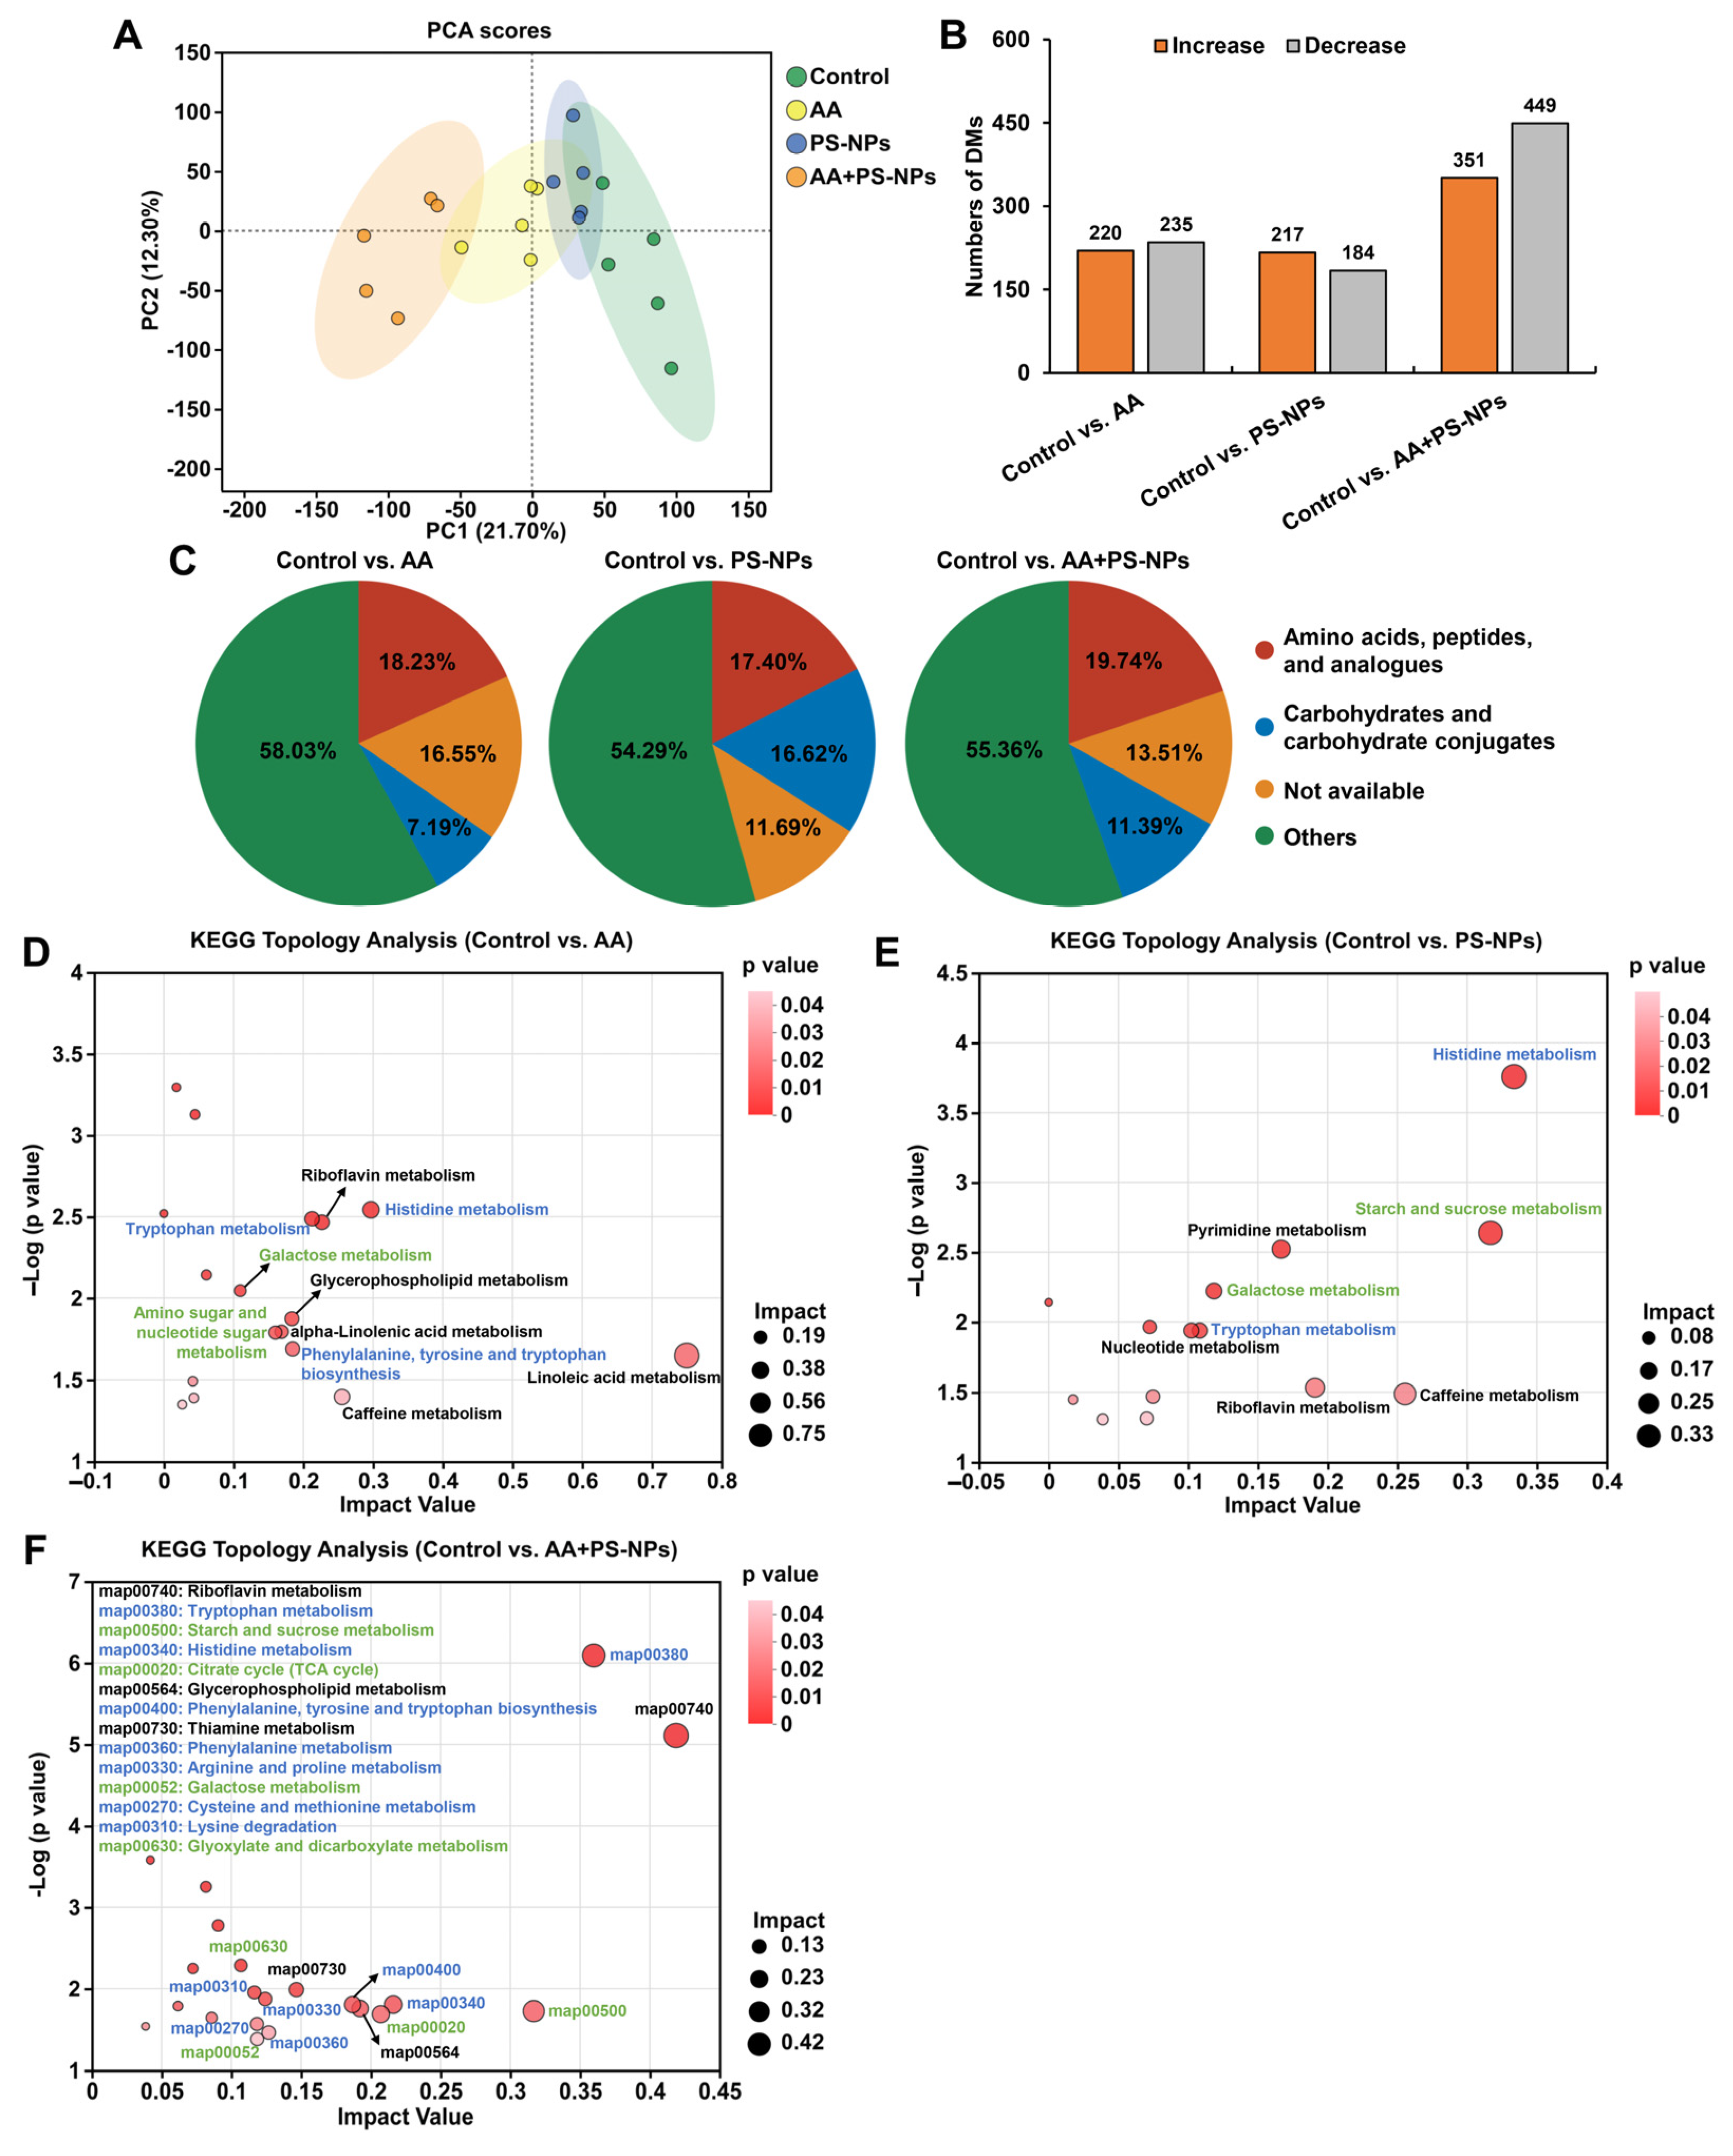
3.4. Co-Exposure to AA and PS-NPs Alters Liver Metabolism in Mice

PCA results showed a distinct metabolic shift in the AA, PS-NP, and AA + PS-NP groups compared with the control group, with the AA + PS-NP group exhibiting the largest separation, indicating a strong alteration in the liver metabolism of mice (Figure 4A). Using VIP > 1.0 and p < 0.05 as the criteria, 455, 401, and 800 DMs were identified in the comparisons of control vs. AA, control vs. PS-NPs, and control vs. AA + PS-NPs, respectively (Figure 4B). According to the Human Metabolome Database (HMDB) compound classification, “amino acids, peptides, and analogues” and “carbohydrates and carbohydrate conjugates” were the most prevalent DMs across all exposure groups (Figure 4C).
KEGG topology analysis revealed that DMs in the AA, PS-NP, and AA + PS-NP groups were significantly enriched in 10, 8, and 14 pathways, respectively (impact value ≥ 0.10, p < 0.05; Figure 4D–F). Many of these pathways are involved in amino acid and carbohydrate metabolism. In amino acid metabolism, tryptophan (Trp) metabolism and histidine (His) metabolism were common pathways observed in all exposure groups. Moreover, AA exposure significantly affected phenylalanine, tyrosine, and tryptophan biosynthesis, whereas AA + PS-NP co-exposure had a marked effect on this pathway and significantly disrupted phenylalanine metabolism, arginine and proline metabolism, cysteine and methionine metabolism, and lysine degradation (Figure 4D,F). Among these pathways, kynurenine (KYN), anthranilic acid (ATA), and kynurenic acid (KYNA) contents significantly decreased, while L-histidine content increased across all exposure groups (Table 1). Histamine and urocanic acid contents significantly increased with AA and PS-NP exposures, whereas serotonin (5-HT) increased with AA and AA + PS-NP exposures (Table 1). Furthermore, co-exposure to AA and PS-NPs significantly increased 5-hydroxytryptophan (5-HTP), indole derivatives (indole-3-acetaldoxime, indole-3-acetamide, and indole-3-acetic acid), ergothioneine, methionine sulfoxide (MetO), and saccharopine contents, and it significantly decreased phenylalanine and proline contents (Table 1).
In carbohydrate metabolism, galactose metabolism was consistently affected across all the exposure groups (Figure 4D–F). AA exposure significantly affected amino sugar and nucleotide sugar metabolism. PS-NP and AA + PS-NP exposures significantly perturbed starch and sucrose metabolism. Furthermore, co-exposure to AA and PS-NPs also significantly disrupted the citrate cycle (TCA cycle), as well as glyoxylate and dicarboxylate metabolism (Figure 4D–F). Among these pathways, significant increases in D-glucose and lactose contents were observed under all exposure conditions (Table 1). AA exposure significantly increased glucosamine, UDP-D-galactose, UDP-glucose, and UDP-N-acetylglucosamine contents. PS-NP exposure and AA + PS-NP co-exposure significantly increased trehalose, stachyose, dextran, levan, and galactinol contents (Table 1). Co-exposure to AA and PS-NPs also significantly decreased citric, isocitric, 2-ketoglutaric, glyceric, and glycolic acid contents (Table 1).

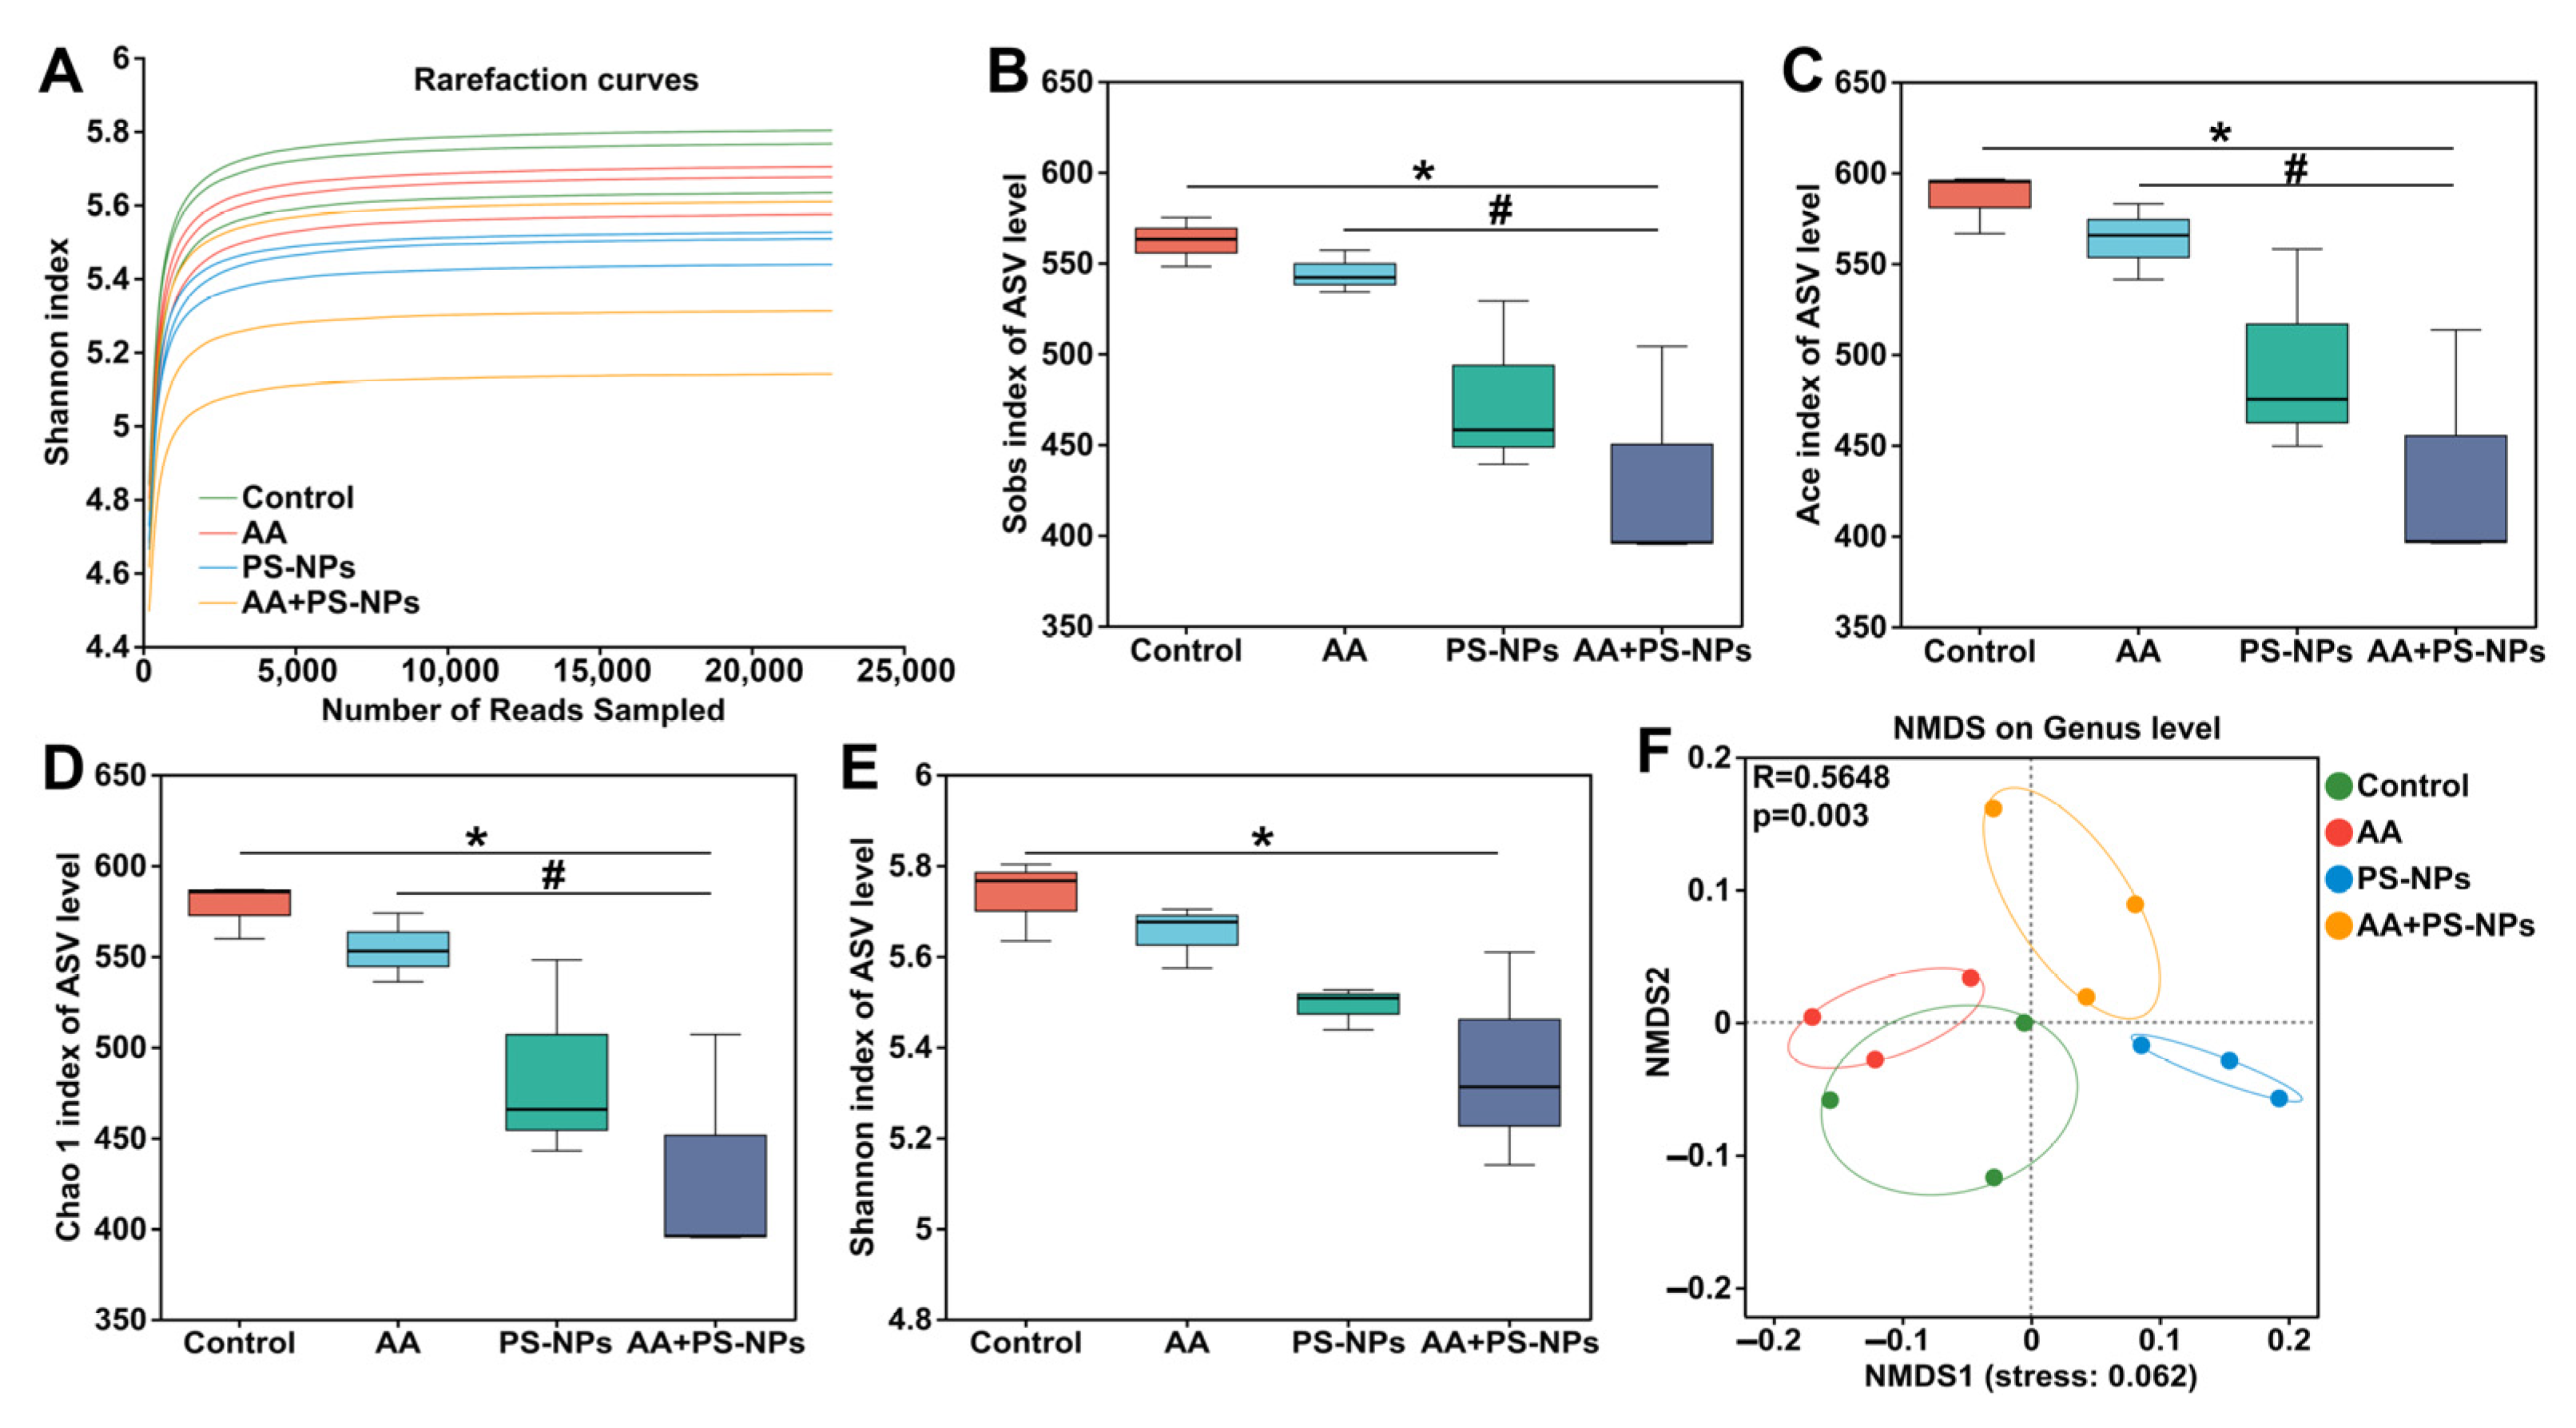
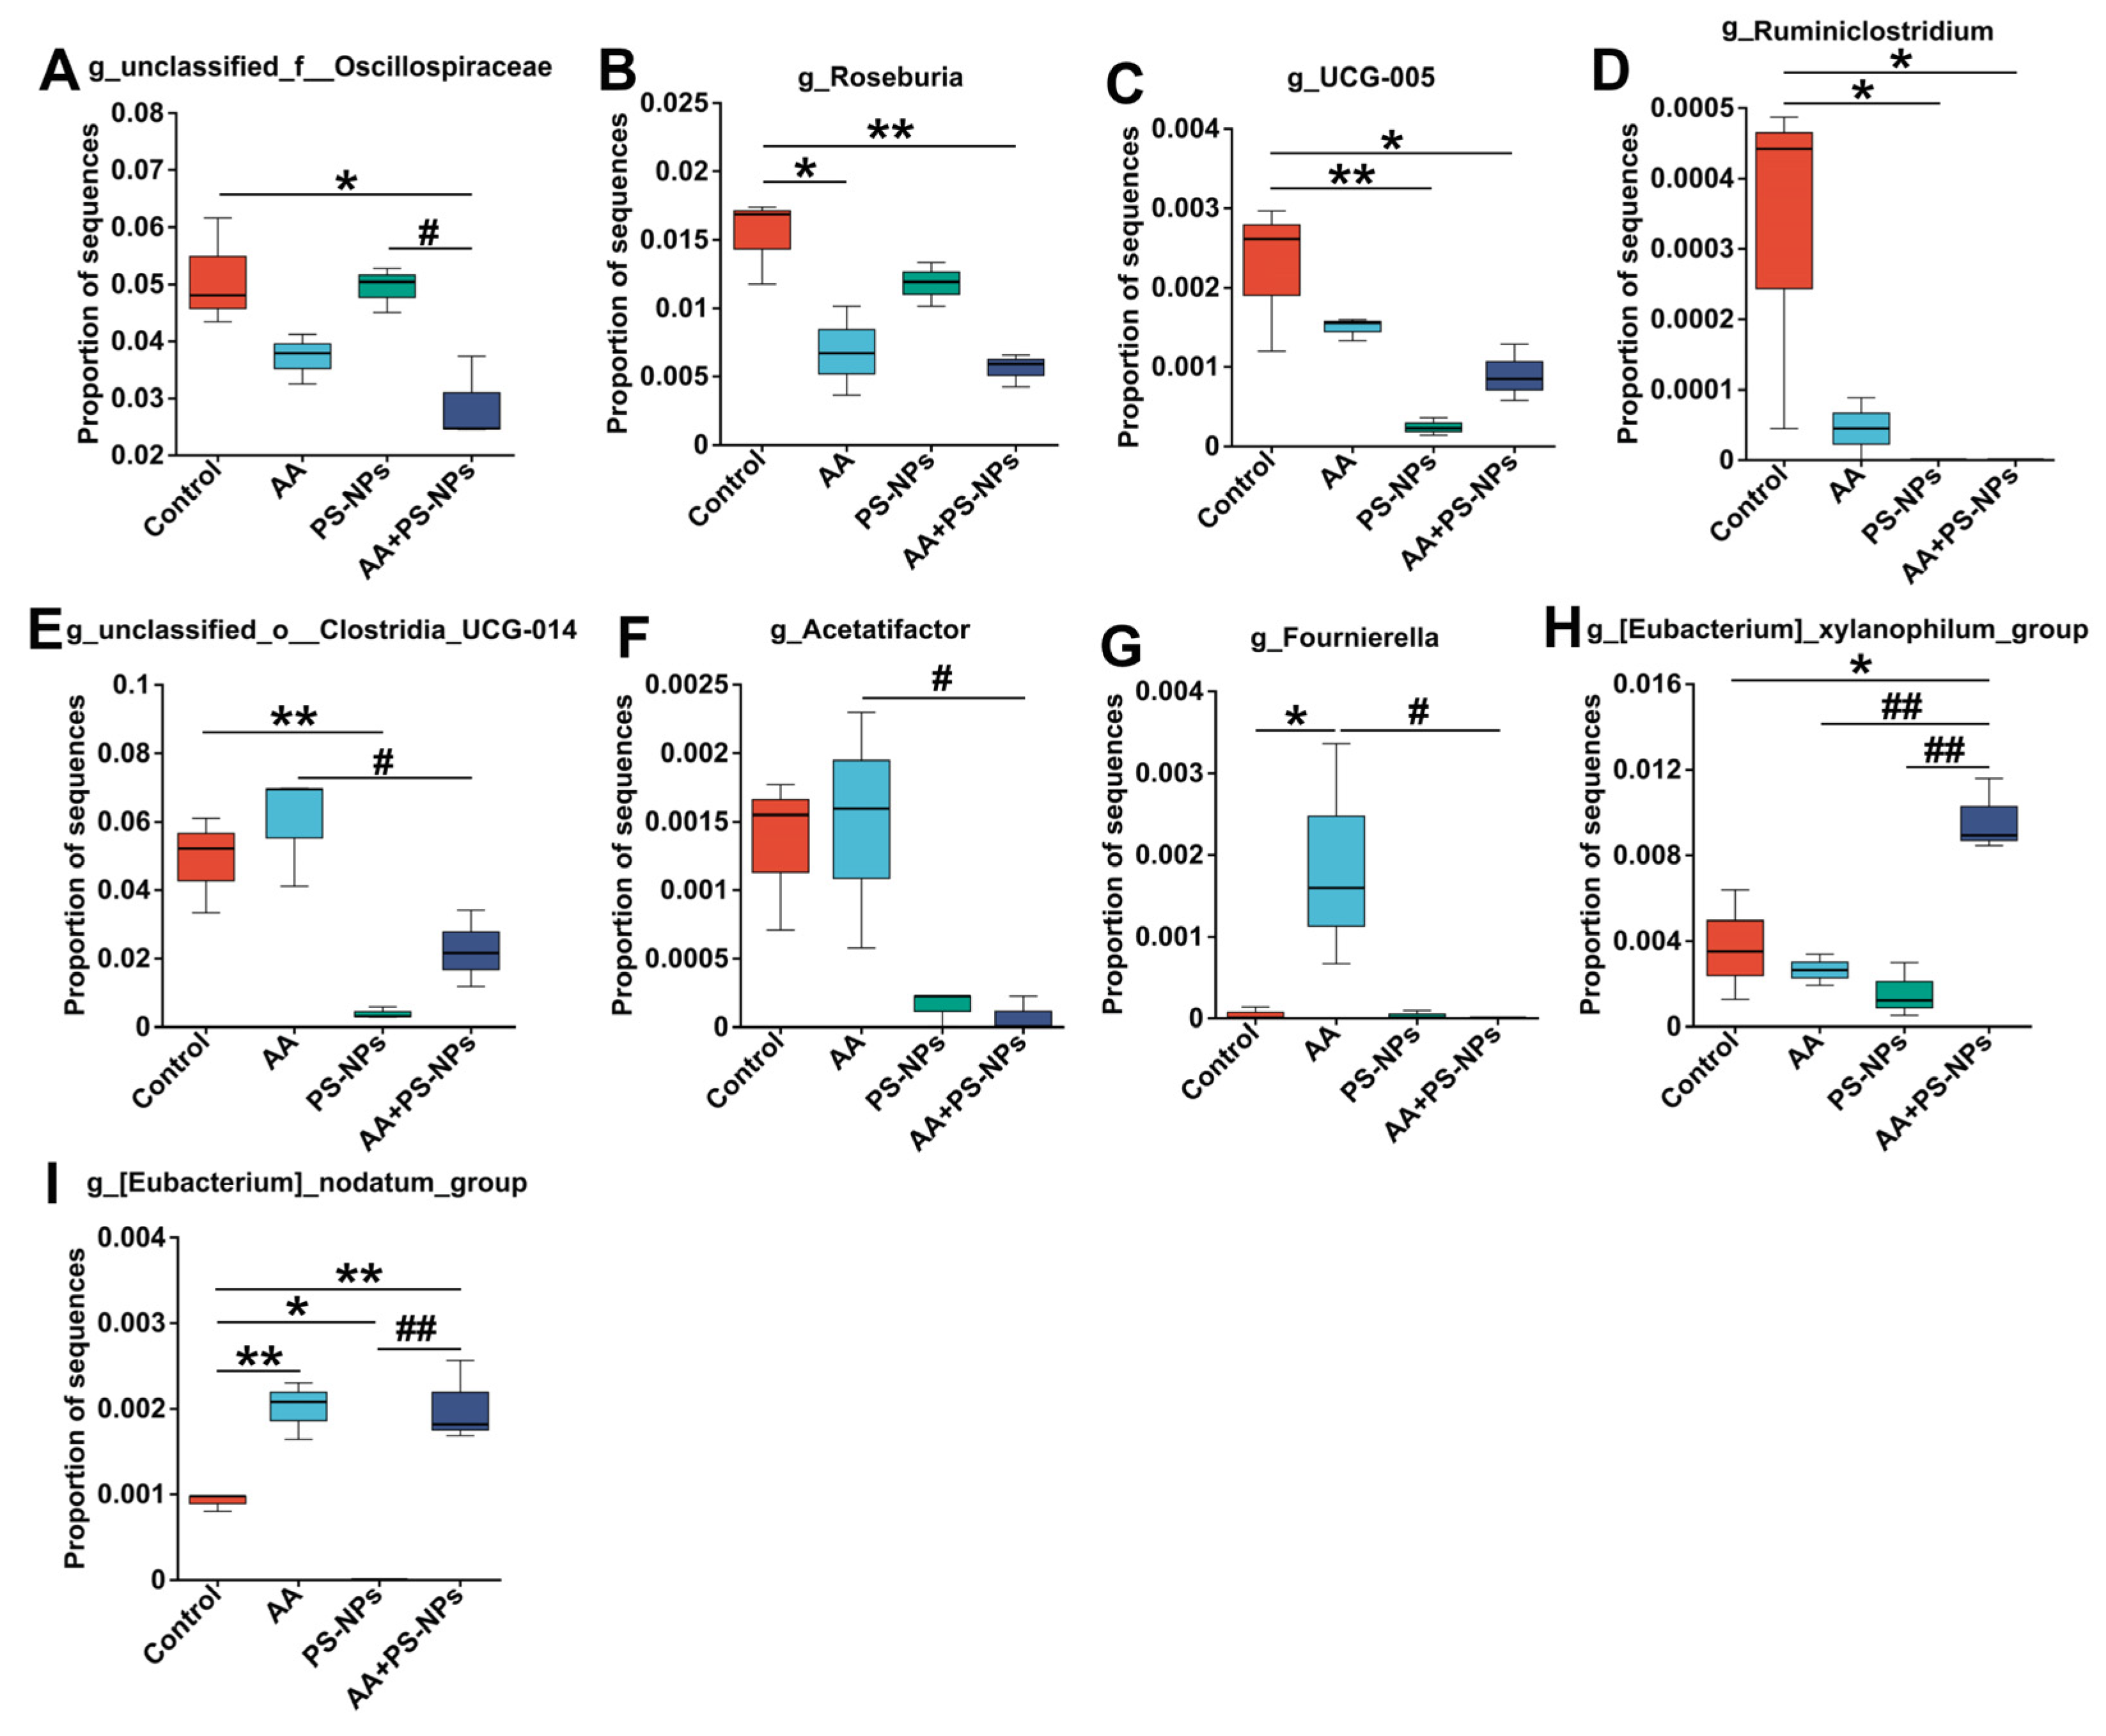
3.5. Co-Exposure to AA and PS-NPs Changes Cecal Microbiota in Mice

As shown in Figure 5A, the rarefaction curves for the Shannon index of ASVs in each sample gradually plateaued with increasing sequencing depth, indicating sufficient data to accurately capture microbial diversity present in the samples. Alpha diversity analysis revealed no significant differences in richness indices (Sobs, Ace, and Chao 1) or diversity indices (Shannon) between the control group and either the AA or PS-NPs group (Figure 5B–E). However, the AA + PS-NP group showed a significant reduction in these indices compared to the control group (Figure 5B–E). Notably, the Sobs, Ace, and Chao 1 indices observed in AA + PS-NP group were lower than those in AA group. NMDS analysis of beta diversity revealed a distinct separation of all exposure groups from the control group at the genus level (ANOSIM R = 0.5648, p = 0.003) (Figure 5F).
To further identify differentially abundant microbes among the different exposure groups, LEfSe was used, revealing 35 bacterial taxa with differential abundance (LDA > 2.5, p < 0.05) (Figures S2 and S3). Compared with those in the control group, Roseburia abundance significantly decreased, whereas Fournierella and Eubacterium_nodatum_group abundances significantly increased in the AA group (Figure 6B,G,I). PS-NP exposure resulted in a significant decrease in the abundances of UCG-005, Ruminiclostridium, unclassified_o__Clostridia_UCG-014, and Eubacterium_nodatum_group (Figure 6C–E,I). In contrast, AA + PS-NP co-exposure significantly decreased the abundances of unclassified_f__Oscillospiraceae, Roseburia, UCG-005, and Ruminiclostridium, accompanied by a significant increase in Eubacterium_xylanophilum_group and Eubacterium_nodatum_group (Figure 6A–D,H,I). Compared to the AA group, AA + PS-NP co-exposure significantly reduced the abundances of unclassified_o__Clostridia_UCG-014, Acetatifactor, and Fournierella, whereas increasing that of Eubacterium_xylanophilum_group (Figure 6E–H).

3.6. Correlation Analysis Between Gut Microbiota and Related Intestinal–Liver Indicators

Spearman′s correlation analysis revealed that Eubacterium_nodatum_group was positively correlated with colonic IL-1β and IL-6 and liver TNF-α, whereas Eubacterium_xylanophilum_group was positively correlated with liver TNF-α (Figure 7A). In contrast, unclassified_f__Oscillospiraceae and Roseburia were negatively correlated with serum AST, liver TNF-α, and colonic TNF-α, IL-1β, and IL-6. Ruminiclostridium and Acetatifactor were negatively correlated with serum ALT, LPS, DAO, liver IL-6, IL-17A, and colonic IL-17A. Furthermore, UCG-005 was negatively correlated with serum ALT and liver IL-6, whereas unclassified_o__Clostridia_UCG-014 was negatively correlated with serum DAO, and liver IL-6, IL-17A. Colonic ZO-1 was positively correlated with Roseburia. Additionally, serum ALT and AST were positively correlated with serum LPS, DAO, and colonic IL-6, IL-17A, and IL-1β (Figure 7B). Conversely, ALT and AST were negatively correlated with colonic ZO-1 and Claudin-5, respectively. Serum LPS were positively correlated with colonic IL-6, IL-17A, and IL-1β, while serum DAO is only positively correlated with colonic IL-1β (Figure 7B). Liver IL-6 and IL-17A were positively correlated with serum LPS, DAO, and colonic TNF-α, IL-1β. Liver TNF-α was positively correlated with colonic IL-1β and IL-6 and negatively correlated with colonic ZO-1 (Figure 7B).

4. Discussion

Evidence indicates that AA and NPs can have various toxic effects, including intestinal and liver damage [10,32]. Several studies have shown the combined effects of AA or NPs with other pollutants [33,34,35,36]. However, the toxicological data on combined exposure to AA and NPs remains limited. The findings of this study revealed that co-exposure to AA and PS-NPs produced synergistic toxicity and aggravated gut–liver axis impairment in mice, including colonic inflammation, intestinal barrier damage, hepatic inflammation, liver metabolism remodeling, and gut microbiota dysbiosis.
Previous studies show that exposure to AA or NPs alone can cause colonic inflammation and increase pro-inflammatory cytokine levels [37,38]. Similar results were also observed in this study. Co-exposure to AA and PS-NPs resulted in more severe inflammatory infiltration and higher pro-inflammatory cytokine levels (TNF-α, IL-1β, and IL-6) than those due to AA or PS-NP exposure alone. Consistent with our findings, combined exposure to PS-NPs with aflatoxin B1 or cadmium exhibited synergistic effects on colonic inflammation in mice [35,36].
Intestinal inflammation is closely associated with intestinal barrier dysfunction. An intact intestinal barrier is essential for maintaining intestinal homeostasis and preventing the entry of harmful substances and pathogens [39]. The mucus layer serves as the first line of defense, crucial for preventing bacterial invasion and inflammation in the intestinal epithelium [40]. Here, AB-PAS staining showed that co-exposure to AA and PS-NPs resulted in a higher coverage ratio of mucus secretion than that in the control, AA, and PS-NP groups. When severe intestinal inflammation occurs, intestinal nociceptor neurons prompt goblet cells to produce mucus, thereby protecting the gut barrier [41]. This increased colonic mucus secretion may serve as a self-protective reaction to cope with the severe colonic inflammation induced by combined exposure. Furthermore, we observed higher serum LPS content and DAO activity after co-exposure to AA and PS-NPs. Serum LPS content and DAO activity are established biomarkers for assessing intestinal mucosal damage and barrier permeability [42]. Therefore, these results indicated that co-exposure caused more severe intestinal damage. Spearman′s correlation analysis showed that the increase of these two markers is positively correlated with the elevated levels of intestinal inflammatory factors. Additionally, all exposure groups significantly downregulated colonic TJ protein ZO-1 and Claudin-5 mRNA levels, compared with the control group. These TJ proteins are crucial for maintaining the integrity and permeability of the intestinal barrier [43]. Therefore, their downregulation may further exacerbate intestinal barrier damage.
Serum LPS enters the liver via the portal vein, triggering inflammatory reactions that subsequently lead to liver injury [44,45]. In mammals, serum ALT and AST are sensitive biomarkers of liver injury [46]. Here, co-exposure to AA and PS-NPs resulted in higher serum AST and ALT activities, more severe liver inflammatory infiltration, and higher levels of hepatic inflammatory cytokines (TNF-α, IL-6, and IL-17A) compared to exposure to AA or PS-NPs alone, indicating that combined exposure induces more severe liver injury and inflammation. The correlation analysis further revealed that the increase in these liver injury markers was strongly positively correlation with serum LPS content.
Tissue injury is often accompanied by changes in endogenous metabolites [47,48]. Hence, we investigated the effects of AA and/or PS-NP exposure on liver metabolism. The results showed that the AA + PS-NP co-exposure group produced more DMs compared with those in the AA and PS-NP exposure groups, indicating that combined exposure exacerbates metabolic disorders in the liver. Pathway enrichment analysis revealed that amino acid and carbohydrate metabolism were key pathways affected by AA, PS-NP, and AA + PS-NP exposures. In amino acid metabolism, all three exposure conditions perturbed Trp and His metabolism. As an essential amino acid, 90–95% of Trp is catabolized into bioactive substances via the KYN pathway in the liver, while 1–2% of Trp is converted into 5-HTP and 5-HT via the 5-HT pathway in enterochromaffin cells, and an additional 5% is transformed into indoles and its derivatives via the indole pathway mediated by gut microbiota [49]. Our findings showed that exposure to AA, PS-NPs, and AA + PS-NPs significantly reduced KYN, ATA, and KYNA contents, suggesting the inhibition of the KYN pathway. Moreover, AA exposure significantly increased 5-HT, and AA + PS-NP co-exposure significantly increased 5-HTP, 5-HT, and indole derivatives. 5-HTP, 5-HT, and indole derivatives are intestinal metabolites of Trp. The increased translocation of these intestinal metabolites to the liver reflected an increase in intestinal permeability. His is another essential amino acid for organisms that can be converted into histamine by histidine decarboxylase or ergothioneine by cyanobacteria, mycobacteria, and fungi [50]. Here, AA and PS-NP exposure significantly increased histamine contents, whereas AA + PS-NP co-exposure significantly increased ergothioneine content. Histamine is a crucial inflammatory mediator and can stimulate and intensify the inflammatory response [51]. Therefore, the increase in histamine induced by AA and PS-NPs may partly explain its role in liver inflammation. The increased ergothioneine in the liver further supported the potential role of AA + PS-NP co-exposure in causing intestinal barrier damage. In addition to the amino acid pathways described above, co-exposure to AA + PS-NPs also disrupted other amino acid pathways. In particular, combined exposure significantly decreased phenylalanine and proline contents, while significantly increasing MetO and saccharopine contents. Phenylalanine is an indispensable precursor for other amino acids and catecholamine neurotransmitter biosynthesis [52]. Therefore, a reduction in phenylalanine content may affect the production of these neurotransmitters, resulting in neurological disorders. Proline is a nonessential amino acid, and its oral administration effectively suppresses hepatic inflammatory infiltration and reduces serum TNF-α, AST, and ALT levels in rats [53]. Therefore, decreased proline content may be associated with AA + PS-NP-induced liver injury. MetO, a major methionine oxidation product, is a biomarker for oxidative stress [54]. This increase indicated that co-exposure to AA and PS-NPs may cause ROS overactivation. Saccharopine, a lysine degradation intermediate, is a mitochondrial toxin. Its abnormal accumulation can cause mitochondrial damage in mouse liver [55]. Therefore, its increase upon AA + PS-NP co-exposure may disrupt mitochondrial homeostasis.
In carbohydrate metabolism, AA disrupted amino sugar, nucleotide sugar, and galactose metabolism, whereas PS-NPs and AA + PS-NPs affected starch, sucrose, and galactose metabolism. D-glucose and lactose contents significantly increased in all exposure groups compared with the control group, with the highest level observed under AA + PS-NP co-exposure. Consistent with our findings, some studies have shown that AA or PS-NPs can affect glucose metabolism and increase the glucose content in mice [11,13,56]. Moreover, trehalose and galactinol contents significantly increased under PS-NP exposure and AA + PS-NP co-exposure. Trehalose is a protective agent against environmental stresses and exerts hepatoprotective effects by diminishing inflammatory signaling and bolstering antioxidant defense [57]. This increase may reflect a self-protective mechanism to cope with liver damage. Galactitol, a reducing product of galactose, is a hepatotoxin. Its increase typically causes cell hyperosmotic stress, induces oxidative stress, and triggers ROS accumulation, ultimately resulting in liver injury [58,59]. Additionally, co-exposure of AA + PS-NPs disturbed energy metabolism, as evidenced by a decrease in intermediates of the TCA cycle and glyoxylate and dicarboxylate metabolism, including citric, isocitric, 2-ketoglutaric, glyceric, and glycolic acid. The TCA cycle is a central metabolic pathway involving sugars, lipids, and amino acid metabolism, and it is pivotal in cellular energy production/supply [60]. Glyoxylate and dicarboxylate metabolism is closely related to the TCA cycle and contributes to energy metabolism [61]. Therefore, the reduction in these vital metabolites owing to AA + PS-NP co-exposure indicated that the combined exposure inhibited energy metabolism, which may lead to insufficient energy supply.
Accumulating evidence highlights the crucial role of gut microbiota dysbiosis in host intestinal barrier damage, liver injury, and metabolic disorders [25,62,63]. Here, co-exposure to AA and PS-NPs caused a significant reduction in richness and diversity of cecal contents, indicating that combined exposure exacerbated microbial dysbiosis. Specifically, AA + PS-NP co-exposure significantly decreased the abundances of unclassified_f__Oscillospiraceae, Roseburia, UCG-005, and Ruminiclostridium and significantly increased the abundances of Eubacterium_xylanophilum_group and Eubacterium_nodatum_group compared to the control group. Moreover, co-exposure led to lower abundances of unclassified_o__Clostridia_UCG-014, Fournierella, and Acetatifactor than AA exposure. Among these genera, unclassified_f__Oscillospiraceae, Roseburia, UCG-005, Ruminiclostridium, and Acetatifactor were the main producers of short-chain fatty acids (SCFAs) [64,65,66,67,68]. SCFAs are essential for maintaining intestinal barrier integrity and suppressing inflammation [69]. The bacteria unclassified_o__Clostridia_UCG-014 and Fournierella are generally considered beneficial. Unclassified_o__Clostridia_UCG-014 has been linked to improvements in conditions including ulcerative colitis, hyperlipidemia, and fatty liver disease, whereas Fournierella is closely associated with immune cell development and pathogen elimination in broiler chickens [70,71,72]. Additionally, some studies showed that Eubacterium_xylanophilum and Eubacterium_nodatum_group may be pathogenic bacteria positively associated with intestinal damage and metabolic disorders [73,74,75]. Correlation analysis revealed a negative correlation between these beneficial bacteria and intestinal–liver toxicity markers, whereas the two pathogenic bacteria exhibited a positive correlation with these markers. Consequently, AA + PS-NP co-exposure may exacerbate intestine and liver injury by significantly decreasing the levels of these beneficial bacteria while increasing the presence of pathogenic bacteria.

5. Conclusions

Overall, this study uncovered that co-exposure to AA and PS-NPs caused more severe gut microbiota dysbiosis, consequently aggravating colonic barrier damage, liver injury, and hepatic metabolic perturbation. Our findings emphasize the synergistic toxicity and health risks associated with simultaneous ingestion of AA and PS-NPs, providing a theoretical basis for formulating effective food safety policies. However, we must concede that this study has certain limitations, as it employed standard spherical NPs, whereas non-spherical morphologies may predominate in actual environments. Furthermore, a study has reported that non-spherical NPs cause stronger toxicity in earthworms than their spherical counterparts [76]. In future work, we will further investigate the co-exposure effects of non-spherical and multi-scale NPs with AA to elucidate the morphology- and size-dependent interactions of PS-NPs under combined exposure.

Supplementary Materials

The following supporting information can be downloaded at: https://www.mdpi.com/article/10.3390/biology14050523/s1, Figure S1: Morphological characterization of PS-MPs using scanning electron microscopy (SEM) (30×); Figure S2: The Cladogram bacterial taxa analyzed by LEfSe (LDA score > 2.5, p < 0.05); Figure S3: LDA score histogram from the phylum to genus level by LEfSe (LDA score > 2.5, p < 0.05); Table S1: The compositions of SPF-grade standard diet; Table S2: Drinking water records (mL/mouse/day); Table S3: The primer sequences for qPCR assay. Refs. [29,77,78,79,80,81,82,83] are cited in Supplementary Materials.

Author Contributions

Conceptualization, Z.Y. and L.L.; Methodology, Y.L., R.L., Z.S. and Y.Z.; Writing—original draft, Y.L. and Z.Y.; Writing—review and editing, Z.Y. and L.L.; Formal analysis, R.L. and Y.G.; Visualization, Y.Z.; Data curation, Y.C.; Funding acquisition, Z.Y. and L.L. All authors have read and agreed to the published version of the manuscript.

Funding

This research was funded by the National Natural Science Foundation of China (grant No. 22106189) and the Henan Provincial Department of Science and Technology (No. 252102320258).

Institutional Review Board Statement

All animal experiments were approved by the Biomedical Ethics Committee of Zhoukou Normal University, China (approval number: ZKNU-20240010; 15 March 2024), and conducted in accordance with the National Institutes of Health Guide for the Care and Use of Laboratory Animals.

Informed Consent Statement

Not applicable.

Data Availability Statement

All data are available in the article and Supplementary Materials. The 16S amplicon sequencing raw data were uploaded to the NCBI Sequence Read Archive (accession number: PRJNA1158308). Data will be made available on request.

Conflicts of Interest

The authors declare no conflicts of interest.

References

  1. Aktağ, I.G.; Hamzalıoğlu, A.; Kocadağlı, T.; Gökmen, V. Dietary exposure to acrylamide: A critical appraisal on the conversion of disregarded intermediates into acrylamide and possible reactions during digestion. Curr. Res. Food Sci. 2022, 5, 1118–1126. [Google Scholar] [CrossRef] [PubMed]
  2. European Union. Commission Regulation (EU) 2017/2158 of 20 November 2017 Establishing Mitigation Measures and Benchmark Levels for the Reduction of the Presence of Acrylamide in food. Off. J. Eur. Union. 2017, 304, 24–44. [Google Scholar]
  3. Žilić, S.; Nikolić, V.; Mogol, B.A.; Hamzalıoğlu, A.; Taş, N.G.; Kocadağlı, T.; Simić, M.; Gökmen, V. Acrylamide in corn-based thermally processed foods: A review. J. Agric. Food Chem. 2022, 70, 4165–4181. [Google Scholar] [CrossRef]
  4. Esposito, F.; Squillante, J.; Nolasco, A.; Montuori, P.; Macrì, P.G.; Cirillo, T. Acrylamide levels in smoke from conventional cigarettes and heated tobacco products and exposure assessment in habitual smokers. Environ. Res. 2022, 208, 112659. [Google Scholar] [CrossRef]
  5. Li, M.; Lin, Y.L.; Zhang, T.Y.; Xu, B.; Zhang, M.S.; Chu, W.H.; Tang, Y.L. Enhancing trace acrylamide analysis by bromine derivatization coupled with direct-immersion solid-phase microextraction in drinking water. Environ. Technol. 2021, 42, 2768–2775. [Google Scholar] [CrossRef]
  6. Bellicha, A.; Wendeu-Foyet, G.; Coumoul, X.; Koual, M.; Pierre, F.; Guéraud, F.; Zelek, L.; Debras, C.; Srour, B.; Sellem, L.; et al. Dietary exposure to acrylamide and breast cancer risk: Results from the NutriNet-Santé cohort. Am. J. Clin. Nutr. 2022, 116, 911–919. [Google Scholar] [CrossRef]
  7. Hosseini-Esfahani, F.; Beheshti, N.; Nematollahi, A.; Koochakpoor, G.; Verij-Kazemi, S.; Mirmiran, P.; Azizi, F. The association between dietary acrylamide intake and the risk of type 2 diabetes incidence in the Tehran lipid and glucose study. Sci. Rep. 2023, 13, 8235. [Google Scholar] [CrossRef]
  8. Wang, A.; Wan, X.; Zhuang, P.; Jia, W.; Ao, Y.; Liu, X.; Tian, Y.; Zhu, L.; Huang, Y.; Yao, J.; et al. High fried food consumption impacts anxiety and depression due to lipid metabolism disturbance and neuroinflammation. Proc. Natl. Acad. Sci. USA 2023, 120, e2221097120. [Google Scholar] [CrossRef]
  9. Wang, B.; Wang, X.; Yu, L.; Liu, W.; Song, J.; Fan, L.; Zhou, M.; Yang, M.; Ma, J.; Cheng, M.; et al. Acrylamide exposure increases cardiovascular risk of general adult population probably by inducing oxidative stress, inflammation, and TGF-β1: A prospective cohort study. Environ. Int. 2022, 164, 107261. [Google Scholar] [CrossRef]
  10. Govindaraju, I.; Sana, M.; Chakraborty, I.; Rahman, M.H.; Biswas, R.; Mazumder, N. Dietary acrylamide: A detailed review on formation, detection, mitigation, and its health impacts. Foods 2024, 13, 556. [Google Scholar] [CrossRef]
  11. Yue, Z.; Chen, Y.; Song, Y.; Zhang, J.; Yang, X.; Wang, J.; Li, L.; Sun, Z. Effect of acrylamide on glucose homeostasis in female rats and its mechanisms. Food Chem. Toxicol. 2020, 135, 110894. [Google Scholar] [CrossRef] [PubMed]
  12. Yue, Z.; Chen, Y.; Dong, Q.; Li, D.; Guo, M.; Zhang, L.; Shi, Y.; Wu, H.; Li, L.; Sun, Z. Acrylamide induced glucose metabolism disorder in rats involves gut microbiota dysbiosis and changed bile acids metabolism. Food Res. Int. 2022, 157, 111405. [Google Scholar] [CrossRef] [PubMed]
  13. Yue, Z.; Zhao, F.; Guo, Y.; Zhang, Y.; Chen, Y.; He, L.; Li, L. Lactobacillus reuteri JCM 1112 ameliorates chronic acrylamide-induced glucose metabolism disorder via the bile acid–TGR5–GLP-1 axis and modulates intestinal oxidative stress in mice. Food Func. 2024, 15, 6450–6458. [Google Scholar] [CrossRef] [PubMed]
  14. Peivasteh-Roudsari, L.; Karami, M.; Barzegar-Bafrouei, R.; Samiee, S.; Karami, H.; Tajdar-Oranj, B.; Mahdavi, V.; Alizadeh, A.M.; Sadighara, P.; Oliveri Conti, G.; et al. Toxicity, metabolism, and mitigation strategies of acrylamide: A comprehensive review. Int. J. Environ. Health Res. 2024, 34, 1–29. [Google Scholar] [CrossRef]
  15. Sewwandi, M.; Wijesekara, H.; Rajapaksha, A.U.; Soysa, S.; Vithanage, M. Microplastics and plastics-associated contaminants in food and beverages; Global trends, concentrations, and human exposure. Environ. Pollut. 2023, 317, 120747. [Google Scholar] [CrossRef]
  16. Hussain, K.A.; Romanova, S.; Okur, I.; Zhang, D.; Kuebler, J.; Huang, X.; Wang, B.; Fernandez-Ballester, L.; Lu, Y.; Schubert, M.; et al. Assessing the release of microplastics and nanoplastics from plastic containers and reusable food pouches: Implications for human health. Environ. Sci. Technol. 2023, 57, 9782–9792. [Google Scholar] [CrossRef]
  17. Siddiqui, S.A.; Bahmid, N.A.; Salman, S.H.M.; Nawaz, A.; Walayat, N.; Shekhawat, G.K.; Gvozdenko, A.A.; Blinov, A.V.; Nagdalian, A.A. Migration of microplastics from plastic packaging into foods and its potential threats on human health. Adv. Food Nutr. Res. 2023, 103, 313–359. [Google Scholar] [CrossRef]
  18. Son, J.W.; Nam, Y.; Kim, C. Nanoplastics from disposable paper cups and microwavable food containers. J. Hazard. Mater. 2024, 464, 133014. [Google Scholar] [CrossRef]
  19. Chen, Y.; Meng, Y.; Liu, G.; Huang, X.; Chai, G. Probabilistic estimation of airborne micro- and nanoplastic intake in humans. Environ. Sci. Technol. 2024, 58, 9071–9081. [Google Scholar] [CrossRef]
  20. Chen, C.Y.; Lin, Z. Exploring the potential and challenges of developing physiologically-based toxicokinetic models to support human health risk assessment of microplastic and nanoplastic particles. Environ. Int. 2024, 186, 108617. [Google Scholar] [CrossRef]
  21. Wu, P.; Lin, S.; Cao, G.; Wu, J.; Jin, H.; Wang, C.; Wong, M.H.; Yang, Z.; Cai, Z. Absorption, distribution, metabolism, excretion and toxicity of microplastics in the human body and health implications. J. Hazard. Mater. 2022, 437, 129361. [Google Scholar] [CrossRef] [PubMed]
  22. Yan, Z.; Liu, Y.; Zhang, T.; Zhang, F.; Ren, H.; Zhang, Y. Analysis of Microplastics in Human Feces Reveals a Correlation between Fecal Microplastics and Inflammatory Bowel Disease Status. Environ. Sci. Technol. 2022, 56, 414–421. [Google Scholar] [CrossRef] [PubMed]
  23. Sharma, V.K.; Ma, X.; Lichtfouse, E.; Robert, D. Nanoplastics are potentially more dangerous than microplastics. Environ. Chem. Lett. 2023, 21, 1933–1936. [Google Scholar] [CrossRef]
  24. Yang, H.; Kong, L.; Chen, Z.; Wu, J. Effect of functional groups of polystyrene nanoplastics on the neurodevelopmental toxicity of acrylamide in the early life stage of zebrafish. Aquat. Toxicol. 2025, 278, 107177. [Google Scholar] [CrossRef] [PubMed]
  25. Hsu, C.L.; Schnabl, B. The gut-liver axis and gut microbiota in health and liver disease. Nat. Rev. Microbiol. 2023, 21, 719–733. [Google Scholar] [CrossRef]
  26. Amedei, A.; Gitto, S.; Campani, C.; Marra, F. Probiotics and the gut-liver axis. In Probiotics: Advanced Food and Health Applications; Brandelli, A., Ed.; Academic Press: Cambridge, MA, USA, 2022; pp. 467–481. [Google Scholar]
  27. Wen, S.; Zhao, Y.; Liu, S.; Chen, Y.; Yuan, H.; Xu, H. Polystyrene microplastics exacerbated liver injury from cyclophosphamide in mice: Insight into gut microbiota. Sci. Total Environ. 2022, 840, 156668. [Google Scholar] [CrossRef]
  28. Sánchez, J.; Cabrer, J.M.; Rosselló, C.A.; Palou, A.; Picó, C. Formation of hemoglobin adducts of acrylamide after its ingestion in rats is dependent on age and sex. J. Agric. Food Chem. 2008, 56, 5096–5101. [Google Scholar] [CrossRef]
  29. Senathirajah, K.; Attwood, S.; Bhagwat, G.; Carbery, M.; Wilson, S.; Palanisami, T. Estimation of the mass of microplastics ingested—A pivotal first step towards human health risk assessment. J. Hazard. Mater. 2021, 404, 124004. [Google Scholar] [CrossRef]
  30. Wang, Y.L.; Lin, S.X.; Wang, Y.; Liang, T.; Jiang, T.; Liu, P.; Li, X.Y.; Lang, D.Q.; Liu, Q.; Shen, C.Y. p-Synephrine ameliorates alloxan-induced diabetes mellitus through inhibiting oxidative stress and inflammation via suppressing the NF-kappa B and MAPK pathways. Food Funct. 2023, 14, 1971–1988. [Google Scholar] [CrossRef]
  31. Guo, J.; Han, X.; Tan, H.; Huang, W.; You, Y.; Zhan, J. Blueberry extract improves obesity through regulation of the gut microbiota and bile acids via pathways involving FXR and TGR5. iScience 2019, 19, 676–690. [Google Scholar] [CrossRef]
  32. Tang, K.H.D.; Li, R.; Li, Z.; Wang, D. Health risk of human exposure to microplastics: A review. Environ. Chem. Lett. 2024, 22, 1155–1183. [Google Scholar] [CrossRef]
  33. Bridgeman, L.; Juan, C.; Juan-García, A.; Berrada, H. Individual and combined effect of acrylamide, fumitremorgin C and penitrem A on human neuroblastoma SH-SY5Y cells. Food Chem. Toxicol. 2023, 182, 114114. [Google Scholar] [CrossRef] [PubMed]
  34. Su, D.; Lu, J.; Nie, C.; Guo, Z.; Li, C.; Yu, Q.; Xie, J.; Chen, Y. Combined effects of acrylamide and ochratoxin A on the intestinal barrier in Caco-2 cells. Foods 2023, 12, 1318. [Google Scholar] [CrossRef] [PubMed]
  35. Ye, J.; Qiu, W.; Pang, X.; Su, Y.; Zhang, X.; Huang, J.; Xie, H.; Liao, J.; Tang, Z.; Chen, Z.; et al. Polystyrene nanoplastics and cadmium co-exposure aggravated cardiomyocyte damage in mice by regulating PANoptosis pathway. Environ. Pollut. 2024, 347, 123713. [Google Scholar] [CrossRef]
  36. Zhang, K.K.; Wan, J.Y.; Chen, Y.C.; Cheng, C.H.; Zhou, H.Q.; Zheng, D.K.; Lan, Z.X.; You, Q.H.; Sun, J. Polystyrene nanoplastics exacerbate aflatoxin B1-induced hepatic injuries by modulating the gut-liver axis. Sci. Total Environ. 2024, 935, 173285. [Google Scholar] [CrossRef]
  37. Choi, Y.J.; Park, J.W.; Lim, Y.; Seo, S.; Hwang, D.Y. In vivo impact assessment of orally administered polystyrene nanoplastics: Biodistribution, toxicity, and inflammatory response in mice. Nanotoxicology 2021, 15, 1180–1198. [Google Scholar] [CrossRef]
  38. Yuan, Y.; Li, L.; Nan, B.; Yang, C.; Yan, H. Allicin ameliorates intestinal barrier damage via microbiota-regulated short-chain fatty acids-TLR4/MyD88/NF-κB cascade response in acrylamide-induced rats. J. Agric. Food Chem. 2021, 69, 12837–12852. [Google Scholar] [CrossRef]
  39. Vancamelbeke, M.; Vermeire, S. The intestinal barrier: A fundamental role in health and disease. Expert Rev. Gastroent. Hepatol. 2017, 11, 821–834. [Google Scholar] [CrossRef]
  40. Chelakkot, C.; Ghim, J.; Ryu, S.H. Mechanisms regulating intestinal barrier integrity and its pathological implications. Exp. Mol. Med. 2018, 50, 1–9. [Google Scholar] [CrossRef]
  41. Yang, D.; Jacobson, A.; Meerschaert, K.A.; Sifakis, J.J.; Wu, M.; Chen, X.; Yang, T.; Zhou, Y.; Anekal, P.V.; Rucker, R.A.; et al. Nociceptor neurons direct goblet cells via a CGRP-RAMP1 axis to drive mucus production and gut barrier protection. Cell 2022, 185, 4190–4205. [Google Scholar] [CrossRef]
  42. Zheng, D.; Liao, H.; Chen, S.; Liu, X.; Mao, C.; Zhang, C.; Meng, M.; Wang, Z.; Wang, Y.; Jiang, Q.; et al. Elevated levels of circulating biomarkers related to leaky gut syndrome and bacterial translocation are associated with Graves’ disease. Front. Endocrinol. 2021, 12, 796212. [Google Scholar] [CrossRef] [PubMed]
  43. Slifer, Z.M.; Blikslager, A.T. The integral role of tight junction proteins in the repair of injured intestinal epithelium. Int. J. Mol. Sci. 2020, 21, 972. [Google Scholar] [CrossRef] [PubMed]
  44. An, L.; Wirth, U.; Koch, D.; Schirren, M.; Drefs, M.; Koliogiannis, D.; Nieß, H.; Andrassy, J.; Guba, M.; Bazhin, A.V.; et al. The role of gut-derived lipopolysaccharides and the intestinal barrier in fatty liver diseases. J. Gastrointest. Surg. 2022, 26, 671–683. [Google Scholar] [CrossRef]
  45. Xiong, X.; Ren, Y.; Cui, Y.; Li, R.; Wang, C.; Zhang, Y. Obeticholic acid protects mice against lipopolysaccharide-induced liver injury and inflammation. Biomed. Pharmacother. 2017, 96, 1292–1298. [Google Scholar] [CrossRef]
  46. Ozer, J.; Ratner, M.; Shaw, M.; Bailey, W.; Schomaker, S. The current state of serum biomarkers of hepatotoxicity. Toxicology 2008, 245, 194–205. [Google Scholar] [CrossRef]
  47. Shi, C.; Han, X.; Guo, W.; Wu, Q.; Yang, X.; Wang, Y.; Tang, G.; Wang, S.; Wang, Z.; Liu, Y.; et al. Disturbed Gut-Liver axis indicating oral exposure to polystyrene microplastic potentially increases the risk of insulin resistance. Environ. Int. 2022, 164, 107273. [Google Scholar] [CrossRef]
  48. Sun, W.; Yan, S.; Meng, Z.; Tian, S.; Jia, M.; Huang, S.; Wang, Y.; Zhou, Z.; Diao, J.; Zhu, W. Combined ingestion of polystyrene microplastics and epoxiconazole increases health risk to mice: Based on their synergistic bioaccumulation in vivo. Environ. Int. 2022, 166, 107391. [Google Scholar] [CrossRef]
  49. Xue, C.; Li, G.; Zheng, Q.; Gu, X.; Shi, Q.; Su, Y.; Chu, Q.; Yuan, X.; Bao, Z.; Lu, J.; et al. Tryptophan metabolism in health and disease. Cell Metab. 2023, 35, 1304–1326. [Google Scholar] [CrossRef]
  50. Holeček, M. Histidine in health and disease: Metabolism, physiological importance, and use as a supplement. Nutrients 2020, 12, 848. [Google Scholar] [CrossRef]
  51. Branco, A.C.C.C.; Yoshikawa, F.S.Y.; Pietrobon, A.J.; Sato, M.N. Role of histamine in modulating the immune response and inflammation. Mediat. Inflamm. 2018, 2018, 9524075. [Google Scholar] [CrossRef]
  52. Fernstrom, J.D.; Fernstrom, M.H. Tyrosine, phenylalanine, and catecholamine synthesis and function in the brain. J. Nutr. 2007, 137, 1539S–1548S. [Google Scholar] [CrossRef] [PubMed]
  53. Obayashi, Y.; Arisaka, H.; Yoshida, S.; Mori, M.; Takahashi, M. Proline protects liver from D-galactosamine hepatitis by activating the IL-6/STAT3 survival signaling pathway. Amino Acids 2012, 43, 2371–2380. [Google Scholar] [CrossRef] [PubMed]
  54. Zhang, Y.; Tan, W.; Wang, X.; Zheng, X.; Huang, Y.; Li, B.; Meng, Z.; Gao, Y.; Qian, Z.; Liu, F.; et al. Chronic Liver Failure Consortium (Ch-CLIF.C). Metabolic biomarkers significantly enhance the prediction of HBV-related ACLF occurrence and outcomes. J. Hepatol. 2023, 79, 1159–1171. [Google Scholar] [CrossRef]
  55. Zhou, J.; Wang, X.; Wang, M.; Chang, Y.; Zhang, F.; Ban, Z.; Tang, R.; Gan, Q.; Wu, S.; Guo, Y.; et al. The lysine catabolite saccharopine impairs development by disrupting mitochondrial homeostasis. J. Cell Biol. 2019, 218, 580–597. [Google Scholar] [CrossRef] [PubMed]
  56. Fan, X.; Wei, X.; Hu, H.; Zhang, B.; Yang, D.; Du, H.; Zhu, R.; Sun, X.; Oh, Y.; Gu, N. Effects of oral administration of polystyrene nanoplastics on plasma glucose metabolism in mice. Chemosphere 2022, 288, 132607. [Google Scholar] [CrossRef]
  57. Forouzanfar, F.; Guest, P.C.; Jamialahmadi, T.; Sahebkar, A. Hepatoprotective effect of trehalose: Insight into its mechanisms of action. In Natural Products and Human Diseases; Sahebkar, A., Sathyapalan, T., Eds.; Springer: Cham, Switzerland, 2021; pp. 489–500. [Google Scholar]
  58. Conte, F.; van Buuringen, N.; Voermans, N.C.; Lefeber, D.J. Galactose in human metabolism, glycosylation and congenital metabolic diseases: Time for a closer look. Bba-Gen. Subjects 2021, 1865, 129898. [Google Scholar] [CrossRef]
  59. Succoio, M.; Sacchettini, R.; Rossi, A.; Parenti, G.; Ruoppolo, M. Galactosemia: Biochemistry, molecular genetics, newborn screening, and treatment. Biomolecules 2022, 12, 968. [Google Scholar] [CrossRef]
  60. Martínez-Reyes, I.; Chandel, N.S. Mitochondrial TCA cycle metabolites control physiology and disease. Nat. Commun. 2020, 11, 102. [Google Scholar] [CrossRef]
  61. Song, Y.; Hu, T.; Gao, H.; Zhai, J.; Gong, J.; Zhang, Y.; Tao, L.; Sun, J.; Li, Z.; Qu, X. Altered metabolic profiles and biomarkers associated with astragaloside IV-mediated protection against cisplatin-induced acute kidney injury in rats: An HPLC-TOF/MS-based untargeted metabolomics study. Biochem. Pharmacol. 2021, 183, 114299. [Google Scholar] [CrossRef]
  62. Dabke, K.; Hendrick, G.; Devkota, S. The gut microbiome and metabolic syndrome. J. Clin. Investig. 2019, 129, 4050–4057. [Google Scholar] [CrossRef]
  63. Qiu, P.; Ishimoto, T.; Fu, L.; Zhang, J.; Zhang, Z.; Liu, Y. The Gut microbiota in inflammatory bowel disease. Front. Cell. Infect. Microbiol. 2022, 12, 733992. [Google Scholar] [CrossRef] [PubMed]
  64. Gao, Q.; Sun, G.; Duan, J.; Luo, C.; Yangji, C.; Zhong, R.; Chen, L.; Zhu, Y.; Wangdui, B.; Zhang, H. Alterations in gut microbiota improve SCFA production and fiber utilization in Tibetan pigs fed alfalfa diet. Front. Microbiol. 2022, 13, 969524. [Google Scholar] [CrossRef]
  65. Hu, W.; Huang, L.; Zhou, Z.; Yin, L.; Tang, J. Diallyl disulfide (DADS) ameliorates intestinal candida albicans infection by modulating the gut microbiota and metabolites and providing intestinal protection in mice. Front. Cell. Infect. Microbiol. 2022, 11, 743454. [Google Scholar] [CrossRef] [PubMed]
  66. Huang, J.; Pan, Y.; Liu, L.; Liang, J.; Wu, L.; Zhu, H.; Zhang, P. High salinity slowed organic acid production from acidogenic fermentation of kitchen wastewater by shaping functional bacterial community. J. Environ. Manag. 2022, 310, 114765. [Google Scholar] [CrossRef]
  67. Pfeiffer, N.; Desmarchelier, C.; Blaut, M.; Daniel, H.; Haller, D.; Clavel, T. Acetatifactor muris gen. nov., sp nov., a novel bacterium isolated from the intestine of an obese mouse. Arch. Microbiol. 2012, 194, 901–907. [Google Scholar] [CrossRef]
  68. Tamanai-Shacoori, Z.; Smida, I.; Bousarghin, L.; Loreal, O.; Meuric, V.; Fong, S.B.; Bonnaure-Mallet, M.; Jolivet-Gougeon, A. Roseburia spp.: A marker of health? Future Microbiol. 2017, 12, 157–170. [Google Scholar] [CrossRef]
  69. Yao, Y.; Cai, X.; Fei, W.; Ye, Y.; Zhao, M.; Zheng, C. The role of short-chain fatty acids in immunity, inflammation and metabolism. Crit. Rev. Food Sci. 2022, 62, 1–12. [Google Scholar] [CrossRef]
  70. Duan, Y.; Guo, F.; Li, C.; Xiang, D.; Gong, M.; Yi, H.; Chen, L.; Yan, L.; Zhang, D.; Dai, L.; et al. Aqueous extract of fermented Eucommia ulmoides leaves alleviates hyperlipidemia by maintaining gut homeostasis and modulating metabolism in high-fat diet fed rats. Phytomedicine 2024, 128, 155291. [Google Scholar] [CrossRef]
  71. Liu, Y.; Feng, Y.; Yang, X.; Lv, Z.; Li, P.; Zhang, M.; Wei, F.; Jin, X.; Hu, Y.; Guo, Y.; et al. Mining chicken ileal microbiota for immunomodulatory microorganisms. ISME J. 2023, 17, 758–774. [Google Scholar] [CrossRef]
  72. Liu, Y.; Zhou, M.; Yang, M.; Jin, C.; Song, Y.; Chen, J.; Gao, M.; Ai, Z.; Su, D. Pulsatilla chinensis saponins ameliorate inflammation and DSS-induced ulcerative colitis in rats by regulating the composition and diversity of intestinal flora. Front. Cell. Infect. Microbiol. 2021, 11, 728929. [Google Scholar] [CrossRef]
  73. Fu, R.; Niu, R.; Li, R.; Yue, B.; Zhang, X.; Cao, Q.; Wang, J.; Sun, Z. Fluoride-induced alteration in the diversity and composition of bacterial microbiota in mice colon. Biol. Trace Elem. Res. 2020, 196, 537–544. [Google Scholar] [CrossRef] [PubMed]
  74. Ma, L.; Zhao, X.; Liu, T.; Wang, Y.; Wang, J.; Kong, L.; Zhao, Q.; Chen, Y.; Chen, L.; Zhang, H. Xuanfei Baidu decoction attenuates intestinal disorders by modulating NF-κB pathway, regulating T cell immunity and improving intestinal flora. Phytomedicine 2022, 101, 154100. [Google Scholar] [CrossRef] [PubMed]
  75. Zhang, B.; Wan, Y.; Zhou, X.; Zhang, H.; Zhao, H.; Ma, L.; Dong, X.; Yan, M.; Zhao, T.; Li, P. Characteristics of serum metabolites and gut microbiota in diabetic kidney disease. Front. Pharmacol. 2022, 13, 872988. [Google Scholar] [CrossRef]
  76. He, F.; Shi, H.; Liu, R.; Tian, G.; Qi, Y.; Wang, T. Randomly-shaped nanoplastics induced stronger biotoxicity targeted to earthworm Eisenia fetida species: Differential effects and the underlying mechanisms of realistic and commercial polystyrene nanoplastics. Sci. Total Environ. 2023, 877, 162854. [Google Scholar] [CrossRef] [PubMed]
  77. The Joint FAO/WHO Expert Committee on Food Additives (JECFA). Evaluation of Certain Food Additives and Contaminants: Seventy-Second Report of the Joint FAO/WHO Expert Committee on Food Additive; WHO Technical Report Series; WHO: Geneva, Switzerland, 2011; p. 959. [Google Scholar]
  78. Tardiff, R.G.; Gargas, M.L.; Kirman, C.R.; Carson, M.L.; Sweeney, L.M. Estimation of safe dietary intake levels of acrylamide for humans. Food Chem. Toxicol. 2010, 48, 658–667. [Google Scholar] [CrossRef]
  79. The Joint FAO/WHO Expert Committee on Food Additives (JECFA). Evaluation of Certain Food Additives and Contaminants: Sixty-Fourth Report of the Joint FAO/WHO Expert Committee on Food Additive; WHO Technical Report Series; WHO: Geneva, Switzerland, 2005; p. 930. [Google Scholar]
  80. Reagan-Shaw, S.; Nihal, M.; Ahmad, N. Dose translation from animal to human studies revisited. FASEB J. 2008, 22, 659–661. [Google Scholar] [CrossRef]
  81. Chen, S.N.; Tan, Y.; Xiao, X.C.; Li, Q.; Wu, Q.; Peng, Y.Y.; Ren, J.; Dong, M.L. Deletion of TLR4 attenuates lipopolysaccharide-induced acute liver injury by inhibiting inflammation and apoptosis. Acta Pharmacol. Sin. 2021, 42, 1610–1619. [Google Scholar] [CrossRef]
  82. Liu, X.; Zhang, Y.; Li, W.; Zhang, B.; Yin, J.; Liuqi, S.; Wang, J.; Peng, B.; Wang, S. Fucoidan ameliorated dextran sulfate sodium-induced ulcerative colitis by modulating gut microbiota and bile acid metabolism. J. Agric. Food Chem. 2022, 70, 14864–14876. [Google Scholar] [CrossRef]
  83. Zhao, Z.; Ning, J.; Bao, X.Q.; Shang, M.; Ma, J.; Li, G.; Zhang, D. Fecal microbiota transplantation protects rotenone-induced Parkinson’s disease mice via suppressing inflammation mediated by the lipopolysaccharide-TLR4 signaling pathway through the microbiota-gut-brain axis. Microbiome 2021, 9, 226. [Google Scholar] [CrossRef]
Figure 1. Effects of exposure to AA and/or PS-NPs on colonic histopathology and inflammatory cytokine levels. (A) Representative images of colon sections stained with H&E (200×). The red arrows display inflammatory infiltration. (BE) Colonic TNF-α, IL-1β, IL-6, and IL-17A levels. Data are presented as means ± SD (n = 3). * p < 0.05 and ** p < 0.01 compared to the control group; # p < 0.05 and ## p < 0.01 compared to the AA + PS-NP group.
Biology 14 00523 g001
Figure 2. Effects of exposure to AA and/or PS-NPs on mucus secretion and intestinal barrier in colon of mice. (A) Serum LPS content. (B) Serum DAO activity. (C) Representative images of colon sections stained with AB-PAS (150×). (D) Coverage ratio of mucus secretion. (E) Relative mRNA levels of colonic ZO-1, Occludin, and Claudin-5. Data are presented as means ± SD (n = 3). * p < 0.05 and ** p < 0.01 compared to control group; # p < 0.05 and ## p < 0.01 compared to AA + PS-NP group.
Biology 14 00523 g002
Figure 3. Effects of exposure to AA and/or PS-NPs on serum biomarkers, histopathology, and inflammatory cytokine levels in the liver. (A) Serum ALT activity. (B) Serum AST activity. (C) Representative images of liver sections stained with H&E (200×). The red arrows display inflammatory infiltration. (DG) Hepatic TNF-α, IL-1β, IL-6, and IL-17A levels. Data are presented as means ± SD (n = 3). * p < 0.05 and ** p < 0.01 compared to the control group; ## p < 0.01 compared to the AA + PS-NP group.
Biology 14 00523 g003
Figure 4. Effects of exposure to AA and/or PS-NPs on liver metabolomics in mice. (A) PCA score plot of metabolites obtained by positive and negative ion modes. (B) Statistical graph of DMs under AA, PS-NP, and AA + PS-NP exposure compared with those in the control group (n = 5). (C) HMDB compound classification of DMs. (DF) KEGG topology analysis of DMs. The size and color of each dot represent the pathway impact value and p value, respectively. The blue font represents the amino acid metabolism pathways, while the green font represents the carbohydrate metabolism pathways.
Biology 14 00523 g004
Figure 5. Effects of exposure to AA and/or PS-NPs on microbial diversity of cecal contents of mice. (A) The rarefaction curves for the Shannon index at the ASV level for all samples. (BE) Microbial alpha diversity analysis: Sobs index (B), Ace index (C), Chao 1 index (D), and Shannon index (E). (F) NMDS analysis of beta diversity based on the Bray–Curtis distance at the genus level. Data are represented as means ± SD (n = 3). * p < 0.05 compared to the control group; # p < 0.05 compared to the AA + PS-NP group.
Biology 14 00523 g005
Figure 6. Differentially abundant microbes at the genus level between groups. (A) unclassified_f__Oscillospiraceae. (B) Roseburia. (C) UCG-005. (D) Ruminiclostridium. (E) unclassified_o__Clostridia_UCG-014. (F) Acetatifactor. (G) Fournierella. (H) Eubacterium_xylanophilum_group. (I) Eubacterium_nodatum_group. Data are represented as means ± SD (n = 3). * p < 0.05 and ** p < 0.01 compared to the control group; # p < 0.05 and ## p < 0.01 compared to the AA + PS-NP group.
Biology 14 00523 g006
Figure 7. Spearman′s correlation analysis between differentially abundant genera and related indicators involved in intestinal damage and liver injury (A), and between intestinal damage-related indicators and liver injury related indicators (B). * p < 0.05; ** p < 0.01.
Biology 14 00523 g007
Table 1. The representative DMs involved in amino acid and carbohydrate metabolism pathways under AA, PS-NP, and AA + PS-NP exposures.
MetaboliteM/ZControl vs. AAControl vs. PS-NPsControl vs. AA + PS-NPs
VIPFCRegulateVIPFCRegulateVIPFCRegulate
Amino acids metabolism
Kynurenine207.0791.2800.9581.2800.9581.3100.925
Anthranilic acid136.0411.7020.9361.7020.9361.8540.854
Kynurenic acid190.0491.8860.9312.2460.9191.8640.879
L-Histidine156.0761.5491.0361.5491.0361.3271.053
Histamine110.0731.2221.0511.2221.051
Urocanic acid137.0361.2841.0461.2841.046
Serotonin177.1011.5261.057 1.9141.142
5-Hydroxytryptophan219.079 1.1991.059
Indole-3-acetamide175.086 1.8881.106
Indole-3-acetaldoxime175.085 2.4051.301
Indole-3-acetic acid158.059 2.0521.142
Ergothioneine230.094 1.6381.095
Methionine sulfoxide166.052 1.4871.071
Saccharopine318.163 1.1821.057
Phenylalanine331.163 1.5250.911
L-proline116.070 1.0170.977
Carbohydrate metabolism
Lactose377.0872.0331.1262.6421.1752.2791.233
D-Glucose225.0631.0501.0381.7001.0731.2651.081
UDP-D-galactose565.0501.8501.080
UDP-glucose565.0501.7921.099
UDP-N-acetylglucosamine606.0771.5351.059
Glucosamine162.0751.0921.024
Stachyose665.217 4.6151.6403.4231.686
Dextran549.169 4.0261.3353.1561.393
Levan487.163 3.8751.2433.0751.324
Trehalose325.111 3.7261.1992.6121.218
Galactinol387.116 2.1101.1081.6201.118
Citric acid191.021 1.4290.909
Isocitric acid191.021 1.3450.924
Glyceric acid105.020 1.2970.929
2-Ketoglutaric acid145.015 1.1390.918
Glycolic acid75.009 1.0690.955
Note: ↑: increase, ↓: decrease.
Disclaimer/Publisher’s Note: The statements, opinions and data contained in all publications are solely those of the individual author(s) and contributor(s) and not of MDPI and/or the editor(s). MDPI and/or the editor(s) disclaim responsibility for any injury to people or property resulting from any ideas, methods, instructions or products referred to in the content.

