Article

Temporal and Spatial Population Genetic Variation in Chilean Jack Mackerel (Trachurus murphyi)

by
Cristian B. Canales-Aguirre
1,*,
Sandra Ferrada Fuentes
2,3 and
Ricardo Galleguillos
2
1
Centro i~mar, Universidad de Los Lagos, Camino a Chinquihue 6 km, Puerto Montt 5480000, Chile
2
Laboratorio de Genética y Acuicultura, Departamento de Oceanografía, Facultad de Ciencias Naturales y Oceanográficas, Universidad de Concepción, Concepción 4070386, Chile
3
Doctorado en Sistemática y Biodiversidad, Facultad de Ciencias Naturales y Oceanográficas, Universidad de Concepción, Concepción 4070386, Chile
*
Author to whom correspondence should be addressed.
Biology 2025, 14(5), 510; https://doi.org/10.3390/biology14050510
Submission received: 12 March 2025 / Revised: 1 April 2025 / Accepted: 10 April 2025 / Published: 7 May 2025
(This article belongs to the Special Issue Genetic Variability within and between Populations)

Simple Summary

Scientists have studied the population genetics of Trachurus murphyi (Chilean jack mackerel) for decades and found that it forms a single large population across the South Pacific Ocean. While previous research has focused on genetic differences across locations, little is known about how these patterns change over time. Our study explores both regional and seasonal genetic patterns in T. murphyi, including differences between feeding and spawning seasons—something not previously examined. By analyzing genetic markers, we confirm that the species maintains an overall stable genetic structure across different years and seasons. Additionally, we identify potential genetic markers that could help monitor future changes in the population.

Abstract

Trachurus murphyi have been studied for population genetic structures for decades, identifying only one large population across the South Pacific Ocean. Although all of these studies have extensively examined the spatial genetic pattern, there remains a gap in understanding the potential role of temporality. Our study aims to elucidate spatial and temporal genetic patterns in T. murphyi populations in the South Pacific Ocean, examining genetic composition across seasons, including feeding and spawning seasons, where the latter was not previously investigated. Using 10 microsatellite loci, our study confirms an overall consistent and stable population genetic pattern in T. murphyi across its geographic distribution observed over multiple years and seasons. The only exception was found for New Zealand in the spring–summer season. Furthermore, we identify potential genetic markers for monitoring variability in the species.

1. Introduction

The Chilean jack mackerel, Trachurus murphyi, is a highly mobile marine fish distributed throughout the South Pacific Ocean (SPO) [1]. It is found along the coast from Ecuador to Chile in the SPO and near the coasts of New Zealand and the Tasmanian Sea [1,2,3]. Due to its significant importance for fisheries in the SPO region, numerous studies have investigated population differences within its distribution range, examining various aspects such as life history traits, meristic and morphometric characteristics, and microchemistry of otoliths, as well as genetic markers [1,3,4,5,6,7,8,9,10,11,12,13].
Several studies have been conducted using molecular tools to obtain insight into the population genetic structure in T. murphyi across the SPO. Since the 1980s, all of them have focused on the integration of population genetic data into a tool for informed decision-making for this species [4,5,7]. For instance, Cárdenas et al. [5] found high genetic diversity using three heterologous microsatellites, and similar results were found by Ferrada Fuentes et al. [7] using seven microsatellites. These population genetic studies and others have concluded that this species has not shown population genetic structure along its geographic distribution. However, while these studies have extensively examined spatial genetic patterns, there remains a gap in understanding the potential role of temporality. It is important to consider that individuals may migrate to spawning areas before dispersing to feeding areas, where mixing occurs [14,15]. Therefore, sampling individuals in spawning areas can provide valuable insights and maximize the likely population genetic difference compared with areas where there can be mixing.
Our study aims to shed new light on the spatial and temporal genetic composition of T. murphyi populations in the SPO. We study genetic patterns over different seasons across a year, including feeding (winter–fall) and spawning (spring–summer), which were not included in previous studies. As a null hypothesis (H0), we propose that there are no significant genetic differences over time (between seasons) or across space (between feeding and spawning areas). Alternatively (H1), we hypothesize that genetic differences will be more pronounced during the spawning season (spring–summer) due to population segregation in spawning areas, whereas no genetic structuring is expected during the feeding season (fall–winter) due to population mixing. Additionally, we expect to identify genetic markers that may serve as indicators of changes in genetic diversity by comparing the expected heterozygosity with previous studies that used the same loci. If the population structure remains stable, heterozygosity levels should be similar; otherwise, deviations could suggest recent evolutionary processes such as genetic drift or shifts in migration patterns. Finally, we aim to expand our understanding of population structures in marine species over time and shed light on the evolutionary processes within T. murphyi.

2. Materials and Methods

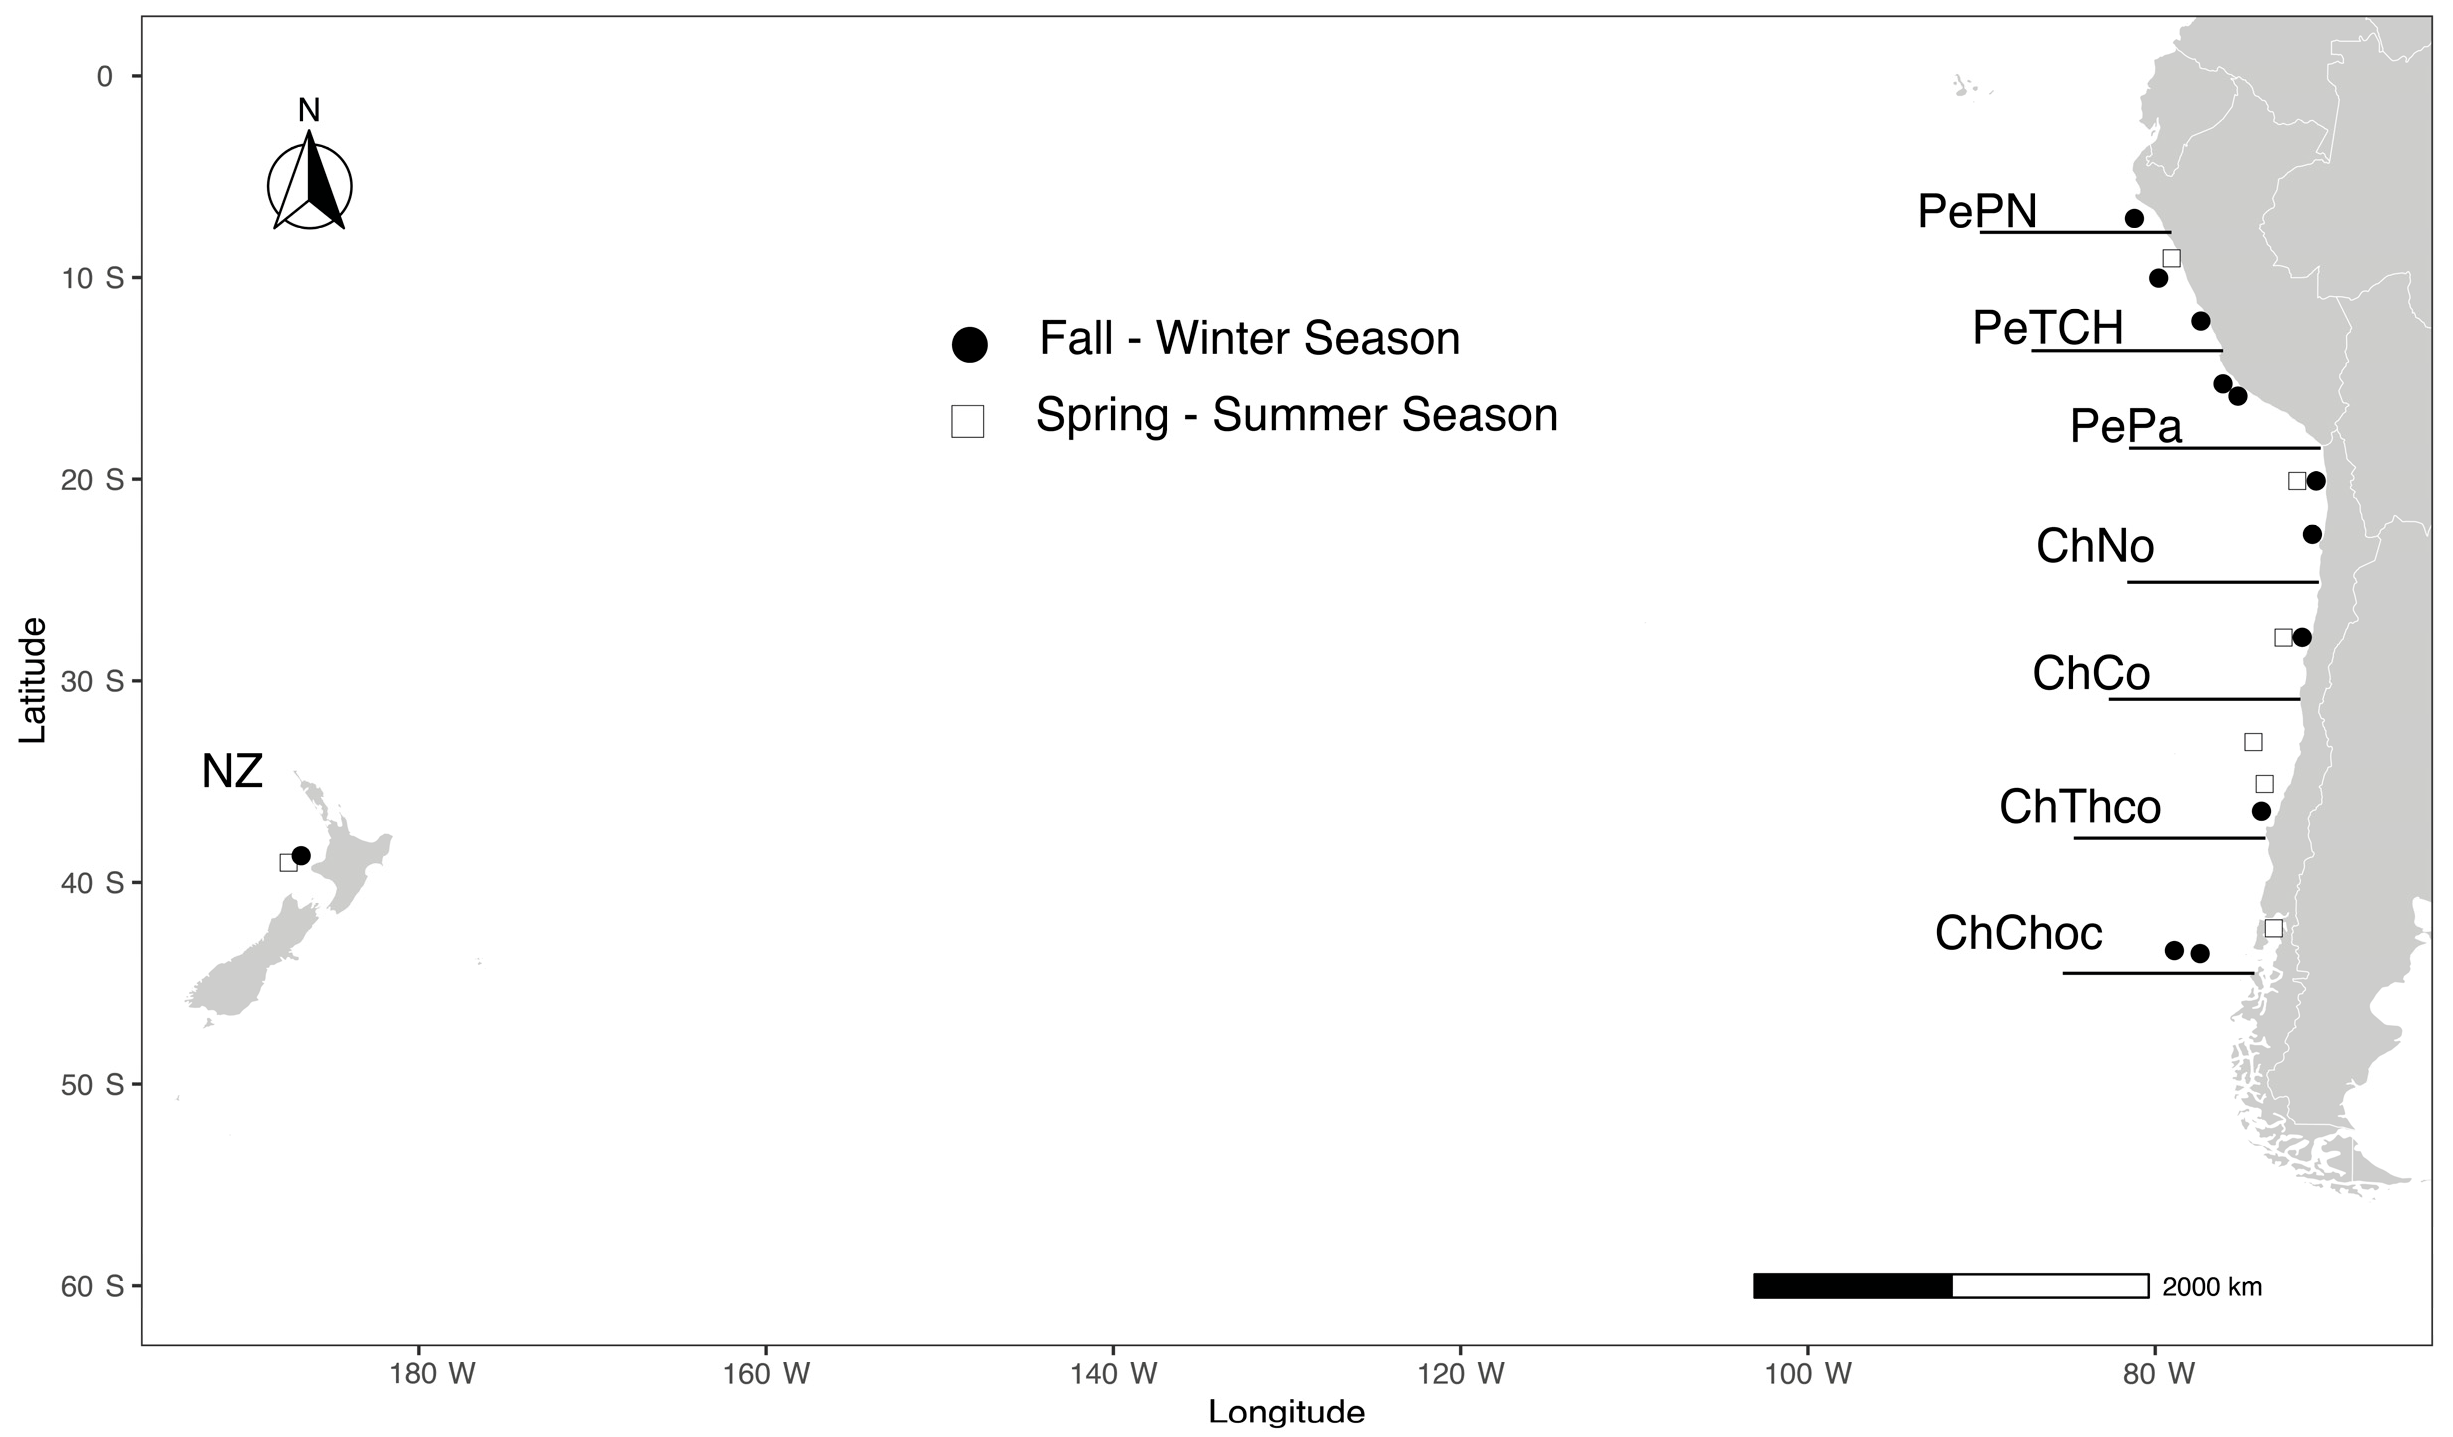
2.1. Sample Collection Areas

We collected a total of 852 individuals of Trachurus murphyi in 2011–2012 from 18 locations across the coastal areas of the SPO (i.e., Peru, Chile, and New Zealand; Figure 1) during fall–winter (_FW, N = 538) and spring–summer (_SS, N = 314) seasons. The fall–winter season (March to August) corresponds to the main period where fishery vessels catch Chilean jack mackerel; hence, there are no biological reproductive closures. Also, this period corresponds to the feeding time, so individuals disperse from their main reproductive areas to several points along the coast and ocean zones. The fall–winter season included twelve locations: six from Peru, five from Chile, and one from New Zealand. The fall–winter locations were aggregated as follows: PePN_FW (Pimentel), PeTCH_FW (Chimbote and Ancon), and PePa_FW (Cañete, Tambo de Moras, and Olleros) in Peru; ChNo_FW (Iquique and Mejillones), ChCo_FW (Coquimbo), ChThco_FW (Talcahuano coast), and ChChoc_FW (Chiloé oceanic) in Chile; and NZ_FW in New Zealand. The spring–summer season (October to February) corresponds to the spawning season, where fishery vessels are forbidden to catch Chilean jack mackerel [1] because of biological reproductive closures. This season, individuals move from feeding to their main reproductive areas [1]. The spring–summer season included six locations: one from Peru, four from Chile, and one from New Zealand. The spring–summer locations were aggregated as follows: PeTCH_SS (Chiclayo) in Peru; ChNo_SS (Iquique), ChCo_SS (Coquimbo), ChThco_SS (Talcahuano coast), and ChChoc_SS (Puerto Montt) in Chile; and NZ_SS in New Zealand. All previous genetic studies conducted on T. murphyi have collected samples from the fall–winter season because accessibility is easier. Here, we included the spawning season of Chilean jack mackerel samples to enhance the robustness in delineating population genetic structure [14], as well as the feeding season, anticipating the mixing of individuals from different areas.

2.2. Laboratory Procedures

For all sampled individuals, we obtained a piece of muscular tissue that was preserved in 96% ethanol for subsequent analyses. The extraction and isolation of the total genomic DNA were carried out using a salting-out protocol as described by Jowett [16]. We assessed the quality and quantity of each DNA purification with an Eppendorf biophotometer® (Hamburg, Germany), diluting the template DNA to 20 ng/µL for further PCR amplification. We amplified ten microsatellite loci where three correspond to heterologous loci from Trachurus trachurus (Tt29, Tt62, and Tt133, [17]), and seven correspond to species-specific loci from T. murphyi (Tmur A101, Tmur A104, Tmur A115, Tmur B2, Tmur B6, TmurB104, and Tmur C4 [4]). The concentrations of reagents for PCR for the heterologous loci were as follows: 1.5 mM of MgCl2, 0.2 mM of dNTPs, 0.2 µM of each primer (the 3′ end of the forward primer included a dye), and 0.1 U/µL of Taq DNA polymerase (Invitrogen®, CAR, Burlington, ON, Canada). The thermocycler conditions were similar to those described in Kasapidis and Magoulas [17], except that we standardized the annealing temperature to 58 °C for all loci. For the species-specific loci, the concentrations of reagents for PCR and thermocycler conditions were conducted following Canales-Aguirre et al. [4]. All PCRs were conducted using a PTC-200 (MJ-Research®, Saint-Bruno-de-Montarville, QC, Canada) thermocycler, and we included both positive and negative controls. Amplicons were visualized with an ethidium-bromide-stained gel. A fragment analysis was conducted for PCR products on an ABI 3330 DNA sequencer, and we scored alleles using Peak ScannerTM software v1.0, with GS500 as the internal size standard.

2.3. Analysis Procedures
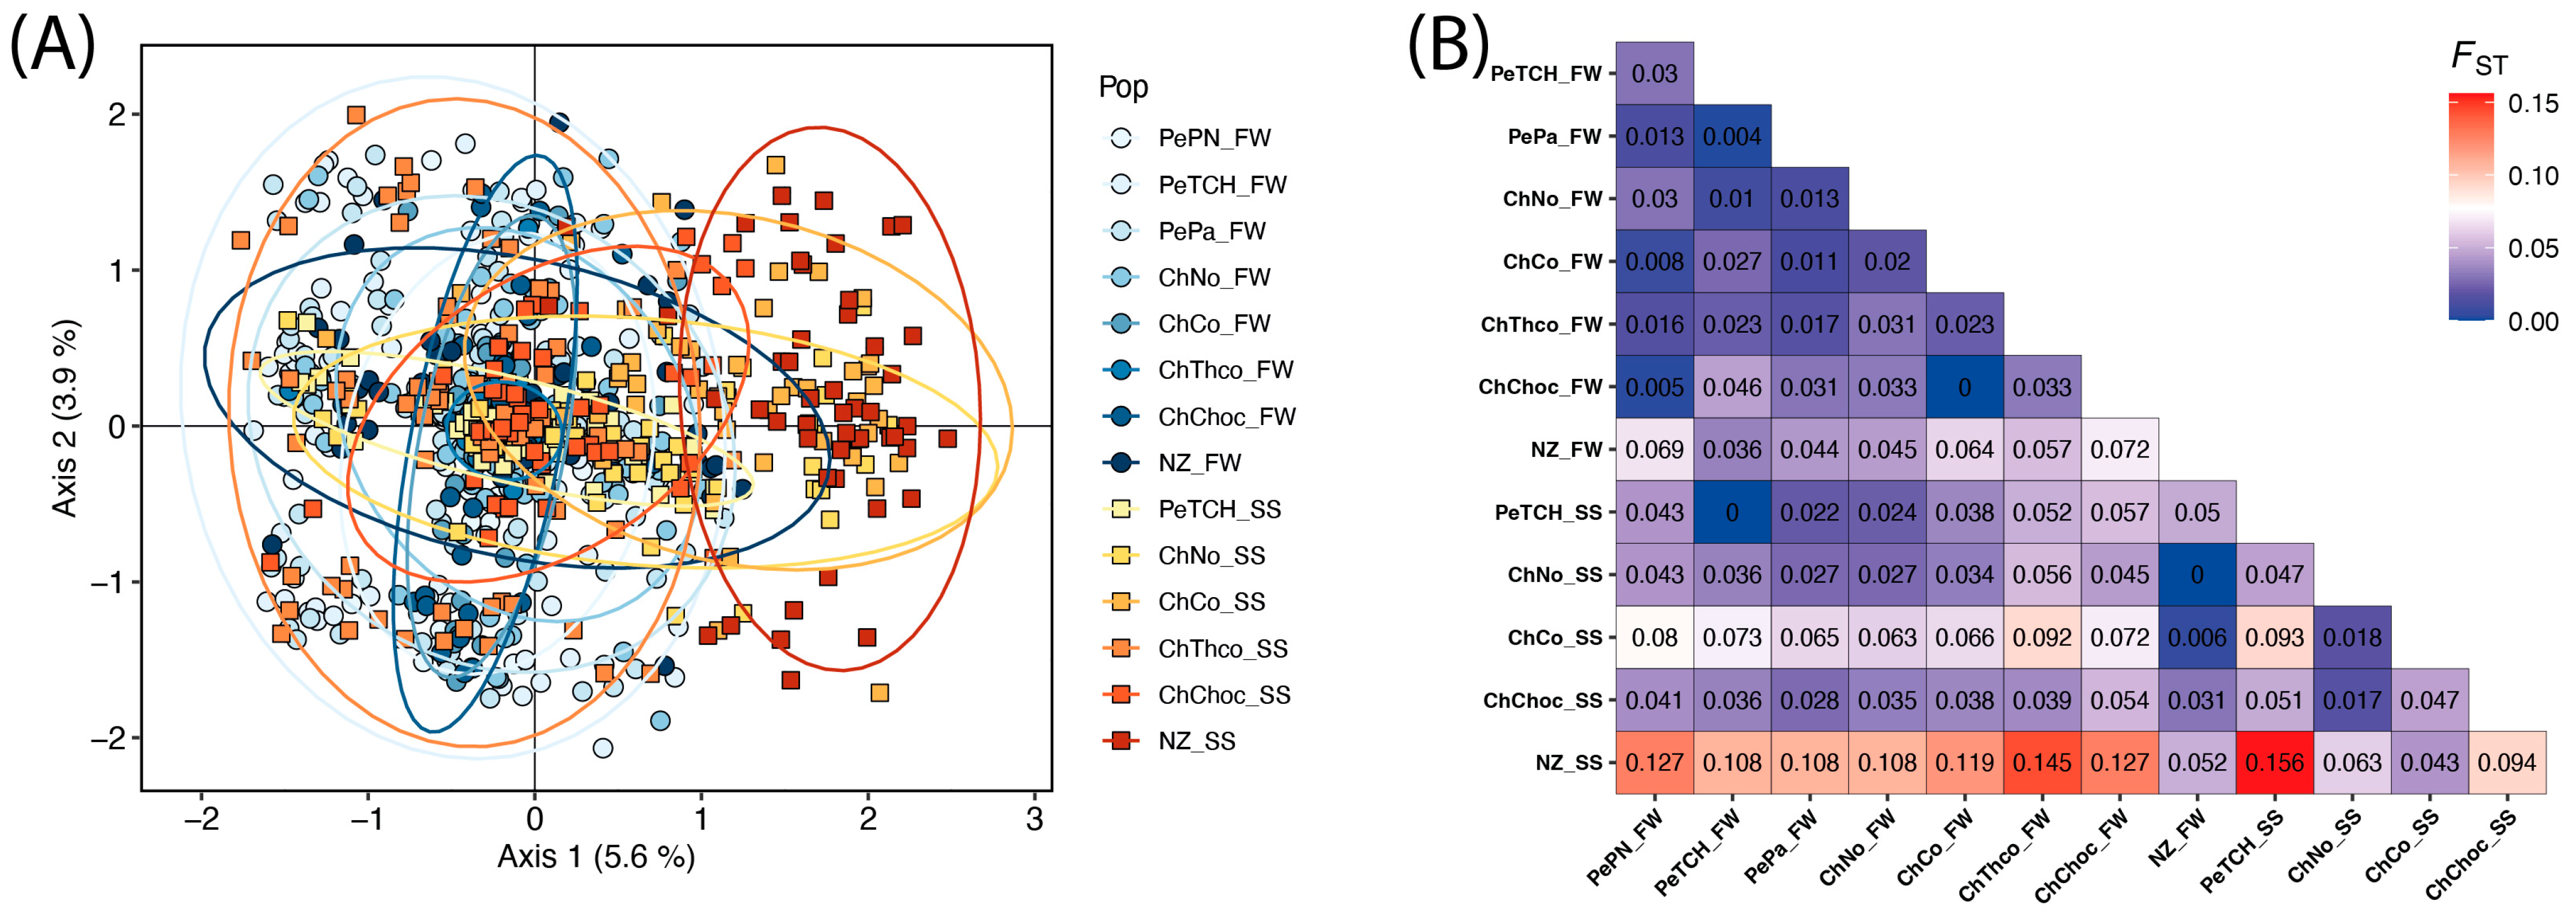
For summary statistics of genetic diversity, we calculated the total number of alleles (NA) and the expected (HE) and observed (HO) heterozygosity for each locus and area using GENALEX v6.5 software [18].
For testing spatial and temporal structure, we conducted a Principal Component Analysis (PCA), calculated the pairwise FST indices, and performed an analysis of molecular variance (AMOVA). PCA was used to reduce the multivariate microsatellite multilocus data and provide insights into the genetic diversity among the sampled individuals. All samples were included to visualize both the geographical and temporal patterns underlying seasonal variation. Pairwise FST indices were calculated following Weir and Cockerham [19] using the Stampp v1.3.6 R package [20], including all areas and seasons. The results were then visualized in a heatmap using the ggplot2 v3.5.1 R package [21]. The AMOVA was performed to test different hypotheses (spatial groupings) of population differentiation that were obtained through non-genetic approaches. The hypotheses tested were (a) panmixia (genetic homogeneity between areas); (b) two separate populations in the SPO as suggested by non-genetic approaches, e.g., [1,8,9]; and (c) three separate populations considering two in the Southeastern Pacific Ocean and one in the Southwestern Pacific Ocean (i.e., New Zealand). We also conducted an AMOVA to estimate if there is a temporal structure among seasons. For both the pairwise FST comparison and AMOVA, p-values were obtained after 10,000 bootstraps, and sequential Bonferroni correction [22] for multiple comparisons was applied when necessary.
Finally, we used all previously published genetic information to compare the expected heterozygosity estimated in this study and previous research, considering the sampling collection year and loci tested. We used results from Cárdenas et al. [5] and Ferrada Fuentes et al. [7], which used similar geographical areas and loci. The expected heterozygosity was used because it is less sensitive to sample size imbalance than observed heterozygosity [23].

3. Results

Analysis Procedures
The summary statistics varied depending on the season and area (Table 1). For the fall–winter season, NA ranged from 8.2 to 201, while for the spring–summer season, it ranged from 11.3 to 16.9 alleles by locus. Overall, NA in the spring–summer was larger than in the fall–winter season. The observed heterozygosity for the fall–winter season ranged from 0.572 to 0.764, while for the spring–summer season, it ranged from 0.529 to 0.74. The expected heterozygosity for the fall–winter season ranged from 0.701 to 0.839, while for the spring–summer season, it ranged from 0.633 to 0.832.
Overall, the PCA showed overlapping individuals from both geographical and temporal data, except for NZ_SS, where their dispersion is somewhat separated from the rest, but not for all (Figure 2A). The proportion of the variance explained by both axes was 9.5% (Axis 1 equal to 5.6 and Axis 2 equal to 3.9). Pairwise FST values were generally low (Figure 2B), with an overall average of 0.054. Within seasons, fall–winter showed an average FST of 0.029, while spring–summer showed a higher average of 0.077. The NZ_SS area showed pairwise FST values greater than 0.1 (ranging from 0.108 to 0.145) when compared to all fall–winter areas, except for NZ_FW (FST = 0.052). Compared to spring–summer areas, NZ_SS exhibited a particularly high value with PeCH_SS (FST = 0.156), the northernmost area.
The hierarchical analysis of molecular variance for several hypotheses did not show significant differences within each season (Table 2), and the FST and some FCT in the AMOVA were negative. When testing non-differentiation between the fall–winter and spring–summer seasons in the AMOVA, we obtained an FST = −0.01855 (p-value = 1).
The comparisons of the expected heterozygosity among studies showed qualitative differences according to the season in this study, the year of the sampling location, and the locus tested (Table 3). Among studies, loci that did not vary considerably (<0.1 magnitude) were TmurA104, TmurA115, TmurC4, and Tt62. The loci TmurB6, TmurA101, Tt29, and Tt133, which showed a qualitative decline in the HE during the spring–summer season from 2007 to 2012. Conversely, the HE qualitative decreases in the fall–winter season were for TmurB104 and TmurB2.

4. Discussion

Research on Trachurus murphyi populations in the South Pacific Ocean has mostly focused on fishery data from the non-reproductive season. Previous studies have revealed genetic homogeneity across this region, which agrees with our findings. Interestingly, we also noticed a consistent pattern in the fall–winter and spring–summer seasons. This could indicate a regular movement of individuals between feeding and spawning areas along the coast of the SPO, potentially leading to genetic structuring. More research is needed, especially regarding microsatellite loci, to fully understand this phenomenon. From 2007 to 2012, a noteworthy aspect was the identification of four loci with diminished levels of expected heterozygosity during the spring–summer season and two during the fall–winter season. However, due to the limited number of overlapping genetic markers across studies, these findings should be interpreted with caution. While these specific genetic markers may serve as effective indicators for monitoring changes in genetic diversity, the limited overlap in loci makes comparative analyses of genetic diversity indices challenging, thus limiting comprehensive historical insights into genetic changes over time. Finally, this research calls into question the idea that differences in time, such as spawning and feeding seasons, may result in distinct temporal population structures.
Our study has shown that there is an overall lack of spatial population structure both within each season (fall–winter and spring–summer) and between them (with the only exception being NZ_SS), with low pairwise FST values and AMOVA results (p < 0.05). This supports previous research that found that marine fish populations often have FST values below 0.01 [24]. These results are also consistent with studies conducted on T. murphyi in the same region, using different markers such as isozymes and RFLP-PCR [25], mitochondrial DNA [5], and heterologous and species-specific microsatellites [4,5,7]. In the SPO, these findings are not uncommon and have been previously observed in other species within the same region. Additionally, a similar trend of genetic similarity was noticed in other marine species distributed across this area, including Sprattus fuegensis, Genypterus blacodes, and Dissostichus eleginoides [26,27,28,29]. These findings suggest that geographical barriers may not significantly drive divergence within this particular region.
Marine fish species, such as T. murphyi, typically possess several characteristics that contribute to maintaining genetic similarity among populations. These include large numbers of individuals, a tendency to reproduce and develop in the open ocean, high reproductive rates, and the ability to migrate. These factors have been extensively studied and have been found to play a crucial role in minimizing genetic divergence among populations [1,30]. The population dynamics of T. murphyi are heavily influenced by factors such as population size and the formation of reproductive aggregations, which occur in the SPO, where the species is ubiquitously found. These aggregations are known to occur throughout the species’ entire range [31], indicating that the species is highly abundant and displays extensive migratory behaviors. Additionally, current research has revealed that T. murphyi prefers to inhabit areas with specific temperature ranges between 15 and 18 °C [6]. Different intensities of El Niño events strongly impact the habitat patterns of commercially valuable species off the Chilean coast, altering suitable areas and distribution [32]. This could potentially lead to genetic mixing across the entire geographic range of the species. Overall, our research shows no genetic differentiation in T. murphyi over space and time throughout its distribution. Despite considerable distances between sample locations, the ability of a small number of individuals to migrate and successfully reproduce is enough to maintain genetic homogeneity within the population. Furthermore, similar results were found in T. murphyi relatives, T. japonicus [33] and T. trecae [34]. In T. japonicus, SNP markers showed no genetic differentiation around the Japanese archipelago [33], while T. trecae, using microsatellites, also lacked differentiation between temporal sample collections [34].
Upon analysis, the ten loci examined displayed polymorphism throughout their geographical range. When comparing the mean summary statistics of genetic diversity to those reported by DeWoody and Avise [35] for marine fish, we noted that the number of alleles for fall–winter (NA = 13.8) and spring–summer (NA = 14.9) samples fell below the average (NA = 20.4). Similarly, the observed averages for heterozygosity in fall–winter (0.672) and spring–summer (0.646) were lower than the averages reported for other marine species (HO = 0.790), indicating lower levels of genetic diversity in our study. The results of our study on T. murphyi have shown varying outcomes compared to previous research. While our estimation of expected heterozygosity (HE) using the same heterologous loci was generally low in the spring–summer season (two out of three loci) and showed no distinct pattern in the fall–winter season (one out of three loci), it is important to acknowledge the limited number of shared heterologous loci available for comparison [5]. Furthermore, upon examining the findings of Ferrada Fuentes et al. [7], we discovered that over 60% of the loci displayed low HE in both seasons, with five out of six comparisons exhibiting lower values in the spring–summer season and four out of six in the fall–winter season. This highlights the need for caution in drawing definitive conclusions, given the scarcity of shared heterologous or specific loci for accurate comparison.
Our research uncovered fluctuations in expected heterozygosity at specific loci over time. Notably, expected heterozygosity, determined by allele frequencies, is more reliable than observed heterozygosity regarding sample size bias. This is because observed heterozygosity relies on the genotypes of individual samples [23]. Previous studies on the population genetics of T. murphyi have mostly relied on data collected during a single season. This has left gaps in our understanding of temporal population trends, especially during reproductive and non-reproductive phases. The motivation for this method stems from the idea that migration to certain reproductive areas could result in greater variety and changes in genetic diversity between seasons. Waples [15] proposes that sampling during the reproductive season is ideal for understanding population genetic patterns and reducing bias from related individuals [15,36]. While a meta-analysis of previous databases was not conducted, examining the expected heterozygosity over time offered valuable insight. Focusing on the fall–winter and spring–summer seasons provided a unique outlook on temporal diversity within a given year. Although variations in expected heterozygosity in certain loci from 2007 to 2012 indicated their potential for monitoring genetic diversity, overall differences were not significant enough to suggest a temporal population structure. However, some loci, such as TmurB6, did exhibit qualitative variation across both seasons.
Although this study’s results are consistent with prior research, it is crucial to consider certain limitations. The exclusive use of samples from active fishery vessels introduces potential variations in sampling locations, resulting in the need for wider geographical ranges rather than precise sites. As a result, certain regions in Peru were inaccessible for sampling, which could affect comparisons. Additionally, previous studies on T. murphyi have used partially overlapping loci in their microsatellite analyses, making direct comparisons of expected heterozygosity challenging.
Despite these limitations, this study incorporated data from three distinct years (2007–2012), supporting the temporal reliability of the results. However, we acknowledge that the temporal sampling is limited to a short period (2011–2012; fall–winter and spring–summer seasons), which may not capture slower genetic processes or important interannual changes for population trends. We believe a broader temporal scope is necessary to understand long-term genetic changes. Therefore, we suggest future studies include long-term monitoring to validate the genetic homogeneity detected in our study and further explore genetic changes over time.
The FST values raise concerns due to unequal sample sizes, highlighting potential issues with sample representativeness. Our data sets ranged from 38 to 135 for the fall–winter samples and from 48 to 72 for the spring–summer samples. We recognize that this bias could affect the robustness of genetic structure estimates (FST and AMOVA), but the bootstrapping procedure (i.e., 10,000 replicates) provides confidence in the results shown here. Some FST values were negative, which is common and reported as FST = 0, indicating greater genetic variation within populations than between them [19]. Negative FST values are statistically expected under panmixia, as they reflect stochastic noise when within-population diversity exceeds total diversity [19,37,38]. In our case, this supports the conclusion of genetic homogeneity in T. murphyi across areas, seasons, and years, suggesting a stable, undifferentiated population. AMOVA-based FCT/FST estimates can fluctuate due to limited sampling (e.g., few loci or individuals), but permutation tests in ARLEQUIN confirmed non-significance (p > 0.05), reinforcing that these values represent biological homogeneity rather than technical artifacts. Similar patterns are common in species with high gene flow or recent colonization histories [39]. Therefore, further sampling efforts may be necessary to ensure balanced sample sizes. However, the consistency of negative/zero FST values across temporal and spatial comparisons strongly supports our hypothesis of a panmictic population. Finally, we acknowledge that our conclusions heavily rely on the quantity of data and methods used. Although more sophisticated analysis might reveal some additional genetically organized data, we believe any recognized pattern would be minimal compared to the main conclusions we have reached.
To gain a comprehensive understanding of genetic differences, future analyses must prioritize the utilization of single-nucleotide polymorphisms (SNPs) obtained through reduced-representation sequencing techniques [40], such as RADseq, ddRAD, or DARTseq [41,42,43]. These methods have demonstrated their effectiveness in distinguishing genetic variations, particularly in species with relatively shallow genetic structures and high rates of gene flow, even on a small geographical scale [44]. These advanced techniques allow researchers to explore hypotheses surrounding neutral and adaptive genetic variation. For instance, studying neutral loci may uncover patterns of isolation by distance, e.g., [45], a particularly relevant consideration given the expansive range of T. murphyi throughout the Southeastern Pacific Ocean and Southwestern Pacific Ocean (~10,000 km). Adaptive loci could offer valuable insights into genetic differentiation linked to local adaptation in the species’ most extreme distribution areas. In addition, analyzing the entire genome over multiple years of data collection could further reinforce and validate the conclusions drawn from this study.

5. Conclusions

Our research supports the concept that T. murphyi maintains a stable, homogeneous genetic structure across all its inhabited areas, with no temporal differentiation observed. By analyzing specimens collected during both mating and non-mating seasons over multiple years in consistent settings, we have addressed a crucial gap in the current literature regarding temporal genetic variation. Additionally, the loci with reduced heterozygosity identified in this study could serve as valuable indicators for monitoring changes in genetic variability, particularly under scenarios of climate change or fishing pressure.

Author Contributions

Conceptualization, R.G., S.F.F. and C.B.C.-A.; methodology, S.F.F. and C.B.C.-A.; formal analysis, C.B.C.-A. and S.F.F.; data curation, S.F.F. and C.B.C.-A.; writing—original draft preparation, C.B.C.-A.; writing—review and editing, S.F.F., R.G. and C.B.C.-A.; visualization, C.B.C.-A.; project administration, R.G. and S.F.F.; funding acquisition, R.G. All authors have read and agreed to the published version of the manuscript.

Funding

This research was funded by Fondo de Investigación Pesquera y Acuicultura, grant number FIPA 2010-18, from the Chilean Government, and the APC was funded by the Universidad de Los Lagos.

Institutional Review Board Statement

No test animals were used during this research. The tissue samples used in our subsequent analyses were collected by observers aboard commercial fishing vessels for the Chilean jack mackerel fishery.

Informed Consent Statement

Not applicable.

Data Availability Statement

The data presented in this study are available at https://github.com/Canales-AguirreCB/Canales-Aguirre_etal_2025_Biology (accessed on 10 March 2025).

Acknowledgments

We extend our gratitude to the scientific observers from Instituto de Fomento Pesquero (IFOP) in Chile, Instituto del Mar del Perú (IMARPE) in Perú, and the Ministry for Primary Industries in New Zealand, facilitated by the National Institute of Water and Atmospheric Research (NIWA), for their invaluable assistance in collecting the Chilean jack mackerel samples. Additionally, we thank Mariam Dib and Andrea Barrera for their invaluable contributions to the laboratory procedures.

Conflicts of Interest

The authors declare no conflicts of interest. The funders had no role in the design of the study; in the collection, analyses, or interpretation of the data; in the writing of the manuscript, or in the decision to publish the results.

Abbreviations

The following abbreviations are used in this manuscript:
SPOSouth Pacific Ocean
PCRPolymerase Chain Reaction
DNADeoxyribonucleic Acid
AMOVAAnalysis of Molecular Variance

References

  1. Serra, R. Important Life History Aspects of the Chilean Jack Mackerel, Trachurus symmetricus murphyi. Investig. Pesq. 1991, 36, 67–83. [Google Scholar]
  2. Bailey, K. Description and Surface Distribution of Juvenile Peruvian Jack Mackerel, Trachurus murphyi, Nichols from the Subtropical Convergence Zone of Central South Pacific. Fish. Bull. 1989, 87, 273–278. [Google Scholar]
  3. Evseenko, S. On the Reproduction of the Peruvian Jack Mackerel, Trachurus symmetricus murphyi (Nichols), in the Southern Part of the Pacific Ocean. Vopr. Ikhtiologii 1987, 27, 264–273. [Google Scholar]
  4. Canales-Aguirre, C.B.; Ferrada, S.; Galleguillos, R. Isolation and Characterization of Microsatellite Loci for the Jack Mackerel (Trachurus murphyi Nichols, 1920). Conserv. Genet. 2010, 11, 1235–1237. [Google Scholar] [CrossRef]
  5. Cárdenas, L.; Silva, A.X.; Magoulas, A.; Cabezas, J.; Poulin, E.; Ojeda, F.P. Genetic Population Structure in the Chilean Jack Mackerel, Trachurus murphyi (Nichols) across the South-Eastern Pacific Ocean. Fish. Res. 2009, 100, 109–115. [Google Scholar] [CrossRef]
  6. Cubillos, L.A.; Paramo, J.; Ruiz, P.; Núñez, S.; Sepúlveda, A. The Spatial Structure of the Oceanic Spawning of Jack Mackerel (Trachurus murphyi) off Central Chile (1998–2001). Fish. Res. 2008, 90, 261–270. [Google Scholar] [CrossRef]
  7. Ferrada Fuentes, S.; Galleguillos, R.; Herrera-Yáñez, V.; Canales-Aguirre, C.B. Population Genetics of Chilean Jack Mackerel, Trachurus murphyi Nichols, 1920, (Pisces, Carangidae), in Waters of the South Pacific Ocean. Fishes 2023, 8, 162. [Google Scholar] [CrossRef]
  8. George-Nascimento, M. Geographical Variations in the Jack Mackerel Trachurus symmetricus murphyi Populations in the Southeastern Pacific Ocean as Evidenced from the Associated Parasite Communities. J. Parasitol. 2000, 86, 929–932. [Google Scholar] [CrossRef]
  9. Hernández, A.; Sepúlveda, A.; Miranda, L. Morfometría y Merística Del Jurel (Trachurus symmetricus murphyi) a Lo Largo de Chile. In Biologίa y Ecologίa del Jurel en Aguas Chilenas, 1st ed.; Arcos, D., Ed.; Instituto de Investigación Pesquera: Talcahuano, Chile, 1998; pp. 47–63. [Google Scholar]
  10. Horn, P.L.; Ó Maolagáin, C. The Growth and Age Structure of Chilean Jack Mackerel (Trachurus murphyi) Following Its Influx to New Zealand Waters. J. Fish Biol. 2021, 98, 1144–1154. [Google Scholar] [CrossRef]
  11. Oliva, M. Metazoan Parasites of the Jack Mackerel Trachurus murphyi (Teleostei, Carangidae) in a Latitudinal Gradient from South America (Chile and Peru). Parasite 1999, 6, 223–230. [Google Scholar] [CrossRef]
  12. Taylor, P. Stock Structure and Population Biology of the Peruvian Jack Mackerel, Trachurus symmetricus murphyi; National Institute of Water and Atmospheric Research: Auckland, New Zealand, 2002; p. 21. ISSN 1175-1584. [Google Scholar]
  13. Vásquez, S.; Correa-Ramírez, M.; Parada, C.; Sepúlveda, A. The Influence of Oceanographic Processes on Jack Mackerel (Trachurus murphyi) Larval Distribution and Population Structure in the Southeastern Pacific Ocean. ICES J. Mar. Sci. 2013, 70, 1097–1107. [Google Scholar] [CrossRef]
  14. Glover, K.A.; Skaala, Ø.; Limborg, M.; Kvamme, C.; Torstensen, E. Microsatellite DNA Reveals Population Genetic Differentiation among Sprat (Sprattus sprattus) Sampled throughout the Northeast Atlantic, Including Norwegian Fjords. ICES J. Mar. Sci. 2011, 68, 2145–2151. [Google Scholar] [CrossRef]
  15. Waples, R. Separating the Wheat from the Chaff: Patterns of Genetic Differentiation in High Gene Flow Species. J. Hered. 1998, 89, 438–450. [Google Scholar] [CrossRef]
  16. Jowett, T. Preparation of Nucleic Acids. In Drosophila: A Practical Approach; IRL Press: Oxford, UK, 1986; pp. 275–286. [Google Scholar]
  17. Kasapidis, P.; Magoulas, A. Development and Application of Microsatellite Markers to Address the Population Structure of the Horse Mackerel Trachurus trachurus. Fish. Res. 2008, 89, 132–135. [Google Scholar] [CrossRef]
  18. Peakall, R.; Smouse, P.E. GenAlEx 6.5: Genetic Analysis in Excel. Population Genetic Software for Teaching and Research—An Update. Bioinformatics 2012, 28, 2537–2539. [Google Scholar] [CrossRef] [PubMed]
  19. Weir, B.S.; Cockerham, C.C. Estimating F-Statistics for the Analysis of Population Structure. Evolution 1984, 38, 1358–1370. [Google Scholar] [CrossRef]
  20. Pembleton, L.W.; Cogan, N.O.I.; Forster, J.W. StAMPP: An R Package for Calculation of Genetic Differentiation and Structure of Mixed-Ploidy Level Populations. Mol. Ecol. Resour. 2013, 13, 946–952. [Google Scholar] [CrossRef]
  21. Wickham, H. Ggplot2: Elegant Graphics for Data Analysis; Springer: Cham, Switzerland, 2016; ISBN 978-3-319-24277-4. [Google Scholar]
  22. Rice, W.R. Analyzing Tables of Statistical Test. Evolution 1989, 43, 223–225. [Google Scholar] [CrossRef]
  23. Ritland, K. Estimators for Pairwise Relatedness and Individual Inbreeding Coefficients. Genet. Res. 1996, 67, 175–185. [Google Scholar] [CrossRef]
  24. Ward, R.D.; Woodwark, M.; Skibinski, D.O.F. A Comparison of Genetic Diversity Levels in Marine, Freshwater, and Anadromous Fishes. J. Fish Biol. 1994, 44, 213–232. [Google Scholar] [CrossRef]
  25. Sepúlveda, A.; Cubillos, L.; Grechina, A.; Peña, H.; Vilugron, L.; Hernández, A.; Miranda, L.; Sobarzo, P.; Serra, R.; Braun, M.; et al. Migración de Jurel Desde y Hacia La ZEE de Chile Central; Informes Técnicos; FIP/IT No96-15; FIP: Valparaiso, Chile, 1996; p. 273. [Google Scholar]
  26. Canales-Aguirre, C.B.; Ferrada-Fuentes, S.; Galleguillos, R.; Hernández, C.E. Genetic Structure in a Small Pelagic Fish Coincides with a Marine Protected Area: Seascape Genetics in Patagonian Fjords. PLoS ONE 2016, 11, e0160670. [Google Scholar] [CrossRef] [PubMed]
  27. Canales-Aguirre, C.B.; Ferrada, S.; Hernandez, C.E.; Galleguillos, R. Population Structure and Demographic History of Genypterus blacodes Using Microsatellite Loci. Fish. Res. 2010, 106, 102–106. [Google Scholar] [CrossRef]
  28. Canales-Aguirre, C.B.; Ferrada-Fuentes, S.; Galleguillos, R.; Oyarzun, F.X.; Hernández, C.E. Population Genetic Structure of Patagonian Toothfish (Dissostichus eleginoides) in the Southeast Pacific and Southwest Atlantic Ocean. PeerJ 2018, 6, e4173. [Google Scholar] [CrossRef]
  29. Canales-Aguirre, C.B.; Ferrada-Fuentes, S.; Galleguillos, R.; Oyarzun, F.X.; Buratti, C.C.; Hernández, C.E. High Genetic Diversity and Low-Population Differentiation in the Patagonian Sprat (Sprattus fuegensis) Based on Mitochondrial DNA. Mitochondrial DNA Part DNA Mapp. Seq. Anal. 2018, 29, 1148–1155. [Google Scholar] [CrossRef] [PubMed]
  30. Wirgin, I.I.; Waldman, J.R. Use of Nuclear DNA in Stock Identification: Single-Copy and Repetitive Sequence Markers; Elsevier: Amsterdam, The Netherlands, 2005. [Google Scholar]
  31. Gorbunova, N.; Evseenko, S.; Garetovsky, S. Distribution of Ichthyoplankton in the Frontal Zones of the Peruvian Waters. J. Ichthyol. 1985, 25, 67–79. [Google Scholar]
  32. Feng, Z.; Yu, W.; Zhang, Y.; Li, Y.; Chen, X. Habitat Variations of Two Commercially Valuable Species Along the Chilean Waters Under Different-Intensity El Niño Events. Front. Mar. Sci. 2022, 9, 919620. [Google Scholar] [CrossRef]
  33. Hirao, A.S.; Imoto, J.; Fujiwara, A.; Watanabe, C.; Yoda, M.; Matsuura, A.; Akita, T. Genome-Wide SNP Analysis Coupled with Geographic and Reproductive-Phenological Information Reveals Panmixia in a Classical Marine Species, the Japanese Jack Mackerel (Trachurus japonicus). Fish. Res. 2024, 279, 107146. [Google Scholar] [CrossRef]
  34. Mota, K.G.; Perazza, C.A.; Velho, F.V.; Sardinha, M.d.L.; Morais, L.; Vaini, J.O.; Hallerman, E.; Hilsdorf, A.W.S. Population Genetic Diversity of Cunene Horse Mackerel Trachurus trecae on the Angolan Coast: Implications for Management and Conservation. Fish. Res. 2024, 277, 107069. [Google Scholar] [CrossRef]
  35. DeWoody, J.A.; Avise, J.C. Microsatellite Variation in Marine, Freshwater and Anadromous Fishes Compared with Other Animals. J. Fish Biol. 2000, 56, 461–473. [Google Scholar] [CrossRef]
  36. Allendorf, F.W.; Phelps, S.R. Use of Allelic Frequencies to Describe Population Structure. Can. J. Fish. Aquat. Sci. 1981, 38, 1507–1514. [Google Scholar] [CrossRef]
  37. Meirmans, P.G.; Hedrick, P.W. Assessing Population Structure: FST and Related Measures. Mol. Ecol. Resour. 2011, 11, 5–18. [Google Scholar] [CrossRef] [PubMed]
  38. Gerlach, G.; Jueterbock, A.; Kraemer, P.; Deppermann, J.; Harmand, P. Calculations of Population Differentiation Based on GST and D: Forget GST but Not All of Statistics! Mol. Ecol. 2010, 19, 3845–3852. [Google Scholar] [CrossRef] [PubMed]
  39. Whitlock, M.C. G’ST and D Do Not Replace FST. Mol. Ecol. 2011, 20, 1083–1091. [Google Scholar] [CrossRef]
  40. Campbell, E.O.; Brunet, B.M.T.; Dupuis, J.R.; Sperling, F.A.H. Would an RRS by Any Other Name Sound as RAD? Methods Ecol. Evol. 2018, 9, 1920–1927. [Google Scholar] [CrossRef]
  41. Kilian, A.; Wenzl, P.; Huttner, E.; Carling, J.; Xia, L.; Blois, H.; Caig, V.; Heller-Uszynska, K.; Jaccoud, D.; Hopper, C.; et al. Diversity Arrays Technology: A Generic Genome Profiling Technology on Open Platforms. In Data Production and Analysis in Population Genomics: Methods and Protocols; Pompanon, F., Bonin, A., Eds.; Methods in Molecular Biology; Humana Press: Totowa, NJ, USA, 2012; pp. 67–89. ISBN 978-1-61779-870-2. [Google Scholar]
  42. Miller, M.R.; Dunham, J.P.; Amores, A.; Cresko, W.A.; Johnson, E.A. Rapid and Cost-Effective Polymorphism Identification and Genotyping Using Restriction Site Associated DNA (RAD) Markers. Genome Res. 2007, 17, 240–248. [Google Scholar] [CrossRef] [PubMed]
  43. Peterson, B.K.; Weber, J.N.; Kay, E.H.; Fisher, H.S.; Hoekstra, H.E. Double Digest RADseq: An Inexpensive Method for de Novo SNP Discovery and Genotyping in Model and Non-Model Species. PLoS ONE 2012, 7, e37135. [Google Scholar] [CrossRef] [PubMed]
  44. Canales-Aguirre, C.B.; Larson, W.A.; McKinney, G.J.; Claure, C.E.; Rocha, J.D.; Ceballos, S.G.; Cádiz, M.I.; Yáñez, J.M.; Gomez-Uchida, D. Neutral and Adaptive Loci Reveal Fine-Scale Population Structure in Eleginops maclovinus from North Patagonia. Ecol. Evol. 2022, 12, e9343. [Google Scholar] [CrossRef]
  45. Drinan, D.P.; Gruenthal, K.M.; Canino, M.F.; Lowry, D.; Fisher, M.C.; Hauser, L. Population Assignment and Local Adaptation along an Isolation-by-Distance Gradient in Pacific Cod (Gadus macrocephalus). Evol. Appl. 2018, 11, 1448–1464. [Google Scholar] [CrossRef]
Figure 1. Sampling locations within areas in fall–winter (black dots) and spring–summer (white squares) for Trachurus murphyi. Locations from Peru have names starting with “Pe” while those from Chile start with “Ch”.
Biology 14 00510 g001
Figure 2. Genetic structure of sampled populations for Trachurus murphyi. (A) Principal Component Analysis (PCA) of multilocus microsatellite data showing genetic variation among individuals across different areas and seasons. Each point represents an individual, colored according to its geographic area, with different shapes indicating seasonal sampling: cold-colored circles for fall–winter (FW) and warm-colored squares for spring–summer (SS). Ellipses represent the 95% confidence interval for each area, highlighting the dispersion and potential genetic clustering of groups. The PCA axes indicate the percentage of total genetic variation explained. (B) Pairwise FST matrix quantifying genetic differentiation among sampled areas. The heatmap, generated using the ggplot2 R package, represents FST values, where darker shades of red indicate higher genetic differentiation, and blue shades indicate lower differentiation.
Biology 14 00510 g002
Table 1. Mean summary statistics of genetic diversity by area for fall–winter and spring–summer seasons inferred for Trachurus murphyi.
Fall–Winter SeasonSpring–Summer Season
AreaNNAHOHENNAHOHE
PePN4012.10.680.751----
PeTCH10116.60.6970.8244811.30.5290.633
PePa13520.10.7640.839----
ChNo9615.70.730.8254816.30.740.818
ChCo3811.60.6150.7754815.20.6580.77
ChThco408.20.5720.7017215.30.6370.739
ChChoc4013.60.7030.7644816.90.7230.832
NZ4812.40.6120.7285014.60.5910.689
Average 13.80.6720.776 14.90.6460.747
N, number of individuals; NA, average of the number of alleles per locus; HO, average of the observed heterozygosity; HE, average of the expected heterozygosity; -, no data for that area.
Table 2. Hierarchical analysis of molecular variance (AMOVA) to test for spatial variation by areas 1 in fall–winter and spring–summer inferred for Trachurus murphyi.
Fall–Winter SeasonSpring–Summer Season
Nº GroupsAggrupationFSTp-ValueFCTp-ValueFSTp-ValueFCTp-Value
ThreePeru v/s Chile v/s NZ−0.103100.689−0.00710.050.133
TwoPeru + ChNo v/s Chile−0.141−0.0740.973−0.0311−0.0050.604
OnePanmixis−0.1031--−0.0301--
1 Peru includes PePN, PeTCH, and PePa; Chile includes ChNo, ChCo, ChThco, and ChChoc. NZ is New Zealand. Peru + ChNo includes all areas in Peru and only the north of Chile (i.e., ChNo).
Table 3. Expected heterozygosity comparisons for this study and previous research, considering the sampling collection year and loci tested.
Expected Heterozygosity
Season/Previous StudiesYearTmurB6TmurA104TmurA115TmurC4TmurA101TmurB104TmurB2Tt29Tt62Tt133
Ferrada Fuentes et al. [7]2007-0.9430.95-0.927--0.7470.8550.861
Cárdenas et al. [5]2009-------0.760.830.87
Fall–Winter20110.7820.930.9160.820.8710.5210.5520.7580.8510.758
Spring–Summer2011–20120.4440.9420.9450.8190.7790.6480.7040.6340.8650.687
Disclaimer/Publisher’s Note: The statements, opinions and data contained in all publications are solely those of the individual author(s) and contributor(s) and not of MDPI and/or the editor(s). MDPI and/or the editor(s) disclaim responsibility for any injury to people or property resulting from any ideas, methods, instructions or products referred to in the content.

