
Fishing for Florida Bass in West Virginia: Genomic Evaluation of Florida Bass Presence and Establishing Baselines of Genetic Structure and Diversity for Native Largemouth Bass


Simple Summary
Abstract
1. Introduction
2. Materials and Methods
2.1. Sample Collection
2.2. GT-Seq Laboratory Methods
2.3. ddRAD-Seq Genotype-by-Sequencing Laboratory Methods
2.4. GT-Seq Analysis
2.5. ddRAD-Seq Genotype-by-Sequencing Analysis
2.6. Population Structuring and Genomic Diversity Analysis
3. Results
3.1. Dataset Generation
3.2. GT-Seq Ancestry Results
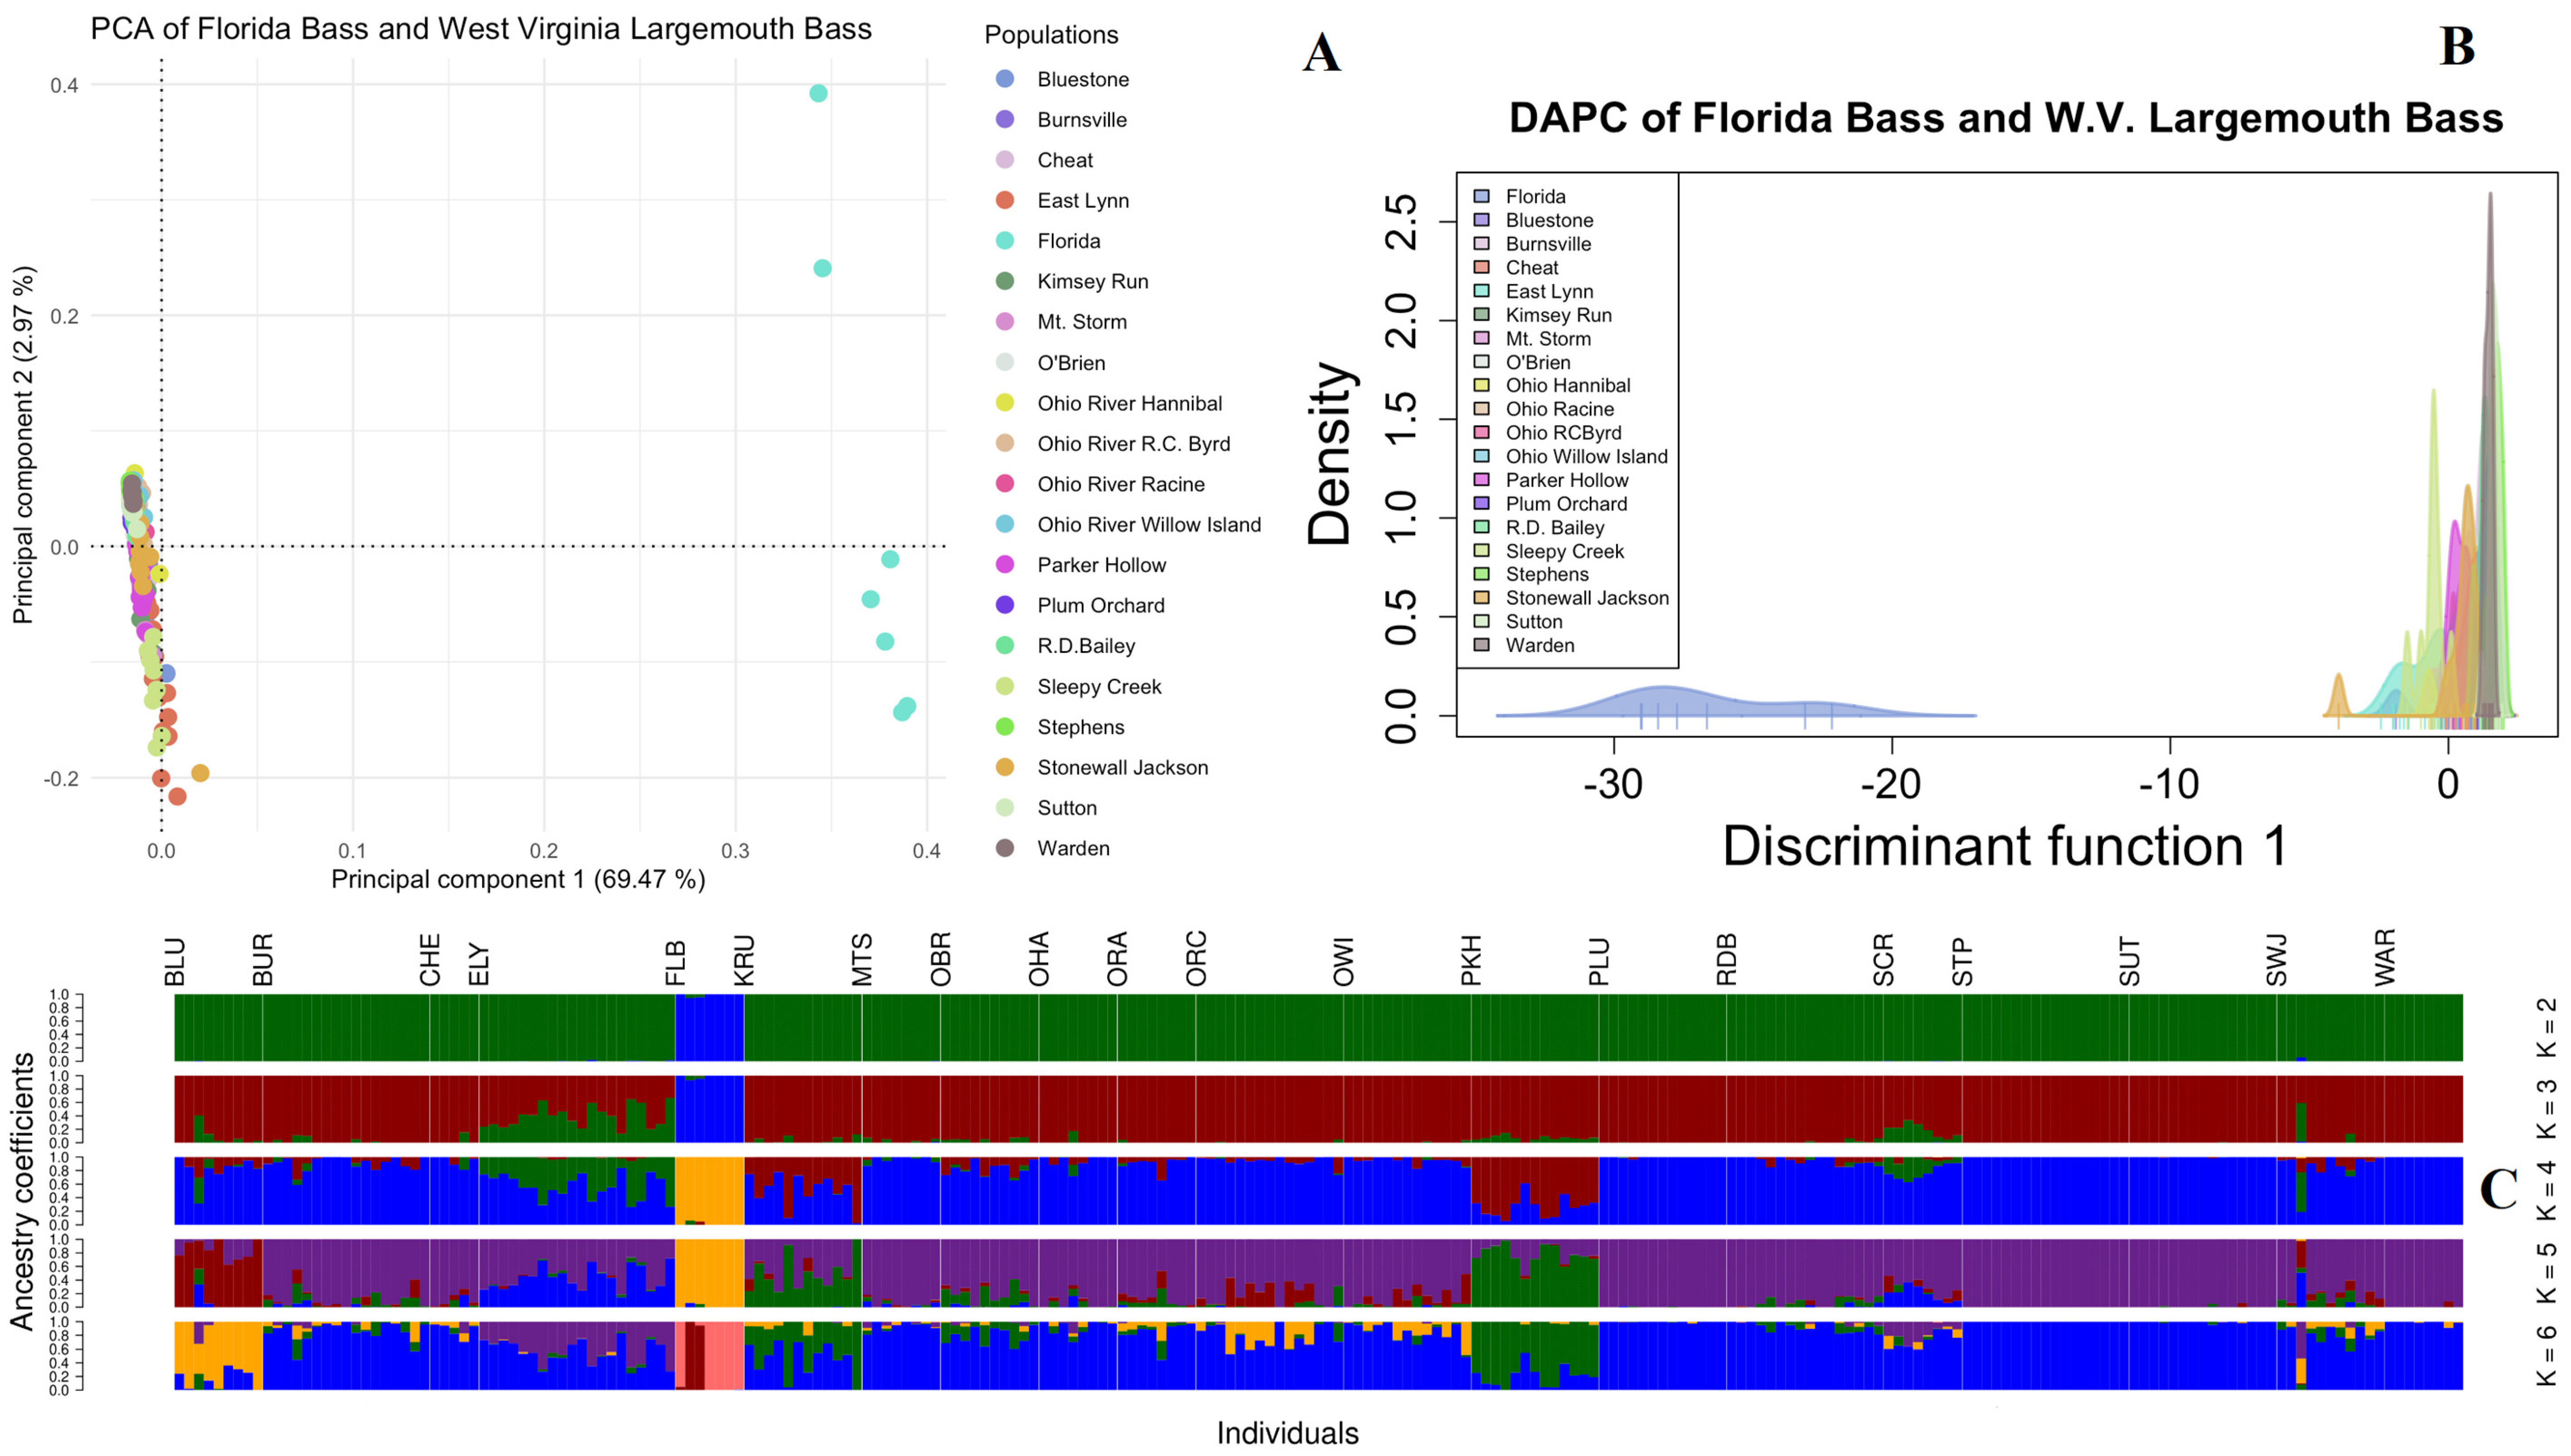
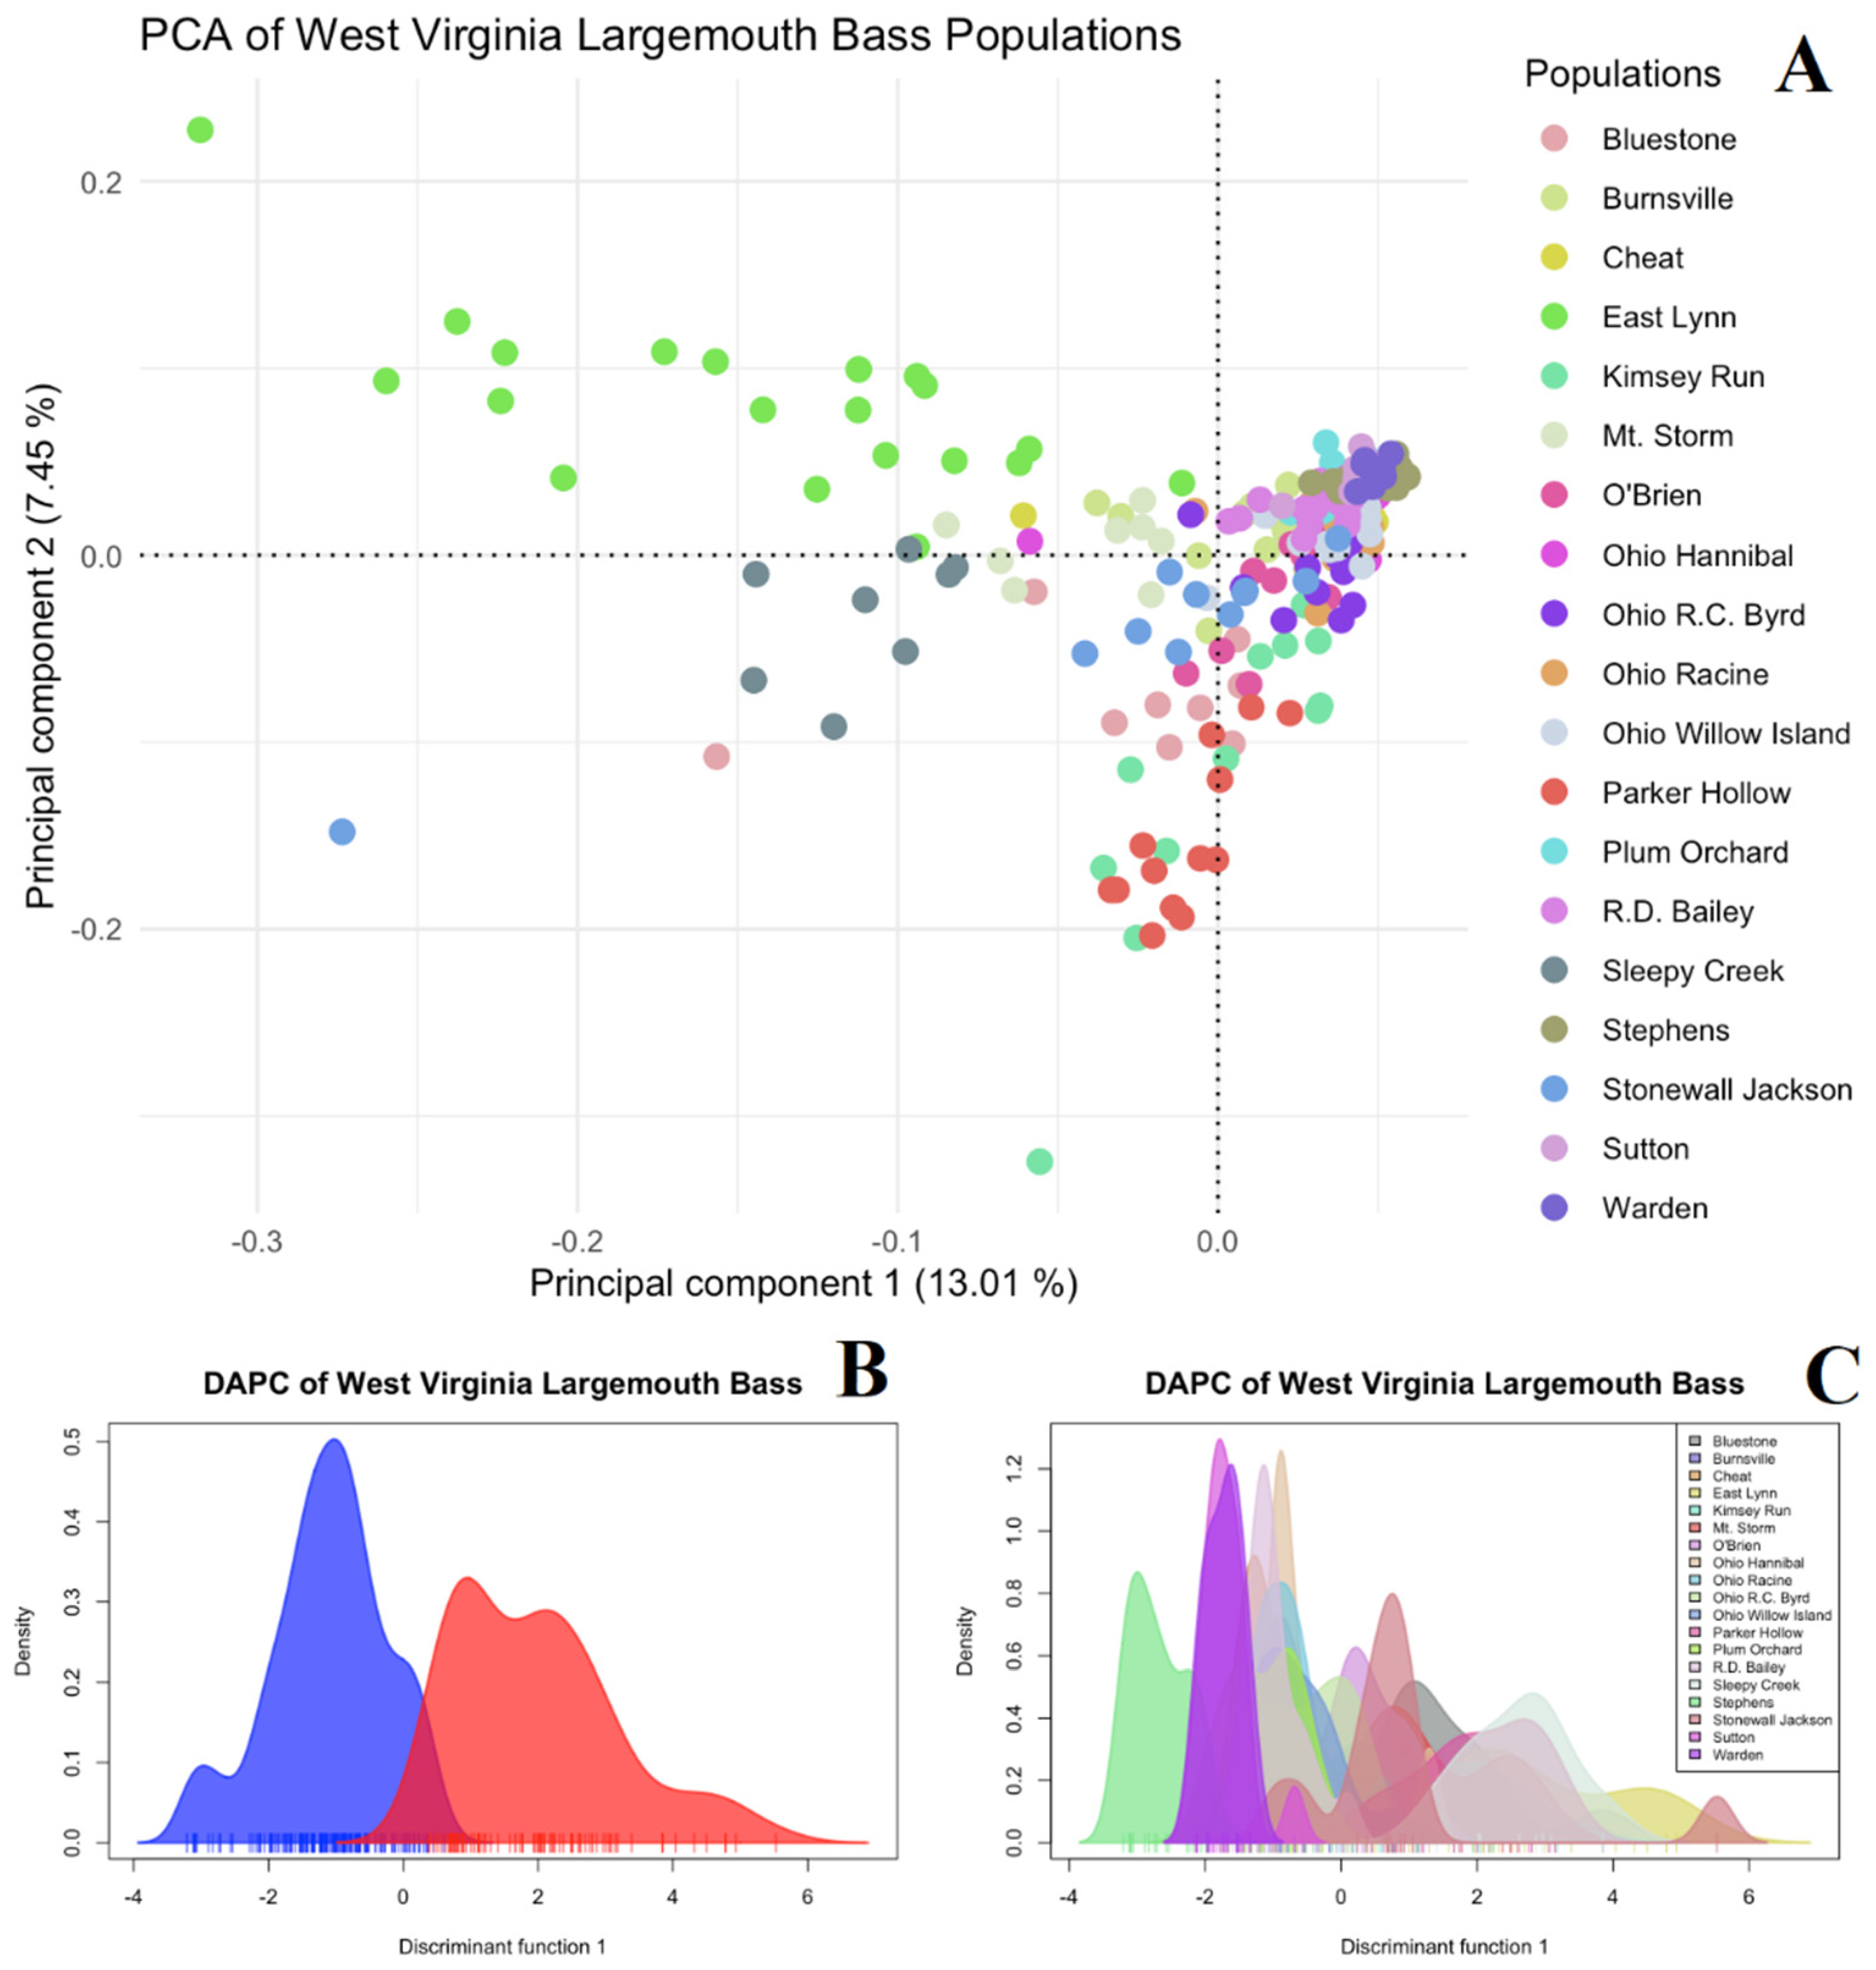
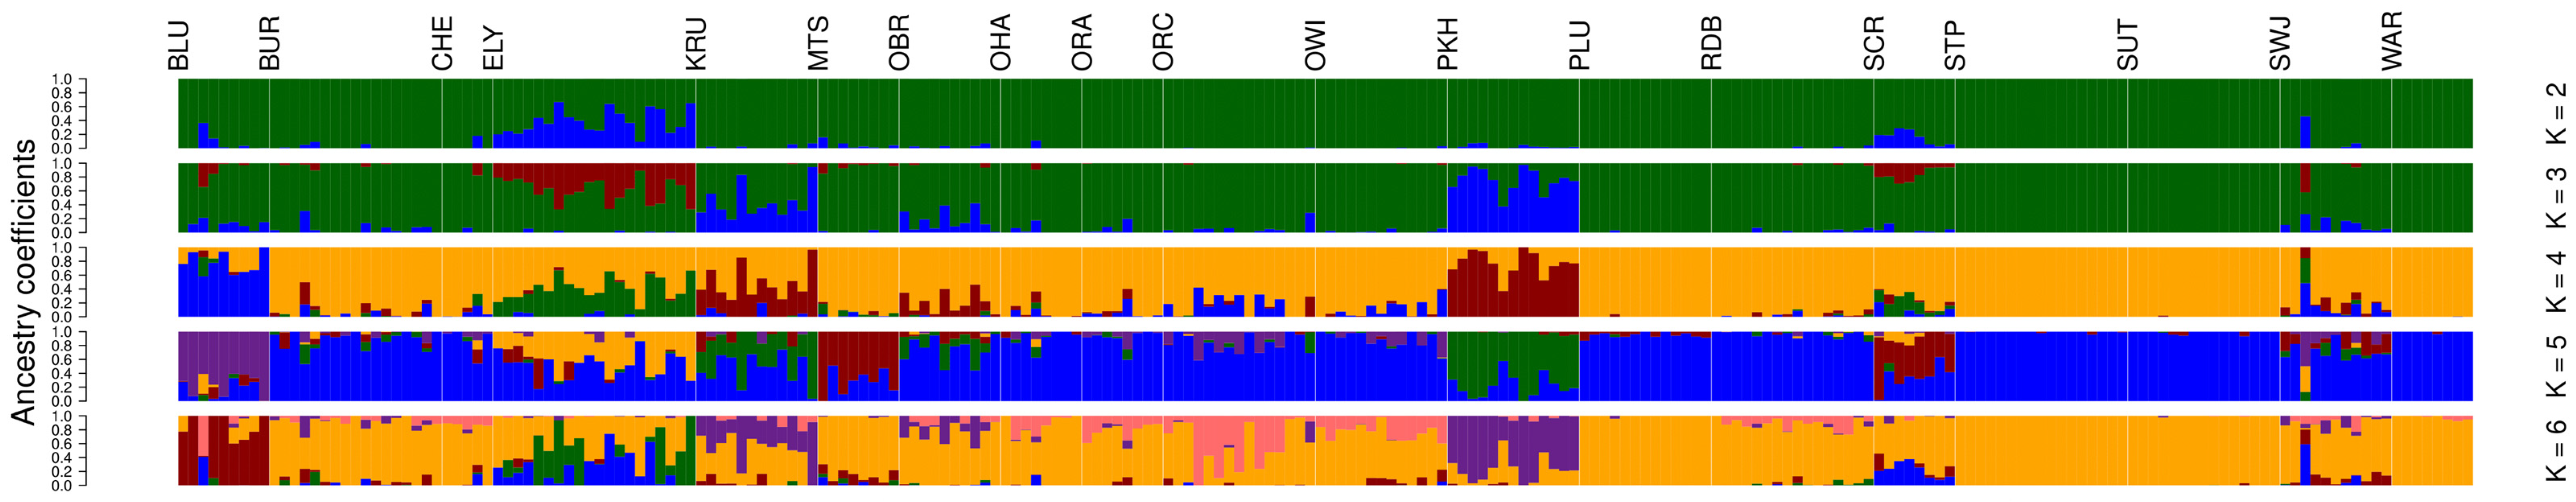
3.3. ddRAD-Seq Ancestry Inferences, Population Structuring, and Diversity Evaluation
4. Discussion
5. Conclusions
Supplementary Materials
Author Contributions
Funding
Informed Consent Statement
Data Availability Statement
Acknowledgments
Conflicts of Interest
References
- Hargrove, J.S.; Weyl, O.L.F.; Zhao, H.; Peatman, E.; Austin, J.D. Using Species-Diagnostic SNPs to Detail the Distribution and Dynamics of Hybridized Black Bass Populations in Southern Africa. Biol. Invasions 2019, 21, 1499–1509. [Google Scholar] [CrossRef]
- Silliman, K.; Zhao, H.; Justice, M.; Thongda, W.; Bowen, B.; Peatman, E. Complex Introgression among Three Diverged Largemouth Bass Lineages. Evol. Appl. 2021, 14, 2815–2830. [Google Scholar] [CrossRef]
- Kim, D.; Taylor, A.T.; Near, T.J. Phylogenomics and Species Delimitation of the Economically Important Black Basses (Micropterus). Sci. Rep. 2022, 12, 9113. [Google Scholar] [CrossRef]
- Barthel, B.L.; Lutz-Carrillo, D.J.; Norberg, K.E.; Porak, W.F.; Tringali, M.D.; Kassler, T.W.; Johnson, W.E.; Readel, A.M.; Krause, R.A.; Philipp, D.P. Genetic Relationships among Populations of Florida Bass. Trans. Am. Fish. Soc. 2010, 139, 1615–1641. [Google Scholar] [CrossRef]
- Lusk, S.C.; Middaugh, C.R.; Asher, A.M. Evaluation of Population Characteristic Differences between the Largemouth Bass and Its Backcross Following a Long-Term Florida Bass Stocking Effort. N. Am. J. Fish. Manag. 2023, 43, 603–617. [Google Scholar] [CrossRef]
- Buckmeier, D.L.; Schlechte, J.W.; Betsill, R.K. Stocking Fingerling Largemouth Bass to Alter Genetic Composition: Efficacy and Efficiency of Three Stocking Rates. N. Am. J. Fish. Manag. 2003, 23, 523–529. [Google Scholar] [CrossRef]
- Hargrove, J.S.; Kazyak, D.C.; Lubinski, B.A.; Rogers, K.M.; Bowers, O.K.; Fesenmyer, K.A.; Habera, J.W.; Henegar, J. Landscape and Stocking Effects on Population Genetics of Tennessee Brook Trout. Conserv. Genet. 2022, 23, 341–357. [Google Scholar] [CrossRef]
- Bailey, R.; Hubbs, C. The Black Basses (Micropterus) of Florida with Description Of A New Species. Science 1949, 516, 1–44. [Google Scholar] [CrossRef]
- Sasaki, S. Introduction of Florida Largemouth Bass into San Diego County; California Department of Fish and Game Inland Fisheries Administration: Sacramento, CA, USA, 1961; pp. 11–16.
- Warren, M.L., Jr. Centrarchid Identification and Natural History. In Centrarchid Fishes; John Wiley & Sons, Ltd.: Hoboken, NJ, USA, 2009; pp. 375–533. ISBN 978-1-4443-1603-2. [Google Scholar]
- Dunham, R.A.; Turner, C.J.; Reeves, W.C. Introgression of the Florida Largemouth Bass Genome into Native Populations in Alabama Public Lakes. N. Am. J. Fish. Manag. 1992, 12, 494–498. [Google Scholar] [CrossRef]
- Li, C.; Gowan, S.; Anil, A.; Beck, B.H.; Thongda, W.; Kucuktas, H.; Kaltenboeck, L.; Peatman, E. Discovery and Validation of Gene-Linked Diagnostic SNP Markers for Assessing Hybridization between Largemouth Bass (Micropterus salmoides) and Florida Bass (M. floridanus). Mol. Ecol. Resour. 2015, 15, 395–404. [Google Scholar] [CrossRef]
- Weyl, O.; Schirrmann, M.; Hargrove, J.; Bodill, T.; Swartz, E. Invasion Status of Florida Bass Micropterus floridanus (Lesueur, 1822) in South Africa. Afr. J. Aquat. Sci. 2017, 42, 359–365. [Google Scholar] [CrossRef]
- Zhao, H.; Li, C.; Hargrove, J.S.; Bowen, B.R.; Thongda, W.; Zhang, D.; Mohammed, H.; Beck, B.H.; Austin, J.D.; Peatman, E. SNP Marker Panels for Parentage Assignment and Traceability in the Florida Bass (Micropterus floridanus). Aquaculture 2018, 485, 30–38. [Google Scholar] [CrossRef]
- Hargrove, J.S.; Rogers, M.W.; Kacmar, P.T.; Black, P. A Statewide Evaluation of Florida Bass Genetic Introgression in Tennessee. N. Am. J. Fish. Manag. 2019, 39, 637–651. [Google Scholar] [CrossRef]
- Middaugh, C.R.; Lusk, S.C.; Massery, C.; Asher, A. Spatial Patterns of Florida Largemouth Bass Genetic Introgression into a Northern Largemouth Bass Population after Stocking. J. Southeast. Assoc. Fish Wildl. Agencies 2022, 9, 17–24. [Google Scholar]
- Hughes, J.; Wood, M.G. Development of a Trophy Largemouth Bass Fishery in Louisiana. J. Southeast. Assoc. Fish. Wildl. Agencies 1995, 49, 58–68. [Google Scholar]
- Fries, M.A. Introgression, Health, and Condition of Florida, Northern, and Fx Hybrid Largemouth Bass in Louisana Water Bodies. Master’s Thesis, Lousiana State University, Baton Rouge, LA, USA, 2010. [Google Scholar]
- Houde, A.L.S.; Fraser, D.J.; O’Reilly, P.; Hutchings, J.A. Relative Risks of Inbreeding and Outbreeding Depression in the Wild in Endangered Salmon. Evol. Appl. 2011, 4, 634–647. [Google Scholar] [CrossRef]
- Lamaze, F.C.; Sauvage, C.; Marie, A.; Garant, D.; Bernatchez, L. Dynamics of Introgressive Hybridization Assessed by SNP Population Genomics of Coding Genes in Stocked Brook Charr (Salvelinus fontinalis). Mol. Ecol. 2012, 21, 2877–2895. [Google Scholar] [CrossRef]
- Mable, B.K. Conservation of Adaptive Potential and Functional Diversity: Integrating Old and New Approaches. Conserv. Genet. 2019, 20, 89–100. [Google Scholar] [CrossRef]
- McKinney, G.J.; Pascal, C.E.; Templin, W.D.; Gilk-Baumer, S.E.; Dann, T.H.; Seeb, L.W.; Seeb, J.E. Dense SNP Panels Resolve Closely Related Chinook Salmon Populations. Can. J. Fish. Aquat. Sci. 2020, 77, 451–461. [Google Scholar] [CrossRef]
- Bunch, A.; Greenlee, R.; Odenkirk, J. Evaluation of Largemouth Bass Supplemental Stocking on a Virginia Coastal River. J. Southeast. Assoc. Fish. Wildl. Agencies 2017, 4, 18–24. [Google Scholar]
- Marie, A.D.; Bernatchez, L.; Garant, D. Loss of Genetic Integrity Correlates with Stocking Intensity in Brook Charr (Salvelinus fontinalis). Mol. Ecol. 2010, 19, 2025–2037. [Google Scholar] [CrossRef] [PubMed]
- Almodóvar, A.; Leal, S.; Nicola, G.G.; Hórreo, J.L.; García-Vázquez, E.; Elvira, B. Long-Term Stocking Practices Threaten the Original Genetic Diversity of the Southernmost European Populations of Atlantic Salmon Salmo Salar. Endanger. Species Res. 2020, 41, 303–317. [Google Scholar] [CrossRef]
- Campbell, N.R.; Harmon, S.A.; Narum, S.R. Genotyping-in-Thousands by Sequencing (GT-Seq): A Cost Effective SNP Genotyping Method Based on Custom Amplicon Sequencing. Mol. Ecol. Resour. 2015, 15, 855–867. [Google Scholar] [CrossRef]
- Poland, J.; Brown, P.; Sorrells, M.; Jannink, J.-L. Development of High-Density Genetic Maps for Barley and Wheat Using a Novel Two-Enzyme Genotyping-by-Sequencing Approach. PLoS ONE 2012, 7, e32253. [Google Scholar] [CrossRef] [PubMed]
- Thongda, W.; Lewis, M.; Zhao, H.; Bowen, B.; Lutz-Carrillo, D.J.; Peoples, B.K.; Peatman, E. Species-Diagnostic SNP Markers for the Black Basses (Micropterus spp.): A New Tool for Black Bass Conservation and Management. Conserv. Genet. Resour. 2020, 12, 319–328. [Google Scholar] [CrossRef]
- Anderson, E.C.; Thompson, E.A. A Model-Based Method for Identifying Species Hybrids Using Multilocus Genetic Data. Genetics 2002, 160, 1217–1229. [Google Scholar] [CrossRef]
- Zhao, H.; Beck, B.; Fuller, A.; Peatman, E. EasyParallel: A GUI Platform for Parallelization of Structure and Newhybrids Analyses. PLoS ONE 2020, 15, e0232110. [Google Scholar] [CrossRef]
- Martin, M. Cutadapt Removes Adapter Sequences from High-Throughput Sequencing Reads. EMBnet. J. 2011, 17, 10–12. [Google Scholar] [CrossRef]
- Catchen, J.; Hohenlohe, P.A.; Bassham, S.; Amores, A.; Cresko, W.A. Stacks: An Analysis Tool Set for Population Genomics. Mol. Ecol. 2013, 22, 3124–3140. [Google Scholar] [CrossRef]
- He, K.; Zhao, L.; Yuan, Z.; Canario, A.; Liu, Q.; Chen, S.; Guo, J.; Luo, W.; Yan, H.; Zhang, D.; et al. Chromosome-Level Genome Assembly of Largemouth Bass (Micropterus salmoides) Using PacBio and Hi-C Technologies. Sci. Data 2022, 9, 482. [Google Scholar] [CrossRef]
- Langmead, B.; Salzberg, S.L. Fast Gapped-Read Alignment with Bowtie 2. Nat. Methods 2012, 9, 357–359. [Google Scholar] [CrossRef] [PubMed]
- Li, H.; Handsaker, B.; Wysoker, A.; Fennell, T.; Ruan, J.; Homer, N.; Marth, G.; Abecasis, G.; Durbin, R.; 1000 Genome Project Data Processing Subgroup. The Sequence Alignment/Map Format and SAMtools. Bioinformatics 2009, 25, 2078–2079. [Google Scholar] [CrossRef] [PubMed]
- Rousset, F. Genepop’007: A Complete Re-Implementation of the Genepop Software for Windows and Linux. Mol. Ecol. Resour. 2008, 8, 103–106. [Google Scholar] [CrossRef] [PubMed]
- Purcell, S.; Neale, B.; Todd-Brown, K.; Thomas, L.; Ferreira, M.A.R.; Bender, D.; Maller, J.; Sklar, P.; de Bakker, P.I.W.; Daly, M.J.; et al. PLINK: A Tool Set for Whole-Genome Association and Population-Based Linkage Analyses. Am. J. Hum. Genet. 2007, 81, 559–575. [Google Scholar] [CrossRef]
- de Jong, M.J.; de Jong, J.F.; Hoelzel, A.R.; Janke, A. SambaR: An R Package for Fast, Easy and Reproducible Population-Genetic Analyses of Biallelic SNP Data Sets. Mol. Ecol. Resour. 2021, 21, 1369–1379. [Google Scholar] [CrossRef]
- Wickham, H. Ggplot2. WIREs Comput. Stat. 2011, 3, 180–185. [Google Scholar] [CrossRef]
- Jombart, T. Adegenet: A R Package for the Multivariate Analysis of Genetic Markers. Bioinformatics 2008, 24, 1403–1405. [Google Scholar] [CrossRef]
- Frichot, E.; François, O. LEA: An R Package for Landscape and Ecological Association Studies. Methods Ecol. Evol. 2015, 6, 925–929. [Google Scholar] [CrossRef]
- Weir, B.S.; Cockerham, C.C. Estimating F-Statistics for the Analysis of Population Structure. Evolution 1984, 38, 1358–1370. [Google Scholar] [CrossRef]
- Watterson, G.A. On the Number of Segregating Sites in Genetical Models without Recombination. Theor. Popul. Biol. 1975, 7, 256–276. [Google Scholar] [CrossRef]
- Tajima, F. Statistical Method for Testing the Neutral Mutation Hypothesis by DNA Polymorphism. Genetics 1989, 123, 585–595. [Google Scholar] [CrossRef]
- Whitlock, M.C.; Lotterhos, K.E. Reliable Detection of Loci Responsible for Local Adaptation: Inference of a Null Model through Trimming the Distribution of FST. Am. Nat. 2015, 186, S24–S36. [Google Scholar] [CrossRef] [PubMed]
- Luu, K.; Bazin, E.; Blum, M.G.B. Pcadapt: An R Package to Perform Genome Scans for Selection Based on Principal Component Analysis. Mol. Ecol. Resour. 2017, 17, 67–77. [Google Scholar] [CrossRef] [PubMed]
- Do, C.; Waples, R.S.; Peel, D.; Macbeth, G.M.; Tillett, B.J.; Ovenden, J.R. NeEstimator v2: Re-Implementation of Software for the Estimation of Contemporary Effective Population Size (Ne) from Genetic Data. Mol. Ecol. Resour. 2014, 14, 209–214. [Google Scholar] [CrossRef] [PubMed]
- Gruber, B.; Unmack, P.J.; Berry, O.F.; Georges, A. Dartr: An R Package to Facilitate Analysis of SNP Data Generated from Reduced Representation Genome Sequencing. Mol. Ecol. Resour. 2018, 18, 691–699. [Google Scholar] [CrossRef]
- Williams, J.B. Temporal and Spatial Patterns of Abundance of the Chydoridae (Cladocera) in Lake Itasca, Minnesota. Ecology 1982, 63, 345–353. [Google Scholar] [CrossRef]
- Cincotta, D.A.; Welsh, S.A. An Update of the Ichthyofauna of West Virginia with Notes on Historic Sportfish Stockings. Northeast. Nat. 2024, 31, 1–48. [Google Scholar] [CrossRef]
- Gibson, I.; Welsh, A.B.; Welsh, S.A.; Cincotta, D.A. Genetic Swamping and Possible Species Collapse: Tracking Introgression between the Native Candy Darter and Introduced Variegate Darter. Conserv. Genet. 2019, 20, 287–298. [Google Scholar] [CrossRef]
- Smith, S. DWR’s F1 Largemouth Bass Stocking Program FAQ; Virginia Department of Wildlife Resources: Verona, VA, USA, 2020.
- Selego, S. Fish and Aquatic Macroinvertebrate Communities in the Cacapon River; West Virginia University: West Virginia, WV, USA, 2011. [Google Scholar]
- Valiquette, E.; Perrier, C.; Thibault, I.; Bernatchez, L. Loss of Genetic Integrity in Wild Lake Trout Populations Following Stocking: Insights from an Exhaustive Study of 72 Lakes from Québec, Canada. Evol. Appl. 2014, 7, 625–644. [Google Scholar] [CrossRef]
- Page, K.S.; Zweifel, R.D.; Stott, W. Spatial and Temporal Genetic Analysis of Walleyes in the Ohio River. Trans. Am. Fish. Soc. 2017, 146, 1168–1185. [Google Scholar] [CrossRef]
- Johnson, A.; Zipfel, K.; Welsh, A. Advancing Conservation Strategies for Native Eastern Highlands-Strain Walleye Sander Vitreus in West Virginia: Insights from Genomic Investigations and Broodstock Screening. Diversity 2024, 16, 371. [Google Scholar] [CrossRef]
- Wahlund, S. Zusammensetzung von Populationen und Korrelationserscheinungen vom Standpunkt der Vererbungslehre aus Betrachtet. Hereditas 1928, 11, 65–106. [Google Scholar] [CrossRef]
- Garnier-Géré, P.; Chikhi, L. Population Subdivision, Hardy–Weinberg Equilibrium and the Wahlund Effect. In eLS; John Wiley & Sons, Ltd.: Hoboken, NJ, USA, 2013; ISBN 978-0-470-01590-2. [Google Scholar]
- Miranda, L.E.; Lakin, K.M.; Faucheux, N.M. Habitat Associations of Three Black Bass Species in a Reservoir System. Trans. Am. Fish. Soc. 2021, 150, 538–547. [Google Scholar] [CrossRef]
- Wheeler, A.P.; Allen, M.S. Habitat and Diet Partitioning between Shoal Bass and Largemouth Bass in the Chipola River, Florida. Trans. Am. Fish. Soc. 2003, 132, 438–449. [Google Scholar] [CrossRef]
- Keplinger, B.; Phelps, Q.; Hedrick, J. Long-Term Response of a Largemouth Bass Population to a Protected Slot Limit Regulation in a West Virginia Small Impoundment. J. Southeast. Assoc. Fish Wildl. Agencies 2023, 10, 76–84. [Google Scholar]
- Wang, J.; Santiago, E.; Caballero, A. Prediction and Estimation of Effective Population Size. Heredity 2016, 117, 193–206. [Google Scholar] [CrossRef]


| Locus | Primer | Read |
|---|---|---|
| 8751 (22) | F: CGACAGGTTCAGAGTTCTACAGTCCGACGATCTTCTCTGGTGATCTGTGTGG R: GTGACTGGAGTTCAGACGTGTGCTCTTCCGATCTAGTGCTGTTCTTAGCCGTTC | CGGACACTCGCATGACTTGAG (A/G) CGCAGGGCTGGTGTTGTATGAACGG |
| 11367-1 (10) | F: CGACAGGTTCAGAGTTCTACAGTCCGACGATCTCCCAGGATTTGCCTATCAG R: GTGACTGGAGTTCAGACGTGTGCTCTTCCGATCTGGAGGAGATTGTTGTGTGAG | AGAGGACAA (G/A) GACAAGAACATCCTTATCCCCGGCCTCACTCA |
| 6106 (19) | F: CGACAGGTTCAGAGTTCTACAGTCCGACGATCGGAGACTTTGATGTCAGAGG R: GTGACTGGAGTTCAGACGTGTGCTCTTCCGATCTTCCAAGACTGACTGAGTCAC | TCTGAGTGTTTGGGGAGA (C/T) CTCCTGTCAGCATTACACAAGTGA |
| 2930 (11) | F: CGACAGGTTCAGAGTTCTACAGTCCGACGATCTCATTGTCCCTGACATGTGG R: GTGACTGGAGTTCAGACGTGTGCTCTTCCGATCTGGCTGTGAAAAAGCTAGACC | CTGAAGGACG (A/T) GTATCTGCATACTGCAGCAAGCAAGTTCAATTTCCAT |
| 33087 (24) | F: CGACAGGTTCAGAGTTCTACAGTCCGACGATCATGGTGACAGCCACAGCATC R: GTGACTGGAGTTCAGACGTGTGCTCTTCCGATCTTGTGAAGTTCGGAGCTGATG | AGCCAGCAGGTCCACCCCCTGCA (G/A) CATGAGGGCACGAGCATCAGCTCCG |
| 32455 (42) | F: CGACAGGTTCAGAGTTCTACAGTCCGACGATCGAGATCATTCGTCACTCCTG R: GTGACTGGAGTTCAGACGTGTGCTCTTCCGATCTAATGTTGACCACTGGTAGAG | GGATTTAATTAGGGATTTCTAGTGAGCATAAATGTCACTTT (A/C) ATTTGTGTTAATTAACTCTACCAGTGGTCAACATTAGATCGGAAGAGCAC |
| 11367 (33) | F: CGACAGGTTCAGAGTTCTACAGTCCGACGATCCAATGTTGGGCAGTTCAGAG R: GTGACTGGAGTTCAGACGTGTGCTCTTCCGATCTTCATCCTTAGCTTTGACCAG | CAGCCAGGCGTGATCCCCCGGGCTGTCCGTGA (A/G) GTCTTCAATCTGGTCAAAGCTAAGGA |
| 17385 (34) | F: CGACAGGTTCAGAGTTCTACAGTCCGACGATCCACTGCTAATGGAGTAGCTG R: GTGACTGGAGTTCAGACGTGTGCTCTTCCGATCTCAGCAGTGGCTTGGAAATAC | AAAAGTAAAAATGTATTAAAGAGGAAAAACAGC (G/A) TTGTAGTCTAGTATTTCTAAGCCACT |
| 35139 (33) | F: CGACAGGTTCAGAGTTCTACAGTCCGACGATCTCTCACGTCTGTATGTGCTG R: GTGACTGGAGTTCAGACGTGTGCTCTTCCGATCTTTTGTTGACCCCGTGGTAAC | TTTAGGGTCAAAACCATACAGGAGAATGAAGG (C/T) GCTTAAAAGTTACCAC |
| 5903 (51) | F: CGACAGGTTCAGAGTTCTACAGTCCGACGATCCGTTCTAGTTCTTATGTCAC R: GTGACTGGAGTTCAGACGTGTGCTCTTCCGATCTTCCCTCCTAATCTGAACCTG | TCTTTGTTATTTTGGTATCACTGTTAAATCAAAGGGAAAGAGGATTGTC (A/T) TCACTTGCAGGTTCAGATTAGGAGGGAAGATCGGAAGAGCACACGTCTGAACT |
| 31992 (34) | F: CGACAGGTTCAGAGTTCTACAGTCCGACGATCTTTAGTTCCACTGCCACCAC R: GTGACTGGAGTTCAGACGTGTGCTCTTCCGATCTCTGGTGGATCTGGATCCAGT | CAGATACACCAATGACAAATGATCCAGGAAAAC (T/C) GGCGTCAGGGTAGGCAAA |
| 15421 (9) | F: CGACAGGTTCAGAGTTCTACAGTCCGACGATCCATCTACTACACCCACACTG R: GTGACTGGAGTTCAGACGTGTGCTCTTCCGATCTTGCAGAGGAGCATGTTGATG | ATGGTTGC (A/T) CTGAGAACAAGGTCTTCATCAGCATCAACATGCTCCTCTGCAAG |
| 2993 (13) | F: CGACAGGTTCAGAGTTCTACAGTCCGACGATCAAGACATAACGTGGTGCAAG R: GTGACTGGAGTTCAGACGTGTGCTCTTCCGATCTCTCCCACAGTATGTCAACTC | TTTTTTAGGTTC (A/T) CCTGGGACAGCATGTCTCTATAGAGCAAGAGTTGACATAC |
| 19092 (12) | F: CGACAGGTTCAGAGTTCTACAGTCCGACGATCGCAAAAATGTGTTAAACGGG R: GTGACTGGAGTTCAGACGTGTGCTCTTCCGATCTGCTACTAGGCTGAAACCTAC | TTATTTAGAAT (T/G) AGTAGGTCAGCAACTATGTCTGCATTGCAGTTTTCAGTAGGT |
| 31857 (9) | F: CGACAGGTTCAGAGTTCTACAGTCCGACGATCACTAAAACCACTGGCCAGTC R: GTGACTGGAGTTCAGACGTGTGCTCTTCCGATCTGGGAAAGTGGCCTCTAAAAG | CAGTCTTA (T/C) AGCACGCAGGGAGGGTTTTATCCAAAACCACAAAATAAATGA |
| 26936 (15) * | F: CGACAGGTTCAGAGTTCTACAGTCCGACGATCTGCTCATGGTAAGCGTCCTC R: CGACAGGTTCAGAGTTCTACAGTCCGACGATCTGCTCATGGTAAGCGTCCTC | CATCTCACTCTCCA (A/G) CTTCTCACGAGCCTCACGCATGTTCTTCTCTACCTGTTG |
| SNP ID | Average Read Depth | Genotype Rate | Florida Bass Allele Frequency | Largemouth Bass Allele Frequency |
|---|---|---|---|---|
| 17385 | 2166.72 | 1.00 | 0.03 | 0.97 |
| 32455 | 2485.42 | 1.00 | 0.11 | 0.89 |
| 31992 | 3015.77 | 1.00 | 0.12 | 0.88 |
| 2930 | 3187.93 | 1.00 | 0.05 | 0.95 |
| 2993 | 3439.82 | 1.00 | 0.08 | 0.92 |
| 5903 | 3607.41 | 1.00 | 0.03 | 0.97 |
| 19092 | 3712.35 | 1.00 | 0.06 | 0.94 |
| 6106 | 4120.89 | 1.00 | 0.04 | 0.96 |
| 8751 | 5388.11 | 1.00 | 0.24 | 0.76 |
| 11367-1 | 5390.22 | 1.00 | 0.04 | 0.96 |
| 31857 | 5504.14 | 1.00 | 0.05 | 0.95 |
| 35139 | 5838.82 | 1.00 | 0.06 | 0.94 |
| 33087 | 7291.91 | 1.00 | 0.05 | 0.95 |
| 11367 | 8838.12 | 1.00 | 0.08 | 0.92 |
| 15421 | 9305.76 | 1.00 | 0.04 | 0.96 |
| 26936 | 9512.58 | 1.00 | 0.10 | 0.90 |
| Population (n) | Pure LMB (% of Population) | Second Most Prevalent Assignment | Average Ancestry | Median Ancestry | Range Ancestry |
|---|---|---|---|---|---|
| Beech Fork Lake (30) | 30 (100%) | N/A | 93.1% | 93.8% | 87.5–100% |
| Bluestone Lake (19) | 14 (73.7%) | LMB_Bx (5) | 95.4% | 96.9% | 71.9–100% |
| Burnsville Lake (19) | 19 (100%) | N/A | 96.5% | 96.9% | 90.6–100% |
| Cheat Lake (18) | 17 (94.4%) | LMB_Bx (1) | 93.1% | 93.8% | 87.5–100% |
| East Lynn Lake (32) | 15 (46.9%) | LMB_Bx (13) | 86.5% | 87.5% | 56.3–100% |
| Elk Fork Lake (32) | 24 (75.0%) | LMB_Bx (2) | 94.9% | 96.9% | 84.4–100% |
| Kanawha River Winfield Pool (14) | 13 (92.9%) | LMB_Bx (1) | 97.3% | 96.9% | 90.6–100% |
| Kimsey Run Lake (35) | 30 (85.7%) | LMB_Bx (2) | 93.4% | 93.8% | 84.4–100% |
| Monongahela River Morgantown Pool (22) | 19 (86.4%) | LMB_Bx (2) | 95.9% | 100.0% | 81.3–100% |
| Monongahela River Opekiska Pool (29) | 24 (82.8%) | LMB_Bx (5) | 95.4% | 100.0% | 75.0–100% |
| Monongahela River Point Marion Pool (47) | 43 (91.5%) | LMB_Bx (4) | 97.0% | 100.0% | 78.1–100% |
| Mount Storm (38) | 38 (100%) | N/A | 96.1% | 96.9% | 87.5–100% |
| North Bend Lake | 28 (93.3%) | N/A | 96.3% | 96.9% | 87.5–100% |
| O’Brien Lake (38) | 38 (100%) | N/A | 97.0% | 96.9% | 87.5–100% |
| Ohio River Belleville Pool (44) | 42 (95.5%) | LMB_Bx (1) | 96.7% | 96.9% | 81.3–100% |
| Ohio River Hannibal Pool (21) | 20 (95.2%) | LMB_Bx (1) | 95.5% | 96.9% | 78.1–100% |
| Ohio River Racine Pool (23) | 20 (87.0%) | LMB_Bx (1) | 95.1% | 96.9% | 81.3–100% |
| Ohio River R.C. Byrd Pool (21) | 20 (95.2%) | LMB_Bx (1) | 96.9% | 96.9% | 87.5–100% |
| Ohio River Willow Island Pool (36) | 34 (94.4%) | LMB_Bx (1) | 96.6% | 96.9% | 81.3–100% |
| Ohio River Pike Island Pool (3) | 3 (100%) | N/A | 93.8% | 93.8% | 90.6–96.9% |
| Parker Hollow Lake (36) | 33 (91.7%) | LMB_Bx (1) | 92.4% | 92.2% | 81.3–100% |
| Plum Orchard Lake (20) | 20 (100%) | N/A | 97.2% | 96.9% | 81.3–100% |
| R.D Bailey Lake (22) | 21 (95.5%) | N/A | 95.0% | 96.9% | 84.4–100% |
| Sleepy Creek Lake (24) | 10 (41.7%) | LMB_Bx (8) | 84.8% | 87.5% | 62.5–100% |
| South Mill Creek Lake (36) | 32 (88.9%) | LMB_Bx (1) | 92.8% | 93.8% | 84.4–100% |
| Stephens Lake (34) | 34 (100%) | N/A | 97.9% | 96.9% | 90.6–100% |
| Stonewall Jackson Lake (21) | 17 (80.9%) | LMB_Bx (3) | 91.2% | 90.6% | 65.6–100% |
| Sutton Lake (23) | 23 (100%) | N/A | 98.8% | 100.0% | 93.8–100% |
| Tygart Lake (20) | 18 (90%) | LMB_Bx (1) | 95.9% | 96.9% | 71.9–100% |
| Upper Mud Lake (28) | 22 (78.6%) | LMB_Bx (6) | 90.3% | 90.6% | 71.9–100% |
| Warden Lake (41) | 41 (100%) | N/A | 98.3% | 100.0% | 93.8–100% |
| Total (856) | 760 (88.8%) | LMB_Bx (62) | 94.9% | 96.9% | 56.3–100% |
| Population | P | P loci | Private | π (SE) | HO (SE) | HE (SE) | HWE | FIS (SE) | Ɵ | Tajima | Ne (95% CI) |
|---|---|---|---|---|---|---|---|---|---|---|---|
| Bluestone Lake (9) | 0.922 | 0.119 | 16 | 0.123 (0.003) | 0.099 (0.003) | 0.116 (0.003) | 28 (1.07%) | 0.070 (0.009) | 0.147 | −0.028 | 10.1 (9.8–10.4) |
| Burnsville Lake (17) | 0.935 | 0.120 | 5 | 0.100 (0.003) | 0.082 (0.003) | 0.097 (0.003) | 108 (4.13%) | 0.067 (0.015) | 0.124 | −0.027 | 46.3 (43.7–49.2) |
| 0.909 | 0.147 | 49 | 0.137 (0.003) | 0.112 (0.002) | 0.133 (0.003) | 198 (5.50%) | 0.089 (0.014) | 0.158 | −0.023 | 57.2 (55.0–59.5) | |
| Cheat Lake (5) | 0.941 | 0.069 | 0 | 0.093 (0.003) | 0.076 (0.003) | 0.083 (0.003) | 7 (0.27%) | 0.039 (0.007) | 0.106 | −0.017 | ∞ |
| 0.919 | 0.091 | 0 | 0.127 (0.003) | 0.103 (0.003) | 0.114 (0.003) | 16 (0.44%) | 0.054 (0.006) | 0.143 | −0.024 | ∞ | |
| East Lynn Lake (20) | 0.903 | 0.170 | 78 | 0.152 (0.003) | 0.132 (0.003) | 0.148 (0.003) | 113 (4.31%) | 0.077 (0.015) | 0.165 | −0.017 | 70.4 (67.5–73.5) |
| Kimsey Run Lake (12) | 0.926 | 0.117 | 3 | 0.116 (0.003) | 0.092 (0.003) | 0.110 (0.003) | 90 (3.44%) | 0.078 (0.014) | 0.138 | −0.027 | 46.0 (42.1–50.7) |
| Lake Stephens (17) | 0.954 | 0.068 | 4 | 0.067 (0.003) | 0.060 (0.003) | 0.065 (0.003) | 44 (1.68%) | 0.025 (0.012) | 0.069 | −0.003 | 81.0 (69.4–96.9) |
| 0.934 | 0.090 | 16 | 0.096 (0.003) | 0.084 (0.003) | 0.093 (0.003) | 92 (2.56%) | 0.038 (0.011) | 0.094 | −0.001 | 131.7 (115.9–152.4) | |
| Mt. Storm Lake (8) | 0.932 | 0.081 | 1 | 0.103 (0.003) | 0.056 (0.002) | 0.096 (0.003) | 67 (2.56%) | 0.124 (0.010) | 0.114 | −0.019 | ∞ |
| 0.904 | 0.107 | 43 | 0.144 (0.003) | 0.079 (0.002) | 0.135 (0.003) | 141 (3.92%) | 0.167 (0.014) | 0.155 | −0.023 | ∞ | |
| O’Brien Lake (10) | 0.934 | 0.101 | 3 | 0.103 (0.003) | 0.083 (0.003) | 0.097 (0.003) | 32 (1.22%) | 0.058 (0.013) | 0.124 | −0.025 | ∞ |
| 0.909 | 0.130 | 14 | 0.140 (0.003) | 0.113 (0.003) | 0.133 (0.003) | 58 (1.61%) | 0.079 (0.012) | 0.169 | −0.034 | ∞ | |
| Ohio River Hannibal Pool (8) | 0.938 | 0.091 | 0 | 0.098 (0.003) | 0.066 (0.002) | 0.091 (0.003) | 28 (1.07%) | 0.093 (0.010) | 0.123 | −0.031 | 92.8 (71.8–130.2) |
| 0.913 | 0.114 | 1 | 0.135 (0.003) | 0.089 (0.002) | 0.126 (0.003) | 70 (1.95%) | 0.126 (0.008) | 0.164 | −0.037 | 771.8 (331.3–∞) | |
| Ohio River Racine Pool (8) | 0.937 | 0.092 | 1 | 0.099 (0.003) | 0.074 (0.003) | 0.092 (0.003) | 19 (0.73%) | 0.068 (0.009) | 0.117 | −0.023 | ∞ |
| 0.911 | 0.117 | 2 | 0.139 (0.003) | 0.102 (0.003) | 0.130 (0.003) | 52 (1.17%) | 0.099 (0.008) | 0.157 | −0.025 | ∞ | |
| Ohio River R.C. Byrd Pool (15) | 0.932 | 0.114 | 21 | 0.105 (0.003) | 0.077 (0.002) | 0.101 (0.003) | 138 (5.27%) | 0.097 (0.016) | 0.126 | −0.025 | 30.5 (29.0–32.2) |
| 0.904 | 0.145 | 51 | 0.146 (0.003) | 0.107 (0.002) | 0.141 (0.003) | 265 (7.36%) | 0.133 (0.015) | 0.168 | −0.028 | 35.9 (34.8–37.1) | |
| Ohio River Willow Island Pool (13) | 0.934 | 0.109 | 4 | 0.102 (0.003) | 0.081 (0.003) | 0.098 (0.003) | 113 (4.32%) | 0.074 (0.012) | 0.121 | −0.022 | 41.4 (38.2–45.1) |
| 0.905 | 0.141 | 15 | 0.145 (0.003) | 0.112 (0.002) | 0.139 (0.003) | 230 (6.39%) | 0.109 (0.008) | 0.165 | −0.024 | 42.5 (40.7–44.5) | |
| Parker Hollow Lake (13) | 0.922 | 0.114 | 3 | 0.119 (0.003) | 0.105 (0.003) | 0.114 (0.003) | 63 (2.41%) | 0.044 (0.011) | 0.124 | −0.008 | 98.6 (85.4–116.5) |
| Plum Orchard Lake (13) | 0.947 | 0.075 | 3 | 0.079 (0.003) | 0.049 (0.002) | 0.076 (0.003) | 150 (5.73%) | 0.093 (0.015) | 0.093 | −0.017 | 132.8 (96.3–211.4) |
| 0.925 | 0.098 | 9 | 0.111 (0.003) | 0.069 (0.002) | 0.106 (0.003) | 260 (7.22%) | 0.125 (0.13) | 0.126 | −0.020 | 134.1 (111.7–167.2) | |
| R.D. Bailey Lake (16) | 0.939 | 0.109 | 11 | 0.094 (0.003) | 0.083 (0.003) | 0.091 (0.003) | 70 (2.67%) | 0.042 (0.013) | 0.113 | −0.021 | 131.8 (111.2–161.2) |
| 0.913 | 0.140 | 30 | 0.132 (0.003) | 0.116 (0.003) | 0.128 (0.003) | 133 (3.70%) | 0.058 (0.012) | 0.150 | −0.020 | 153.7 (138.1–173.0) | |
| Sleepy Creek Lake (8) | 0.911 | 0.116 | 4 | 0.139 (0.003) | 0.088 (0.003) | 0.130 (0.003) | 57 (2.18%) | 0.139 (0.010) | 0.161 | −0.031 | ∞ |
| Stonewall Jackson Lake (11) | 0.923 | 0.129 | 4 | 0.122 (0.003) | 0.074 (0.002) | 0.116 (0.003) | 162 (6.19%) | 0.159 (0.015) | 0.165 | −0.050 | 32.8 (30.8–35.1) |
| Sutton Lake (15) | 0.951 | 0.074 | 2 | 0.073 (0.003) | 0.060 (0.002) | 0.071 (0.003) | 65 (2.48%) | 0.042 (0.015) | 0.081 | −0.009 | 65.8 (57.2–77.3) |
| 0.930 | 0.097 | 7 | 0.104 (0.003) | 0.086 (0.002) | 0.100 (0.003) | 135 (3.79%) | 0.061 (0.014) | 0.111 | −0.009 | 72.5 (66.7–79.2) | |
| Warden Lake (8) | 0.954 | 0.049 | 2 | 0.068 (0.003) | 0.050 (0.002) | 0.063 (0.003) | 24 (1.11%) | 0.044 (0.009) | 0.064 | 0.001 | 105.2 (67.0–265.5) |
| 0.935 | 0.066 | 8 | 0.095 (0.003) | 0.070 (0.002) | 0.089 (0.003) | 52 (1.44%) | 0.059 (0.008) | 0.088 | 0.002 | 280.3 (156.6–1257.6) |
Disclaimer/Publisher’s Note: The statements, opinions and data contained in all publications are solely those of the individual author(s) and contributor(s) and not of MDPI and/or the editor(s). MDPI and/or the editor(s) disclaim responsibility for any injury to people or property resulting from any ideas, methods, instructions or products referred to in the content. |
© 2025 by the authors. Licensee MDPI, Basel, Switzerland. This article is an open access article distributed under the terms and conditions of the Creative Commons Attribution (CC BY) license (https://creativecommons.org/licenses/by/4.0/).
Share and Cite
Johnson, A.; Zipfel, K.; Smith, D.; Welsh, A. Fishing for Florida Bass in West Virginia: Genomic Evaluation of Florida Bass Presence and Establishing Baselines of Genetic Structure and Diversity for Native Largemouth Bass. Biology 2025, 14, 392. https://doi.org/10.3390/biology14040392
Johnson A, Zipfel K, Smith D, Welsh A. Fishing for Florida Bass in West Virginia: Genomic Evaluation of Florida Bass Presence and Establishing Baselines of Genetic Structure and Diversity for Native Largemouth Bass. Biology. 2025; 14(4):392. https://doi.org/10.3390/biology14040392
Chicago/Turabian StyleJohnson, Andrew, Katherine Zipfel, Dustin Smith, and Amy Welsh. 2025. "Fishing for Florida Bass in West Virginia: Genomic Evaluation of Florida Bass Presence and Establishing Baselines of Genetic Structure and Diversity for Native Largemouth Bass" Biology 14, no. 4: 392. https://doi.org/10.3390/biology14040392
APA StyleJohnson, A., Zipfel, K., Smith, D., & Welsh, A. (2025). Fishing for Florida Bass in West Virginia: Genomic Evaluation of Florida Bass Presence and Establishing Baselines of Genetic Structure and Diversity for Native Largemouth Bass. Biology, 14(4), 392. https://doi.org/10.3390/biology14040392