
Variation in Vessel Element Diameters and Densities Across Habitats at the Community and Species Levels in Southeast Florida


Simple Summary
Abstract

1. Introduction
2. Materials and Methods


| Initial Survey | Repeat Survey | Myrsine Survey | Ximenia Survey | Chrysobalanus Survey | Morella Survey | |
|---|---|---|---|---|---|---|
| Question addressed | Cross habitat difference in species mean VE diam. and/or dens. | Re-test Initial Survey | Environ. plasticity in 1 sp. | Environ. plasticity in 1 sp. | Environ. plasticity in 1 sp. | Environ. plasticity in 1 sp. |
| No. species studied | 19 and 19 in two habitats | 9 and 9 in 2 habitats | 1 sp. from 2 habitat extremes | 1 sp. from 2 habitat extremes | 1 sp. from 2 habitat extremes | 1 sp. from 2 habitat extremes |
| No. specimens/species | 3 | 1 | 30 × 2 habitats | 19 × 2 habitats | 30 × 2 habitats | 30 × 2 habitats |
| No. sections/twig | 1 | 1 | 1 | 1 | 1 | 1 |
| No. of VE diam. measured/section | 30 | 30 | 30 | 30 | 30 | 30 |
| No. VE dens. counted/section | 1 | 4 | 4 | 4 | 4 | 1, using DotCount |
| Total diam./dens. measurements/survey | 1650 diam./55 dens. × 2 habitats | 36 dens. × 2 habitats | 900 diam./120 dens. × 2 habitats | 570 diam./76 dens. × 2 habitats | 900 diam./120 dens. × 2 habitats | 900 diam./30 dens. × 2 habitats |
| Locations | Several sites: (SM A) | School-Site, Juno-Dunes-E-Site (SM A) | Several sites (SM G) | Several sites (SM H) | Several sites (SM J) | Several sites (SM P) |
| RQ supported | 1,3 | 1,3 | 2,3 | 1,3 | 1,2,3 | 1,2,3 |
| Surveys | n | Mean Diams. (µm) | Mean Diams. | Mean Diams. (p-Values) | Mean Dens. (/mm2) | Mean Dens. | Mean Dens. (p-Values) | Coef. Var. (p-Values) | Figures |
|---|---|---|---|---|---|---|---|---|---|
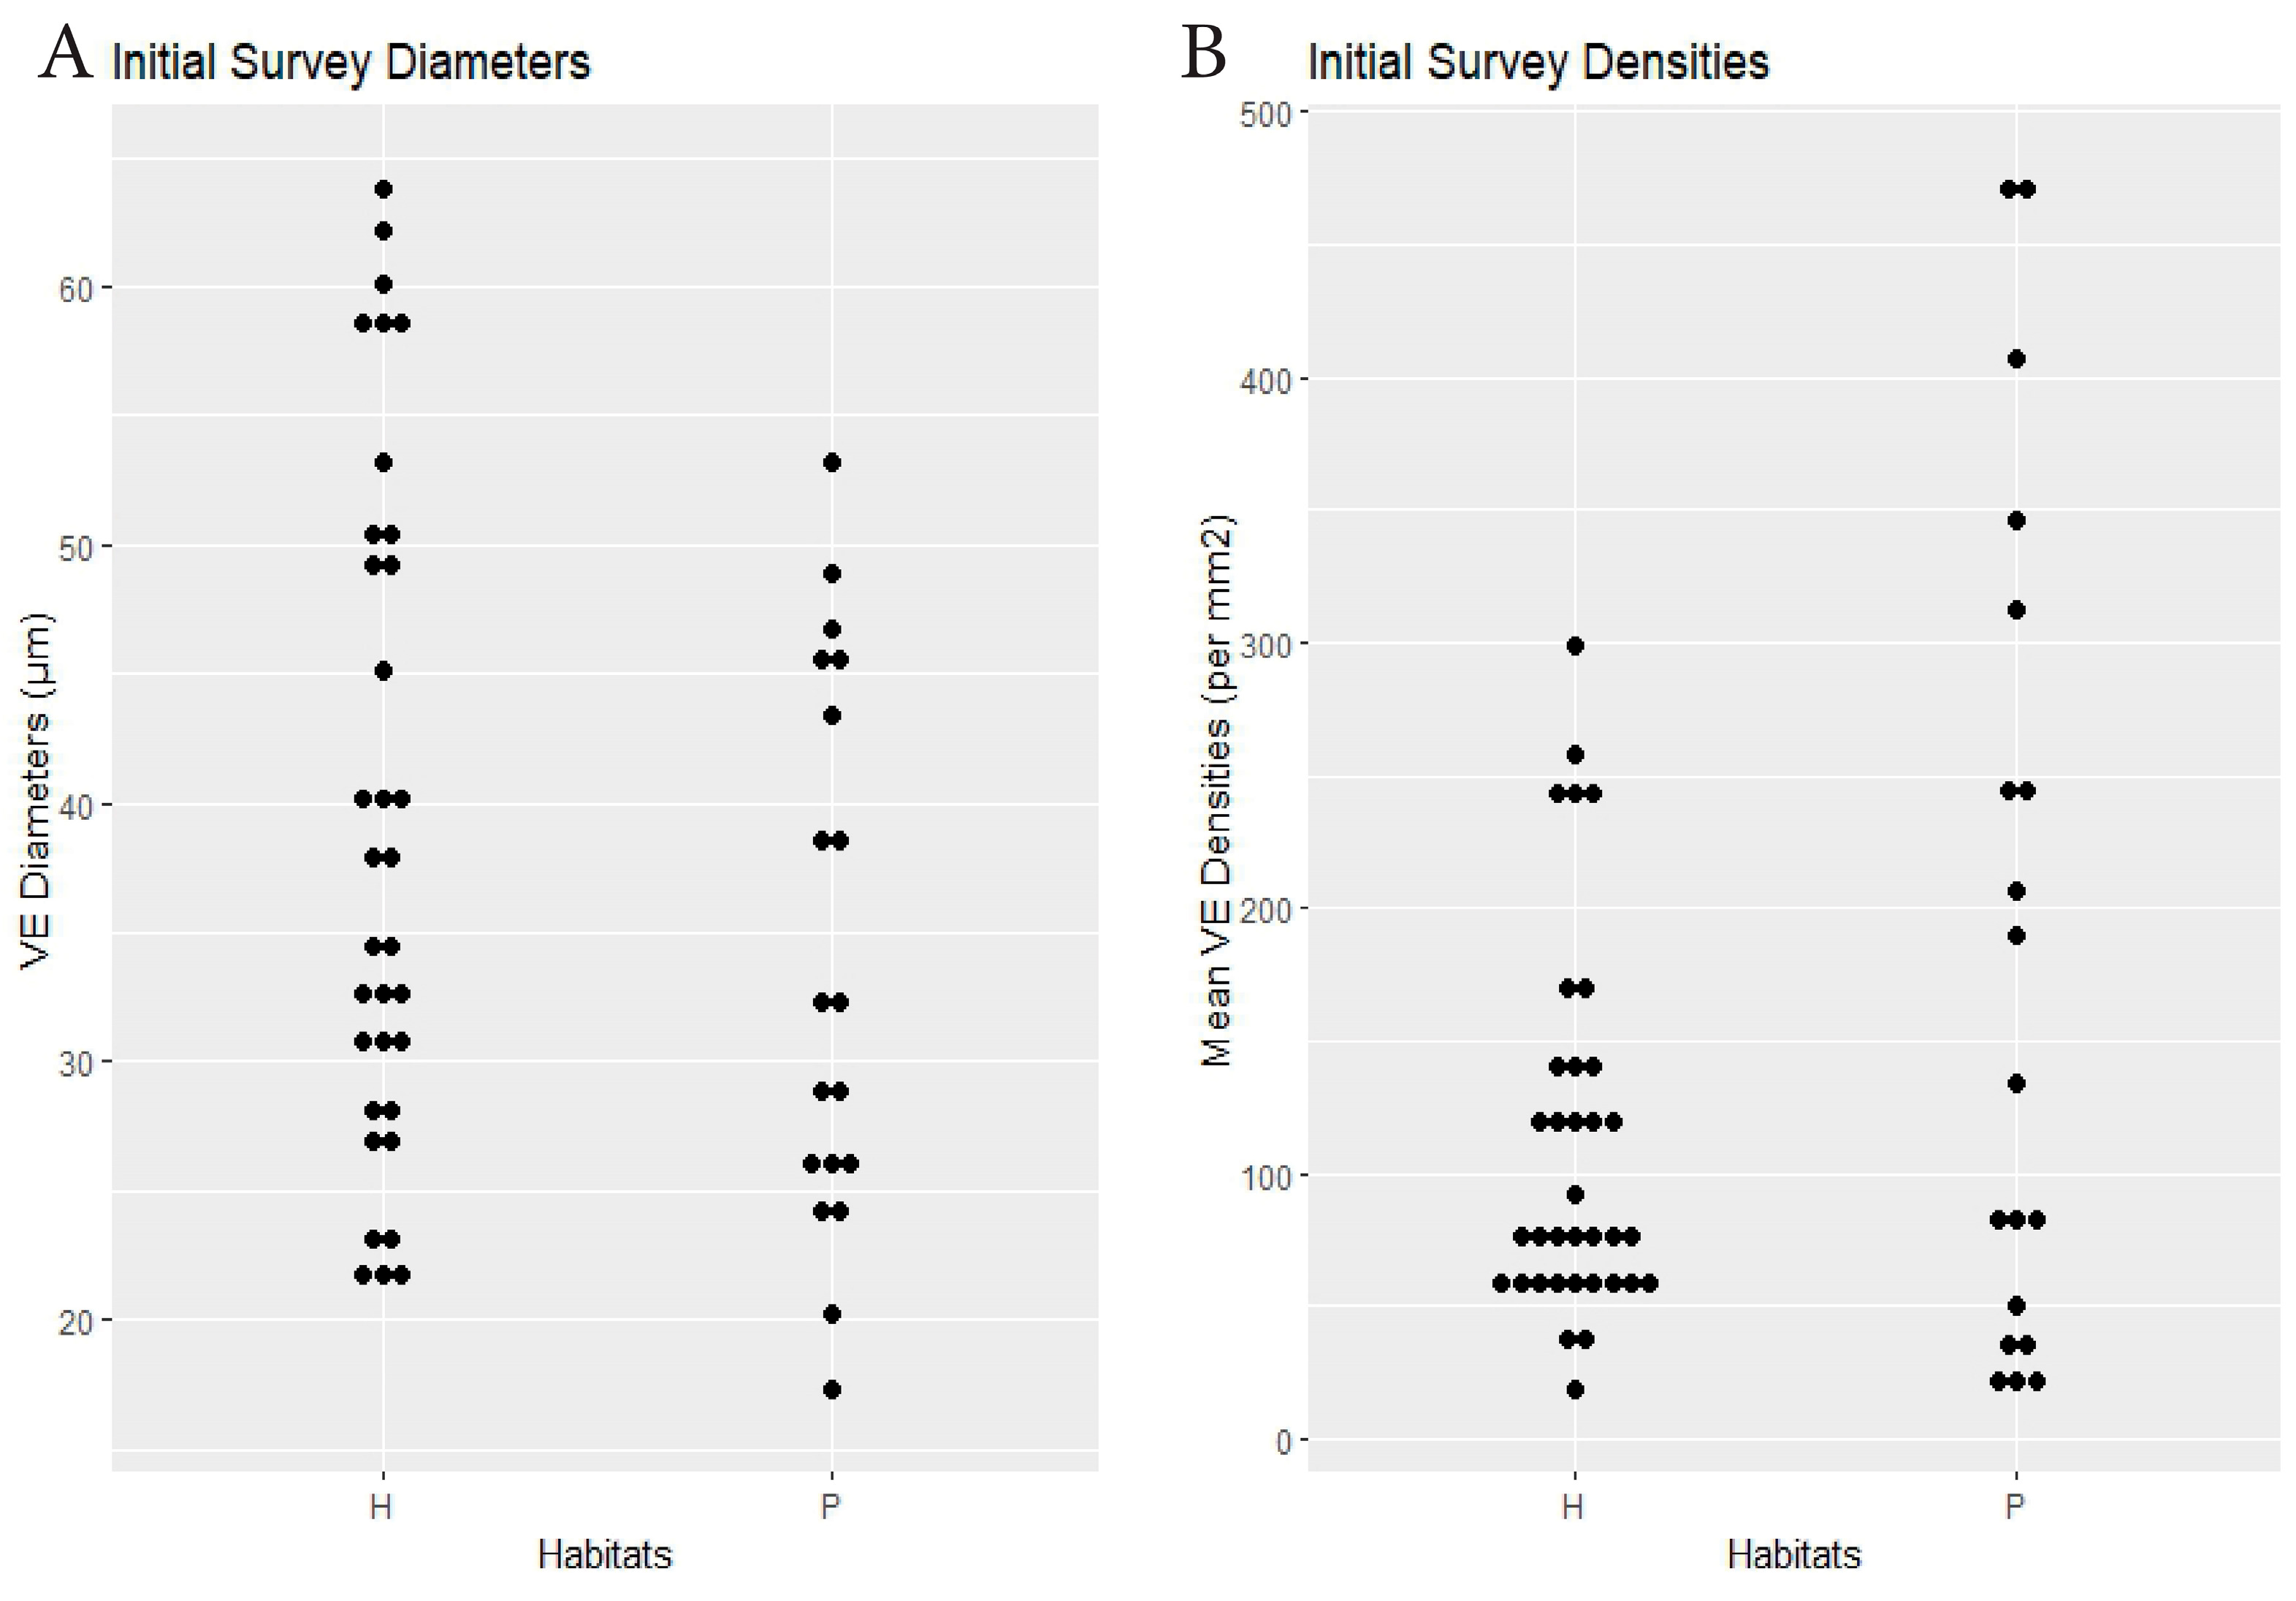
| Initial Survey | 19 spp. × 2 habitats | hammock 38.4 | pineland 34 | 0.13 | hammock 111.7 | pineland 182.4 | 0.041 (see text) | Dens.: 0.83, Diams.: 0.33 (<0.0001) | Figure 2 |
| Repeat Survey | 9 spp. × 2 habitats | NA | NA | NA | hammock 70.6 | pineland 204.8 | 0.0045 | NA | Figure 3 |
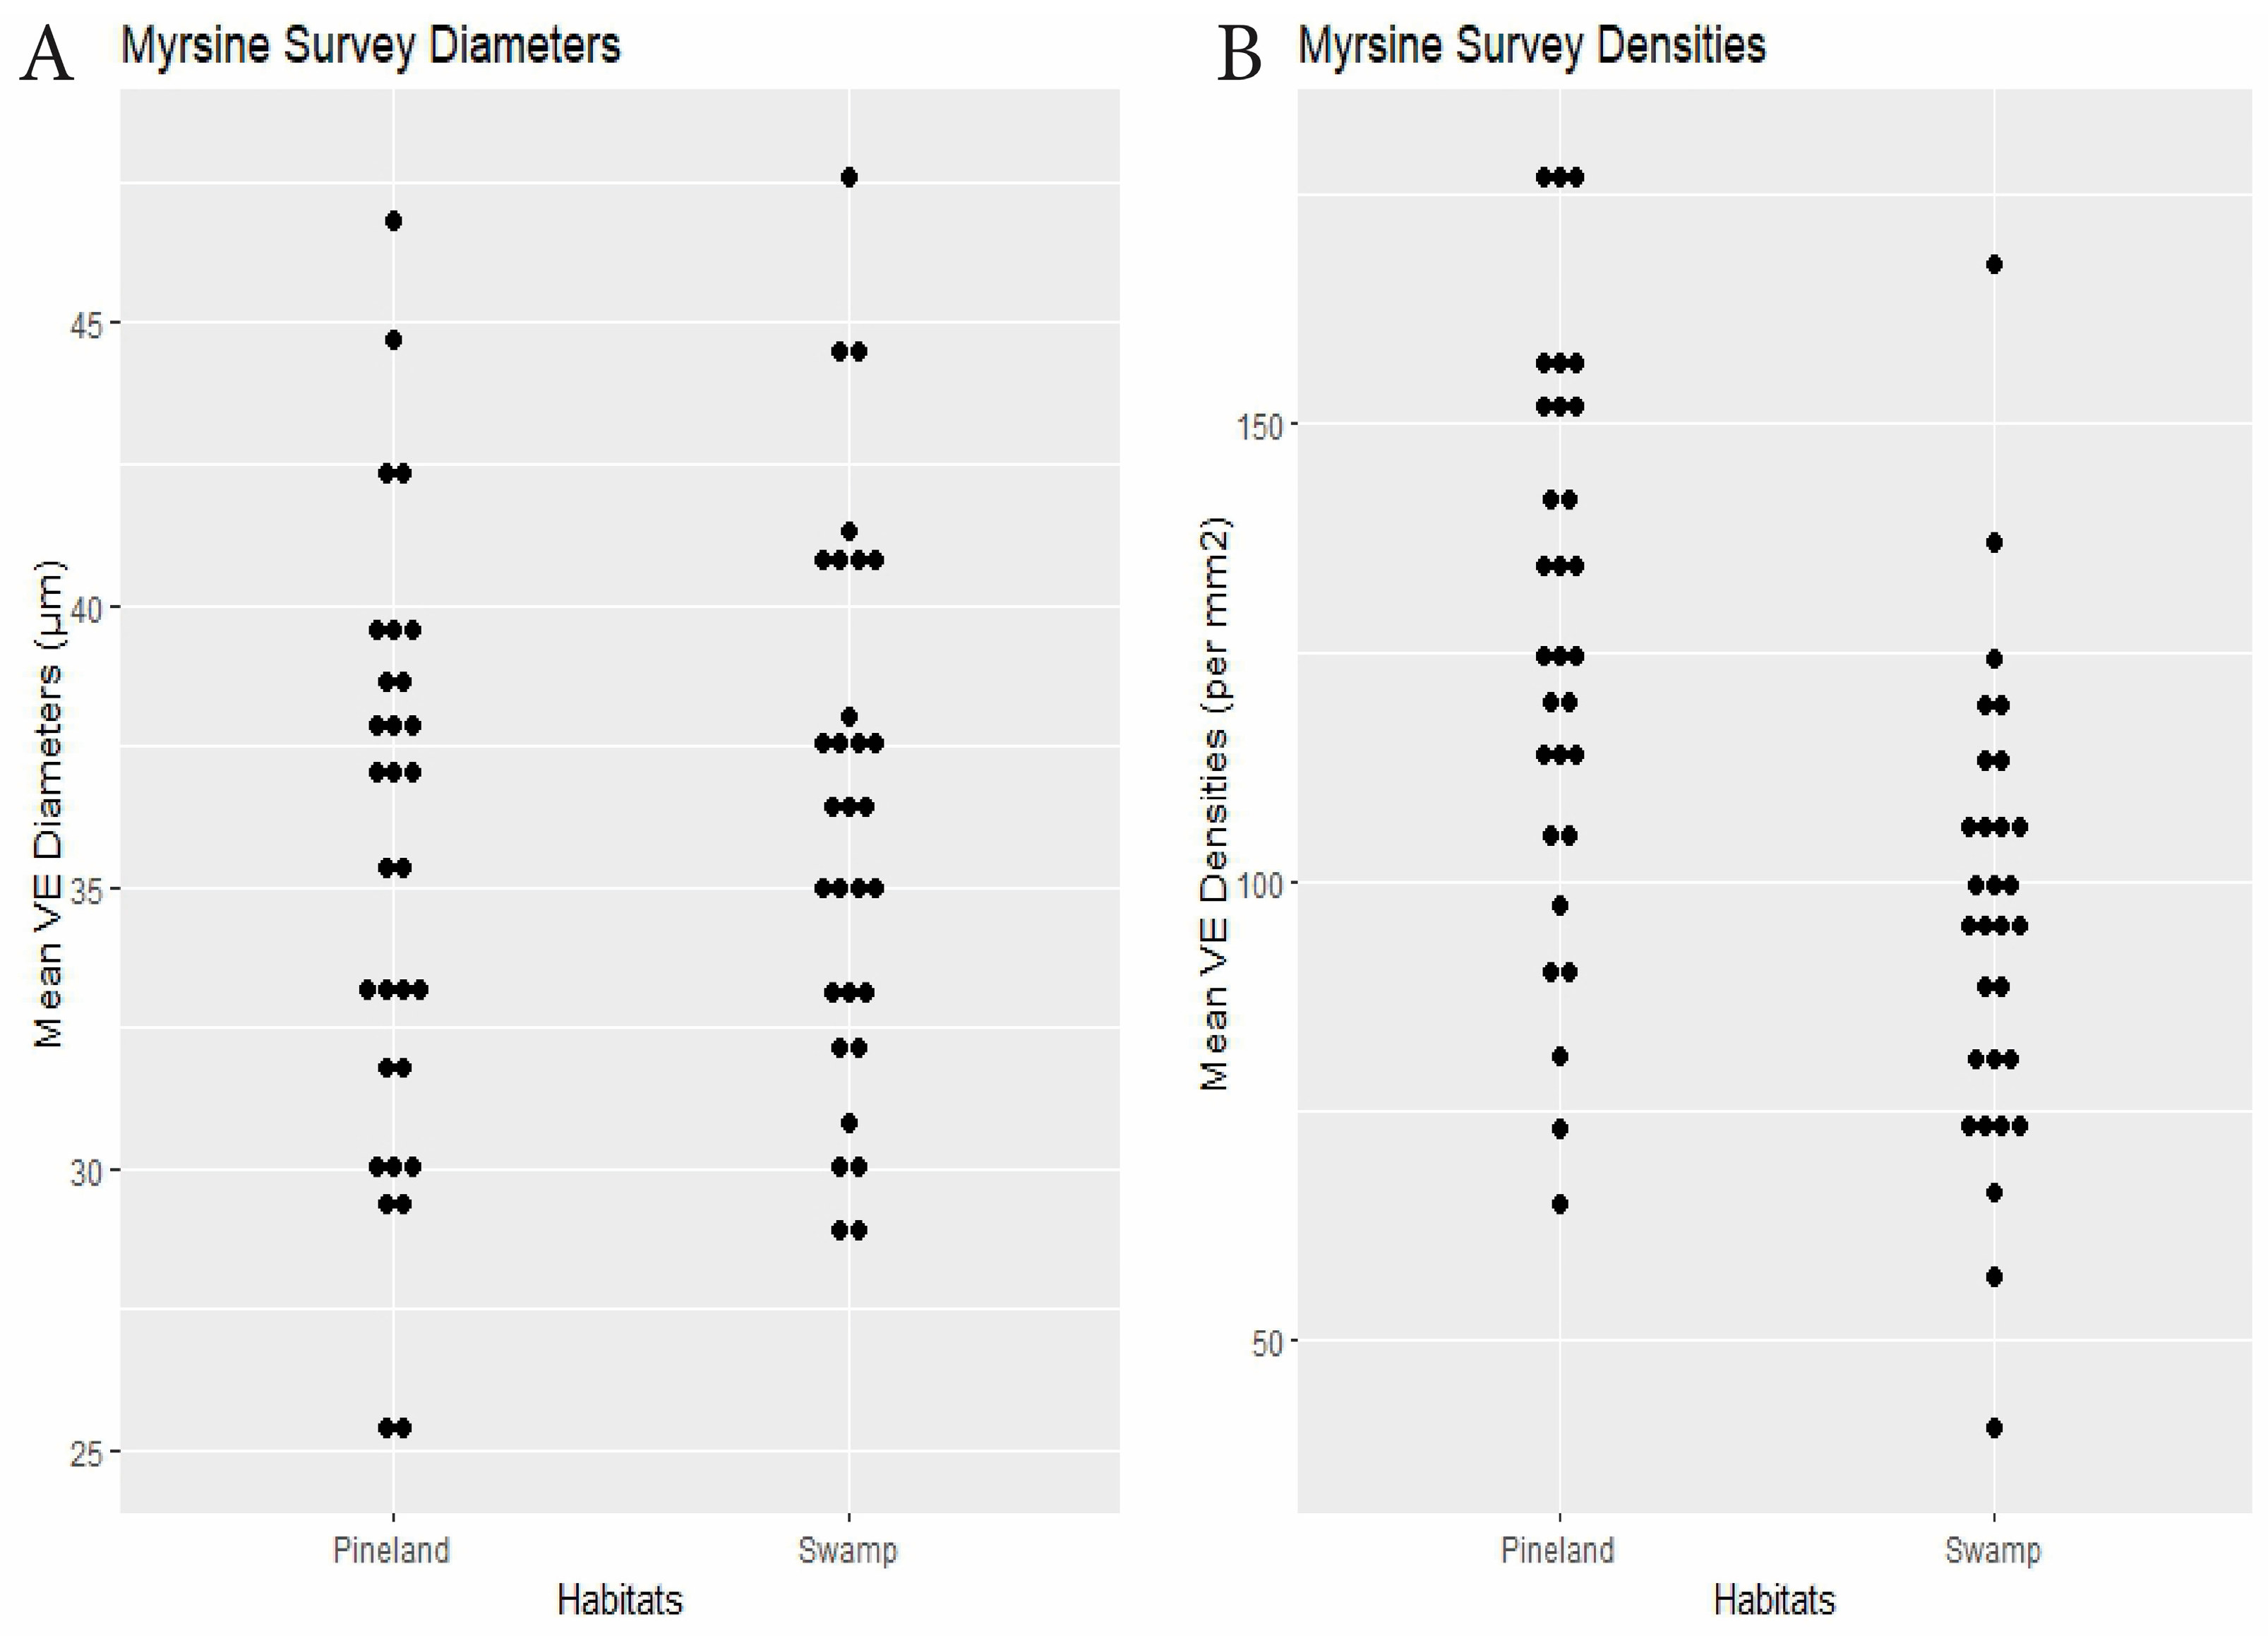
| Myrsine | 30 plants × 2 habitats | swamp 36.4 | pineland 35.5 | 0.24 | swamp 95.7 | pineland 126.7 | <0.0001 | Dens.: 0.28, Diams.: 0.14 (<0.0001) | Figure 4 |
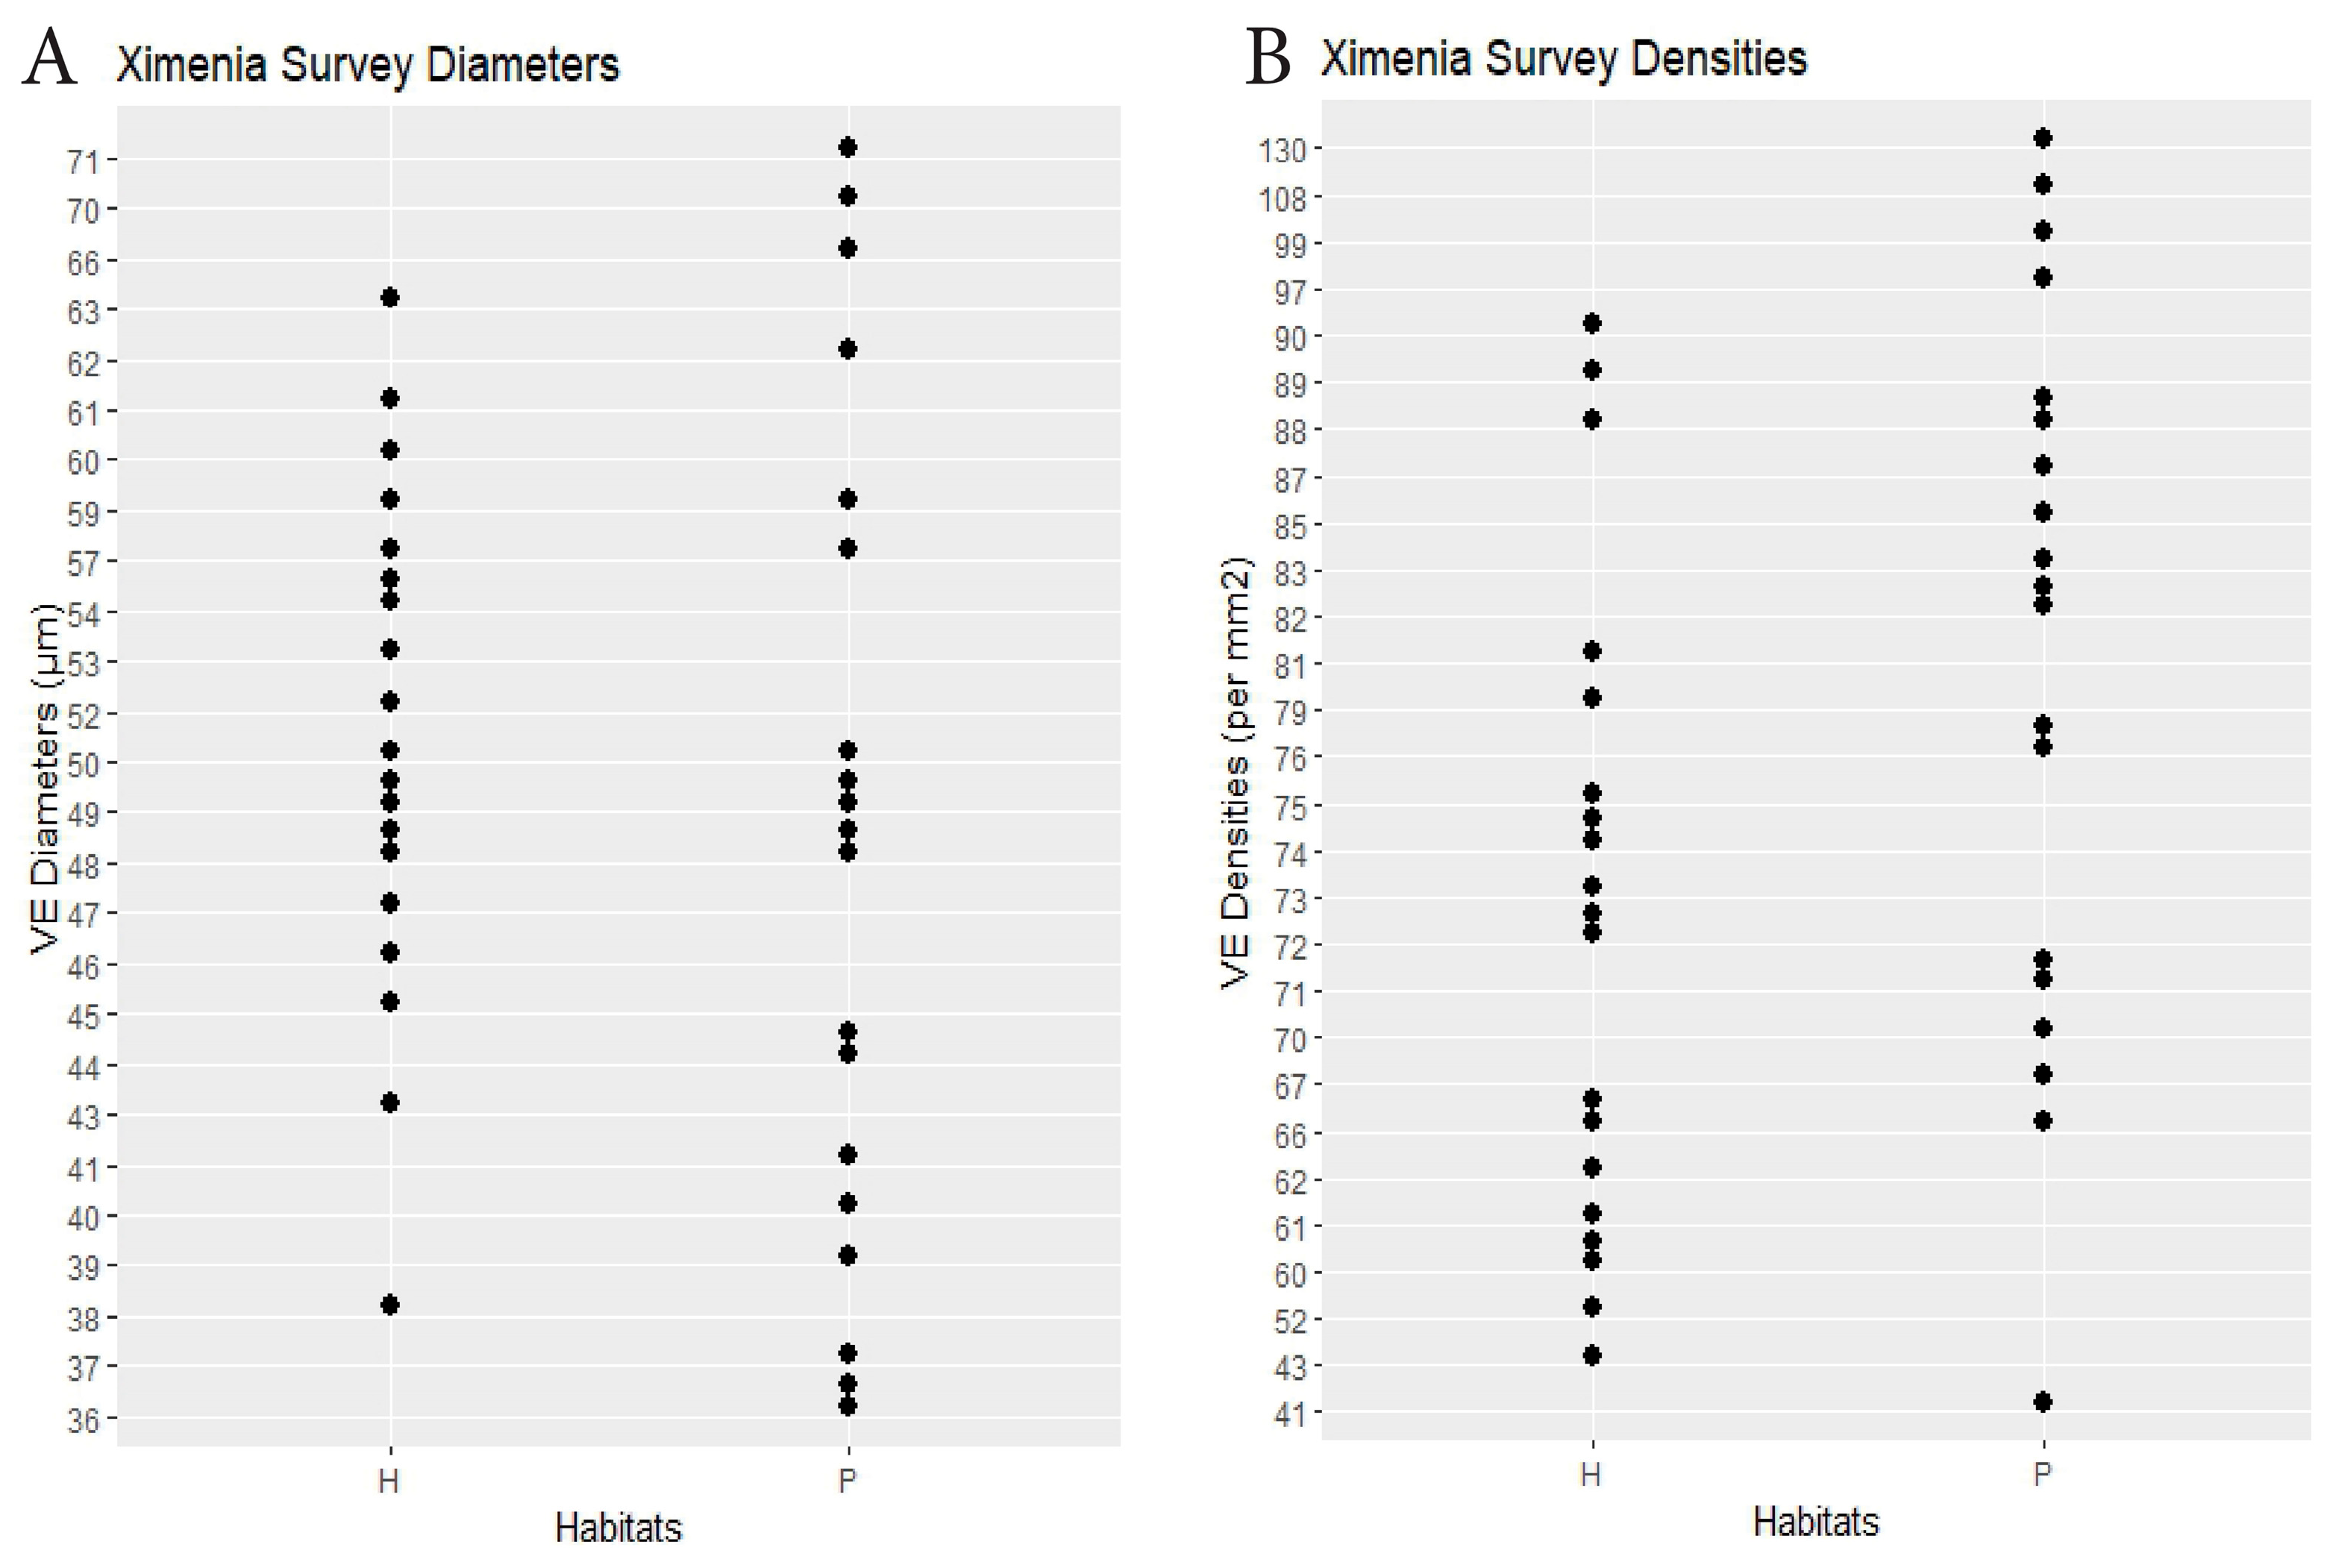
| Ximenia | 19 plants × 2 habitats | hammock 51.8 | scrub 50.3 | 0.32 | hammock 70.8 | scrub 83.0 | 0.01 | Dens.: 0.22, Diams.: 0.18 (0.25) | Figure 5 |
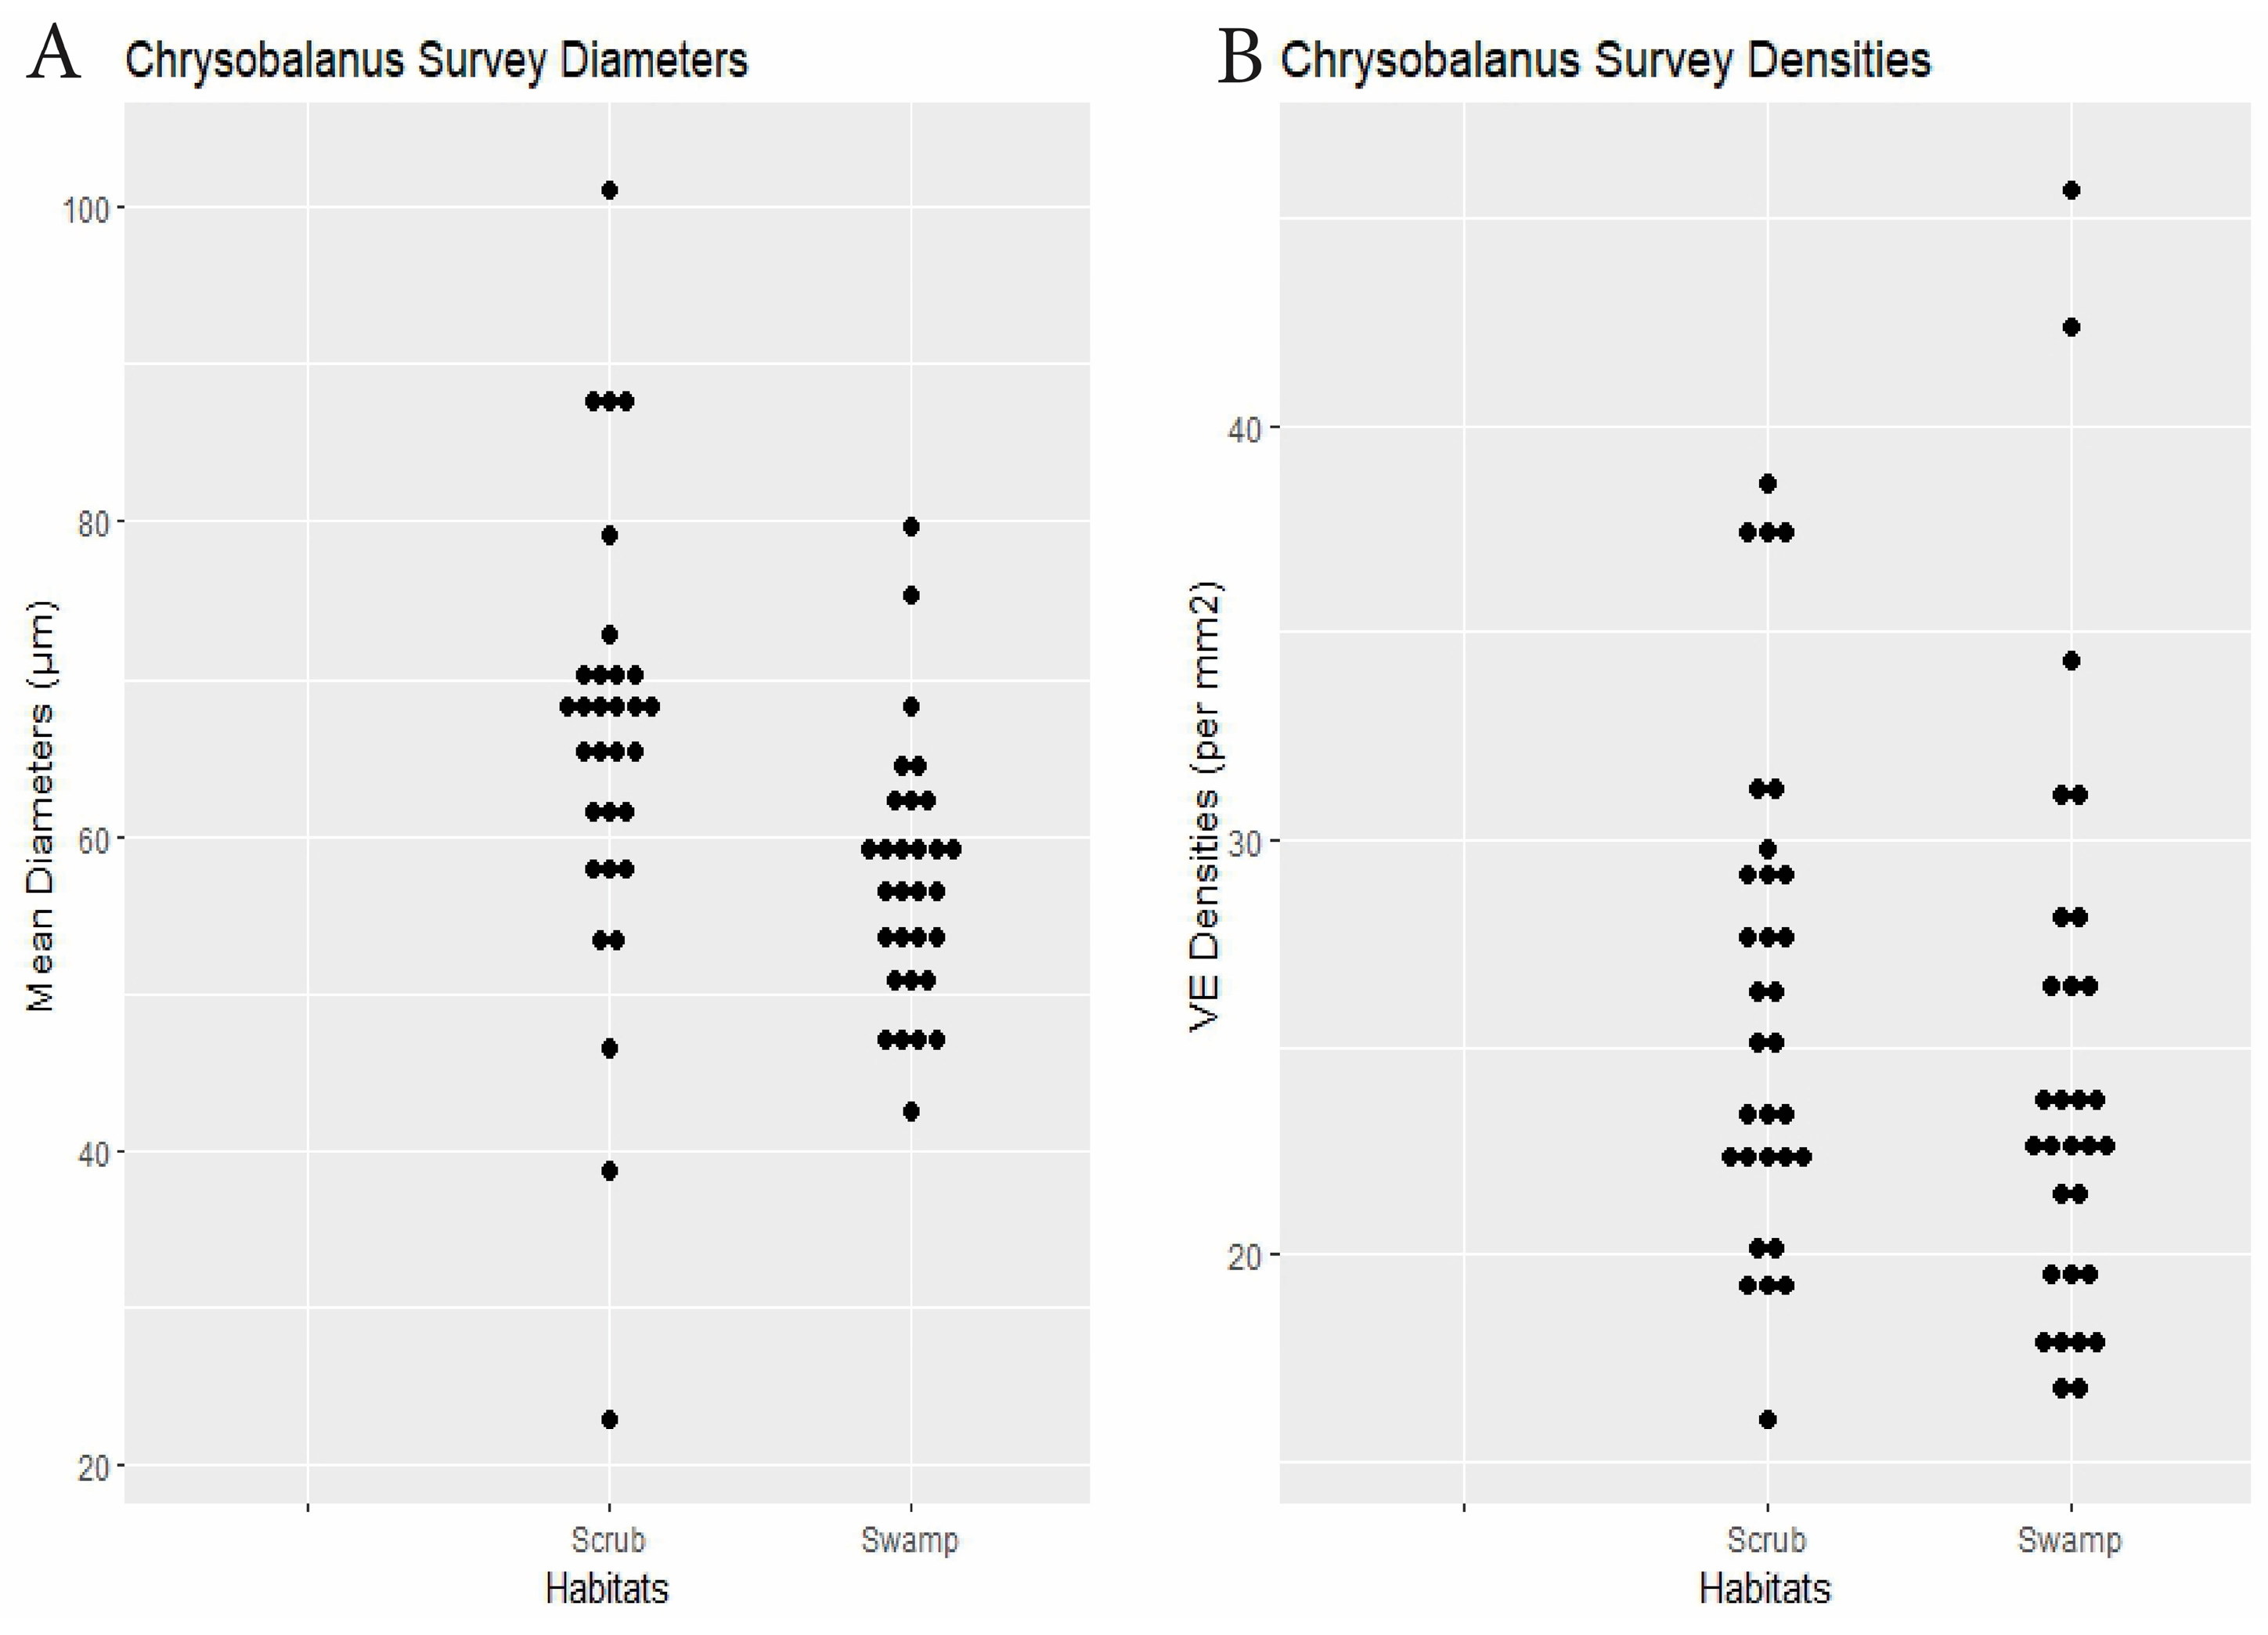
| Chrysobalanus | 30 plants × 2 habitats | swamp 57.3 | scrub 65.9 | 0.0035 | swamp 24.5 | scrub 26.2 | 0.16 | Dens.: 0.24, Diams.: 0.21 0.12) | Figure 6 |
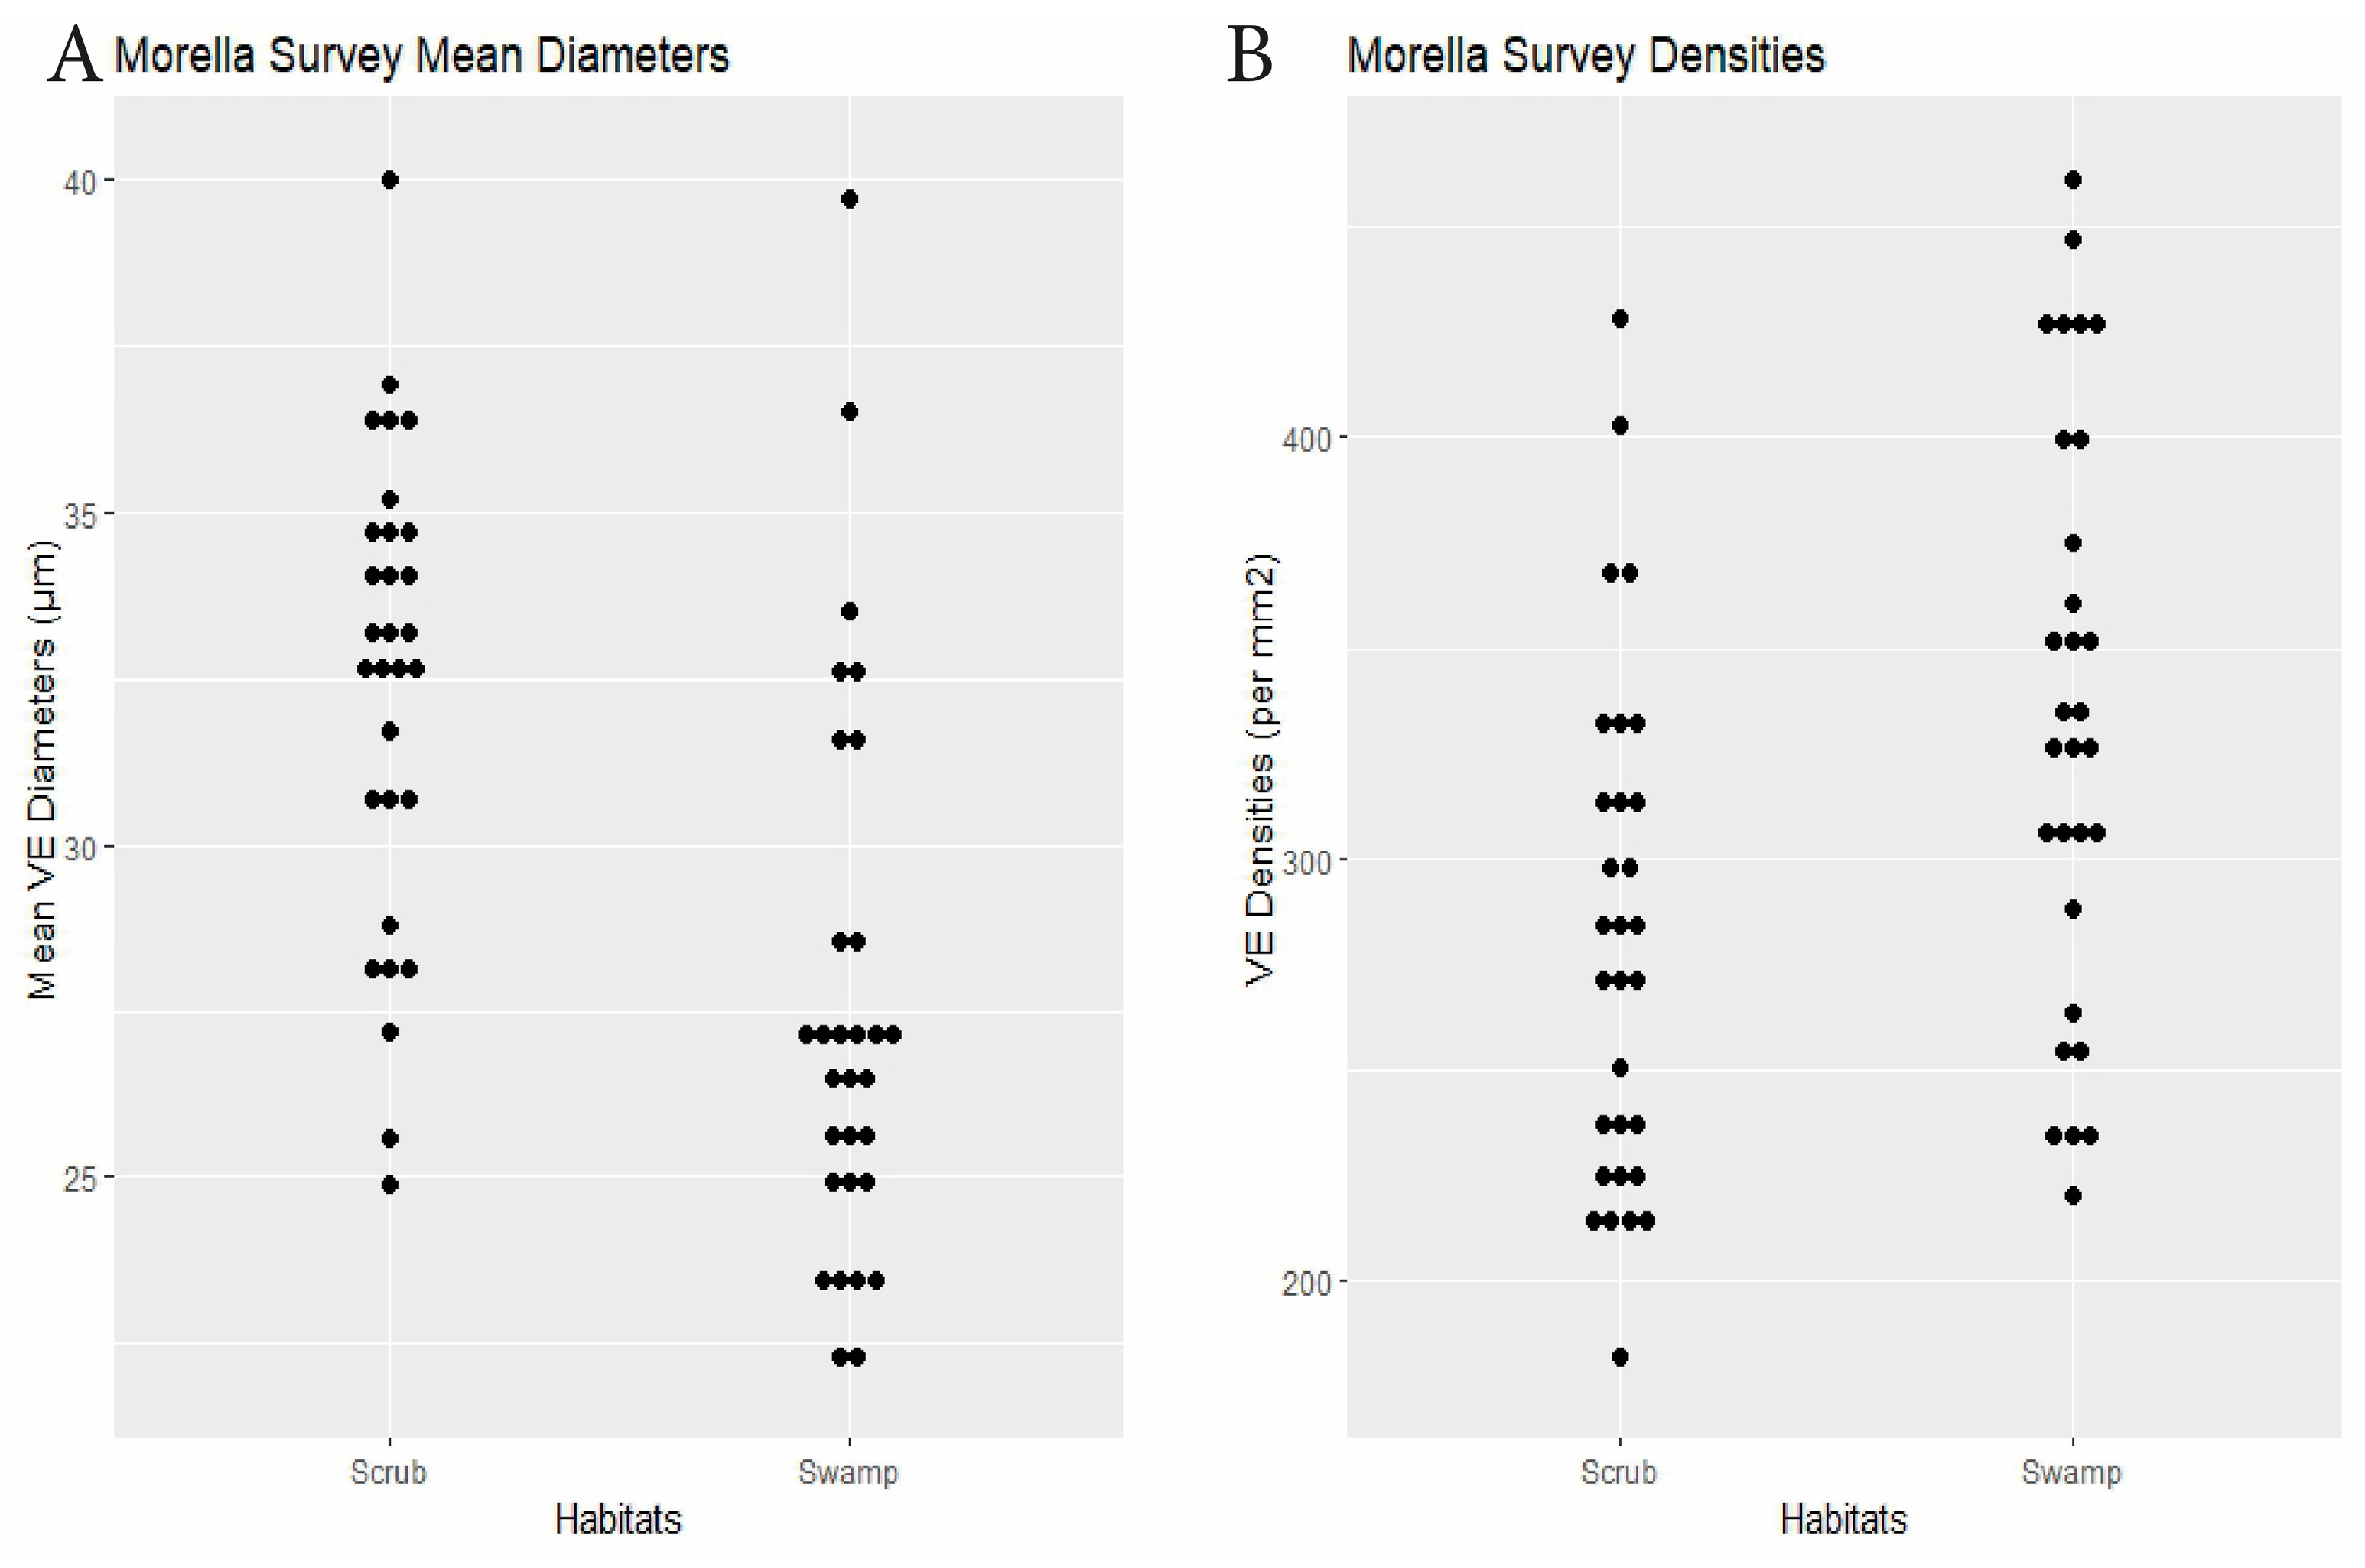
| Morella | 30 plants × 2 habitats | swamp 27.6 | scrub 32.4 | <0.0001 | swamp 335.3 | scrub 281.7 | 0.0014 | Dens.: 0.23, Diams.: 0.15 (0.003) | Figure 7 |

3. Results
3.1. Overview
3.2. With Respect to the Three Research Questions

4. Discussion
5. Conclusions
Supplementary Materials
Funding
Institutional Review Board Statement
Informed Consent Statement
Data Availability Statement
Acknowledgments
Conflicts of Interest
Abbreviations
| Dens. | Density |
| Diams. | Diameters |
| RQ | Research question |
| SM | Supplemental Materials (10.6084/m9.figshare.28661462) |
| Sp | Species (plural spp.) |
| VE | Vessel element (plural Ves) |
References
- Zanne, A.; Westoby, M.; Falster, D.; Ackerly, D.; Loarie, S.; Arnold, S.; Coomes, D. Angiosperm wood structure: Global patterns in vessel anatomy and their relation to wood density and potential conductivity. Am. J. Bot. 2010, 97, 207–215. [Google Scholar] [CrossRef] [PubMed]
- Tyree, M.; Ewers, F. The hydraulic architecture of trees and other woody plants. New Phytol. 1991, 119, 345–360. [Google Scholar] [CrossRef]
- Carlquist, S. Comparative Wood Anatomy, 2nd ed.; Springer: Berlin/Heidelberg, Germany, 2001. [Google Scholar]
- Hacke, U.; Spicer, R.; Shreiber, S.; Plavcova, L. An ecophysiological and developmental perspective on variation in vessel diameter. Plant Cell Environ. 2017, 40, 831–845. [Google Scholar] [CrossRef] [PubMed]
- Carlquist, S.; Hoekman, D. Ecological wood anatomy of the woody Southern California flora. IAWA J. 1985, 6, 319–347. [Google Scholar] [CrossRef]
- Fajardo, A.; Piper, F.; García-Cervigón, A. The intraspecific relationship between wood density, vessel diameter and other traits across environmental gradients. Func. Ecol. 2022, 36, 1585–1598. [Google Scholar] [CrossRef]
- Maiti, R.; Gonzalez Rodriguez, H.; Diaz, J.; Tijerina, H.; Flores, A.; Kumari, A.; Sarkar, N. Comparative wood anatomy of 20 woody plant species in northeastern Mexico and its significance. Int. J. Bio-Resour. Stress Manag. 2016, 7, 229–246. [Google Scholar] [CrossRef]
- Carlquist, S. Non-random vessel distribution in woods: Patterns, modes, diversity, correlations. Aliso 2009, 27, 39–58. Available online: https://scholarship.claremont.edu/aliso/vol27/iss1/4/ (accessed on 15 February 2025). [CrossRef]
- Pratt, R.; Jacobsen, A. Conflicting demands on angiosperm xylem: Tradeoffs among storage, transport and biomechanics. Plant Cell Environ. 2017, 40, 897–913. [Google Scholar] [CrossRef]
- Olson, M. From Carlquist’s ecological wood anatomy to Carlquist’s Law: Why comparative anatomy is crucial for functional xylem biology. Am. J. Bot. 2020, 107, 1328–1341. [Google Scholar] [CrossRef]
- Hacke, U.; Jacobsen, A.; Pratt, R. Vessel diameter and vulnerability to drought-induced embolism: Within-tissue and across-species patterns and the issue of survivorship bias. IAWA J. 2023, 44, 304–319. [Google Scholar] [CrossRef]
- Ewers, F.; Jacobsen, A.; López-Portillo, L. Carlquist’s indices for vulnerability and mesomorphy of wood: Are they relevant today? IAWA J. 2023, 44, 355–367. [Google Scholar] [CrossRef]
- Pfautsch, S.; Harbusch, M.; Wesolowski, A.; Smith, R.; Macfarlane, M.; Tjoelker, M.; Reich, P.; Adams, M. Climate determines vascular traits in the ecologically diverse genus Eucalyptus. Ecol. Lett. 2016, 19, 240–248. [Google Scholar] [CrossRef] [PubMed]
- Carlquist, S. Ecological factors in wood evolution: A floristic approach. Am. J. Bot. 1977, 64, 887–896. [Google Scholar] [CrossRef]
- Baas, P.; Werker, E.; Fahn, A. Some ecological trends in xylem characters. IAWA J. 1983, 4, 141–159. [Google Scholar] [CrossRef]
- Wheeler, E.; Baas, P.; Rodgers, S. Variations in dicot wood anatomy: A global analysis based on the Insidewood database. IAWA J. 2007, 28, 229–258. [Google Scholar] [CrossRef]
- Jacobsen, A.; Pratt, R.; Tobin, M.; Hacker, U.; Ewers, F. A global analysis of xylem vessel length in woody plants. Am. J. Bot. 2012, 99, 1583–1591. [Google Scholar] [CrossRef]
- Baas, P.; Carlquist, S. A comparison of the ecological wood anatomy of the floras of southern California and Israel. IAWA J. 1985, 6, 349–353. [Google Scholar] [CrossRef]
- Sonsin, J.; Gasson, P.; Barros, C.; Marcati, C. A comparison of the wood anatomy of 11 species from two cerrado habitats (cerrado s.s. and adjacent gallery forest). Bot. J. Linn. Soc. 2012, 170, 257–276. [Google Scholar] [CrossRef]
- Woodcock, D.; Dos Santos, G.; Reynel, C. Wood characteristics of Amazon forest types. IAWA J. 2000, 2, 277–292. [Google Scholar] [CrossRef]
- Fichtler, E.; Worbes, M. Wood anatomical variables in tropical trees and their relation to site conditions and individual tree morphology. IAWA J. 2012, 33, 119–140. [Google Scholar] [CrossRef]
- Oladi, R.; Bräuning, A.; Pourtahmasi, K. “Plastic” and “static” behavior of vessel-anatomical features in Oriental beech (Fagus orientalis Lipsky) in view of xylem hydraulic conductivity. Trees 2014, 28, 493–502. [Google Scholar] [CrossRef]
- US Climate Data. 2025. Available online: https://www.usclimatedata.com/climate/west-palm-beach/florida/united-states/usfl0512 (accessed on 1 February 2025).
- Brown, R.; Stone, E.; Carlisle, V. Soils. Ecosystems of Florida; Myers, R., Ewel, J., Eds.; University Press of Florida: Orlando, FL, USA, 1990; pp. 35–69. [Google Scholar]
- USSCC (United States Soil Conservation Service); Soil Science Department, University of Florida. General Soil Map, Palm Beach County Area, Florida; The Service: Washington, DC, USA, 1976; Map Retrieved from the Library of Congress. Available online: https://www.loc.gov/item/79695191/ (accessed on 26 January 2025).
- Grime, J. Plant Strategies, Vegetation Processes, and Ecosystem Properties, 2nd ed.; Wiley: Hoboken, NJ, USA, 2001. [Google Scholar]
- Teo, S. Root hemi-parasitism in Malayan Olacaceae. Gardens’ Bul. 1997, 4, 7–13. [Google Scholar]
- Carlquist, S. Ecological Strategies of Xylem Evolution; University of California Press: Oakland, CA, USA, 1975. [Google Scholar]
- Choat, B.; Jansen, S.; Brodribb, T.; Cochard, H.; Delzon, S.; Bhaskar, R.; Bucci, S.; Feild, T.; Gleason, S.; Hacke, U.; et al. Global convergence in the vulnerability of forests to drought. Nature 2012, 491, 752–755. [Google Scholar] [CrossRef] [PubMed]
- Abrahamson, W.; Hartnett, D. Pine flatwoods and dry prairies. In Ecosystems of Florida; Myers, R., Ewel, J., Eds.; University of Central Florida Press: Orlando, FL, USA, 1990; pp. 103–149. [Google Scholar]
- Chen, S.; Tusscher, K.; Sasidharan, R.; Dekker, S.; de Boer, H. Parallels between drought and flooding: An integrated framework for plant eco-physiological responses to water stress. Plant-Environ. Interact. 2023, 4, 175–187. [Google Scholar] [CrossRef] [PubMed] [PubMed Central]
- Long, R.; Lakela, O. A Flora of Tropical Florida; University of Miami Press: Coral Gables, FL, USA, 1971. [Google Scholar]
- Small, J. Manual of the Southeastern Flora; University of North Carolina Press: Chapel Hill, NC, USA, 1933. [Google Scholar]
- Wunderlin, R.; Hansen, B. Guide to the Vascular Plants of Florida, 3rd ed.; University Press of Florida: Gainesville, FL, USA, 2011. [Google Scholar]
- Reuter, M. Image Analysis: Dot Count. 2012. Available online: http://reuter.mit.edu/software/dotcount/ (accessed on 6 February 2025).
- R Core Team. A Language and Environment for Statistical Computing; R Foundation for Statistical Computing: Vienna, Austria, 2024; Available online: https://www.R-project.org/ (accessed on 22 January 2025).
- Bello, F.; Carmona, C.; Dias, A.; Gotzenberger, L.; Moretti, M.; Berg, M. Handbook of Trait-Based Ecology. From Theory to R Tools; Cambridge University Press: Cambridge, UK, 2021. [Google Scholar]
- Galbraith, S.; Daniel, J.; Vissel, B. A Study of clustered data and approaches to its analysis. J. Neurosci. 2010, 30, 10601–10608. [Google Scholar] [CrossRef]
- Siegel, A.; Castellan, N. Nonparametric Statistics for the Behavioral Sciences, 2nd ed.; McGraw-Hill Humanities: New York, NY, USA, 1988. [Google Scholar]
- Christensen, W.; Zabriskie, B. When your permutation test is doomed to fail. Am. Stat. 2021, 76, 53–63. [Google Scholar] [CrossRef]
- Aw, A. flintyR: Flexible and Interpretable Non-Parametric Tests of Exchangeability, R Package Version 0.0.2. 2022. Available online: https://alanaw1.github.io/flintyR/ (accessed on 5 February 2025).
- Marwick, B.; Krishnamoorthy, K. cvequality: Tests for the Equality of Coefficients of Variation from Multiple Groups, R Software Package Version 0.1.3. 2019. Available online: https://github.com/benmarwick/cvequality (accessed on 28 January 2025).
- USACE (US Army Corp of Engineers). National Wetland Plant List. Atlantic and Gulf Coastal Plain Region. 2022. Available online: https://nwpl.sec.usace.army.mil/download/ (accessed on 8 January 2024).
- FDEP. Florida Department of Environmental Protection. Chapter 62–340, F.A.C. Data Form Guide2018. 2021. Available online: https://floridadep.gov/water/submerged-lands-environmental-resources-coordination/documents/ch-62-340-fac-data-form-guide (accessed on 5 February 2025).
- Tng, D.; Apgaua, D.; Ishida, Y.; Mencuccini, M.; Lloyd, J.; Laurance, W.; Laurance, S. Rainforest trees respond to drought by modifying their hydraulic architecture. Ecol. Evol. 2018, 8, 12479–12491. [Google Scholar] [CrossRef]
- Wheeler, E.; Gasson, P.; Baas, P. Using the InsideWood web site: Potentials and pitfalls. J. Am. Water Work. Assoc. 2020, 41, 412–462. [Google Scholar] [CrossRef]
Disclaimer/Publisher’s Note: The statements, opinions and data contained in all publications are solely those of the individual author(s) and contributor(s) and not of MDPI and/or the editor(s). MDPI and/or the editor(s) disclaim responsibility for any injury to people or property resulting from any ideas, methods, instructions or products referred to in the content. |
© 2025 by the author. Licensee MDPI, Basel, Switzerland. This article is an open access article distributed under the terms and conditions of the Creative Commons Attribution (CC BY) license (https://creativecommons.org/licenses/by/4.0/).
Share and Cite
Rogers, G.K. Variation in Vessel Element Diameters and Densities Across Habitats at the Community and Species Levels in Southeast Florida. Biology 2025, 14, 391. https://doi.org/10.3390/biology14040391
Rogers GK. Variation in Vessel Element Diameters and Densities Across Habitats at the Community and Species Levels in Southeast Florida. Biology. 2025; 14(4):391. https://doi.org/10.3390/biology14040391
Chicago/Turabian StyleRogers, George King. 2025. "Variation in Vessel Element Diameters and Densities Across Habitats at the Community and Species Levels in Southeast Florida" Biology 14, no. 4: 391. https://doi.org/10.3390/biology14040391
APA StyleRogers, G. K. (2025). Variation in Vessel Element Diameters and Densities Across Habitats at the Community and Species Levels in Southeast Florida. Biology, 14(4), 391. https://doi.org/10.3390/biology14040391