Article

Effects of Water Temperature and Photoperiod on the Antioxidant Status and Intestinal Microbiota in Larval Spotted Mandarin Fish, Siniperca scherzeri, in the Yalu River

1
College of Fisheries, Chinese Perch Research Center, Huazhong Agricultural University, Wuhan 430070, China
2
Engineering Research Center of Green Development for Conventional Aquatic Biological Industry in the Yangtze River Economic Belt, Ministry of Education, Wuhan 430070, China
3
College of Marine Science Technology and Environment, Dalian Ocean University, Dalian 116023, China
4
Center for Marine Ranching Engineering Science Research of Liaoning, Dalian Ocean University, Dalian 116023, China
5
College of Fisheries and Life Science, Dalian Ocean University, Dalian 116023, China
6
School of Life Sciences, Liaoning University, Shenyang 110036, China
7
The First Clinical College, China Medical University, Shenyang 110122, China
*
Author to whom correspondence should be addressed.
Biology 2025, 14(10), 1400; https://doi.org/10.3390/biology14101400
Submission received: 1 September 2025 / Revised: 25 September 2025 / Accepted: 7 October 2025 / Published: 13 October 2025
(This article belongs to the Special Issue Global Fisheries Resources, Fisheries, and Carbon-Sink Fisheries)

Abstract

Simple Summary

The spotted mandarin fish, Siniperca scherzeri, is a common artificially farmed species in northern China. Due to the destruction of the ecological environment and overfishing, the wild resources of S. scherzeri have gradually decreased and can no longer meet the market demand. Therefore, farming mandarin fish can meet greater market demand. This study investigated the effects of light duration and water temperature variation during mandarin fish farming on hepatic antioxidant capacity and intestinal microbiota, aiming to provide data references for its cultivation.

Abstract

Antioxidant capacity and intestinal microbiota play a crucial role in the nutrition, immunity, and overall health status of fish. It is significant to understand the impact of environmental changes on the health of Siniperca scherzeri, an important breeding species. Therefore, in order to investigate the effects of photoperiod (8L: 16D, 12L: 12D and 16L: 8D) and water temperature (18 and 28 °C) on the antioxidant capacity and intestinal microorganisms of S. scherzeri, liver and intestinal samples from cultured juvenile S. scherzeri were collected for related analyses. The photoperiod group of 12L: 12D and the water temperature group of 18 °C presented a higher abundance of Malondialdehyde (MDA) and lower abundances of Superoxide dismutase (SOD), Glutathione peroxidase (GSH-Px), and Catalase (CAT) than other groups (p < 0.05). No significant difference in intestinal microbial diversity was found among different groups (p > 0.05), except that the ACE index showed significant differences among different temperature groups (p < 0.05). Significant differences in the relative abundances of Proteobacteria and Tenericutes were found among different groups (p < 0.05). Modifying the duration of light exposure could effectively mitigate oxidative reactions and optimal high temperatures could suppress oxidation in juvenile S. scherzeri. However, these conditions also influenced the feeding behavior of juvenile S. scherzeri and the composition of intestinal microbiota and promoted the proliferation of opportunistic bacteria. The study provides the valuable data of the aquatic habitat of S. scherzeri.

1. Introduction

Environmental factors, such as stocking density, salinity, water temperature, photoperiod, and light, largely affect the growth and development of aquatic organisms [1,2]. Among these, water temperature is an important abiotic environmental variable and affects the adaptation of animals to the environment [3]. When water temperature is within the appropriate range for aquaculture, the food intake, metabolism rate, and growth rate of fish increase [4]. Once water temperature is beyond this range, the food intake, metabolism rate, and growth rate of fish decrease, and fish may even die [5,6]. In the breeding process, an accurate range of suitable water temperature is required for fish to accelerate growth, shorten the breeding period, save costs, and improve survival rate and yield at various stages [7]. In addition, the increase in water temperature causes the concentration of dissolved oxygen in water to decrease and changes the structure and number of phytoplankton and animals and the habitat of fish [8,9].
Similarity to water temperature, photoperiod also affects the growth, feeding, development, and spawning of fish [10]. The optimization of an artificial light regime can accelerate fish growth [11]. The flexibility of artificial lighting allows for various growth environments of a wide range of cultured species [12]. It was reported that light had significant influences on physiological stress in fish cultures, such as faster growth induced by an increased light duration, the enhanced immune system of fish by specific wavelengths of light, and reduced stress levels [13,14,15]. The photoperiod is one of the most critical characteristics of the light environment. An inappropriate photoperiod may lead to the production of reactive oxygen species (ROS) at varying levels, thereby inducing oxidative stress [15,16]. In addition, Gao et al. found that under both blue and white light conditions, the activities of these enzymes at a 16L: 8D photoperiod were significantly lower than those at a 12L: 12D photoperiod, suggesting that extended light exposure increased antioxidant enzyme activity [17].
The sustainable development of the aquaculture industry plays a crucial strategic role in ensuring global animal protein supply and promoting rural economic development. Siniperca scherzeri is an important and valuable freshwater benthic carnivorous fish species throughout the inland waters of China, the Korean Peninsula, and Vietnam [18,19]. S. scherzeri is one of the most important fish exported to China due to its tender meat, rich nutrition, and zero intermuscular spines [20]. In recent years, due to the destruction of the ecological environment and overfishing, the wild resources of S. scherzeri have gradually decreased and can no longer meet the market demand [20]. Compared with Siniperca chuatsi and Siniperca kneri, S. scherzeri has a smaller body and slower growth rate [21]. Therefore, the supply of natural seedstock alone is insufficient to fully meet market demands [22]. However, against the backdrop of the gradual popularization of intensive aquaculture practices, health issues in fish caused by improper regulation of environmental factors have become increasingly prominent. Among the numerous environmental factors, light and temperature are fundamental and highly variable physical parameters that persist throughout the entire aquaculture cycle, profoundly influencing the physiological rhythms, metabolic rates, and stress responses of fish [23,24]. Therefore, in-depth investigation into the mechanisms through which light and temperature affect the physiological health of mandarin fish is a critical scientific issue that must be addressed to achieve healthy and efficient aquaculture.
The oxidative stress of S. scherzeri was analyzed by investigating four key antioxidants, and the responses in the livers of S. scherzeri to warm and cold temperatures combined with different photoperiods were compared in this study. In addition, the relationships between environmental microbial communities and gut microbiota were investigated with 16S rRNA sequencing technology in order to reveal the relationships between fish diseases and environmental microbes based on different water temperatures and photoperiods.

2. Materials and Methods

2.1. Experimental Design and Breeding Management

The experimental larvae were artificially bred from mandarin fish in the Yalu River, and fertilized eggs were hatched in the hatching bucket. On Day 1, larval fish were randomly divided into five groups. Each group had three replicates, and every replicate contained 50 larval fish. Larvae were cultured in transparent basins (6 L) with aerated water. During the experiment, the larval fish were fed with the suitable size of zebrafish three times a day. The water was replaced three times a day to remove food residues and feces. The pH value was 7.53 to 7.70. The dissolved oxygen concentration was 8.5 to 8.9 mg/L. Samples were ready for experimentation after 20 days of incubation.
Among the five groups, three groups were set as photoperiod groups and two groups were set as water temperature groups. For the photoperiod groups, three photoperiods (8L: 16D, 12L: 12D and 16L: 8D (L: Light, D: Dark)) were set, with 25 ± 0.5 °C temperature of breeding water. In the two water temperature groups, water temperature was, respectively, set at 18 °C and 28 °C, with natural daylight hours. Heating rods were used to control ambient water temperature.
Three samples of juvenile S. scherzeri were randomly selected from each group after 20 days of different treatments. The fish were anesthetized and then euthanized. Samples were dissected under sterile conditions on a biological safety cabinet. The intestinal contents were carefully extruded using a sterilized glass rod. Liver and intestinal contents were aseptically collected and immediately placed into pre-sterilized 1.5 mL EP tubes, with each tube labeled with the corresponding sample ID. All extracts were rapidly frozen and stored at −80 °C for subsequent experiments.

2.2. Ethical Approval

Our research was approved by the Animal Ethics Committee of Dalian Ocean University (Permit Number: DLOU2023008, 8 August 2023) and performed in accordance with the relevant institutional and national guidelines, and the manuscript conforms with the ARRIVE Guidelines for Reporting Animal Research.

2.3. Analysis of Oxidative Stress Parameters

Livers were rinsed with pre-cooled normal saline, blotted dry with filter paper, and then homogenized in a pre-chilled glass homogenizer. The levels of Malondialdehyde (MDA) (Cat. No. A003-1), superoxide dismutase (SOD) (Cat. No. A001-1), glutathione peroxidase (GSH-Px) (Cat. No. A005), and catalase (CAT) (Cat. No. A007-1) were analyzed by related kits according to corresponding instructions (Nanjing Jiancheng Bioengineering Institute, Nanjing, China).

2.4. Extraction and Sequencing of Microbial DNA

Microbial DNA was extracted from the intestinal contents of S. scherzeri samples using the method described in the E.Z.N.A.® Bacteria DNA Kit (Omega Bio-Tek, Norcross, GA, USA). The concentration of DNA was measured (Synergy™ HTX Multiscan spectrum, BioTek, Winooski, VT, USA), and its integrity was assessed via agarose gel electrophoresis. Sequencing adapters were ligated to the primer ends, followed by PCR amplification. The resulting PCR products were then purified, quantified, and normalized to construct the sequencing library. The constructed libraries first underwent quality control checks. Libraries that passed the quality control were sequenced on the Illumina NovaSeq 6000 (Illumina, Inc., San Diego, CA, USA). The V1-V3 regions of 16S rRNA gene were amplified. Universal primers were F (5′-GGACTACHVGGGTWTCTAAT-3′) and R (5′-ACTCCTACGGGAGGCAGCA-3′). The sequencing data (ID PRJNA1333706) generated in this study have been deposited in the Sequence Read Archive (SRA) of the National Center for Biotechnology Information (NCBI) (http://www.ncbi.nlm.nih.gov/, accessed on 25 September 2025). Raw image data files obtained from high-throughput sequencing were converted into raw sequenced reads through base calling analysis. The results are stored in FASTQ files, which contain both the sequence information and the corresponding quality scores.

2.5. Processing of Sequencing Data

The raw data were first subjected to quality filtering using Trimmomatic (version 0.33), followed by the identification and removal of primer sequences with Cutadapt (version 1.9.1). The paired-end reads were then assembled, and chimeras were removed using USEARCH (version 10) with the UCHIME algorithm (version 8.1), resulting in high-quality sequences for subsequent analysis.
Operational units (OTUs) were clustered with the similarity cutoff of 97% in UPARSE (Version 10.0). Chimeric sequences were identified and removed with UCHIME. The taxonomy of each 16S rRNA gene sequence was analyzed in RDP Classifier (http://rdp.cme.msu.edu/, accessed on 31 March 2022) against the silva (SSU132) 16S rRNA database with a confidence threshold of 70%.
Alpha diversity was analyzed by QIIME2 (http://qiime2.org, accessed on 31 March 2022) [25]. Chao1 [26] and ACE [27] were used to assess the species richness of samples. Shannon–Wiener indices [28] and the Simpson diversity index were used to assess the diversity of different sample groups. The coverage was used to estimate the authenticity of sequenced data [29]. A heatmap was plotted in Heml 1.0 with the top 20 genera in every group of photoperiod and water temperature samples.

2.6. Statistical Analyses

All statistical analyses were carried out with SPSS 22.0 and Excel. Data are expressed as means ± S.E.M of triplicates. Prior to conducting one-way ANOVA, all data were subjected to a One Sample t-test, as well as normality and homogeneity tests. A 95% confidence interval was adopted as the criterion for significant differences.

3. Results

3.1. Activities of Antioxidant Enzymes

The activities of the four antioxidant enzymes are shown in Table 1. The activities antioxidant enzymes showed significant differences among different photoperiod groups (p < 0.05). Among the three photoperiod groups, the abundance of MDA was the lowest in the group of 8L: 16D and the highest in the group of 12L: 12D. The MDA value exhibited an initial increase followed by a subsequent decrease. Contrary to the abundance of MDA, the abundances of GSH-Px and CAT firstly decreased and then increased. The abundances of GSH-Px and CAT in the group of 12L: 12D were the lowest, and the abundances of GSH-Px and CAT in the group of 8L: 16D were the highest. The abundance of SOD in the group of 8L: 16D was higher than that of the other two groups, and the abundance of SOD showed no significant difference between the other two groups (p > 0.05).
The abundances of antioxidant enzymes showed significant differences between the groups of 18 °C and 28 °C (p < 0.05). In the group of 18 °C, the abundance of MDA was higher and the abundances of SOD, CAT, and GSH-Px were lower. However, in the group of 28 °C, the abundance of MDA was lower and the abundances of SOD, CAT, and GSH-Px were higher.

3.2. Evaluation of Richness and Diversity of Bacterial Communities in Fish Guts

The results of the α-diversity analysis across different treatment groups are presented in Table 2. In terms of species richness, no significant differences were observed in the ACE and Chao1 indices among the three photoperiod groups (p > 0.05). The 18 °C group exhibited significantly higher ACE and Chao1 indices compared to the 28 °C group (p < 0.05). Regarding community diversity, there were still no significant differences among the light treatment groups, while in water temperature groups, the 18 °C group showed significantly higher Simpson and Shannon indices (p < 0.05). The Good’s Coverage exceeded 99% for all samples, indicating that the sequencing results reliably reflect the true microbial composition of the samples.

3.3. Composition, Relevance, and Species Abundance of Microbial Communities in Samples

Venn analysis of S. scherzeri in different photoperiod and water temperature groups were carried out (Figure 1). A total of 1958 and 1911 OTUs were identified from the samples of different photoperiod groups and water temperature groups, respectively. In the photoperiod groups, 1296 OTUs were shared across all the samples. The number of specific OTUs was the largest in the group of 12L: 12D (64) and the smallest in the group of 8L: 16D (50) (p < 0.05). With the increase in light duration, the number of specific OTUs firstly increased and then decreased. In the two water temperature groups, 1472 OTUs were shared in all samples. The number of unique OTUs in the group of 18 °C (253) was larger than that of the group of 28 °C (186).
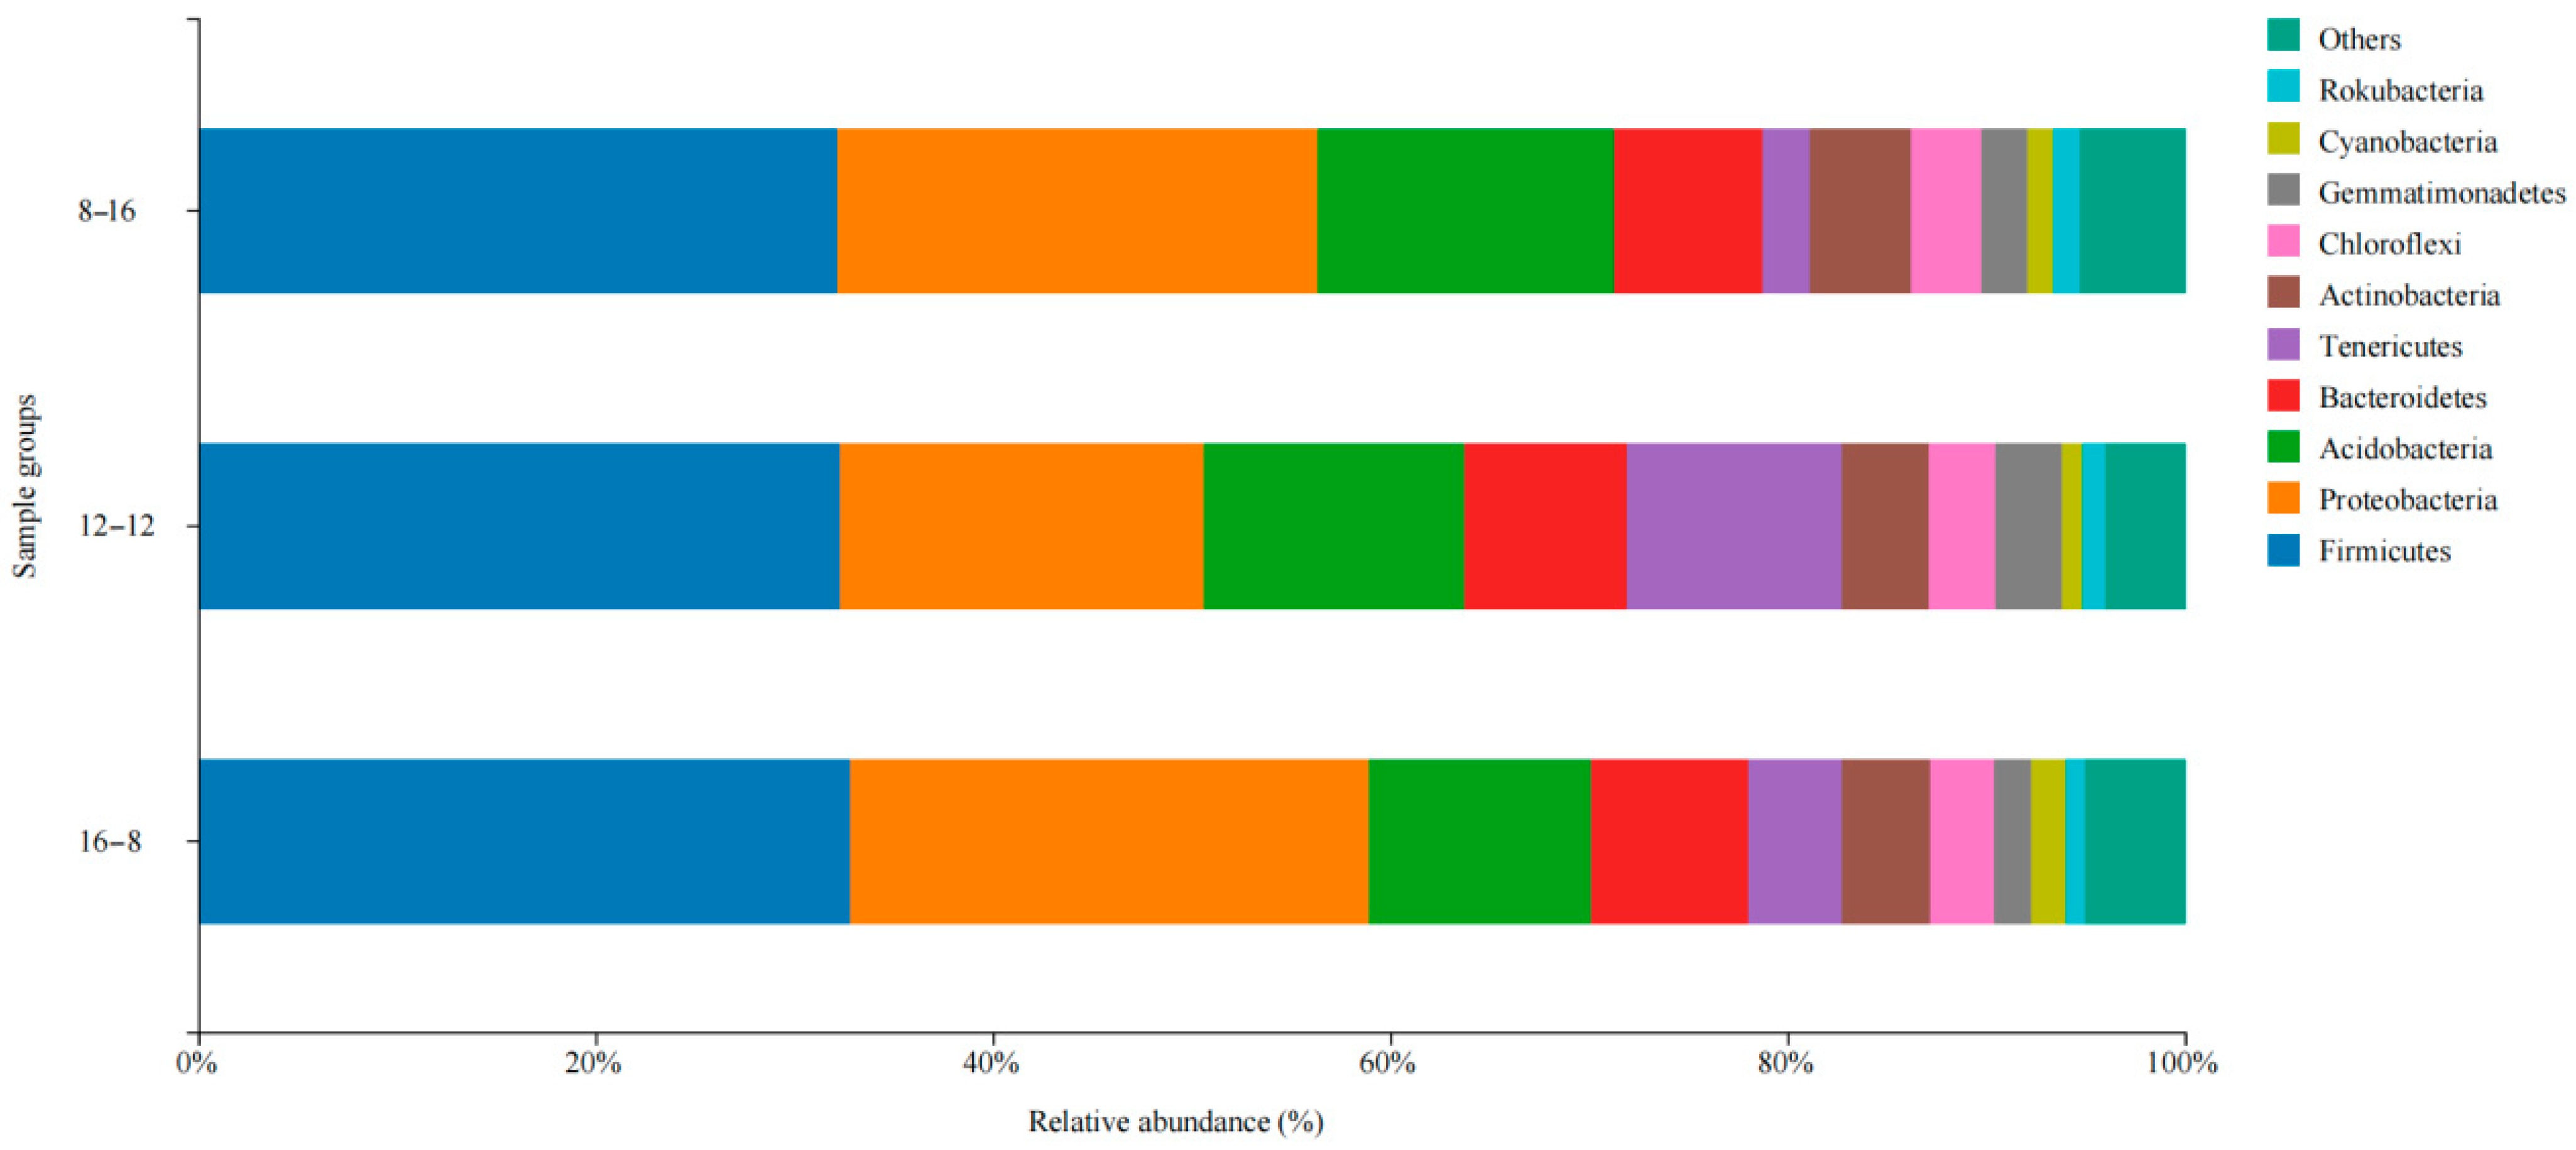
The dominant microbial phyla in three photoperiod groups included Firmicutes, Proteobacteria, Acidobacteria, Bacteroidetes, Tenericutes, Actinobacteria, Chloroflexi, Gemmatimonadetes, Cyanobacteria, and Rokubacteria (Figure 2). Firmicutes was the most dominant phylum in the three photoperiod groups, and the abundances of Firmicutes in the three photoperiod groups were 32.1% (8L: 16D), 32.3% (12L: 12D), and 32.8% (16L: 8D). Proteobacteria was the second dominant microbial phylum, and the relative abundance of Proteobacteria in the group of 12L: 12D was significantly lower than that in other two groups (p < 0.05). Meanwhile, the relative abundance of Tenericutes also differed significantly, with the 12L: 12D group having a higher abundance than the other two groups. (p < 0.05).
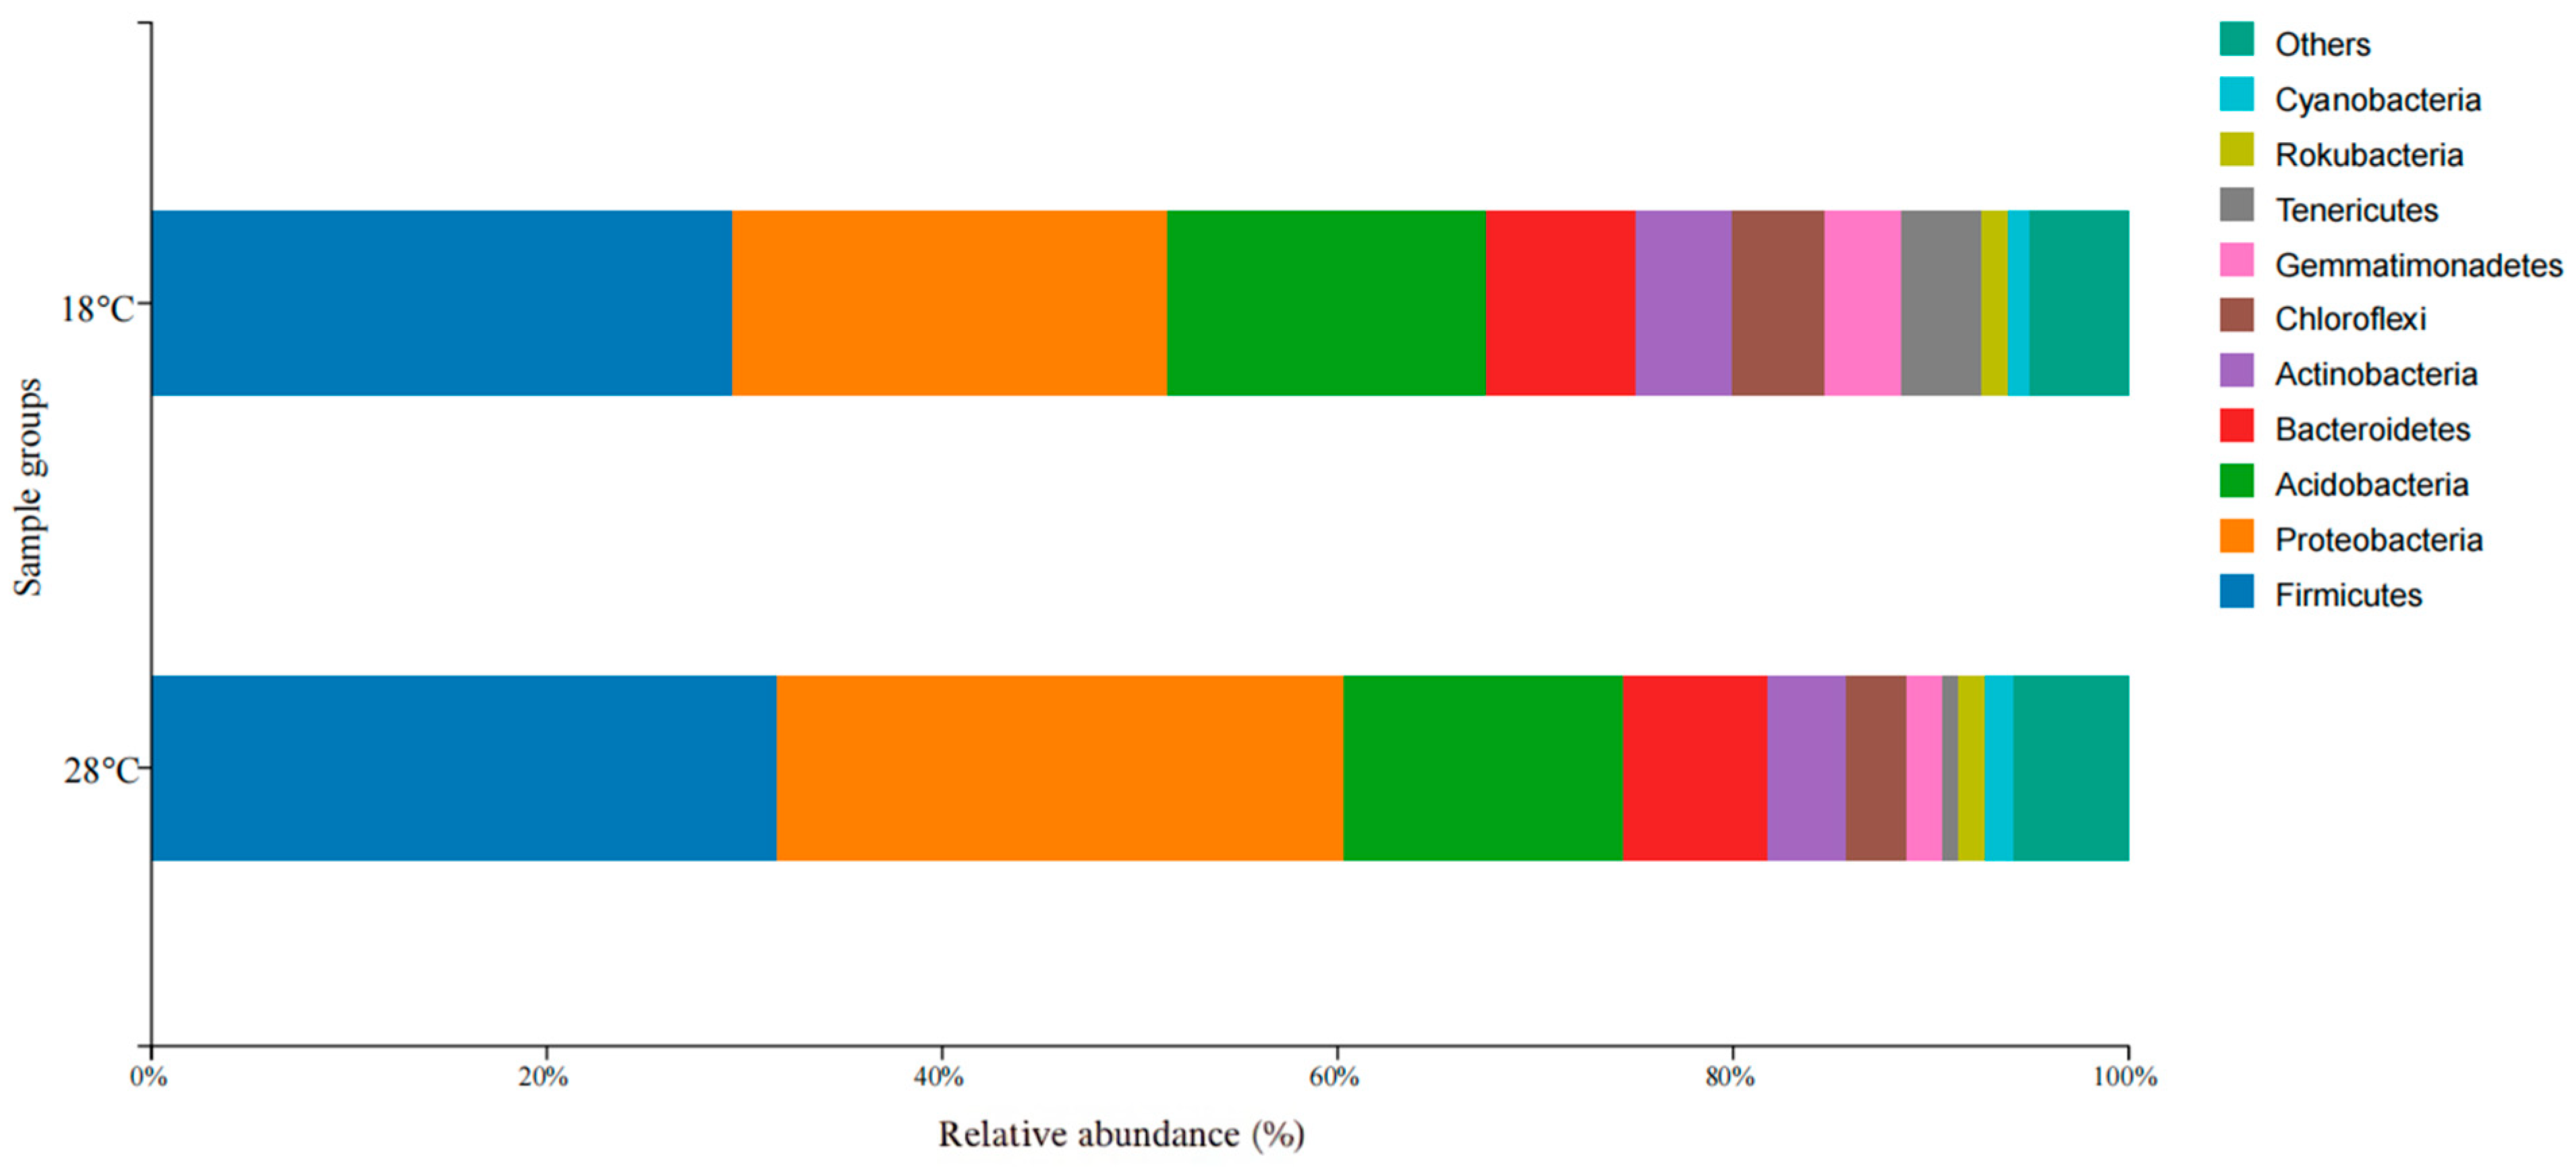
The similarity analysis of microbial communities in the different photoperiod groups was also performed in the different water temperature groups. The dominant microbial phyla in these groups were Firmicutes, Proteobacteria, Acidobacteria, Bacteroidetes, Actinobacteria, Chloroflexi, Gemmatimonadetes, Tenericutes, Rokubacteria, and Cyanobacteria (Figure 3). Firmicutes and Proteobacteria were also the first and second dominant microbial phyla in the two groups. The relative abundance of Tenericutes showed the significant difference between the two temperature groups of 18 °C and 28 °C (p < 0.05).
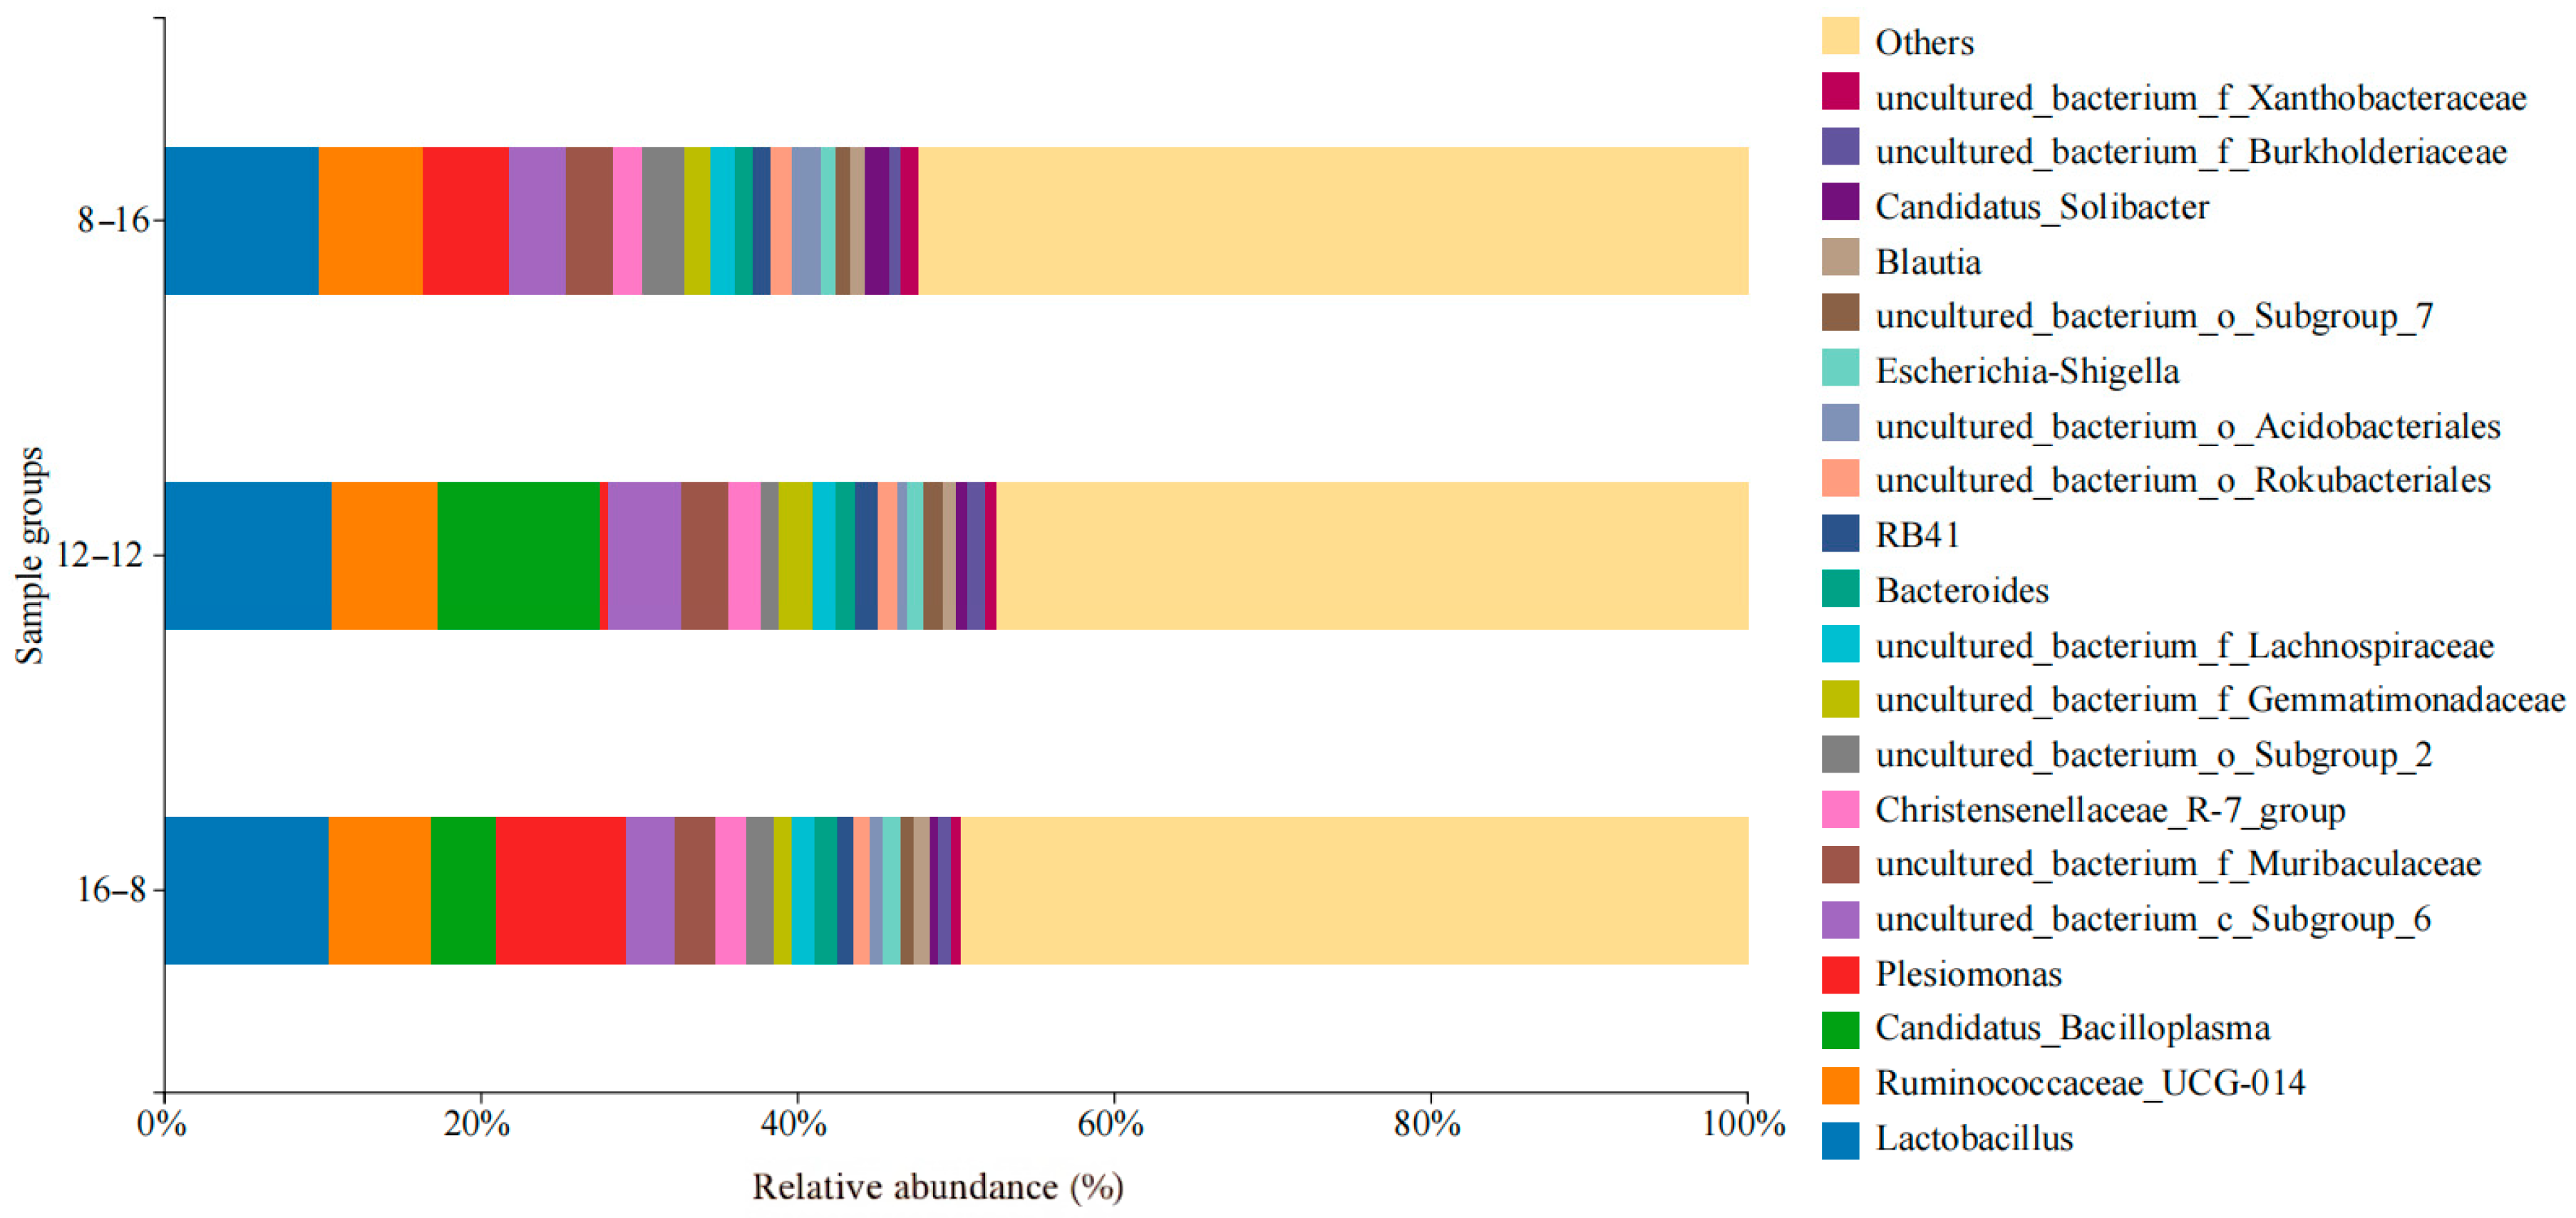
Figure 4 shows the dominant microbial genera collected in three photoperiod groups. Lactobacillus was the highest abundant species in the groups of 8L: 16D (9.8%), 12L: 12D (10.6%) and 16L: 8D (10.3%). In addition, the dominant microbial genera in the group of 8L: 16D were Ruminococcaceae_UCG-014 (6.5%), Plesiomonas (5.3%), uncultured_bacterium_c_Subgroup_6 (3.6%), and uncultured_bacterium_f_Muribaculaceae (3.0%). In the samples in the group of 12L: 12D, dominant microbial genera were Candidatus_Bacilloplasma (10.2%), Ruminococcaceae_UCG-014 (6.6%), uncultured_bacterium_c_Subgroup_6 (4.6%), and uncultured_bacterium_f_Muribaculaceae (3.0%). In the samples in the group of 16L: 8D, dominant microbial genera were Plesiomonas (8.2%), Ruminococcaceae_UCG-014 (6.5%), Candidatus_Bacilloplasma (4.1%), and ncultured_bacterium_c_Subgroup_6 (3.1%).
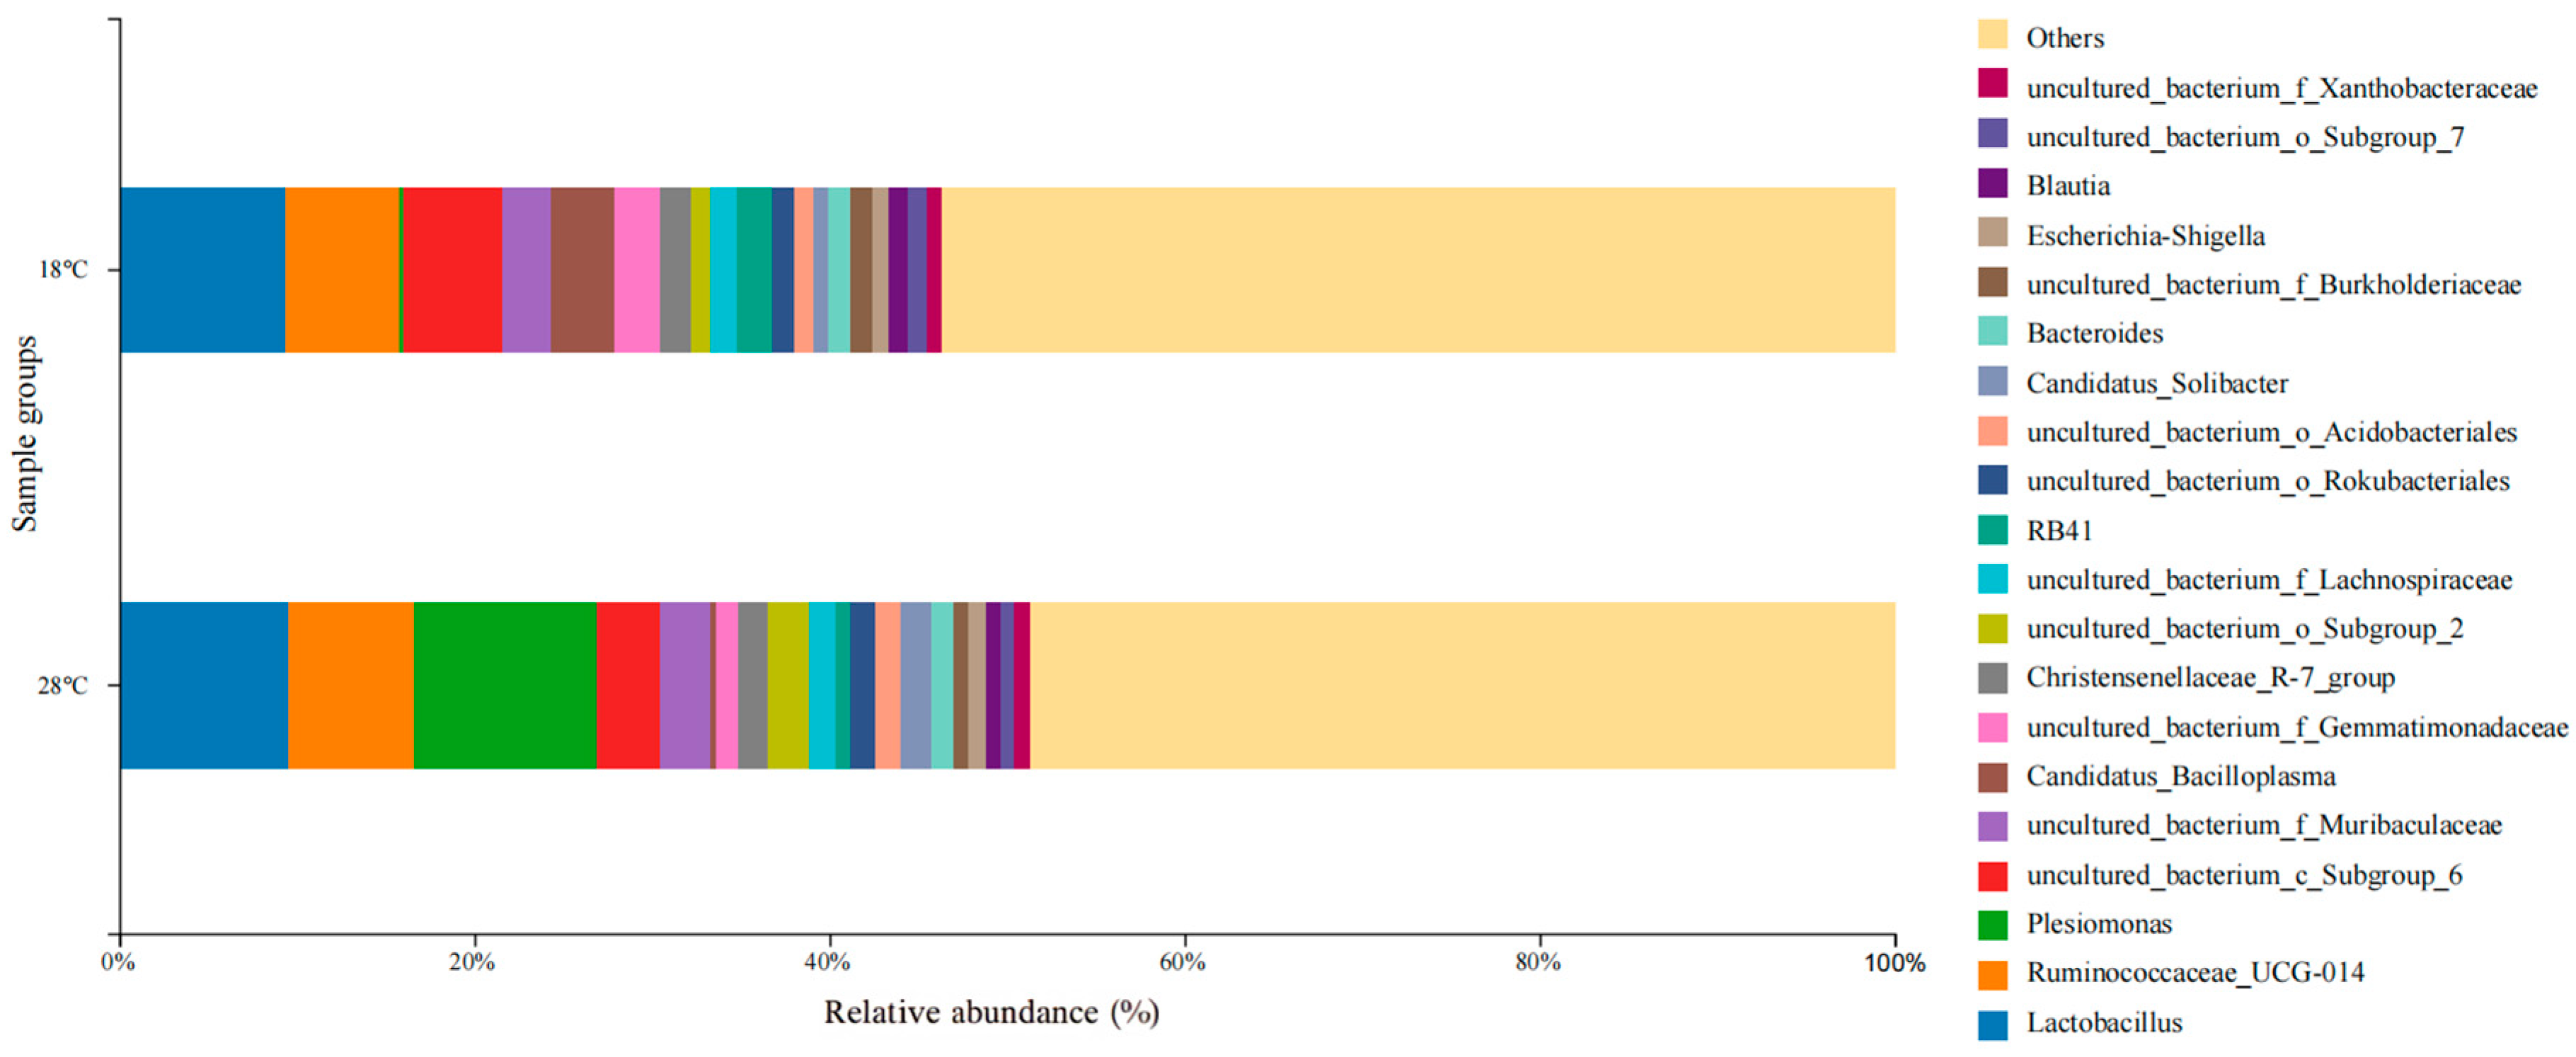
Dominant microbial genera collected in different water temperature groups are shown in Figure 5. In the water temperature group of 18 °C, the dominant microbial genera were Lactobacillus (9.3%), Ruminococcaceae_UCG-014 (6.4%), uncultured_bacterium_c_Subgroup_6 (5.6%), Candidatus_Bacilloplasma (3.6%), and uncultured_bacterium_f_Muribaculaceae (2.7%). In the water temperature group of 28 °C, the dominant microbial genera were Plesiomonas (10.4%), Lactobacillus (9.5%), Ruminococcaceae_UCG-014 (7.0%), uncultured_bacterium_c_Subgroup_6 (3.6%), and uncultured_bacterium_f_Muribaculaceae (2.8%).

3.4. Similarity Analysis for Microbial Populations in Photoperiod Samples and Water Temperature Samples

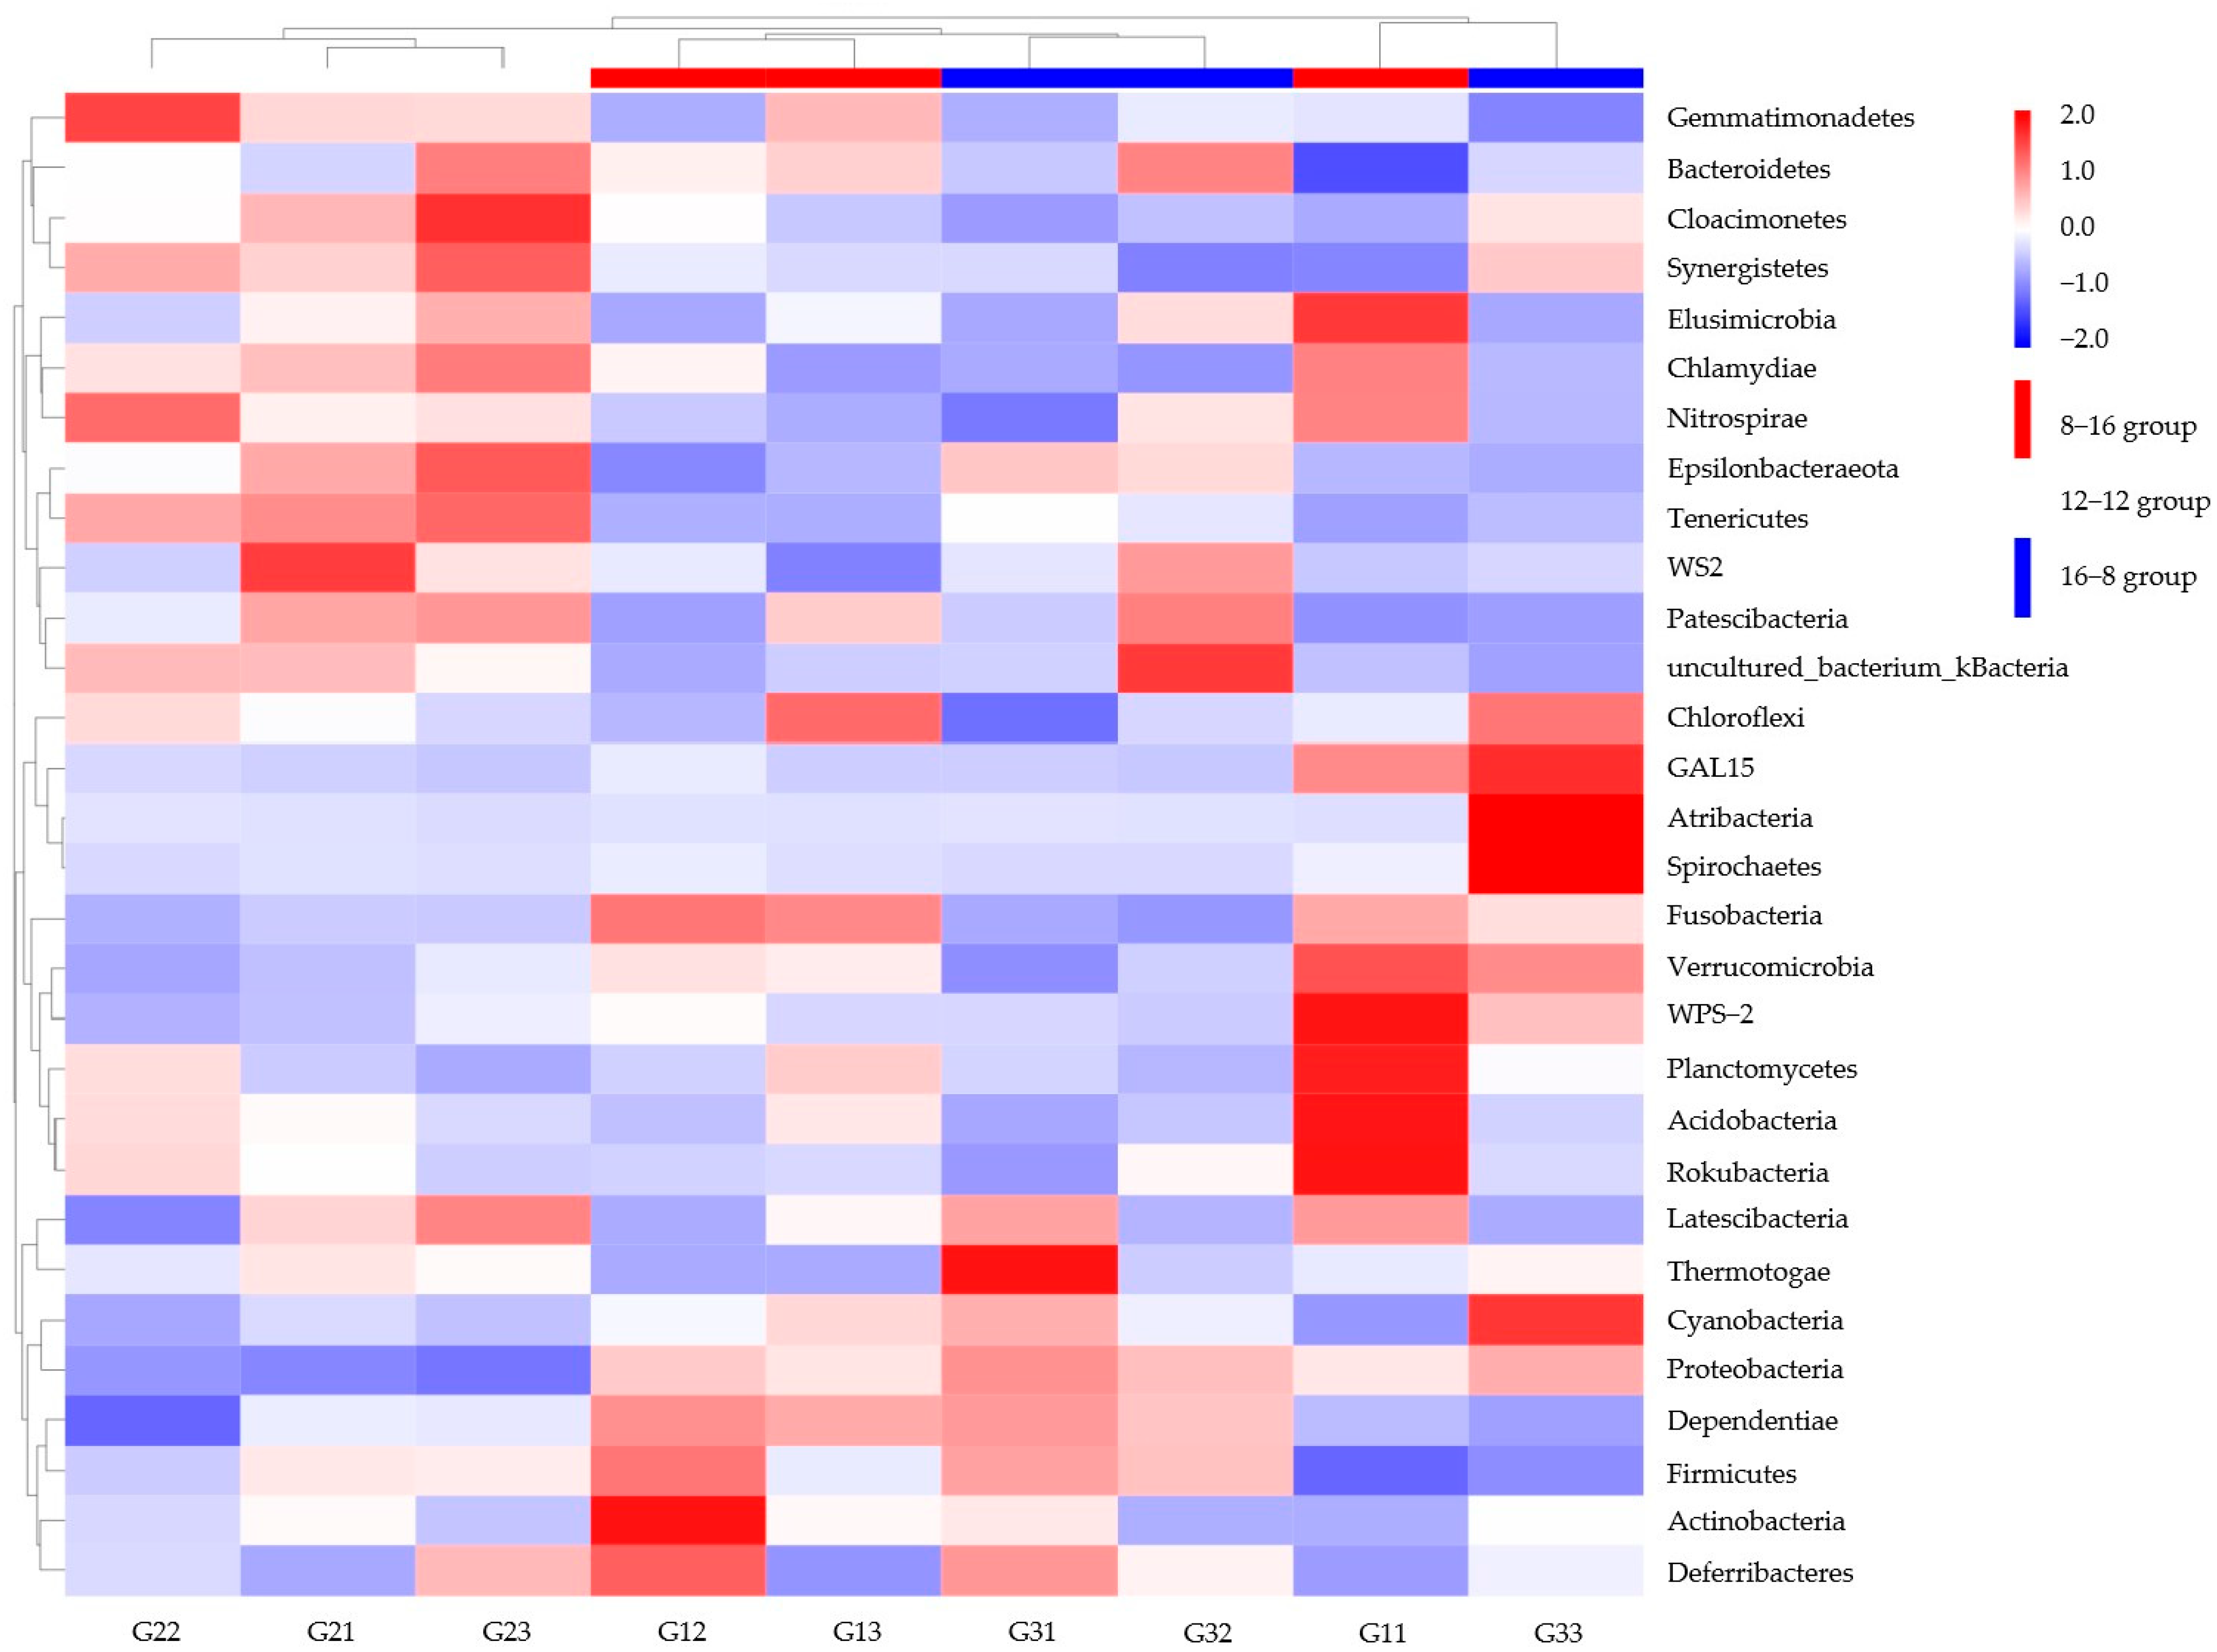
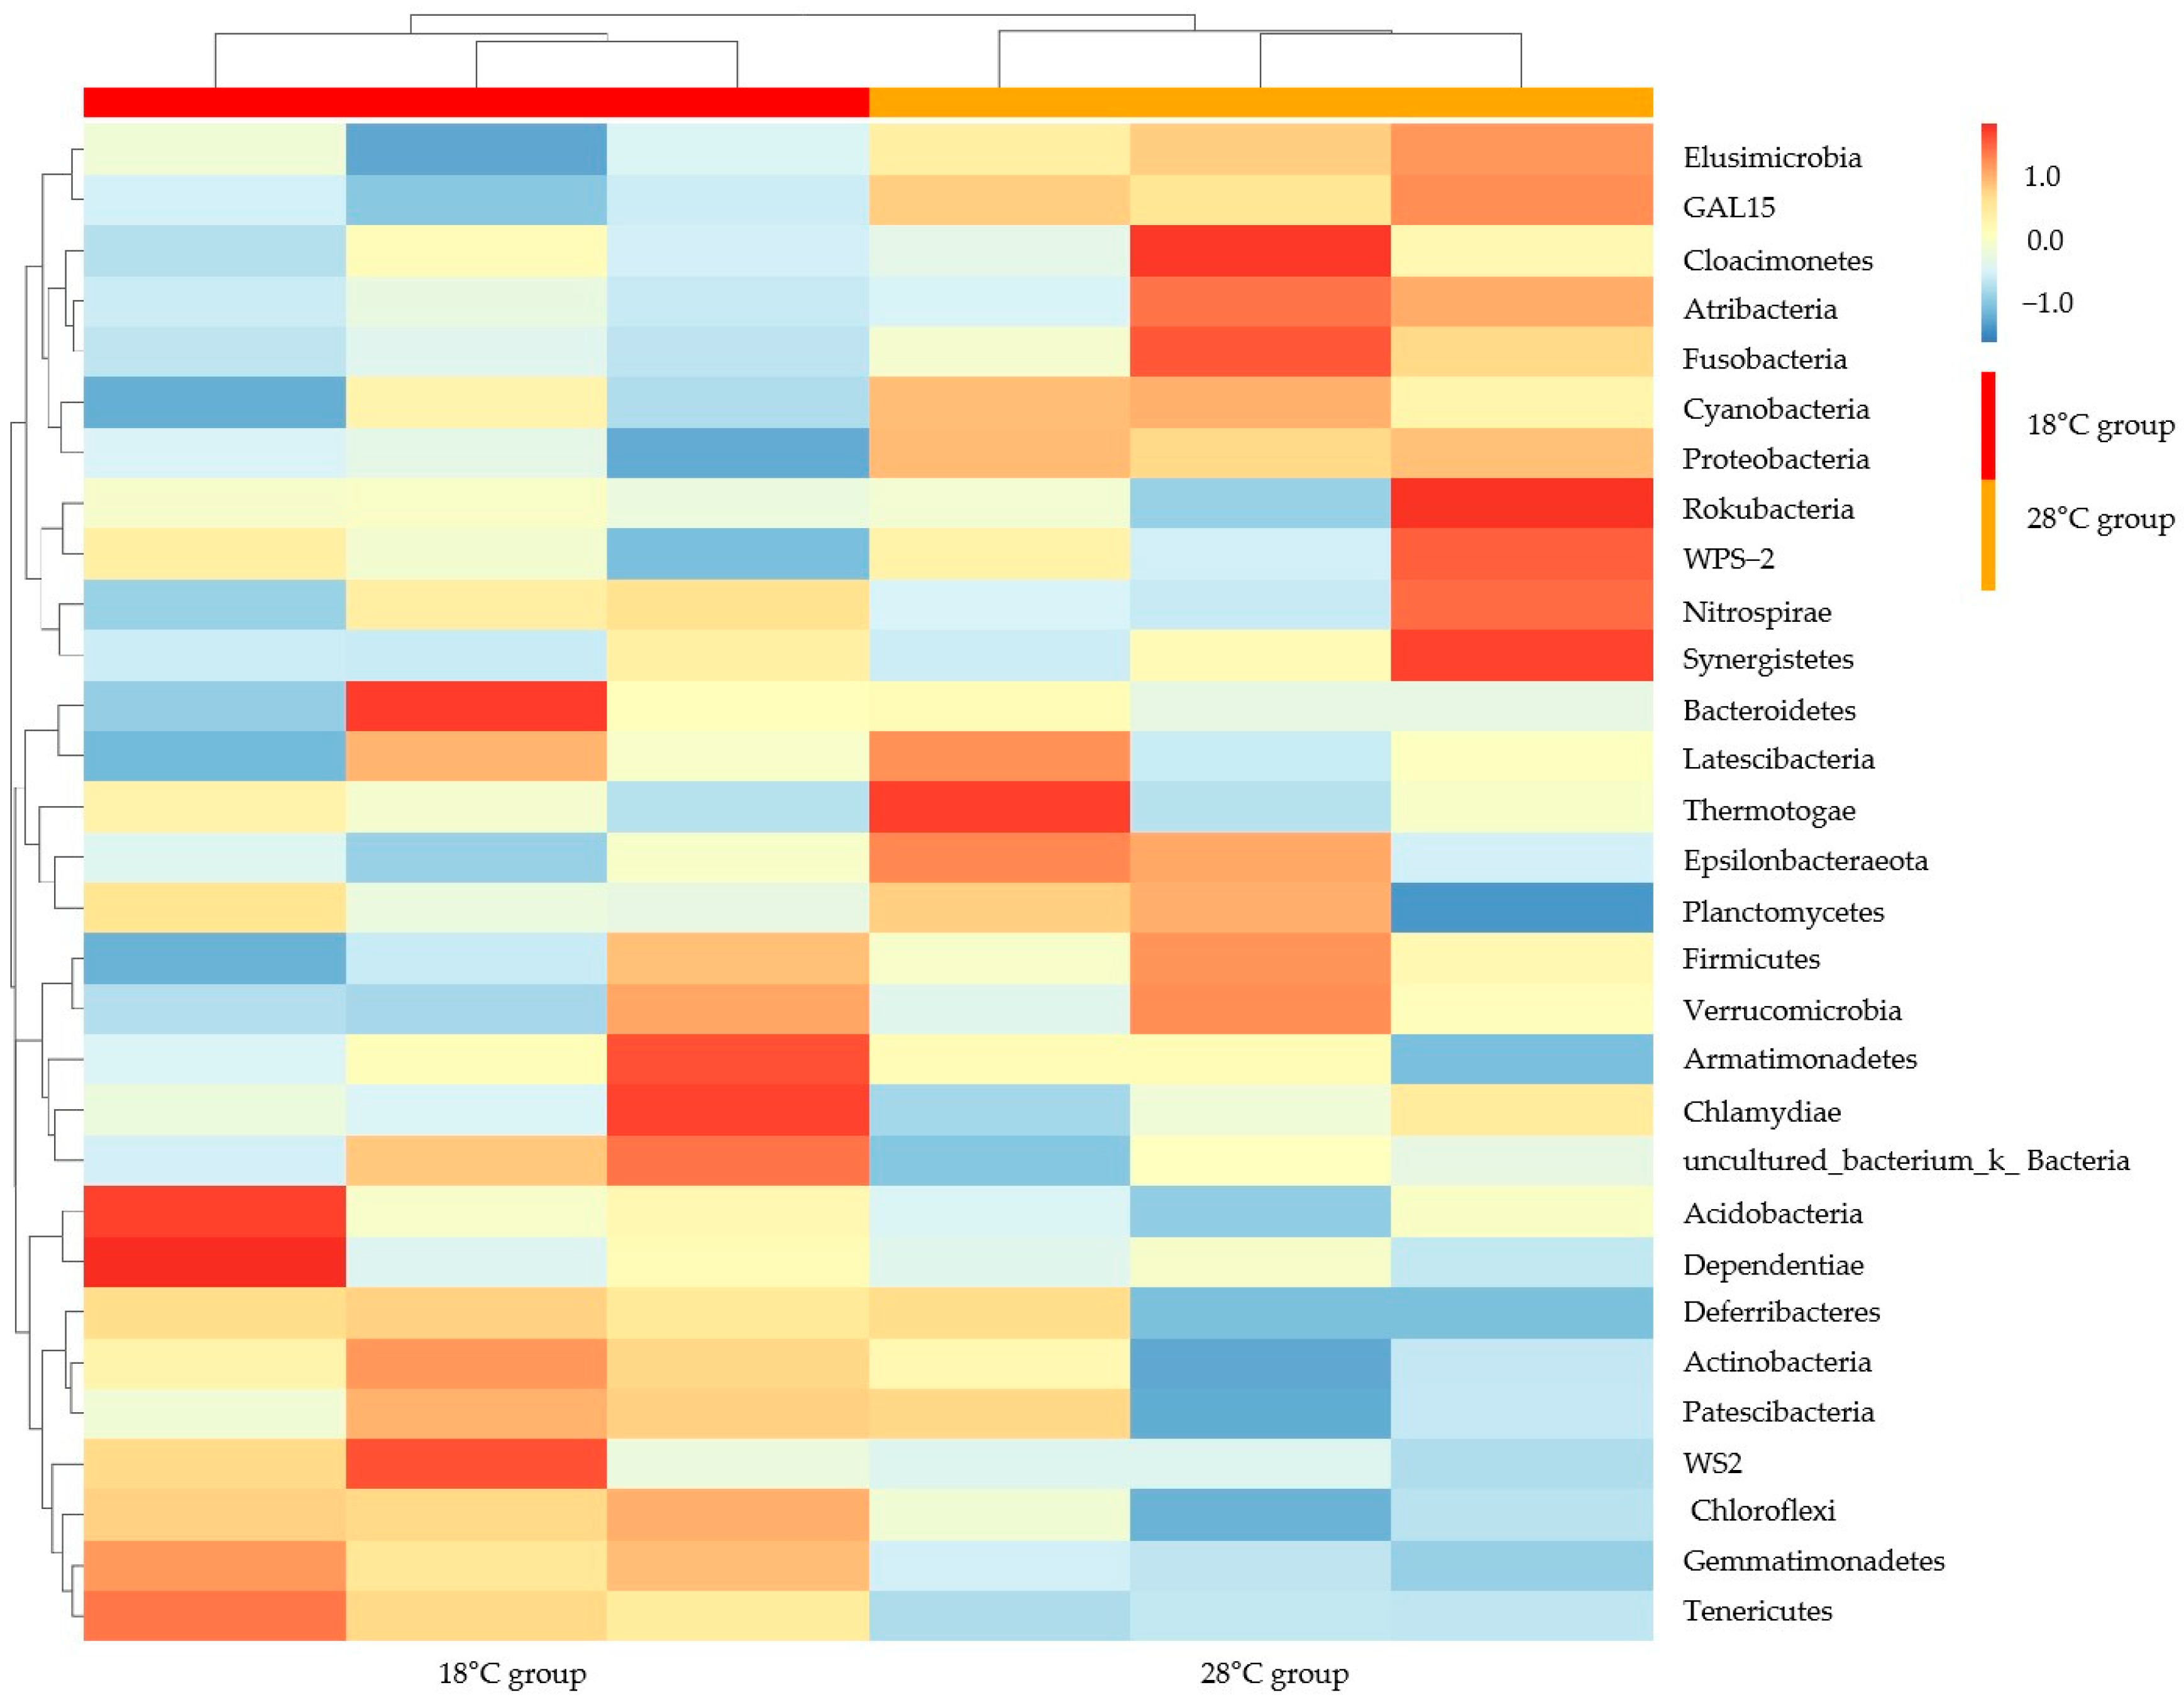
Similarity analysis results of microbial genera were performed in the photoperiod (Figure 6) and water temperature samples (Figure 7). Samples in the groups of 8L: 16D and 16L: 8D were clustered into one category. Furthermore, this category was grouped with the 12L: 12D group into one sub-category (Figure 6). Some samples of the groups of 8L: 16D (G11) and 16L: 8D (G33) were clustered into one sub-category. The two water temperature groups were directly clustered into two sub-categories. The heatmap showed an opposite abundance in the microbial genera of the two groups (Figure 7).

4. Discussion

The determination of optimal fish farming conditions depends on assessing the environmental preferences of the fish, as indicated by variables that affect economic interests, such as health and growth [23]. The evaluation of antioxidant response is an effective way to assess the physiological state of fish and to reveal the physiological changes caused by intensive farming conditions [30,31]. An artificial environment can induce oxidative stress in the liver and affect the physiological state of fish [32,33]. The ability of antioxidant enzymes (SOD and CAT) and low molecular non-enzymatic antioxidants (GSH-Px), which remove free radicals to reduce oxidative damage to lipids, is involved in the antioxidant defense system [34,35,36]. Biological organisms are protected against molecular environmental stress through this ability to interact with antioxidants, which detoxify metabolites by converting them into water and oxygen [37,38,39,40]. MDA is a lipid peroxidation product that effectively represents the degree of oxidative damage in lipids [41,42]. High level of MDA contents is typically used as an indicator of antioxidant stress response. GSH-Px, as a crucial antioxidant in the body, is responsible for eliminating free radicals, purifying the internal environment, and regulating oxidative stress damage associated with disease development. The decrease in GSH-Px levels is a result of heightened demand and utilization of the tripeptide for lipid hydroperoxide metabolism [43]. The present study observed that both photoperiod and farmed water temperature affect the antioxidant defense system. For the photoperiod groups, MDA content was significantly higher in the group with a nearly natural photoperiod (12L: 12D) than in the groups with prolonged darkness (8L: 16D) and prolonged light duration (16L: 8D). This conclusion is corroborated by Malinovskyi et al., who proposed that a 12L: 12D photoperiod does not provide a dark phase duration sufficient for rest and recovery, nor does it offer a light phase long enough to enhance feed intake opportunities [11]. Therefore, this tendency led to increased per-oxidation and high MDA and low GSH-Px values under insufficient dark and light phases (12L: 12D). SOD activities in the present study were reduced in the liver of S. scherzeri in both the 12L: 12D and 16L: 8D photoperiod.
Elevated summer water temperatures have a detrimental effect on the welfare and production of fish [44]. Pereira et al. observed a significant interaction between photoperiod and temperature that caused oxidative stress in Colossoma macropomum, and oxidative stress levels increased markedly between 26 °C and 32 °C, regardless of the photoperiod [23]. Yang et al. reported that the cold-water fish Schizothorax prenanti acclimated at 11 °C revealed an optimal rearing temperature of 21 °C, as determined by SOD and CAT activity levels, as well as MDA contents [45]. In this sense, prolonged exposure appears to affect animals’ antioxidant responses in a specific manner. We observed an elevated MDA level associated with high water temperature (28 °C) in the present study. Liver GSH-Px levels were significantly higher in groups with higher water temperature (28 °C), indicating the key role of the liver in lipid metabolism. Prolonged high temperature exposure may adversely affect organism functions. In response, S. scherzeri may resist oxidative stress caused by high temperature stress by up-regulating the expression level of GSH-Px.
The SOD-CAT system serves as the primary defense mechanism against oxygen toxicity, with SOD facilitating the conversion of O2 and H2O2 and CAT contributing to transform H2O2 into water and oxygen [46,47]. Sun et al. found that SOD activity under a long light period was higher than that under a short light period in Cynoglossus semilaevis [48]. Prolonged light exposure caused the fish to accumulate a large amount of superpositive anions (O2−), which increase the concentration of O2− in the blood. However, long-term accumulation of MDA in the liver inhibited SOD and CAT activities [49]. This mechanism leads to low SOD and CAT activities in the present study, with a negative trend in MDA contents in different photoperiod groups. This trend was in agreement with Malinovskyi et al. [11], who found that significantly higher SOD and CAT activities were found in liver of the 8L: 16D group compared to the 12L: 12D and 16L: 8D groups. Ma et al. found that the activity of GSH-Px in newly hatched Takifugu rubripes fish under 24L: 0D was significantly higher than in the other groups, suggesting that this increase may be a response to the impact of prolonged light exposure on larval cellular function [50]. Moreover, previous study has shown that high light intensity might cause oxidative stress in fish, representing a high activity of SOD with increased light intensity [51]. Thus, it should be noted that more research is needed to determine the antioxidant response in S. scherzeri to different light intensity stress.
During the 20 days of temperature treatments, SOD activities were upregulated under the heat stress in S. scherzeri. Some previous studies have reported the same conclusion as the present study [52]. However, CAT activity did not change during four weeks of hyperthermal stress, based on Chang’s report, which is compared with the current study [52]. CAT was upregulated as temperature increased (Table 1), suggesting that detoxification increased during this process, and the same results have been reported in previous studies [53,54]. In previous studies, low temperature has been shown to induce the upregulation of CAT activity in Takifugu fasciatus and Takifugu fasciatus [2,55]. These results might be caused by the different temperature tolerance of different species [52]. Compared to other species, larvae S. scherzeri require higher temperatures (25 °C to 28 °C) to maintain their physiology, resulting in high antioxidant enzymes activities as temperature was upregulated in the present study. In the process of farming, raising fish in continuous lighting and lower temperatures should be avoided.
Microbial communities in aquaculture water are crucial for the health and growth of fish, and fish also affect the composition of microbial communities in aquaculture water [56,57]. Different habitat environments have been shown to have different effects on the microbial composition of guts. In one study, as fish were acclimated to their surroundings, a community structure was developed according to their own physiological adaptations [58]. Larvae in their early development period have a significant response to light duration, resulting in variation in growth, development, reproduction, and metabolism. Puvanendran and Brown reported that a prolonged light exposure increased the growth rate of Atlantic cod [59]. The development of larvae, however, might be restrained by a prolonged photoperiod [60]. The composition of the fish gut microbiota is profoundly influenced by dietary patterns and food sources [61]. Under the optimal light duration, fish exhibited high activity levels, robust feeding behaviors, and rapid growth. Conversely, when the light intensity decreased below a critical threshold, it adversely affected the growth and development of fish, thus resulting in reduced activities, sluggish responses, and diminished feeding behavior [62]. Consequently, the impact of light on the fish gut microbiota might be indirectly mediated through its effects on diet. However, the abundance and diversity indices showed no significant differences among photoperiod groups in the present study. Walburn et al. observed that the most substantial shift in the microbiota of yellowtail kingfish (Seriola lalandi) larvae occurred during the dietary transition from live feed to formulated pellets, demonstrating that diet plays a pivotal role in microbial community development and assembly [63]. Thus, when a uniformly suitable temperature and identical food are maintained, variations in photoperiod leave the diversity of the gut microbiota in S. scherzeri unaffected.
Temperature directly affected the acquisition of fish foods, the activity of digestive enzymes, and the efficiency of food conversion [64]. Conversely, the effect of temperature on gut microbial abundance was significant, indicating a lower abundance corresponding to higher temperature in our study. The same conclusion is also supported by Zhou et al., who looked at rainbow trout under higher temperatures and found that the diversity of the intestinal microbiota decreased with an increase in temperature [65]. Firmicutes and Proteobacteria are the common predominant bacterial phyla associated with fish in both marine and freshwater environments [65,66,67,68,69]. The prevalence of Proteobacteria as a potential microbial marker of dysbiosis and disease in the gut microbiota might serve as an indicator of the health status of fish [70,71]. The diverse microorganisms encountered by cold-water fish experienced continual fluctuations due to the influences of various factors including seasonal changes, temperature variations, and environmental influences [72]. As a result, microbiota in guts showed a different relative abundance in photoperiod and farmed water temperature groups, especially Proteobacteria and Tenericutes. Other researchers indicated that dietary composition and host species played pivotal roles in shaping the diversity and structure of fish gut microbiota [73,74]. Candidatus_Bacilloplasma was considered as a symbiont (two organisms of different species with close and long-term biological interactions) and could be used as a potential taxonomic indicator to assess the health status of shrimps. The variations in photoperiod and water temperature had different influences on the growth, feeding behavior, and reproductive patterns of fish [75]. This result might be related to diet and host health impacting microbial composition, presenting variations observed at the genus level for Candidatus_Bacilloplasma. In the study, the relative abundance of Plesiomonas showed significant differences among different groups. Plesiomonas shigelloides, as an important pathogen in aquaculture, leads to a substantial mortality rate in diverse aquatic species [76]. The optimum growth temperature of P. shigelloides has been shown to be relatively high [77], thus resulting in the relatively high abundance in the group of 28 °C.

5. Conclusions

In the study, the antioxidant capacity and intestinal microbiota of S. scherzeri were explored under varying water temperatures and photoperiods. Photoperiod and temperature distinctly influenced the antioxidant capacity of mandarin fish. Both the 12L: 12D photoperiod at a constant temperature and the lower temperature of 18 °C induced antioxidant responses, creating suboptimal farming conditions. In contrast, while photoperiod had no impact on gut microbial diversity, it did significantly influence the relative abundance of microbial communities. An optimal high temperature could suppress oxidation in juvenile S. scherzeri. However, these conditions might influence the feeding behaviors of juvenile S. scherzeri and the composition of intestinal microbiota and promote the proliferation of opportunistic bacteria. In the process of farming, it should be avoided to raise fish in continuous lighting and lower temperatures.

Author Contributions

Conceptualization, X.L., J.L. and Y.X.; methodology, X.L. and Y.G.; software, Y.W. (Yan Wang); validation, K.L., N.L. and Y.X.; formal analysis, Y.W. (Yanjun Wang); investigation, Y.X.; resources, M.L.; writing—original draft preparation, J.Y.; writing—review and editing, Y.W. (Yanjun Wang); visualization, T.T.; supervision, X.L.; project administration, Y.W. (Yan Wang); funding acquisition, J.Y. and Y.W. (Yan Wang). All authors have read and agreed to the published version of the manuscript.

Funding

This research was funded by Science and Technology Plan of Dalian (2022RQ060 and 2023RQ052), the Science and Technology Plan Joint Project of Liaoning Province (2023-BSBA-008 and 2023-BSBA-011), and the Liaoning Province Education Department Project (JYTQN2023130 and JYTMS20230473).

Institutional Review Board Statement

Our research was approved by the Animal Ethics Committee of Dalian Ocean University (Permit Number: DLOU2023008, 8 August 2023) and performed in accordance with the relevant institutional and national guidelines, and the manuscript conforms with the ARRIVE Guidelines for Reporting Animal Research.

Informed Consent Statement

Not applicable.

Data Availability Statement

The data that support the findings of this study are available from the corresponding author upon reasonable request.

Acknowledgments

We acknowledge the Engineering Research Center of Green development for Conventional Aquatic Biological Industry in the Yangtze River Economic Belt, Ministry of Education, Wuhan, China, for the design scheme.

Conflicts of Interest

The authors declare no conflicts of interest.

References

  1. Choi, C.; Choi, J.; Choi, Y.; Kim, B.; Kim, J. Effects of green wavelength light on antioxidant and non-specific immune responses of the olive flounder Paralichthys olivaceus maintained at different stocking densities. Aquac. Eng. 2019, 84, 23–28. [Google Scholar] [CrossRef]
  2. Wen, X.; Chu, P.; Xu, J.; Wei, X.; Fu, D.; Wang, T.; Yin, S. Combined effects of low temperature and salinity on the immune response, antioxidant capacity and lipid metabolism in the pufferfish (Takifugu fasciatus). Aquaculture 2021, 531, 735866. [Google Scholar] [CrossRef]
  3. Sepulveda, J.; Moeller, A. The effects of temperature on animal gut microbiomes. Front. Microbiol. 2020, 11, 384. [Google Scholar] [CrossRef] [PubMed]
  4. Mccarthy, I.; Moksness, E.; Pavlov, D. The effects of temperature on growth rate and growth efficiency of juvenile common wolffish. Aquac. Int. 1998, 6, 207–218. [Google Scholar] [CrossRef]
  5. Booth, D.J.; Poulos, D.E.; Poole, J.; Feary, D.A. Growth and temperature relationship for juvenile fish species in seagrass beds: Implications of climate change. J. Fish Biol. 2014, 84, 231–236. [Google Scholar] [CrossRef]
  6. Symons, C.; Schulhof, M.; Cavalheri, H.; Shurin, J. Antagonistic effects of temperature and dissolved organic carbon on fish growth in California mountain lakes. Oecologia 2018, 189, 231–241. [Google Scholar] [CrossRef]
  7. Bartolini, T.; Butail, S.; Porfiri, M. Temperature influences sociality and activity of freshwater fish. Environ. Biol. Fishes 2015, 98, 825–832. [Google Scholar] [CrossRef]
  8. Herbing, I. Effects of temperature on larval fish swimming performance: The importance of physics to physiology. J. Fish Biol. 2002, 61, 865–876. [Google Scholar] [CrossRef]
  9. Moriarty, M.; Murray, A.; Berx, B.; Christie, A.; Munro, L.; Wallace, I. Modelling temperature and fish biomass data to predict annual Scottish farmed salmon, Salmo salar L. losses: Development of an early warning tool. Prev. Vet. Med. 2020, 178, 104985. [Google Scholar] [CrossRef]
  10. Zhou, X.; Niu, C.; Li, Q. Effects of light on feeding behavior, growth and survival of aquatic animals. Acta Hydrobiol. Sin. 2000, 24, 178–181. [Google Scholar] [CrossRef]
  11. Malinovskyi, O.; Rahimnejad, S.; Stejskal, V.; Boňko, D.; Stará, A.; Velíšek, J.; Policar, T. Effects of different photoperiods on growth performance and health status of largemouth bass (Micropterus salmoides) juveniles. Aquaculture 2022, 548, 737631. [Google Scholar] [CrossRef]
  12. Ottinger, M.; Clauss, K.; Kuenzer, C. Aquaculture: Relevance, distribution, impacts and spatial assessments-a review. Ocean Coast. Manag. 2016, 119, 244–266. [Google Scholar] [CrossRef]
  13. Choi, Y.; Choi, J.; Yang, S.; Kim, B.; Choi, C. The effect of green and red light spectra and their intensity on the oxidative stress and non-specific immune responses in gold-striped amberjack, Seriola lalandi. Mar. Freshw. Behav. Physiol. 2016, 49, 223–234. [Google Scholar] [CrossRef]
  14. Jung, S.; Choi, Y.; Kim, N.; Choi, J.; Kim, B.; Choi, C. Effects of melatonin injection or green-wavelength LED light on the antioxidant system in goldfish (Carassius auratus) during thermal stress. Fish Shellfish Immunol. 2016, 52, 157–166. [Google Scholar] [CrossRef]
  15. Wei, H.; Cai, W.; Liu, H.; Han, D.; Zhu, X.; Yang, Y.; Xie, S. Effects of photoperiod on growth, lipid metabolism and oxidative stress of juvenile gibel carp (Carassius auratus). J. Photochem. Photobiol. B Biol. 2019, 198, 111552. [Google Scholar] [CrossRef] [PubMed]
  16. Wei, H.; Liu, H.; Xia, Y.; Liu, H.; Han, D.; Zhu, X.; Yang, Y.; Jin, J.; Xie, Q. Effects of light intensity on phototaxis, growth, antioxidant and stress of juvenile gibel carp (Carassius auratus gibelio). Aquaculture 2019, 501, 39–47. [Google Scholar] [CrossRef]
  17. Gao, X.; Zhang, M.; Li, X.; Song, C.; Liu, Y. Physiological metabolism of Haliotis discus hannai Ino under different light qualities and cycles. Aquac. Res. 2016, 48, 3340–3350. [Google Scholar] [CrossRef]
  18. Wang, M.; Huang, H.; Hu, Z. Effect of disinfectants on hatching of fertilized Siniperca scherzeri eggs. Fujian J. Agric. Sci. 2018, 33, 346–350. [Google Scholar]
  19. Huang, S.; Pan, Q.; An, M.; Yu, K.; Li, S.; Chen, D.; Ma, X. Morphological differences among three wild populations of spotted mandarinfish Siniperca scherzeri in Guizhou Province. Fish. Sci. 2020, 39, 350–358. [Google Scholar]
  20. Jiang, X.H.; Wang, X.B.; Kou, L.X.; Wei, H.X.; Liu, Y.; Zhang, T. A comparative study on the nutrient and fatty acid composition in muscle of Siniperca scherzeri in upstream and downstream area of Yalu River. J. Fish. Res. 2023, 45, 569–576. [Google Scholar]
  21. Hao, C.; Shi, Y.; Peng, G.; Ding, S.; Wang, C.; Zheng, X.; Liu, G. Studies on techniques of the artificial breeding and seedling cultivation of Siniperca scherzeri. J. Aquac. 2018, 39, 13–15. [Google Scholar]
  22. Luo, X.; Liang, X.; Yi, J.; Tian, C.; Yang, M.; Fang, L.; Dou, Y.; Shi, J. Study on artificial breeding of Siniperca scherzeri (Steindachner) in reservior cages and its embyonic development. Chin. J. Fish. 2014, 27, 22–29. [Google Scholar]
  23. Pereira, L.; Amanajás, R.; Oliveira, A.; Silva, M.; Val, A. Health of the Amazonian fish tambaqui (Colossoma macropomum): Effects of prolonged photoperiod and high temperature. Aquaculture 2021, 541, 736836. [Google Scholar] [CrossRef]
  24. Bizarro, Y.; Navarro, F.; Filho, O.; Navarro, R. Photoperiodic effects in blood glucose, cortisol, hematological parameters and reproductive indexes of gift lineage reversed male tilapia. Biosci. J. 2019, 35, 1915–1922. [Google Scholar] [CrossRef]
  25. Bowman, J.S.; Rasmussen, S.; Blom, N.S.; Deming, J.W.; Rysgaard, S.; Sicheritz-Pontén, T. Microbial community structure of Arctic multiyear sea ice and surface seawater by 454 sequencing of the 16S RNA gene. ISME J. 2011, 6, 11–20. [Google Scholar] [CrossRef]
  26. Chao, A. Nonparametric-estimation of the number of classes in a population. Scand. J. Stat. 1984, 11, 265–270. [Google Scholar]
  27. Pitta, D.; Pinchak, W.; Dowd, S.; Osterstock, J.; Gontcharova, V.; Youn, E.; Dorton, K.; Yoon, I.; Min, B.; Fulford, J. Rumen bacterial diversity dynamics associated with changing from bermudagrass hay to grazed winter wheat diets. Microb. Ecol. 2010, 59, 511–522. [Google Scholar]
  28. Shannon, C. A mathematical theory of communication. Bell Syst. Tech. J. 1948, 27, 379–423. [Google Scholar] [CrossRef]
  29. Pandya, P.; Singh, K.; Parnerkar, S.; Tripathi, A.; Mehta, H.; Rank, D.; Kothari, R.; Joshi, C. Bacterial diversity in the rumen of Indian Surti buffalo (Bubalus bubalis), assessed by 16S rDNA analysis. J. Appl. Genet. 2010, 51, 395–402. [Google Scholar] [CrossRef]
  30. Bassano, B.; Iacobuzio, R.; Pennati, R.; Parolini, M.; Saino, N. Melanin-based skin coloration predicts antioxidant capacity in the Brown trout (Salmo trutta). Physiol. Biochem. Zool. 2018, 91, 1026–1035. [Google Scholar]
  31. Velisek, J.; Stara, A.; Li, Z.; Silovska, S.; Turek, J. Comparison of the effects of four anaesthetics on blood biochemical profiles and oxidative stress biomarkers in rainbow trout. Aquaculture 2011, 310, 369–375. [Google Scholar] [CrossRef]
  32. Li, X.; Zheng, S.; Ma, X.; Cheng, K.; Wu, G. Effects of dietary starch and lipid levels on the protein retention and growth of largemouth bass (Micropterus salmoides). Amino Acids 2020, 52, 999–1016. [Google Scholar] [CrossRef] [PubMed]
  33. Zhong, Y.; Shi, C.; Zhou, Y.; Chen, Y.; Lin, S.; Tang, R. Optimum dietary fiber level could improve growth, plasma biochemical indexes and liver function of largemouth bass, Micropterus salmoides. Aquaculture 2020, 518, 734661. [Google Scholar] [CrossRef]
  34. Hamed, H.S.; Abdel-Tawwab, M. Dietary pomegranate (Punica granatum) peel mitigated the adverse effects of silver nanoparticles on the performance, haemato-biochemical, antioxidant, and immune responses of Nile tilapia fingerlings. Aquaculture 2021, 540, 736742. [Google Scholar] [CrossRef]
  35. Li, Z.; Li, P.; Shi, Z. Chronic exposure to tributyltin induces brain functional damage in juvenile common carp (Cyprinus carpio). PLoS ONE 2015, 10, e0123091. [Google Scholar] [CrossRef]
  36. Zhang, Y.; Liang, X.; He, S.; Li, L. Effects of long-term low-concentration nitrite exposure and detoxification on growth performance, antioxidant capacities, and immune responses in Chinese perch (Siniperca chuatsi). Aquaculture 2021, 533, 736123. [Google Scholar] [CrossRef]
  37. Li, Z.; Chen, L.; Wu, Y.; Li, P.; Li, Y.; Ni, Z. Effects of mercury on oxidative stress and gene expression of potential biomarkers in larvae of the Chinese rare minnow Gobiocypris rarus. Arch. Environ. Contam. Toxicol. 2014, 67, 245–251. [Google Scholar] [CrossRef]
  38. Nwani, C.; Lakra, W.; Nagpure, N.; Kumar, R.; Kushwaha, B.; Srivastava, S. Toxicity of the herbicide atrazine: Effects on lipid peroxidation and activities of antioxidant enzymes in the freshwater fish Channa Punctatus (Bloch). Int. J. Environ. Res. Public Health 2010, 7, 3298–3312. [Google Scholar] [CrossRef]
  39. Pandey, S.; Parvez, S.; Sayeedl, I.; Haque, R.; Bin-Hafeez, B.; Raisuddin, S. Biomarkers of oxidative stress: A comparative study of river Yamuna fish Wallago attu (Bl. & Schn.). Sci. Total Environ. 2003, 309, 105–115. [Google Scholar]
  40. Van der Oost, R.; Beyer, J.; Vermeulen, N. Fish bioaccumulation and biomarkers in environmental risk assessment: A review. Environ. Toxicol. Pharmacol. 2003, 13, 57–149. [Google Scholar] [CrossRef]
  41. Esterbauer, H.; Schaur, R.J.; Zollner, H. Chemistry and biochemistry of 4-hydroxynonenal, malonaldehyde and related aldehydes. Free Radic. Biol. Med. 1991, 11, 81–128. [Google Scholar] [CrossRef]
  42. Maheshwari, D.; Kumar, M.; Verma, S.; Singh, V.; Singh, S. Antioxidant and hepatoprotective activities of phenolic rich fraction of Seabuckthorn (Hippophae rhamnoides L.) leaves. Food Chem. Toxicol. 2011, 49, 2422–2428. [Google Scholar] [CrossRef]
  43. Shaban, N.; El-Kersh, M.; El-Rashidy, F.; Habashy, N. Protective role of Punica granatum (pomegranate) peel and seed oil extracts on diethylnitrosamine and phenobarbital-induced hepatic injury in male rats. Food Chem. 2013, 141, 1587–1596. [Google Scholar] [CrossRef] [PubMed]
  44. Chen, C.; Li, P.; Wang, W.; Li, Z. Response of growth performance, serum biochemical parameters, antioxidant capacity, and digestive enzyme activity to different feeding strategies in common carp (Cyprinus carpio) under high-temperature stress. Aquaculture 2022, 548, 737636. [Google Scholar] [CrossRef]
  45. Yang, S.; Yan, T.; Zhao, L.; Wu, H.; Du, Z.; Yan, T.; Xiao, Q. Effects of temperature on activities of antioxidant enzymes and Na+/K+-ATPase, and hormone levels in Schizothorax prenanti. J. Therm. Biol. 2018, 72, 155–160. [Google Scholar] [CrossRef] [PubMed]
  46. Stanic, B.; Andric, N.; Zoric, S.; Grubor-Lajsic, G.; Kovacevic, R. Assessing pollution in the Danube River near Novi Sad (Serbia) using several biomarkers in sterlet (Acipenser ruthenus L.). Ecotoxicol. Environ. Saf. 2006, 65, 395–402. [Google Scholar] [CrossRef]
  47. Aliko, V.; Qirjo, M.; Sula, E.; Morina, V.; Faggio, C. Antioxidant defense system, immune response and erythron profile modulation in gold fish Carassius auratus, after acute manganese treatment. Fish Shellfish Immunol. 2018, 76, 101–109. [Google Scholar] [CrossRef]
  48. Sun, X.L.; Yang, S.Y.; Chen, C.X.; Wang, Q.K.; Yu, X.Q.; Hu, J.C.; Xing, K.Z. Effece of photoperiod on growth and antioxidant indices in half-smooth tongue-sole (Cynoglossus semilaevis). Chin. J. Fish. 2012, 25, 23–27. [Google Scholar]
  49. Guo, K.; Ruan, G.; Fan, W.; Fang, L.; Wang, Q.; Luo, M.; Yi, T. The effect of nitrite and sulfide on the antioxidant capacity and microbial composition of the intestines of red swamp crayfish Procambarus clarkii. Fish Shellfish Immunol. 2020, 96, 290–296. [Google Scholar] [CrossRef]
  50. Ma, H.; Wei, P.; Li, X.; Liu, S.; Tian, Y.; Zhang, Q.; Liu, Y. Effects of photoperiod on growth, digestive, metabolic and non-special immunity enzymes of Takifugu rubripes larvae. Aquaculture 2021, 542, 736840. [Google Scholar] [CrossRef]
  51. Tian, H.; Zhang, D.; Xu, C.; Wang, F.; Liu, W. Effects of light intensity on growth, immune responses, antioxidant capability and disease resistance of juvenile blunt snout bream Megalobrama amblycephala. Fish Shellfish Immunol. 2015, 47, 674–680. [Google Scholar] [CrossRef]
  52. Chang, C.; Mayer, M.; Rivera-Ingraham, G.; Blondeau-Bidet, E.; Wu, W.; Lorin-Nebel, C.; Lee, T. Effects of temperature and salinity on antioxidant responses in livers of temperate (Dicentrarchus labrax) and tropical (Chanos Chanos) marine euryhaline fish. J. Therm. Biol. 2021, 99, 103016. [Google Scholar] [CrossRef] [PubMed]
  53. Barda, I.; Purina, I.; Rimsa, E.; Balode, M. Seasonal dynamics of biomarkers in infaunal clam Macoma balthica from the Gulf of Riga (Baltic Sea). J. Mar. Syst. 2014, 129, 150–156. [Google Scholar] [CrossRef]
  54. Nash, S.; Johnstone, J.; Rahman, M. Elevated temperature attenuates ovarian functions and induces apoptosis and oxidative stress in the American oyster, Crassostrea virginica: Potential mechanisms and signaling pathways. Cell Stress Chaperone 2019, 24, 957–967. [Google Scholar] [CrossRef] [PubMed]
  55. Vinagre, C.; Madeira, D.; Mendonca, V.; Dias, M.; Roma, J.; Diniz, M. Effect of increasing temperature in the differential activity of oxidative stress biomarkers in various tissues of the Rock goby, Gobius paganellus. Mar. Environ. Res. 2014, 97, 10–14. [Google Scholar] [CrossRef]
  56. Berdjeb, L.; Ghiglione, J.; Jacquet, S.J.A. Bottom-up versus top-down control of hypo- and epilimnion free-living bacterial community structures in two neighboring freshwater lakes. Appl. Environ. Microbiol. 2011, 77, 3591–3599. [Google Scholar] [CrossRef]
  57. Li, J.; Fang, L.; Liang, X.; Guo, W.; Lv, L.; Li, L. Influence of environmental factors and bacterial community diversity in pond water on health of Chinese perch through Gut Microbiota change. Aquac. Rep. 2011, 20, 100629. [Google Scholar] [CrossRef]
  58. Tianm, C.; Laim, X.; Hem, Y.; Gaom, H. Research progress of gut microbiome of marine fish. J. Anhui Agric. Sci. 2024, 52, 19–22+31. [Google Scholar]
  59. Puvanendran, V.; Brown, J. Foraging, growth and survival of Atlantic cod larvae reared in different light intensities and photoperiods. Aquaculture 2022, 214, 131–151. [Google Scholar] [CrossRef]
  60. Liu, H.; Stickney, R.; Dickhoff, W.; McCaughran, D. Effect of environmental factors on egg development and hatching of Pacific Halibut Hippoglossus stenolepis. J. World Aquac. Soc. 2010, 25, 317–321. [Google Scholar] [CrossRef]
  61. Luan, Y.; Li, M.; Zhou, W.; Yao, Y.; Yang, Y.; Zhang, Z.; Ringø, E.; Olsen, R.; Clarke, J.; Xie, S.; et al. The Fish Microbiota: Research Progress and Potential Applications. Engineering 2023, 29, 137–146. [Google Scholar] [CrossRef]
  62. Qin, K.; Wu, L.; He, Z. The feeding intensity of fat greenling larval under different illumination. Chin. J. Zool. 1999, 34, 4–8. [Google Scholar]
  63. Walburn, J.; Wemheuer, B.; Thomas, T.; Copelandm, E.; O’Connor, W.; Booth, M.; Fielder, S.; Egan, S. Diet and diet-associated bacteria shape early microbiome development inyellowtail kingfish (Seriola lalandi). Microb. Biotechnol. 2019, 12, 275–288. [Google Scholar] [CrossRef] [PubMed]
  64. Ruyet, P.; Mahé, K.; Bayon, N.; Delliou, H. Effects of temperature on growth and metabolism in a Mediterranean population of European sea bass, Dicentrarchus labrax. Aquaculture 2004, 237, 269–280. [Google Scholar] [CrossRef]
  65. Zhou, C.; Yang, S.; Ka, W.; Gao, P.; Li, Y.; Long, R.; Wang, J. Association of gut microbiotawith metabolism in rainbow trout under acute heat stress. Front. Microbiol. 2022, 13, 846336. [Google Scholar]
  66. Ye, L.; Amberg, J.; Chapman, D.; Gaikowski, M.; Liu, W. Fish gut microbiota analysis differentiates physiology and behavior of invasive Asian carp and indigenous American fish. ISME J. 2014, 8, 541–551. [Google Scholar] [CrossRef]
  67. Liu, H.; Guo, X.; Gooneratne, R.; Lai, R.; Zeng, C.; Zhan, F.; Wang, W. The gut microbiome and degradation enzyme activity of wild freshwater fishes influenced by their trophic levels. Sci. Rep. 2016, 6, 24340. [Google Scholar] [CrossRef]
  68. Brown, R.M.; Wiens, G.D.; Salinas, I. Analysis of the gut and gill microbiome of resistant and susceptible lines of rainbow trout (Oncorhynchus mykiss). Fish Shellfish Immunol. 2019, 86, 497–506. [Google Scholar] [CrossRef]
  69. Kuang, T.; He, A.; Lin, Y.; Huang, X.; Zhou, L. Comparative analysis of microbial communities associated with the gill, gut, and habitat of two filter-feeding fish. Aquac. Rep. 2020, 18, 100501. [Google Scholar] [CrossRef]
  70. Shin, N.; Whon, T.; Bae, J. Proteobacteria: Microbial signature of dysbiosis in gut microbiota. Trends Biotechnol. 2015, 33, 496–503. [Google Scholar] [CrossRef]
  71. Blandford, M.I.; Taylor-Brown, A.; Schlacher, T.A.; Nowak, B.; Polkinghorne, A. Epitheliocystis in fish: An emerging aquaculture disease with a global impact. Transbound. Emerg. Dis. 2018, 65, 1436–1446. [Google Scholar] [CrossRef] [PubMed]
  72. Xu, L.; Chen, H.; Zhao, L.; Liu, X.; Xiang, P.; Deng, L.; Song, Z. Host habitats influence the gut microbial assembly mechanisms of cold-water fish. Aquac. Rep. 2024, 36, 102094. [Google Scholar] [CrossRef]
  73. Miyake, S.; Ngugi, D.; Stingl, U. Diet strongly influences the gut microbiota of surgeonfishes. Mol. Ecol. 2015, 24, 656–672. [Google Scholar] [CrossRef]
  74. Youngblut, N.; Reischer, G.; Walters, W.; Schuster, N.; Walzer, C.; Stalder, G.; Ley, R.; Farnleitner, A. Host diet and evolutionary history explain different aspects of gut microbiome diversity among vertebrate clades. Nat. Commun. 2019, 10, 1–15. [Google Scholar] [CrossRef]
  75. Wang, M.; Li, Z.; Shi, J.; Zhong, Y.; Zhao, G.; Liu, D. Effects of different light cycles on feeding and growth of juvenile California perch Microperus salmoides. J. Aquac. 2024, 45, 1–4+31. [Google Scholar]
  76. Qian, Q.; Chen, Z.; Xu, J.; Zhu, Y.; Xu, W.; Gao, X.; Jiang, Q.; Zhang, X. Pathogenicity of Plesiomonas shigelloides causing mass mortalities of largemouth bass (Micropterus salmoides) and its induced host immune response. Fish Shellfish Immunol. 2023, 132, 108487. [Google Scholar] [CrossRef]
  77. Liu, Z.; Ke, X.; Lu, M.; Gao, F.; Zhu, H.; Wang, M. Identification and pathological observation of a pathogenic Plesiomonas shigelloides strain isolated from cultured tilapia (Oreochromis niloticus). Acta Microbiol. Sin. 2015, 55, 96–106. [Google Scholar]
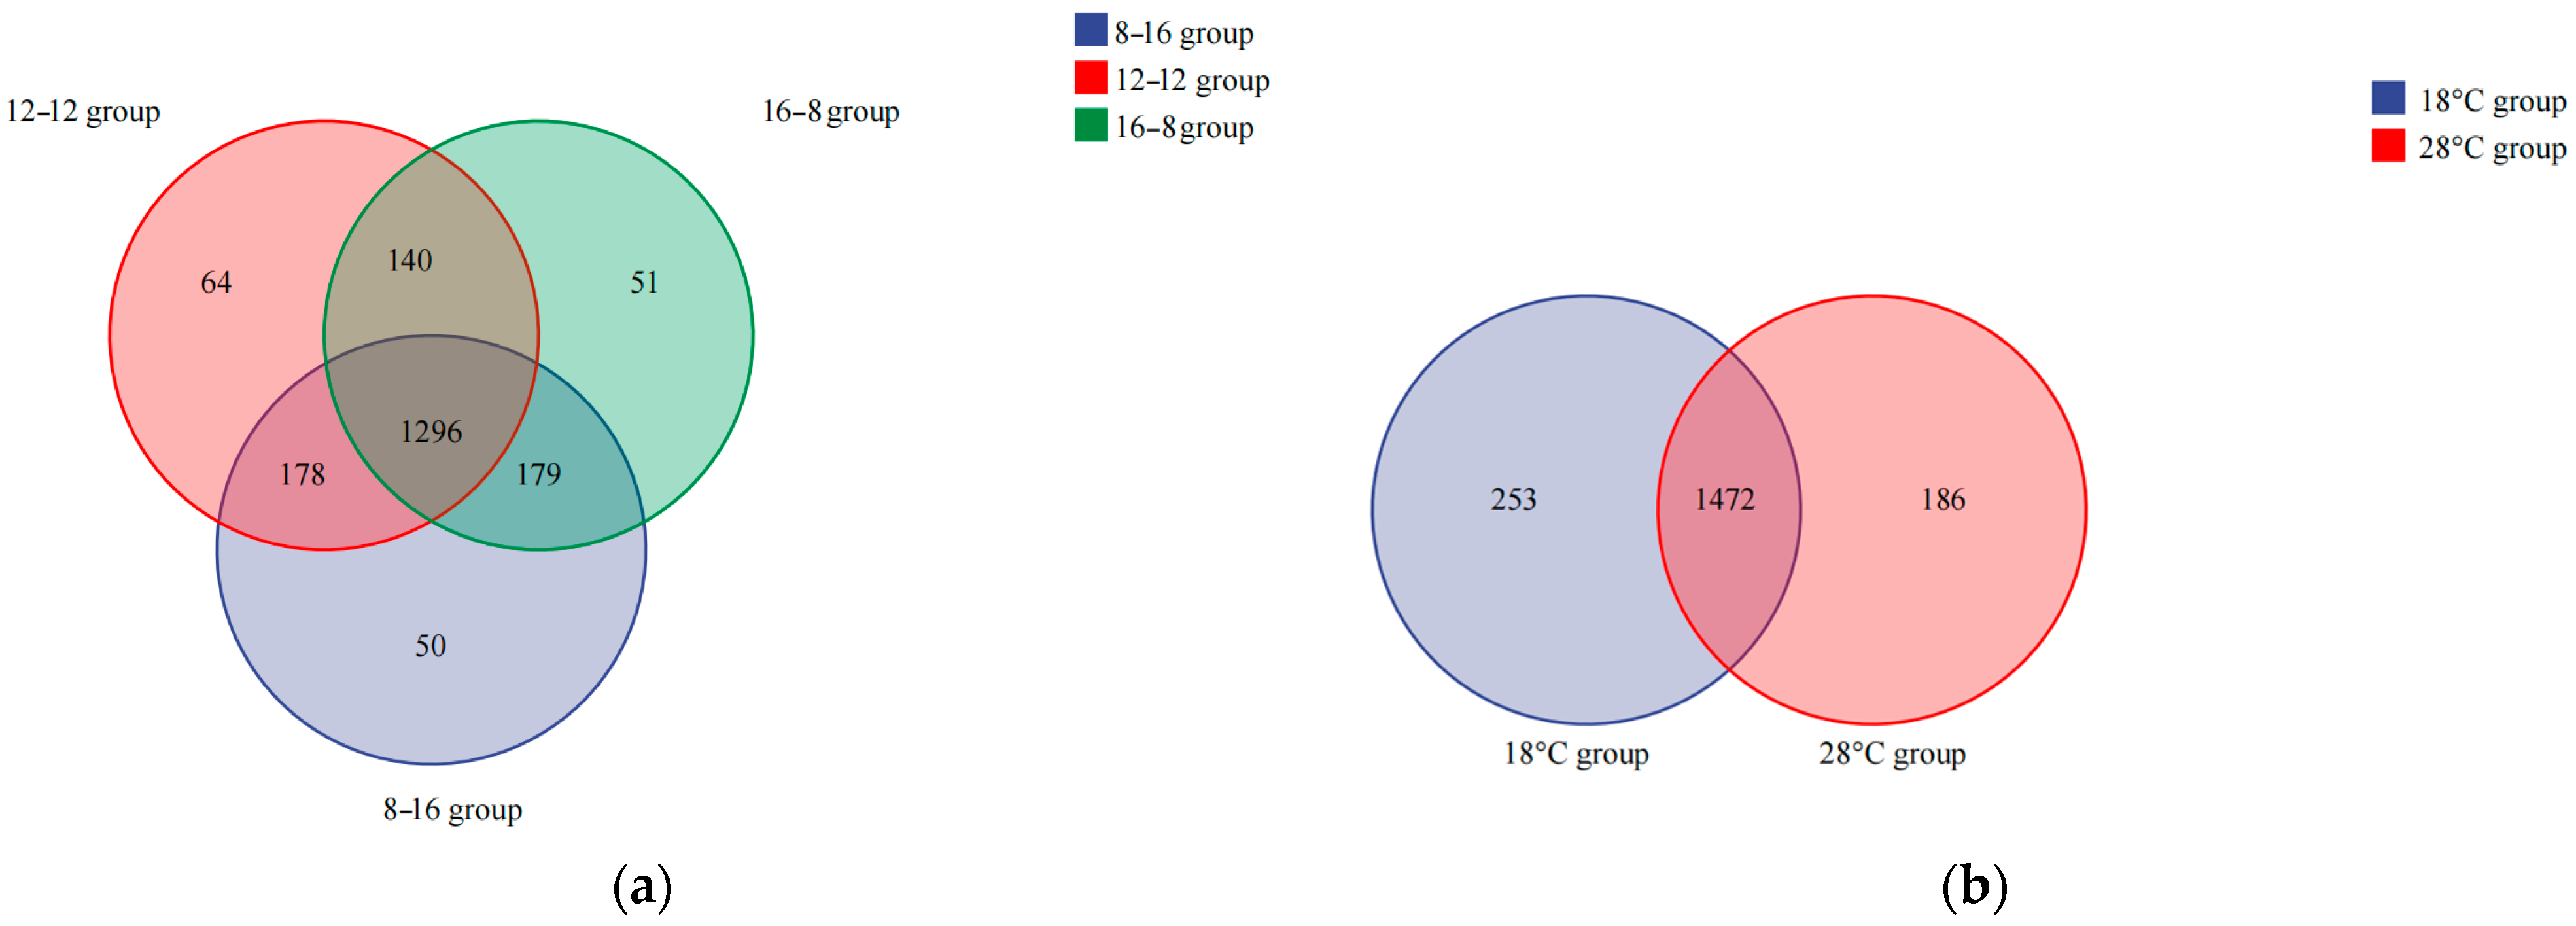
Figure 1. Venn diagram of shared and unique bacterial OTUs in three photoperiod groups (a) and two water temperature groups (b).
Biology 14 01400 g001
Figure 2. Microbial composition and abundance in the three photoperiod groups at the phylum.
Biology 14 01400 g002
Figure 3. Microbial composition and abundance in S. scherzeri in two water temperature.
Biology 14 01400 g003
Figure 4. Microbial composition and abundance in S. scherzeri in three photoperiod groups at the genus level.
Biology 14 01400 g004
Figure 5. Microbial composition and abundance in S. scherzeri in two water temperature groups at the genus level.
Biology 14 01400 g005
Figure 6. Heat map of S. scherzeri in different photoperiods at the phylum level. The color of the small rectangle indicates the abundance of bacteria in samples; red color indicates a high abundance, blue color indicates a low abundance. The group numbering is as follows: the letter “G” represents the photoperiod group. The first digit indicates the specific subgroup, while the second digit denotes the sample’s sequential number within that subgroup, e.g., G11 refers to the first sample in the first subgroup (8L: 16D) of the light group.
Biology 14 01400 g006
Figure 7. Heat map of S. scherzeri in different water temperatures at the phylum level. The color of the small rectangle indicates the abundance of bacteria in samples; red color indicates a high abundance, blue color indicates a low abundance.
Biology 14 01400 g007
Table 1. Activities of antioxidant enzymes and MDA values of different groups.
ConditionGroupAntioxidant Enzymes
MDA (nmol/L)SOD (U/mL)GSH-Px (U/mL)CAT (U/mL)
8L: 16DG110.365734.03118.301125.771
G120.345740.15117.545130.157
G130.385727.91019.056121.386
average0.365734.03118.301125.771
S.E.M0.0206.1210.7554.385
12L: 12DG210.573582.0914.99598.350
G220.565590.1574.335100.157
G230.582574.0245.65596.543
average0.573582.0914.99598.350
S.E.M0.0098.0660.6601.807
16L: 8DG310.419587.52016.467110.905
G320.445567.42915.575111.175
G330.394607.61117.359110.634
average0.419587.52016.467110.905
S.E.M0.02620.0910.8920.271
18 °CW110.497647.6715.59086.694
W120.512666.1775.46883.290
W130.482629.1655.35090.099
average0.497647.6715.46886.694
S.E.M0.01518.5060.1183.405
28 °CW210.2651029.46511.476146.258
W220.2761033.15712.173150.459
W230.2541025.77310.780142.058
average0.2651029.46511.476146.258
S.E.M0.0113.6920.6964.200
Notes: 8L: 16D represents 8 h of light and 16 h of darkness; 12L: 12D represents 12 h of light and 12 h of darkness; 16L: 8D represents 16 h of light and 8 h of darkness. The group numbering is as follows: the letter “G” represents the photoperiod group, and “W” represents the water temperature group. The first digit indicates the specific subgroup, while the second digit denotes the sample’s sequential number within that subgroup, e.g., G11 refers to the first sample in the first subgroup (8L: 16D) of the light group.
Table 2. Abundance and diversity indices of species in different sampling groups at 97% similarity level.
GroupObserved OTUsPredicted ACEOTUs Chao1SimpsonShannonGood’s Coverage
8L: 16D1161.33 ± 106.82 a1210.84 ± 94.81 a1286.26 ± 86.91 a0.99 ± 0.00 a8.39 ± 0.27 a0.99 ± 0.00 a
12L: 12D1158.00 ± 19.67 a1240.04 ± 4.36 a1318.67 ± 5.91 a0.98 ± 0.00 a8.10 ± 0.11 a0.99 ± 0.00 a
16L: 8D1130.00 ± 82.82 a1195.09 ± 46.50 a1284.58 ± 50.49 a0.98 ± 0.01 a8.09 ± 0.35 a0.99 ± 0.00 a
18 °C1214.33 ± 77.59 a1272.36 ± 54.22 a1373.37 ± 32.52 a0.99 ± 0.00 a8.61 ± 0.09 a0.99 ± 0.00 a
28 °C1147.33 ± 33.56 a1193.52 ± 27.17 b1268.18 ± 62.31 b0.98 ± 0.00 a8.23 ± 0.15 b0.99 ± 0.00 a
Notes: 8L: 16D represents 8 h of light and 16 h of darkness; 12L: 12D represents 12 h of light and 12 h of darkness; 16L: 8D represents 16 h of light and 8 h of darkness. Data are presented as mean ± S.E.M. The column exhibiting disparate characters denotes statistically significant variations among the groups, as determined by a one-way analysis of variance (ANOVA) coupled with a subsequent post hoc test (p < 0.05).
Disclaimer/Publisher’s Note: The statements, opinions and data contained in all publications are solely those of the individual author(s) and contributor(s) and not of MDPI and/or the editor(s). MDPI and/or the editor(s) disclaim responsibility for any injury to people or property resulting from any ideas, methods, instructions or products referred to in the content.