Article

Mitogenomic Characterization of Mining Bee Family Andrenidae (Hymenoptera: Apoidea: Anthophila) and Insights into Bee Phylogeny

1
School of Criminal Justice, Shandong University of Political Science and Law, Jinan 250014, China
2
Characteristic Laboratory of Forensic Science in Universities of Shandong Province, Shandong University of Political Science and Law, Jinan 250014, China
3
State Key Laboratory of Animal Biodiversity Conservation and Integrated Pest Management, Institute of Zoology, Chinese Academy of Sciences, Beijing 100101, China
Biology 2025, 14(10), 1374; https://doi.org/10.3390/biology14101374
Submission received: 6 September 2025 / Revised: 30 September 2025 / Accepted: 7 October 2025 / Published: 8 October 2025

Abstract

Simple Summary

Bees exhibit exceptional efficiency in pollination processes. The family Andrenidae, comprising over 3000 described species, represents an important lineage of bees, yet limited molecular information has constrained insights into its evolutionary history. This study sequenced and assembled five mitochondrial genomes of Andrenidae collected from Xizang, Tibet. Comparative genomic approaches were used to analyze nucleotide composition, codon preferences, and Ka/Ks ratios of the newly obtained mitogenomes. Furthermore, previously published datasets have been integrated to reconstruct phylogenetic relationships among bees employing both Bayesian Inference and Maximum Likelihood methods. These findings significantly expand the available molecular resources for Andrenidae and offer valuable references for future investigations into the evolutionary biology of this family and bees more broadly.

Abstract

Andrenidae is a major pollinator lineage with considerable ecological importance, yet limited molecular resources have impeded comprehensive understanding of its evolutionary history. This study sequenced and assembled five mitogenomes of Andrenidae, which were collected from Xizang, Tibet. Analyses included sequence size, nucleotide composition, Ka/Ks ratios, and gene rearrangements. The assembled mitogenomes ranged from 15,631 to 18,506 bp in length. AT content (%) varied between 74.46 and 79.85. Relative synonymous codon usage analysis revealed that AUU, UUA, UUU, and UUA were the most frequently preferred codons. All 13 protein-coding genes displayed Ka/Ks values below one, with ATP8 showing the highest ratio and COX1 the lowest. Gene rearrangements occurred in all mitogenomes, and three distinct tRNA rearrangement patterns were detected. This study provided more available molecular data for future evolutionary biology studies of Andrenidae. Additionally, 24 previously published Apoidea mitogenomes (three outgroups and 26 ingroups) were incorporated to infer phylogenetic relationships using Maximum Likelihood and Bayesian Inference methods. The results supported Melittidae as the basal lineage of bees, while Andrenidae was recovered as the sister clade to Halictidae + Colletidae.

1. Introduction

Bees, comprising roughly 20,900 described species [1], represent the most species-rich group of pollen-feeding insects and act as vital pollinators in ecosystems [2,3]. Bees display remarkably diverse life-history strategies, such as variable social behavior, nesting strategies, brood parasitism, and dietary specializations on specific host plants [4,5]. Those complicated traits have made bees a model group for investigating coevolution between insects and flowers, evolutionary biology, and applied ecology [2,4].
At present, bees are classified into seven families, including two long-tongued (LT) bee families, Apidae and Megachilidae, and five short-tongued (ST) bee families, Halictidae, Colletidae, Andrenidae, Stenotritidae, and Melittidae [5,6]. The validity and monophyly of each family have been continuously confirmed in subsequent studies [7,8,9]. During the early phases of research, some bee researchers, including Michener, Engel, and Alexander identified that Colletidae was the basal group of bees, and treated it as the sister group of the remaining bee families based on morphological characteristics [5,10,11,12]. With the advancement of molecular techniques, Danforth inferred the phylogenetic relationships among bee families using Maximum Likelihood (ML) and Bayesian Inference methods (BI) with multiple nuclear genes (28S, EF-1α) as well as morphological data [9]. This analysis supported Melittidae as the basal bee lineage and the sister taxon to all remaining families, and Andrenidae is the sister group of (Halictidae + (Colletidae+ Stenotritidae)). Those results have been repeatedly confirmed in subsequent research based on enrichment of ultraconserved elements (UCEs) and transcriptome [9,13,14,15]. However, the phylogenetic relationship of bees also needs to be corroborated with more phylogenetic makers.
The mining bee (Andrenidae) is a major bee family comprising over 3000 described species distributed worldwide, except in Australia [1]. Species of this group are solitary, ground-nesting bees, many of which exhibit narrow host-plant preferences supported by specialized behaviors and morphologies [5]. Andrenidae include the second largest bee genus Andrena (~1500 described species), mainly distributed throughout Holarctic species [4,5]. This genus is a very complicated, difficult, and interesting bee group, both for biology and taxonomy. Most andrenines are oligolectic, often specializing on plant families, such as Asteraceae, Apiaceae, Brassicaceae, Ericaceae, Fabaceae, and Rosaceae [16]. Some Andrena species form communal nests where males monopolize females, and studies showed that a high proportion of females mate in their natal nests before emergence, frequently with nest mates, leading to elevated inbreeding levels [17,18]. Despite existing work on this group, studies addressing molecular evolutionary mechanisms are still restricted, largely owing to inadequate sequence data. For example, among the more than 3000 species of Andrenidae, only 37 mitochondrial genomes have been published (accessed from the NCBI database on 20 Aug. 2025). This severe lack of molecular data has significantly constrained evolutionary and phylogenetic research on the group.
Mitochondrial genomes serve as widely applied molecular markers in research on insect phylogeny, evolutionary history, speciation, and phylogeography [19,20,21]. Compared with nuclear genes, mitochondrial genomes possess several advantages, including smaller molecular size, relatively simple structure, stable gene content, high copy number, and faster evolutionary rate, maternal inheritance, elevated substitution rates, and ease of sequencing making them one of the most widely used molecular markers for investigating evolutionary relationships and genetic diversity [19,22,23]. In insects, mitogenomes usually span 14–20 kb and contain 22 transfer RNAs (tRNAs), 13 protein-coding genes (PCGs), two ribosomal RNAs (rRNAs), and a non-coding control region (CR) [23]. Gene content and arrangement are generally conserved, whereas structural characteristics provide supplementary evidence for taxonomic classification [23]. The rapid growth in complete insect mitogenome datasets, driven by advances in next-generation sequencing, has greatly enhanced comparative structural analyses and improved reconstructions of evolutionary histories across lineages [22,23,24,25].
In this study, mitochondrial genomes of five Andrenidae species were sequenced, assembled, and annotated for the first time, all newly generated data were deposited in the NCBI database. Alongside one previously published mitogenome, we analyzed genome architecture, evolutionary dynamics, and substitution patterns within the group. In addition, this study combined newly sequenced data with 24 published bee mitogenomes to reconstruct the phylogenetic relationships of bees using both BI and ML approaches based on five matrices.

2. Materials and Methods

2.1. Taxon Sampling and Sequencing

This study sequenced and assembled mitogenomes of five Andrenidae species collected from Xizang, Tibet (Table 1). Specimens were preserved in 99% ethanol and then stored at −20 °C until DNA extraction and identification. All species were determined morphologically by a taxonomist (Zeqing Niu) based on morphological characters [26,27]. Genomic DNA was extracted from legs using the Qiagen DNeasy Blood & Tissue Kit (Qiagen, Venlo, The Netherlands), and DNA concentration was quantified with a Qubit® 2.0 Fluorometer (ThermoFisher, USA) and the Qubit® DNA Assay Kit (ThermoFisher, Waltham, MA, USA). Sequencing libraries with a 350 bp insert size were prepared and sequenced as paired-end 150 bp reads on the Illumina NovaSeq 6000 platform. Raw data were filtered with Trimmomatic v0.32 [28] to remove adapters, low-quality bases, and short reads.

2.2. Assembly, Annotation, and Composition Analyses

Two assembly strategies were employed for the mitogenomes. NOVOPlasty v3.8.3 (Brussels, Belgium) [29] was used with COX1 sequences as seed and k-mer sizes of 23–39 bp. IDBA-UD v1.1.3 (Boston, MA, USA) [30] assembled Illumina reads with parameters “--mink 40 --maxk 120”. Assemblies from both pipelines were compared and merged into a consensus sequence using Geneious v2025.2.1 (Boston, MA, USA) [31]. tRNA secondary structures were predicted with tRNAscan-SE [32], while PCGs and ribosomal RNAs (rRNAs) were annotated in Geneious through alignment with related taxa. Gene boundaries of PCGs and rRNAs were validated using MEGA X [33]. SeqKit v0.16.0 (Chongqing, China) [34] was applied to examine nucleotide composition and compositional bias. The AT-skew and GC-skew were calculated as follows: AT-skew = (A − T)/(A + T), and GC-skew = (G − C)/(G + C). Relative synonymous codon usage (RSCU) values for the newly sequenced species were estimated in MEGA X. Dnasp v6 [35] was used to calculate Ka and Ks values. Circular mitogenome maps were visualized with the online tool CGview.

2.3. Phylogenetic Analysis

In total, we selected 29 species to infer the phylogenetic relationship of bees, containing 26 ingroups and three sphecid wasp species as outgroups based on previous studies of Apoidea [36]. Nucleotide and protein sequences were aligned using MAFFT v7.450 (Osaka, Japan) [37] with the L-INS-I strategy. Trimal v1.4.1 (Barcelona, Spain) [38] was applied with “-automated1” strategy to refine sequences. Five concatenated datasets were then generated with FASconCAT-G v1.04 (Santa Cruz, CA, USA) [39] to reconstruct phylogenetic relationships: (1) cds_fna, nucleotide sequences of all PCGs; (2) cds_faa, amino acid sequences of all PCGs; (3) cds12_fna, nucleotide sequences of PCGs excluding third codon positions; (4) cds12_rrna, nucleotide sequences of PCGs (without third codon positions) combined with two rRNAs; and (5) cds_rrna, nucleotide sequences of all PCGs and rRNAs.
ML and BI approaches were applied to reconstruct the phylogenetic relationship of bees across all datasets. For ML analyses, ModelFinder [40] in IQTREE 2 (Canberra, ACT, Australia) [41] was used to determine the best-fitting substitution for each matrix. BI trees were inferred using Phylobayes-MPI v1.9 (Montréal, QC, Canada) [42] under the site-heterogeneous mixture model (−m CAT + GTR). Two independent Markov Chain Monte Carlo (MCMC) chains were run for 10,000,000 generations each and terminated upon reaching satisfactory convergence (maxdiff < 0.3).

3. Results and Discussion

3.1. Mitogenomic Organization

Approximately six Gb of raw reads were generated for per species. Five Andrenidae species (Andrena bentoni, Andrena nigricula, Andrena opercula, Andrena ruficrus, Andrena tateyamana) were sequenced and assembled, all of which were complete mitogenomes, except A. bentoni was linear. These newly sequenced mitogenomes have been submitted to GenBank (PX147440–PX147444, Table 1). The features of the newly reported species were similar to published bee species [43,44]. For the newly sequenced species, the complete mitogenome ranged from 15,631 (A. tateyamana) to 18,506 bp (A. ruficrus), including one CR, two rRNAs, 22 tRNAs, and 13 PCGs in the structure (Table 2; Figure 1). Variation in the length of the control region contributes to interspecific differences in this region and directly influences the overall size of the mitochondrial genome [21,22]. AT skew values were positive across all species, ranging from 0.098 (A. ruficrus) to 0.139 (A. bentoni), whereas GC skew values were negative, from −0.358 (A. opercula) to −0.290 (A. ruficrus) (Table 2). AT content varied between 74.46% (A. bentoni) and 79.85% (A. ruficrus). Consistent with other insect mitogenomes [19,25], the positive AT skew and negative GC skew observed here indicate a bias toward thymine (T) and guanine (G) in Hymenoptera, in line with previous studies on bees and related taxa [45,46,47]. Gene order was conserved across all newly sequenced species.

3.2. Protein-Coding Genes and Evolutionary Rates

Among the newly sequenced species, the lengths of PCGs, tRNAs, and rRNAs exhibited little variation (Table 2). PCGs size ranged from 11,051 (A. nigricula) to 11,080 bp (A. ruficrus, Table 2) in length. AT skew values of newly reported mitogenomes were negative, varying from −0.060 (A. tateyamana) to −0.470 (A. bentoni), while GC skew values were negative across all mitogenomes, ranging from −0.170 (A. bentoni) to −0.079 (A. ruficrus, Table 2). The G + C content (%) ranged from 20.30 (A. tateyamana) to 26.68 (A. bentoni), and the A + T content (%) ranged from 73.30 (A. bentoni) to 79.70 (A. tateyamana, Table 2). These results indicate a strong bias toward A + T bias in nucleotide composition, consistent with patterns reported for other Hymenoptera mitogenomes [46,48]. Clary and Wolstenholme reported that such bias in nucleotide usage may result from the preferential incorporation of specific bases by DNA polymerases during mitochondrial DNA replication [49].
Among the newly obtained species, A. tateyamana showed the shortest CR size (937 bp), whereas A. ruficrus possessed the longest (3834 bp, Table 2). All PCGs started with codon ATN (Figure S1). The start codons for ATP6, COX3, and ND4 were ATG in all species; ATA was the start codon of ATP8, and CYTB in one species; ATP8, CYTB, and ND2 used ATT as the start codons in three species. In addition, the start codon of ND4L was TTG (Figure S1). The common stop codons were TAA or TAG, though variation existed: ATP6 and COX3 terminated with TA in one species, and ND4 exhibited T as the stop codon in all newly sequenced species, which exhibited incomplete termination (Figure S2). In insect mitogenomes, PCGs frequently terminate with incomplete stop codons, which are subsequently completed through post-transcriptional polyadenylation following excision of the adjacent downstream tRNA [50,51,52].
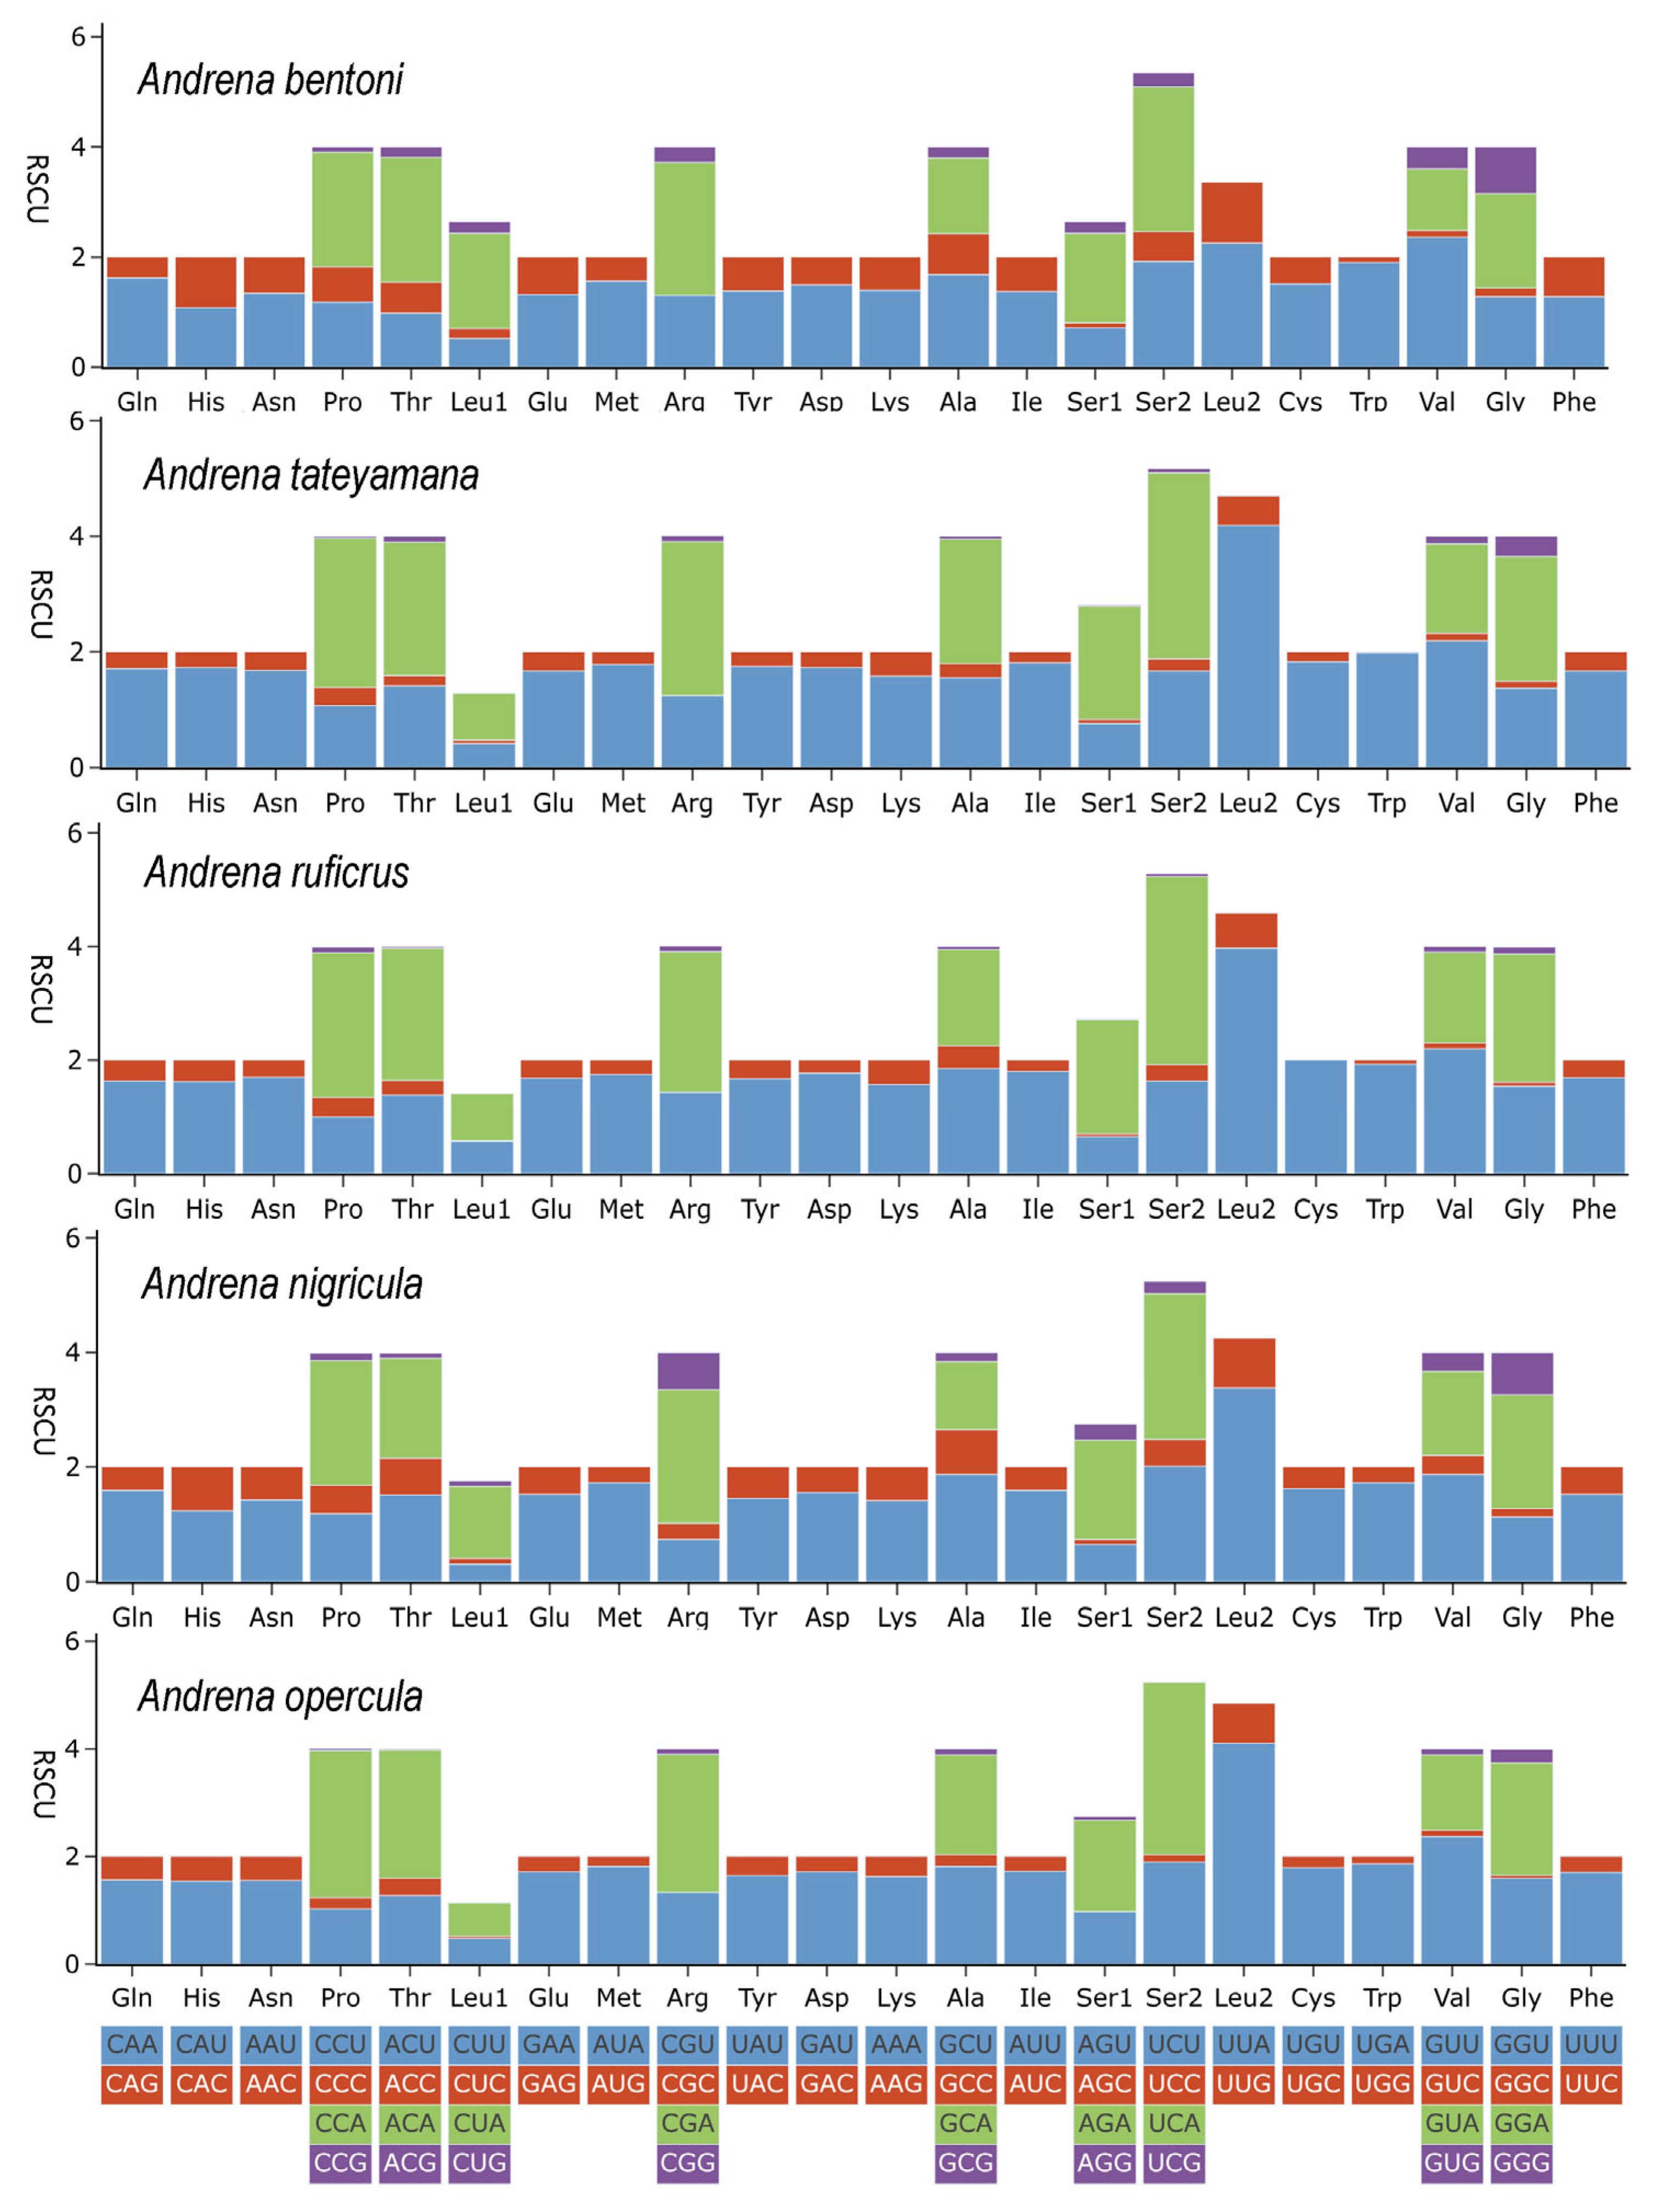
The five newly sequenced mitochondrial genomes displayed consistent RSCU patterns (Figure 2), calculated from 62 codons encoding 22 amino acids in the 13 PCGs of Andrnae species. Preferred codons included AUU, AUA, UUA, and UUU (Tables S1–S6). Leu2, Phe, and Ile were the most frequently used amino acids, indicating a strong bias toward A/T-rich codons. For most of the newly sequenced species, codons with RSCU > 2 followed the order UUA > UCA > CGA, while A. bentoni showed UCA > CGA > GUU (Figure 2; Tables S1–S6). Overall, NNU and NNA were the most common codons, reflecting the strong AT bias in nucleotide composition (Tables S1–S6).
The Ka/Ks ratio (ω) is widely used to evaluate the effect of natural selection on sequence evolution [53,54]. For all 13 PCGS, Ka/Ks ratios were below one, ranging from 0.058 (COX1) to 0.538 (ATP8, Figure 3), consistent with patterns reported in other insects. The relative evolutionary rates among PCGs followed the order: ATP8 > ND6 > ND2 > ND4L > COX3 > ND5 > ATP6 > ND1 > ND3 > CYTB > COX2 > COX1 (Figure 3). These findings indicated that most PCGs were subject to purifying selection, with deleterious mutations effectively removed during evolution (Figure 3). However, the strength of purifying selection varied across different genes. Specifically, ATP8, ND6, and ND2 displayed relatively higher ω values, suggesting that they were subjected to more relaxed purifying selection, potentially reflecting functional constraints that were less stringent compared to other PCGs, which were pivotal in cellular energy production. In contrast, COX2 and COX1 showed low ω values, indicating that they were under strong purifying selection and have remained relatively conserved during evolution. These patterns were consistent with previous studies on bees, further supporting the notion that genes associated with the oxidative phosphorylation pathway, particularly cytochrome oxidase subunits, were typically constrained by evolutionary pressures due to their indispensable role in cellular respiration and energy metabolism [55,56].
All 22 tRNAs were identified in all newly sequenced species, with lengths ranging from 57 to 71 bp. The tRNAs exhibited the following features: AT content varied from 81.32% (A. nigricula) to 83.93% (A. opercula); GC content ranged from 16.07% (A. opercula) to 18.61% (A. nigricula); and both AT and GC skews were positive (Table 2).
The large subunit rRNA (rrnL) and the small subunit rRNA (rrnS) were detected in the newly obtained mitogenome. rrnL length ranged from 1267 (A. ruficrus) to 1280 bp (A. nigricula), and rrnS ranged from 743 (A. tateyamana) to 776 bp (A. nigricula). AT content (%) of rrnL ranged from 79.69 (A. nigricula) to 82.19 (A. tateyamana), while for rrnS ranged from 77.12 (A. bentoni) to 81.70 (A. tateyamana). The AT skew of rrnL (−0.120 to −0.078) and rrnS was negative (−0.117 to −0.028), while GC skew was positive (Table 2).

3.3. Gene Rearrangement

Although relatively uncommon, mitochondrial gene rearrangements have been documented in Hymenoptera, Thysanoptera, Trichoptera, Hemiptera, and Psocodea [20,47,57,58,59]. Four principal types are currently recognized: local inversion, remote inversion, gene shuffling, and translocation [48]. For Apoidea, inversion and inverse transposition occurred relatively frequently, paralleling patterns observed in other hymenopterans [47,48,60]. Furthermore, four main hypotheses have been proposed regarding the mechanisms underlying mitochondrial gene rearrangements in animals: Tandem duplication/random loss, TDRL [61], Tandem duplication/nonrandom loss, TDNL [62], recombination [63], and Anticodon mutation [64]. The tandem duplication/random loss (TDRL) and recombination hypotheses have been widely applied to explain mitochondrial rearrangements in insects. The former is often invoked to account for gene translocations and gene shuffling events, whereas the latter is primarily used to explain inversions and transpositions [48]. In contrast, the replication/anticodon mutation and tandem duplication/non-random loss hypotheses are relatively uncommon in insects and even across arthropods. More broadly, members of Hymenoptera exhibited particularly extensive mitochondrial rearrangements, which often provide valuable phylogenetic information [19,45,48,57]. Despite this, the processes driving such rearrangements in Andrenidae remained poorly understood, largely due to the scarcity of available mitogenome data.
The gene order of Drosophila yakuba was chosen as the ancestral reference [49]. In contrast to the putative ancestral insect mitogenome, all five newly sequenced species exhibited gene rearrangement. Totally, three gene rearrangement patterns were found, and all rearranged genes were tRNA (Figure 4). The gene order of all newly sequenced species was the same. The gene cluster trnI-trnQ-trnM was rearranged to trnM-trnI-trnQ (Figure 4); the trnK-trnD tRNA block was rearranged: COX2-trnK-trnD to COX2-trnD-trnK, and the trnW-trnC-trnY was inverted to trnC-trnY-trnW, which were consistent with previously published mitogenomes of the genus Andrena [44].
Gene shuffling events, including trnI-trnQ-trnM, trnW-trnC-trnY, and trnK-trnD, represent recurring rearrangement patterns in bees and have been widely regarded as a hallmark of Hymenoptera mitochondrial evolution [43,47,48,60]. The segment CR-trnI-trnQ-trnM-nad2-trnW-trnC-trnY has been identified as the principal rearrangement hotspot in bees, and our results confirm that Andrenidae also exhibits frequent changes in this region (Figure 4). The persistence of rearrangements within this cluster likely reflects structural susceptibility of the control region-proximal tRNAs, which may facilitate events such as slipped-strand mispairing or tandem duplication followed by random loss [64,65]. The recurrent emergence of these rearrangements across Apoidea underscore their phylogenetic informativeness, offering not only a robust marker for resolving hymenopteran relationships but also key insights into the molecular mechanisms driving mitogenome plasticity in insects [19,25,44]. The mitochondrial genome theoretically contains 37 genes with substantial potential for rearrangement, making it unlikely for distinct species to retain identical gene orders. Therefore, conserved sequences more likely reflect shared evolutionary origins [19,45,57].
In this study, all rearrangement patterns were consistently observed across all newly sequenced species, suggesting that tRNA gene rearrangements may represent a characteristic feature of Andrenidae. By contrast, many other Hymenoptera and insect lineages display more variable mitochondrial gene arrangements [44,45]. Compared the gene order of bee families, we found that Halictidae exhibited diverse and complex rearrangement patterns [43,45], highlighting that gene rearrangement may include phylogenetic markers for elucidating evolutionary relationships within the family. Unfortunately, due to sample limitations, our understanding of the evolution underlying gene rearrangement in bees remains unclear.

3.4. Phylogenetic Relationships

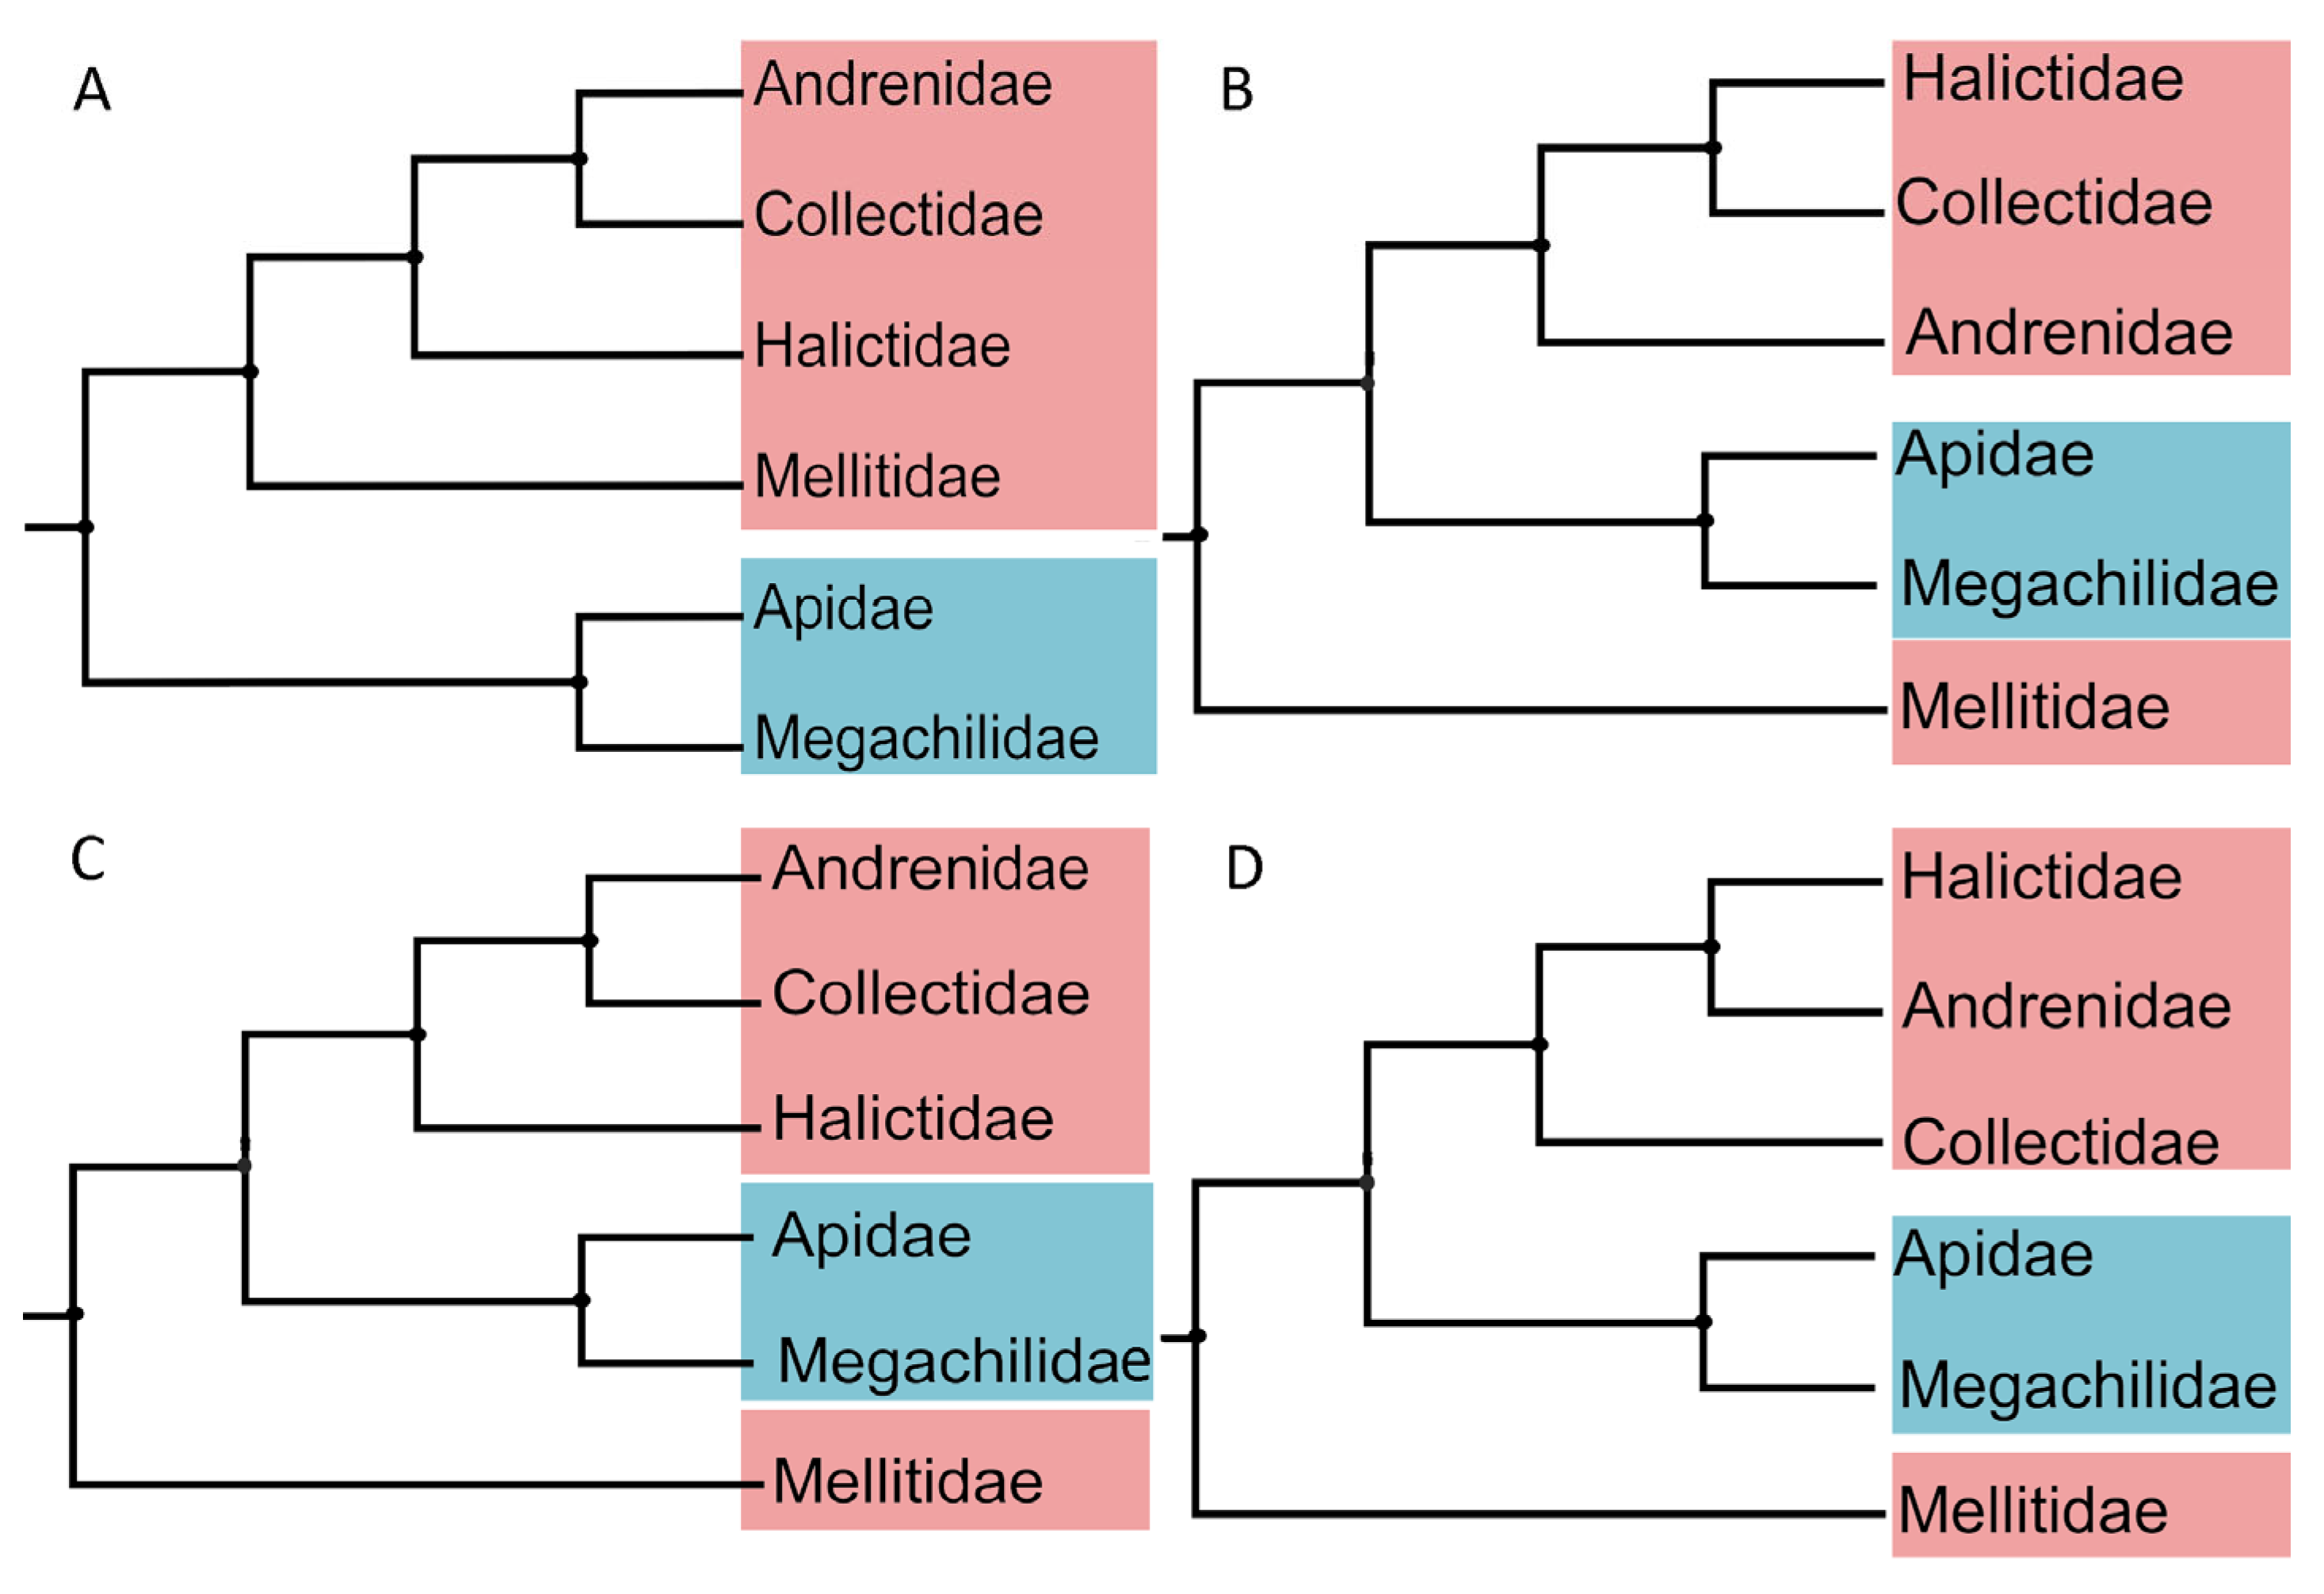
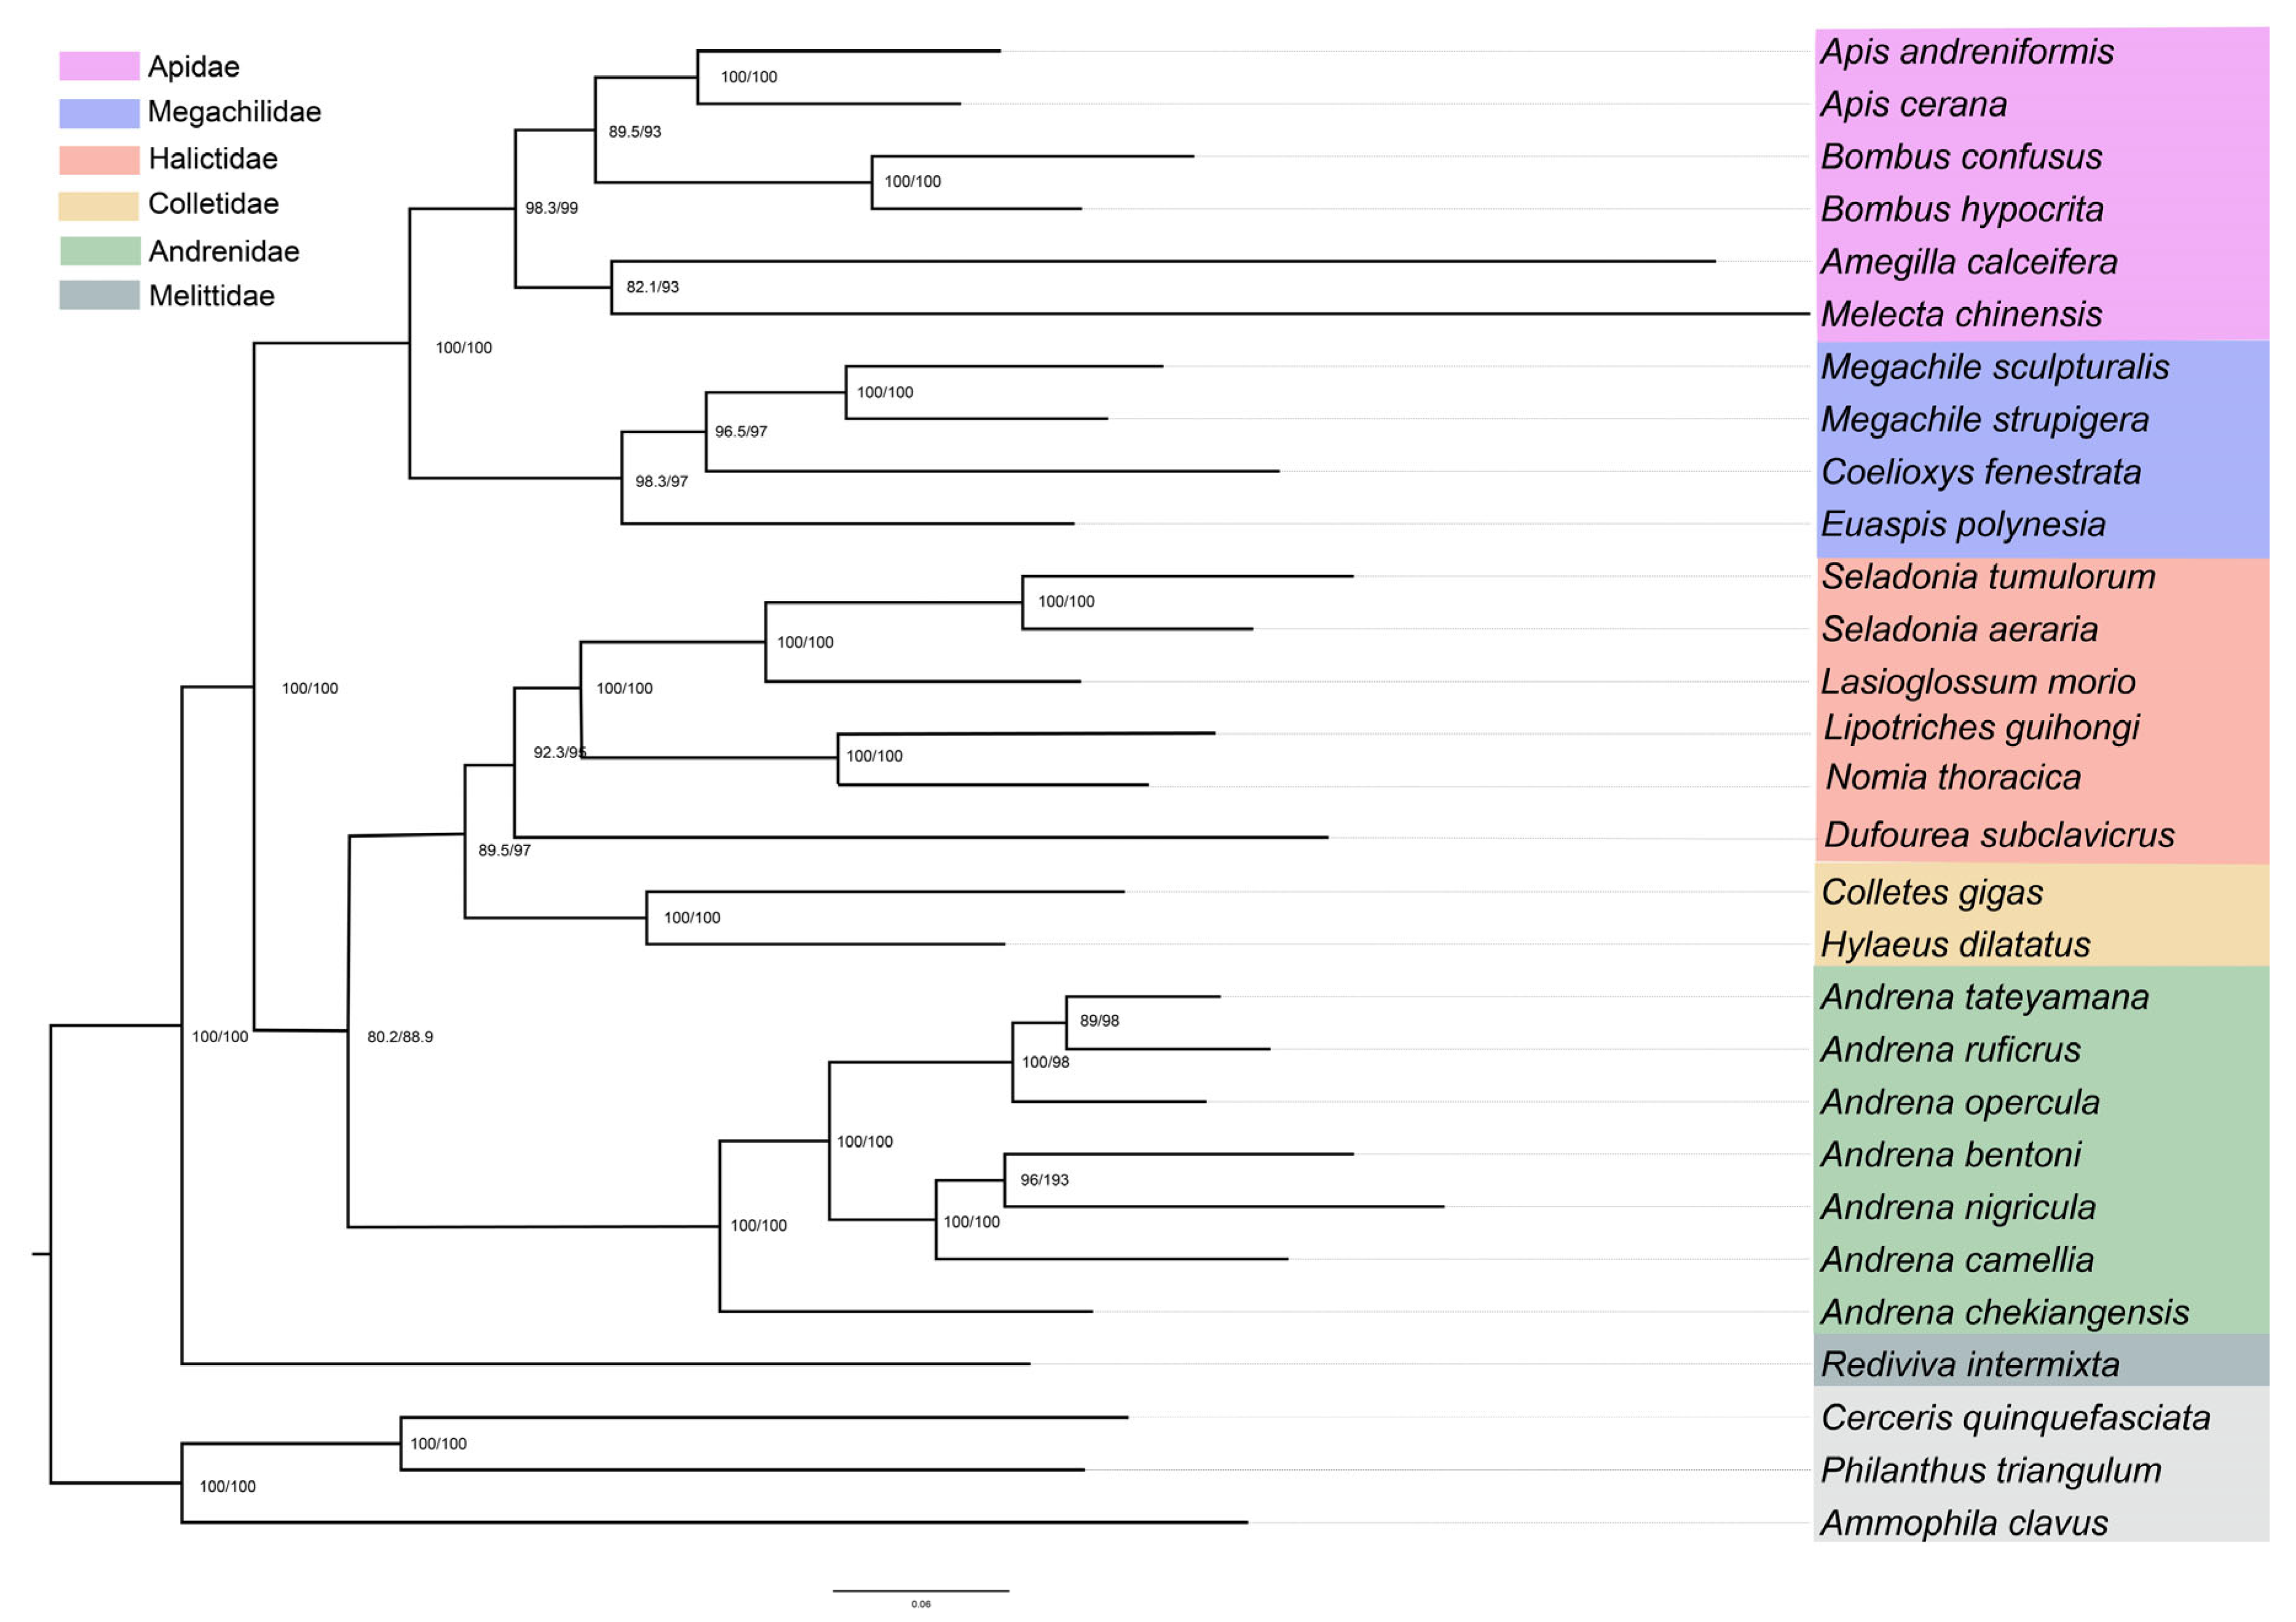
In this study, we used 26 bee species and three outgroups to infer the phylogenetic relationships of bees. Five concatenated datasets were analyzed using BI and ML approaches: cds_faa (3264 sites), cds_fna (9792 sites), cds_rrna (11,736 sites), cds12_fna (6528 sites), and cds12_rrna (8472 sites), and four topologies were generated finally (Figure 5, Figure 6 and Figures S3–S11). All of them supported the monophyly of LT bees (Figure 5, Figure 6 and Figures S3–S11). Topology 1 (T1) was inferred from cds_faa using BI and ML methods (Figure 5A, Figures S3 and S4). This topology suggested that ST bees were monophyletic group. Topology 2 (T2) was generated by matrices cds_fna using BI and ML model, and cds12_fna using BI methods (Figure 5B, Figure 6, Figures S5 and S6). This topology suggested that Mellitidae was the basal group of bees, and Andrenidea was the sister group of Halictidae + Colletidae. Topology 3 (T3) was generated using cds12_rrna based on ML and BI methods (Figure 5C, Figures S7 and S8). This topology supported that Mellitidae was the basal lineage of bees, and Halictidae was the sister group of Andrenidae + Colletidae. Topology 4 (T4) was generated using cds_rrna based on ML and BI methods, and cds12_fna using ML methods (Figure 5D, Figures S9–S11). This topology supported that Mellitidae was the basal group of bees, and Colletidae was the sister group of Halictidae + Andrenidae.
Our findings strongly supported the monophyly of all bee families, except Melittidae, for which only a single species was included. All topologies, except T1, placed Melittidae as the basal lineage of bees (Figure 5), which has been confirmed by several previous studies with morphological and molecular data [9,44,66]. But, Kahnt et al. used two rRNAs and 13 PCGs to infer the phylogenetic relationship of bees with BI and ML methods, finding that Melittidae was the sister group of Colletidae in 2015 [67]. However, their analysis did not include Halictidae and Andrenidae, and most bee researchers disagree with this point [14,15].
The monophyly of LT bees was robustly supported, consistent with evidence from both morphological and molecular studies [4,9]. Considering Melittidae as the sister group to the remaining bee families, ST bees were inferred to be paraphyletic. Within ST bees, the relationship of (Andrenidae + (Halictidae + Colletidae)) was robustly recovered using cds_fna and cds12_fna (Figure 6, Figures S5 and S6), consistent with the currently accepted results [4,8,36,68]. This suggests that a total-evidence strategy based on nucleotide sequences may provide an effective approach for analyzing mitochondrial genome data [69].
However, the phylogenetic positions of Halictidae, Colletidae, and Andrenidae were highly unstable across different datasets in this study (Figure 5), likely reflecting conflicting signals among mitochondrial genes. Many studies have reported that incongruent phylogenetic signals are frequently observed between nuclear and mitochondrial genes [19,25,46,68]. When mitochondrial genomes were applied in phylogenetic analyses, variation in gene choice, site selection, or evolutionary models could yield different results [68,70,71]. In addition, the high AT content and compositional heterogeneity of insect mitochondrial genomes might also introduce systematic errors in phylogenetic analyses, leading to inconsistencies with mitochondrial and nuclear gene data [72,73]. Similarity in nucleotide composition led to the incorrect inference of distantly related taxa as closely related [70,71]. Such biases have been reported in mitochondrial phylogenomic studies of Coleoptera, Hymenoptera, and Hemiptera [70,74,75]. Variable topologies among different matrices and methods (BI, ML) indicated that further phylogenomic and taxonomic research. Future work should aim to integrate mitochondrial and nuclear datasets, apply site-heterogeneous models, and incorporate additional phylogenetic markers such as ultraconserved elements (UCEs) or single-copy orthologs (USCOs). USCOs have already been successfully applied in phylogenetic analyses of other insect groups, demonstrating their utility for resolving deep divergences and improving tree robustness. Such integrative approaches are expected to enhance phylogenetic resolution and support for deep divergences within Andrenidae and across bees, providing a more comprehensive understanding of their evolutionary history [76,77,78].

4. Conclusions

Herein, five mitogenomes of Andrenidae were newly sequenced, assembled, and annotated. Comparative analyses found that all newly obtained mitogenomes shared similar structural characters and nucleotide compositions. Gene rearrangements were exhibited in each of the newly reported mitogenomes. These new genomic resources not only enrich the limited mitochondrial dataset available for this underrepresented bee family but also provide valuable insights into gene rearrangements, codon usage patterns, and phylogenetic relationship. By incorporating 24 previously published species, we reconstructed the phylogenetic relationship of bees using BI and ML approaches. The results showed that Melittidae was the basal group of bees, and Andrenidae was the sister group of Halictidae + Colletidae. Further studies, incorporating additional samples and employing more phylogenetic markers, such as UCEs and USCOs are needed to resolve the phylogenetic relationships within the family and to advance our understanding of the evolutionary biology of bees.

Supplementary Materials

The following supporting information can be downloaded at: https://www.mdpi.com/article/10.3390/biology14101374/s1. Table S1: RSCUs of Andrena bentoni. Table S2: RSCUs Andrena nigricula. Table S3: RSCUs of Andrena opercula. Table S4: RSCUs of Andrena ruficrus. Table S5: RSCUs of Andrena tateyamana. Figure S1. Start codons of PCGs for newly obtained mitogenomes. X-axis shows PCGS, and the Y-axis indicates the number of species. Figure S2. Stop codons of PCGs among newly reported mitogenomes. X-axis shows PCGS, and the Y-axis indicates the number of species. Figure S3: ML analysis of bees based on cds_faa using partitioned model in IQTREE. Nodes support values indicate SH-aLRT/UFBoot2. Figure S4. BI tree of bees based on cd_faa with a GTR + CAT model in phylobayes. Nodes support values indicate Bayesian posterior probabilities. Figure S5: ML analysis of bees based on cds_rrna using partitioned model in IQTREE. Nodes support values indicate SH-aLRT/UFBoot2. Figure S6: BI tree of bees based on cd_rrna with a GTR + CAT model in phylobayes. Nodes support values indicate Bayesian posterior probabilities. Figure S7: BI tree of bees based on cd_fna with a GTR + CAT model in phylobayes. Nodes support values indicate Bayesian posterior probabilities. Figure S8. BI tree of bees based on cd12_fna with a GTR + CAT model in phylobayes. Nodes support values indicate Bayesian posterior probabilities. Figure S9. ML analysis of bees based on cds12_fna using partitioned model in IQTREE. Nodes support values indicate SH-aLRT/UFBoot2. Figure S10. ML analysis of bees based on cds12_rrna using partitioned model in IQTREE. Nodes support values indicate SH-aLRT/UFBoot2. Figure S11. BI tree of bees based on cds_rrna with a GTR + CAT model in phylobayes. Nodes support values indicate Bayesian posterior probabilities.

Funding

This work was supported by the National Natural Science Foundation of China (32300382), Shandong Provincial Natural Science Foundation (ZR2023QH353), Youth Innovation Team Development Project of Shandong Universities (2024KJC010), the Second Tibetan Plateau Scientific Expedition and Research program (2019QZKK05010605), and Shanghai Key Laboratory of Forensic Medicine and Key Laboratory of Forensic Science, Ministry of Justice (KF202524).

Institutional Review Board Statement

Not applicable.

Informed Consent Statement

Not applicable.

Data Availability Statement

The data are contained within the article or Supplementary Materials.

Acknowledgments

I sincerely thank Chao Dong Zhu, who helped to design this paper; I greatly thank Zeqing Niu, who helped to identify species, and also thank Qingtao Wu and Wen Jiang for collecting the samples.

Conflicts of Interest

The author declares no conflicts of interest.

References

  1. Ascher, J.S.; Pickering, J. Discover Life Bee Species Guide and World Checklist (Hymenoptera: Apoidea: Anthophila). Available online: http://www.discoverlife.org/mp/20q?guide=Apoidea_species (accessed on 20 August 2025).
  2. Klein, A.M.; Vaissière, B.E.; Cane, J.H.; Steffan-Dewenter, I.; Cunningham, S.A.; Kremen, C.; Tscharntke, T.J. Importance of pollinators in changing landscapes for world crops. Proc. R. Soc. B 2007, 274, 303–313. [Google Scholar] [CrossRef] [PubMed]
  3. Ollerton, J. Pollinator diversity: Distribution, ecological function, and conservation. Annu. Rev. Ecol. Syst. 2017, 48, 353–376. [Google Scholar] [CrossRef]
  4. Danforth, B.N.; Minckley, R.L.; Neff, J.L.; Fawcett, F. The Solitary Bees: Biology, Evolution, Conservation; Princeton University Press: Priceton, NJ, USA, 2019. [Google Scholar]
  5. Michener, C.D. The Bees of the World, 2nd ed.; The John Hopkins University Press: London, UK, 2007; 953p. [Google Scholar]
  6. Michener, C.D. Comparative external morphology, phylogeny, and a classification of the bees (Hymenoptera). Bull. Am. Mus. Nat. Hist. 1994, 82, 151–326. [Google Scholar]
  7. Danforth, B.N.; Almeida, E.A. Insights into bee evolution: A tribute to Charles D. Michener. Apidologie 2008, 39, 1–2. [Google Scholar] [CrossRef]
  8. Danforth, B.N.; Cardinal, S.; Praz, C.; Almeida, E.A.; Michez, D. The impact of molecular data on our understanding of bee phylogeny and evolution. Annu. Rev. Entomol. 2013, 58, 57–78. [Google Scholar] [CrossRef] [PubMed]
  9. Danforth, B.N.; Fang, J.; Sipes, S. Analysis of family-level relationships in bees (Hymenoptera: Apiformes) using 28S and two previously unexplored nuclear genes: CAD and RNA polymerase II. Mol. Phylogenet. Evol. 2006, 39, 358–372. [Google Scholar] [CrossRef]
  10. Michener, C.D. The Bees of the World, 1st ed.; The John Hopkins University Press: London, UK, 2000; 913p. [Google Scholar]
  11. Engel, M.S. A monograph of the Baltic amber bees and evolution of the Apoidea (Hymenoptera). Bull. Am. Mus. Nat. Hist. 2001, 2001, 1–192. [Google Scholar] [CrossRef]
  12. Alexander, B.A.; Michener, C.D. Phylogenetic studies of the families of short-tongued bees (Hymenoptera: Apoidea). Univ. Kans. Sci. Bull. 1995, 55, 377–424. [Google Scholar]
  13. Branstetter, M.G.; Longino, J.T.; Ward, P.S.; Faircloth, B.C. Enriching the ant tree of life: Enhanced UCE bait set for genome-scale phylogenetics of ants and other Hymenoptera. Methods Ecol. Evol. 2017, 8, 768–776. [Google Scholar] [CrossRef]
  14. Sann, M.; Meusemann, K.; Niehuis, O.; Escalona, H.E.; Mokrousov, M.; Ohl, M.; Pauli, T.; Schmid-Egger, C.J. Reanalysis of the apoid wasp phylogeny with additional taxa and sequence data confirms the placement of Ammoplanidae as sister to bees. Syst. Entomol. 2021, 46, 558–569. [Google Scholar] [CrossRef]
  15. Sann, M.; Niehuis, O.; Peters, R.S.; Mayer, C.; Kozlov, A.; Podsiadlowski, L.; Bank, S.; Meusemann, K.; Misof, B.; Bleidorn, C.; et al. Phylogenomic analysis of Apoidea sheds new light on the sister group of bees. BMC Evol. Biol. 2018, 18, 71. [Google Scholar] [CrossRef]
  16. Larkin, L.L.; Neff, J.L.; Simpson, B. Phylogeny of the Callandrena subgenus of Andrena (Hymenoptera: Andrenidae) based on mitochondrial and nuclear DNA data: Polyphyly and convergent evolution. Mol. Phylogenet. Evol. 2006, 38, 330–343. [Google Scholar] [CrossRef]
  17. Paxton, R.; Tengö, J. Intranidal mating, emergence, and sex ratio in a communal bee Andrena jacobi Perkins 1921 (Hymenoptera: Andrenidae). J. Insect Behav. 1996, 9, 421–440. [Google Scholar] [CrossRef]
  18. Paxton, R.; Giovanetti, M.; Andrietti, F.; Scamoni, E.; Scanni, B. Mating in a communal bee, Andrena agilissima (Hymenoptera Andrenidae). Ethol. Ecol. Evol. 1999, 11, 371–382. [Google Scholar] [CrossRef]
  19. Cameron, S.L. Insect mitochondrial genomics: Implications for evolution and phylogeny. Annu. Rev. Entomol. 2014, 59, 95–117. [Google Scholar] [CrossRef] [PubMed]
  20. Ge, X.; Peng, L.; Vogler, A.P.; Morse, J.C.; Yang, L.; Sun, C.; Wang, B. Massive gene rearrangements of mitochondrial genomes and implications for the phylogeny of Trichoptera (Insecta). Syst. Entomol. 2022, 48, 278–295. [Google Scholar] [CrossRef]
  21. Lin, X.L.; Liu, Z.; Yan, L.P.; Duan, X.; Bu, W.J.; Wang, X.H.; Zheng, C.G. Mitogenomes provide new insights of evolutionary history of Boreheptagyiini and Diamesini (Diptera: Chironomidae: Diamesinae). Ecol. Evol. 2022, 12, e8957. [Google Scholar] [CrossRef]
  22. Boore, J.L. Animal mitochondrial genomes. Nucleic Acids. Res. 1999, 27, 1767–1780. [Google Scholar] [CrossRef]
  23. Brown, W.N. The mitochondrial genome of animals. In Molecular Evolutionary Genetics; MacIntyre, R.J., Ed.; Plenum: New York, NY, USA, 1985; Volume 22, pp. 252–271. [Google Scholar]
  24. Zhang, D.; He, F.X.; Li, X.B.; Aishan, Z.; Lin, X.L. New mitogenomes of the Polypedilum generic complex (Diptera: Chironomidae): Characterization and phylogenetic implications. Insects 2023, 14, 238. [Google Scholar] [CrossRef]
  25. Cameron, S.L. Insect mitochondrial genomics: A decade of progress. Annu. Rev. Entomol. 2025, 70, 83–101. [Google Scholar] [CrossRef]
  26. Tadauchi, O.; Hirashima, Y. Synopsis of Andrena ceuandrena of Japan (Hymenoptera, andrenidae). Esakia 1984, 22, 107–113. [Google Scholar] [CrossRef] [PubMed]
  27. Xu, H.L.; Tadauchi, O.; Wu, Y.R. A revision of the subgenus Oreomelissa of the genus Andrena of eastern Asia (Hymenoptera, Andrenidae). Esakia 2000, 40, 41–61. [Google Scholar] [CrossRef] [PubMed]
  28. Bolger, A.M.; Lohse, M.; Usadel, B. Trimmomatic: A flexible trimmer for Illumina sequence data. Bioinformatics 2014, 30, 2114–2120. [Google Scholar] [CrossRef] [PubMed]
  29. Dierckxsens, N.; Mardulyn, P.; Smits, G.J. NOVOPlasty: De novo assembly of organelle genomes from whole genome data. Nucleic Acids Res. 2017, 45, e18. [Google Scholar] [CrossRef]
  30. Peng, Y.; Leung, H.C.; Yiu, S.M.; Chin, F.Y. IDBA–UD: A de novo assembler for single-cell and metagenomic sequencing data with highly uneven depth. Bioinformatics 2012, 28, 1420–1428. [Google Scholar] [CrossRef]
  31. Kearse, M.; Moir, R.; Wilson, A.; Stones-Havas, S.; Cheung, M.; Sturrock, S.; Buxton, S.; Cooper, A.; Markowitz, S.; Duran, C.; et al. Geneious Basic: An integrated and extendable desktop software platform for the organization and analysis of sequence data. Bioinformatics 2012, 28, 1647–1649. [Google Scholar] [CrossRef]
  32. Lowe, T.M.; Chan, P.P. tRNAscan-SE Online: Integrating search and context for analysis of transfer RNA genes. Nucleic Acids Res. 2016, 44, W54–W57. [Google Scholar] [CrossRef]
  33. Kumar, S.; Stecher, G.; Li, M.; Knyaz, C.; Tamura, K. MEGA X: Molecular evolutionary genetics analysis across computing platforms. Mol. Biol. Evol. 2018, 35, 1547–1549. [Google Scholar] [CrossRef]
  34. Shen, W.; Le, S.; Li, Y.; Hu, F. SeqKit: A cross-platform and ultrafast toolkit for FASTA/Q file manipulation. PLoS ONE 2016, 11, e0163962. [Google Scholar] [CrossRef]
  35. Rozas, J.; Ferrer-Mata, A.; Sánchez-DelBarrio, J.C.; Guirao-Rico, S.; Librado, P.; Ramos-Onsins, S.E.; Sánchez-Gracia, A. DnaSP 6: DNA sequence polymorphism analysis of large data sets. Mol. Biol. Evol. 2017, 34, 3299–3302. [Google Scholar] [CrossRef]
  36. Branstetter, M.G.; Danforth, B.N.; Pitts, J.P.; Faircloth, B.C.; Ward, P.S.; Buffington, M.L.; Gates, M.W.; Kula, R.R.; Brady, S.G. Phylogenomic insights into the evolution of stinging wasps and the origins of ants and bees. Curr. Biol. 2017, 27, 1019–1025. [Google Scholar] [CrossRef]
  37. Katoh, K.; Standley, D.M. MAFFT multiple sequence alignment software version 7: Improvements in performance and usability. Mol. Biol. Evol. 2013, 30, 772–780. [Google Scholar] [CrossRef]
  38. Capella-Gutiérrez, S.; Silla-Martínez, J.M.; Gabaldón, T.J.B. trimAl: A tool for automated alignment trimming in large-scale phylogenetic analyses. Bioinformatics 2009, 25, 1972–1973. [Google Scholar] [CrossRef]
  39. Kück, P.; Longo, G.C. FASconCAT-G: Extensive functions for multiple sequence alignment preparations concerning phylogenetic studies. Fron. Zool. 2014, 11, 81. [Google Scholar] [CrossRef] [PubMed]
  40. Kalyaanamoorthy, S.; Minh, B.Q.; Wong, T.K.; Von Haeseler, A.; Jermiin, L.S.J. ModelFinder: Fast model selection for accurate phylogenetic estimates. Nat. Methods 2017, 14, 587–589. [Google Scholar] [CrossRef] [PubMed]
  41. Minh, B.Q.; Schmidt, H.A.; Chernomor, O.; Schrempf, D.; Woodhams, M.D.; von Haeseler, A.; Lanfear, R. IQ-TREE 2: New models and efficient methods for phylogenetic inference in the genomic era. Mol. Biol. Evol. 2020, 37, 1530–1534. [Google Scholar] [CrossRef] [PubMed]
  42. Lartillot, N.; Rodrigue, N.; Stubbs, D.; Richer, J.J. PhyloBayes MPI: Phylogenetic reconstruction with infinite mixtures of profiles in a parallel environment. Syst. Biol. 2013, 62, 611–615. [Google Scholar] [CrossRef]
  43. Zhang, D.; Niu, Z. Comparative analyses reveal mitogenome characteristics of Halictidae and novel rearrangement (Hymenoptera: Apoidea: Anthophila). Animals 2025, 15, 2234. [Google Scholar] [CrossRef]
  44. He, B.; Su, T.; Wu, Y.; Xu, J.; Huang, D. Phylogenetic analysis of the mitochondrial genomes in bees (Hymenoptera: Apoidea: Anthophila). PLoS ONE 2018, 13, e0202187. [Google Scholar] [CrossRef]
  45. Zheng, B.Y.; Cao, L.J.; Tang, P.; Van Achterberg, K.; Hoffmann, A.A.; Chen, H.Y.; Chen, X.X.; Wei, S.J. Gene arrangement and sequence of mitochondrial genomes yield insights into the phylogeny and evolution of bees and sphecid wasps (Hymenoptera: Apoidea). Mol. Phylogenet. Evol. 2018, 124, 1–9. [Google Scholar] [CrossRef]
  46. Tang, P.; Zhu, J.; Zheng, B.; Wei, S.J.; Sharkey, M.; Chen, X.X.; Vogler, A.P. Mitochondrial phylogenomics of the Hymenoptera. Mol. Phylogenet. Evol. 2019, 131, 8–18. [Google Scholar] [CrossRef]
  47. Wei, S.J.; Li, Q.; van Achterberg, K.; Chen, X.X. Two mitochondrial genomes from the families Bethylidae and Mutillidae: Independent rearrangement of protein-coding genes and higher-level phylogeny of the Hymenoptera. Mol. Phylogenet. Evol. 2014, 77, 1–10. [Google Scholar] [CrossRef]
  48. Dowton, M.; Castro, L.R.; Campbell, S.L.; Bargon, S.D.; Austin, A.D. Frequent mitochondrial gene rearrangements at the hymenopteran nad3-nad5 junction. J. Mol. Evol. 2003, 56, 517–526. [Google Scholar] [CrossRef] [PubMed]
  49. Wei, S.J.; Shi, M.; Sharkey, M.J.; van Achterberg, C.; Chen, X.X. Comparative mitogenomics of Braconidae (Insecta: Hymenoptera) and the phylogenetic utility of mitochondrial genomes with special reference to Holometabolous insects. BMC Genom. 2010, 11, 371. [Google Scholar] [CrossRef] [PubMed]
  50. Bratic, A.; Clemente, P.; Calvo-Garrido, J.; Maffezzini, C.; Felser, A.; Wibom, R.; Wedell, A.; Freyer, C.; Wredenberg, A.J. Mitochondrial polyadenylation is a one-step process required for mRNA integrity and tRNA maturation. PLoS Genet. 2016, 12, e1006028. [Google Scholar] [CrossRef] [PubMed]
  51. Ji, H.; Xu, X.; Jin, X.; Yin, H.; Luo, J.; Liu, G.; Zhao, Q.; Chen, Z.; Bu, W.; Gao, S.J. Using high-resolution annotation of insect mitochondrial DNA to decipher tandem repeats in the control region. RNA Biol. 2019, 16, 830–837. [Google Scholar] [CrossRef]
  52. Toompuu, M.; Tuomela, T.; Laine, P.; Paulin, L.; Dufour, E.; Jacobs, H.T. Polyadenylation and degradation of structurally abnormal mitochondrial tRNAs in human cells. Nucleic Acids. Res. 2018, 46, 5209–5226. [Google Scholar] [CrossRef]
  53. Hurst, L.D. The Ka/Ks ratio: Diagnosing the form of sequence evolution. Trends Genet. 2002, 18, 486. [Google Scholar] [CrossRef]
  54. Yang, Z.; Bielawski, J.P. Statistical methods for detecting molecular adaptation. Trends Ecol. Evol. 2000, 15, 496–503. [Google Scholar] [CrossRef]
  55. Luo, L.; Carpenter, J.M.; Chen, B.; Li, T. First comprehensive analysis of both mitochondrial characteristics and mitogenome-based phylogenetics in the subfamily Eumeninae (Hymenoptera: Vespidae). Insects 2022, 13, 529. [Google Scholar] [CrossRef]
  56. Song, S.N.; Tang, P.; Wei, S.J.; Chen, X.X. Comparative and phylogenetic analysis of the mitochondrial genomes in basal hymenopterans. Sci. Rep. 2016, 6, 20972. [Google Scholar] [CrossRef] [PubMed]
  57. Li, H.; Liu, H.; Shi, A.; Stys, P.; Zhou, X.; Cai, W. The complete mitochondrial genome and novel gene arrangement of the unique-headed bug Stenopirates sp. (Hemiptera: Enicocephalidae). PLoS ONE 2012, 7, e29419. [Google Scholar] [CrossRef] [PubMed]
  58. Li, X.; Shi, L.; Zhou, Y.; Xie, H.; Dai, X.; Li, R.; Chen, Y.; Wang, H. Molecular evolutionary mechanisms driving functional diversification of α-glucosidase in Lepidoptera. Sci. Rep. 2017, 7, 45787. [Google Scholar] [CrossRef] [PubMed]
  59. Tyagi, K.; Chakraborty, R.; Cameron, S.L.; Sweet, A.D.; Chandra, K.; Kumar, V. Rearrangement and evolution of mitochondrial genomes in Thysanoptera (Insecta). Sci. Rep. 2020, 10, 695. [Google Scholar] [CrossRef]
  60. Dowton, M.; Austin, A.D. Evolutionary dynamics of a mitochondrial rearrangement “hot spot” in the Hymenoptera. Mol. Biol. Evol. 1999, 16, 298–309. [Google Scholar] [CrossRef]
  61. Moritz, C.; Dowling, T.E.; Brown, W.M. Evolution of animal mitochondrial DNA: Relevance for population biology and systematics. Annu. Rev. Ecol. Evol. Syst. 1987, 18, 269–292. [Google Scholar] [CrossRef]
  62. Lavrov, D.V.; Jeffrey, L.B.; Wesley, M.B. Complete mtDNA sequences of two millipedes suggest a new model for mitochondrial gene rearrangements: Duplication and nonrandom loss. Mol. Biol. Evol. 2002, 19, 163–169. [Google Scholar] [CrossRef]
  63. Dowton, M.; Campbell, N.J.H. Intramitochondrial recombination—Is it why some mitochondrial genes sleep around? Trends Ecol. Evol. 2001, 16, 269–271. [Google Scholar] [CrossRef]
  64. Rawlings, T.A.; Collins, T.M.; Bieler, R. Changing identities: tRNA duplication and remolding within animal mitochondrial genomes. Proc. Natl. Acad. Sci. USA 2003, 100, 15700–15705. [Google Scholar] [CrossRef]
  65. Clary, D.O.; Wolstenholme, D.R. The mitochondrial DNA molecule of Drosophila yakuba: Nucleotide sequence, gene organization, and genetic code. J. Mol. Evol. 1985, 22, 252–271. [Google Scholar] [CrossRef]
  66. Brady, S.G.; Litman, J.R.; Danforth, B.N. Rooting phylogenies using gene duplications: An empirical example from the bees (Apoidea). Mol. Phylogenet. Evol. 2011, 60, 295–304. [Google Scholar] [CrossRef]
  67. Kahnt, B.; Gerth, M.; Paxton, R.J.; Bleidorn, C.; Husemann, M. The complete mitochondrial genome of the endemic and highly specialized South African bee species Rediviva intermixta (Hymenoptera: Melittidae), with a comparison with other bee mitogenomes. Biol. J. Linn. Soc. 2015, 116, 940–953. [Google Scholar] [CrossRef]
  68. Pratlong, M.; Rancurel, C.; Pontarotti, P.; Aurelle, D.J. Monophyly of Anthozoa (Cnidaria): Why do nuclear and mitochondrial phylogenies disagree? Zool. Scr. 2017, 46, 363–371. [Google Scholar] [CrossRef]
  69. Fenn, J.D.; Song, H.; Cameron, S.L.; Whiting, M.F. A preliminary mitochondrial genome phylogeny of Orthoptera (Insecta) and approaches to maximizing phylogenetic signal found within mitochondrial genome data. Mol. Phylogenet. Evol. 2008, 49, 59–68. [Google Scholar] [CrossRef] [PubMed]
  70. Timmermans, M.J.; Barton, C.; Haran, J.; Ahrens, D.; Culverwell, C.L.; Ollikainen, A.; Dodsworth, S.; Foster, P.G.; Bocak, L.; Vogler, A.P. Family-level sampling of mitochondrial genomes in Coleoptera: Compositional heterogeneity and phylogenetics. Genome Biol. Evol. 2016, 8, 161–175. [Google Scholar] [CrossRef] [PubMed]
  71. Song, F.; Li, H.; Jiang, P.; Zhou, X.; Liu, J.; Sun, C.; Vogler, A.P.; Cai, W.J. Capturing the phylogeny of Holometabola with mitochondrial genome data and Bayesian site-heterogeneous mixture models. Genome Biol. Evol. 2016, 8, 1411–1426. [Google Scholar] [CrossRef] [PubMed]
  72. Morgan, C.C.; Foster, P.G.; Webb, A.E.; Pisani, D.; McInerney, J.O.; O’Connell, M.J. Heterogeneous models place the root of the placental mammal phylogeny. Mol. Biol. Evol. 2013, 30, 2145–2156. [Google Scholar] [CrossRef]
  73. Sheffield, N.C.; Song, H.; Cameron, S.L.; Whiting, M.F. Nonstationary evolution and compositional heterogeneity in beetle mitochondrial phylogenomics. Syst. Biol. 2009, 58, 381–394. [Google Scholar] [CrossRef]
  74. Liu, Y.; Song, F.; Jiang, P.; Wilson, J.J.; Cai, W.; Li, H. Compositional heterogeneity in true bug mitochondrial phylogenomics. Mol. Phylogenet. Evol. 2018, 118, 135–144. [Google Scholar] [CrossRef]
  75. Jiang, J.; Wu, T.; Deng, J.; Peng, L. A compositional heterogeneity analysis of mitochondrial phylogenomics in chalcidoidea involving two newly sequenced mitogenomes of eupelminae (Hymenoptera: Chalcidoidea). Genes 2022, 13, 2340. [Google Scholar] [CrossRef]
  76. Zhang, D.; Niu, Z.Q.; Luo, A.R.; Orr, M.C.; Ferrari, R.R.; Jin, J.F.; Wu, Q.T.; Zhang, F.; Zhu, C.D. Testing the systematic status of Homalictus and Rostrohalictus with weakened cross-vein groups within Halictini (Hymenoptera: Halictidae) using low-coverage whole-genome sequencing. Insects Sci. 2022, 29, 1819–1833. [Google Scholar] [CrossRef]
  77. Sun, X.; Ding, Y.; Orr, M.C.; Zhang, F. Streamlining universal single-copy orthologue and ultraconserved element design: A case study in Collembola. Mol. Ecol. Resour. 2020, 20, 706–717. [Google Scholar] [CrossRef]
  78. Ge, X.; Peng, L.; Morse, J.C.; Wang, J.; Zang, H.; Yang, L.; Sun, C.; Wang, B. Phylogenomics resolves a 100-year-old debate regarding the evolutionary history of caddisflies (Insecta: Trichoptera). Mol. Phylogenet. Evol. 2024, 201, 108196. [Google Scholar] [CrossRef]
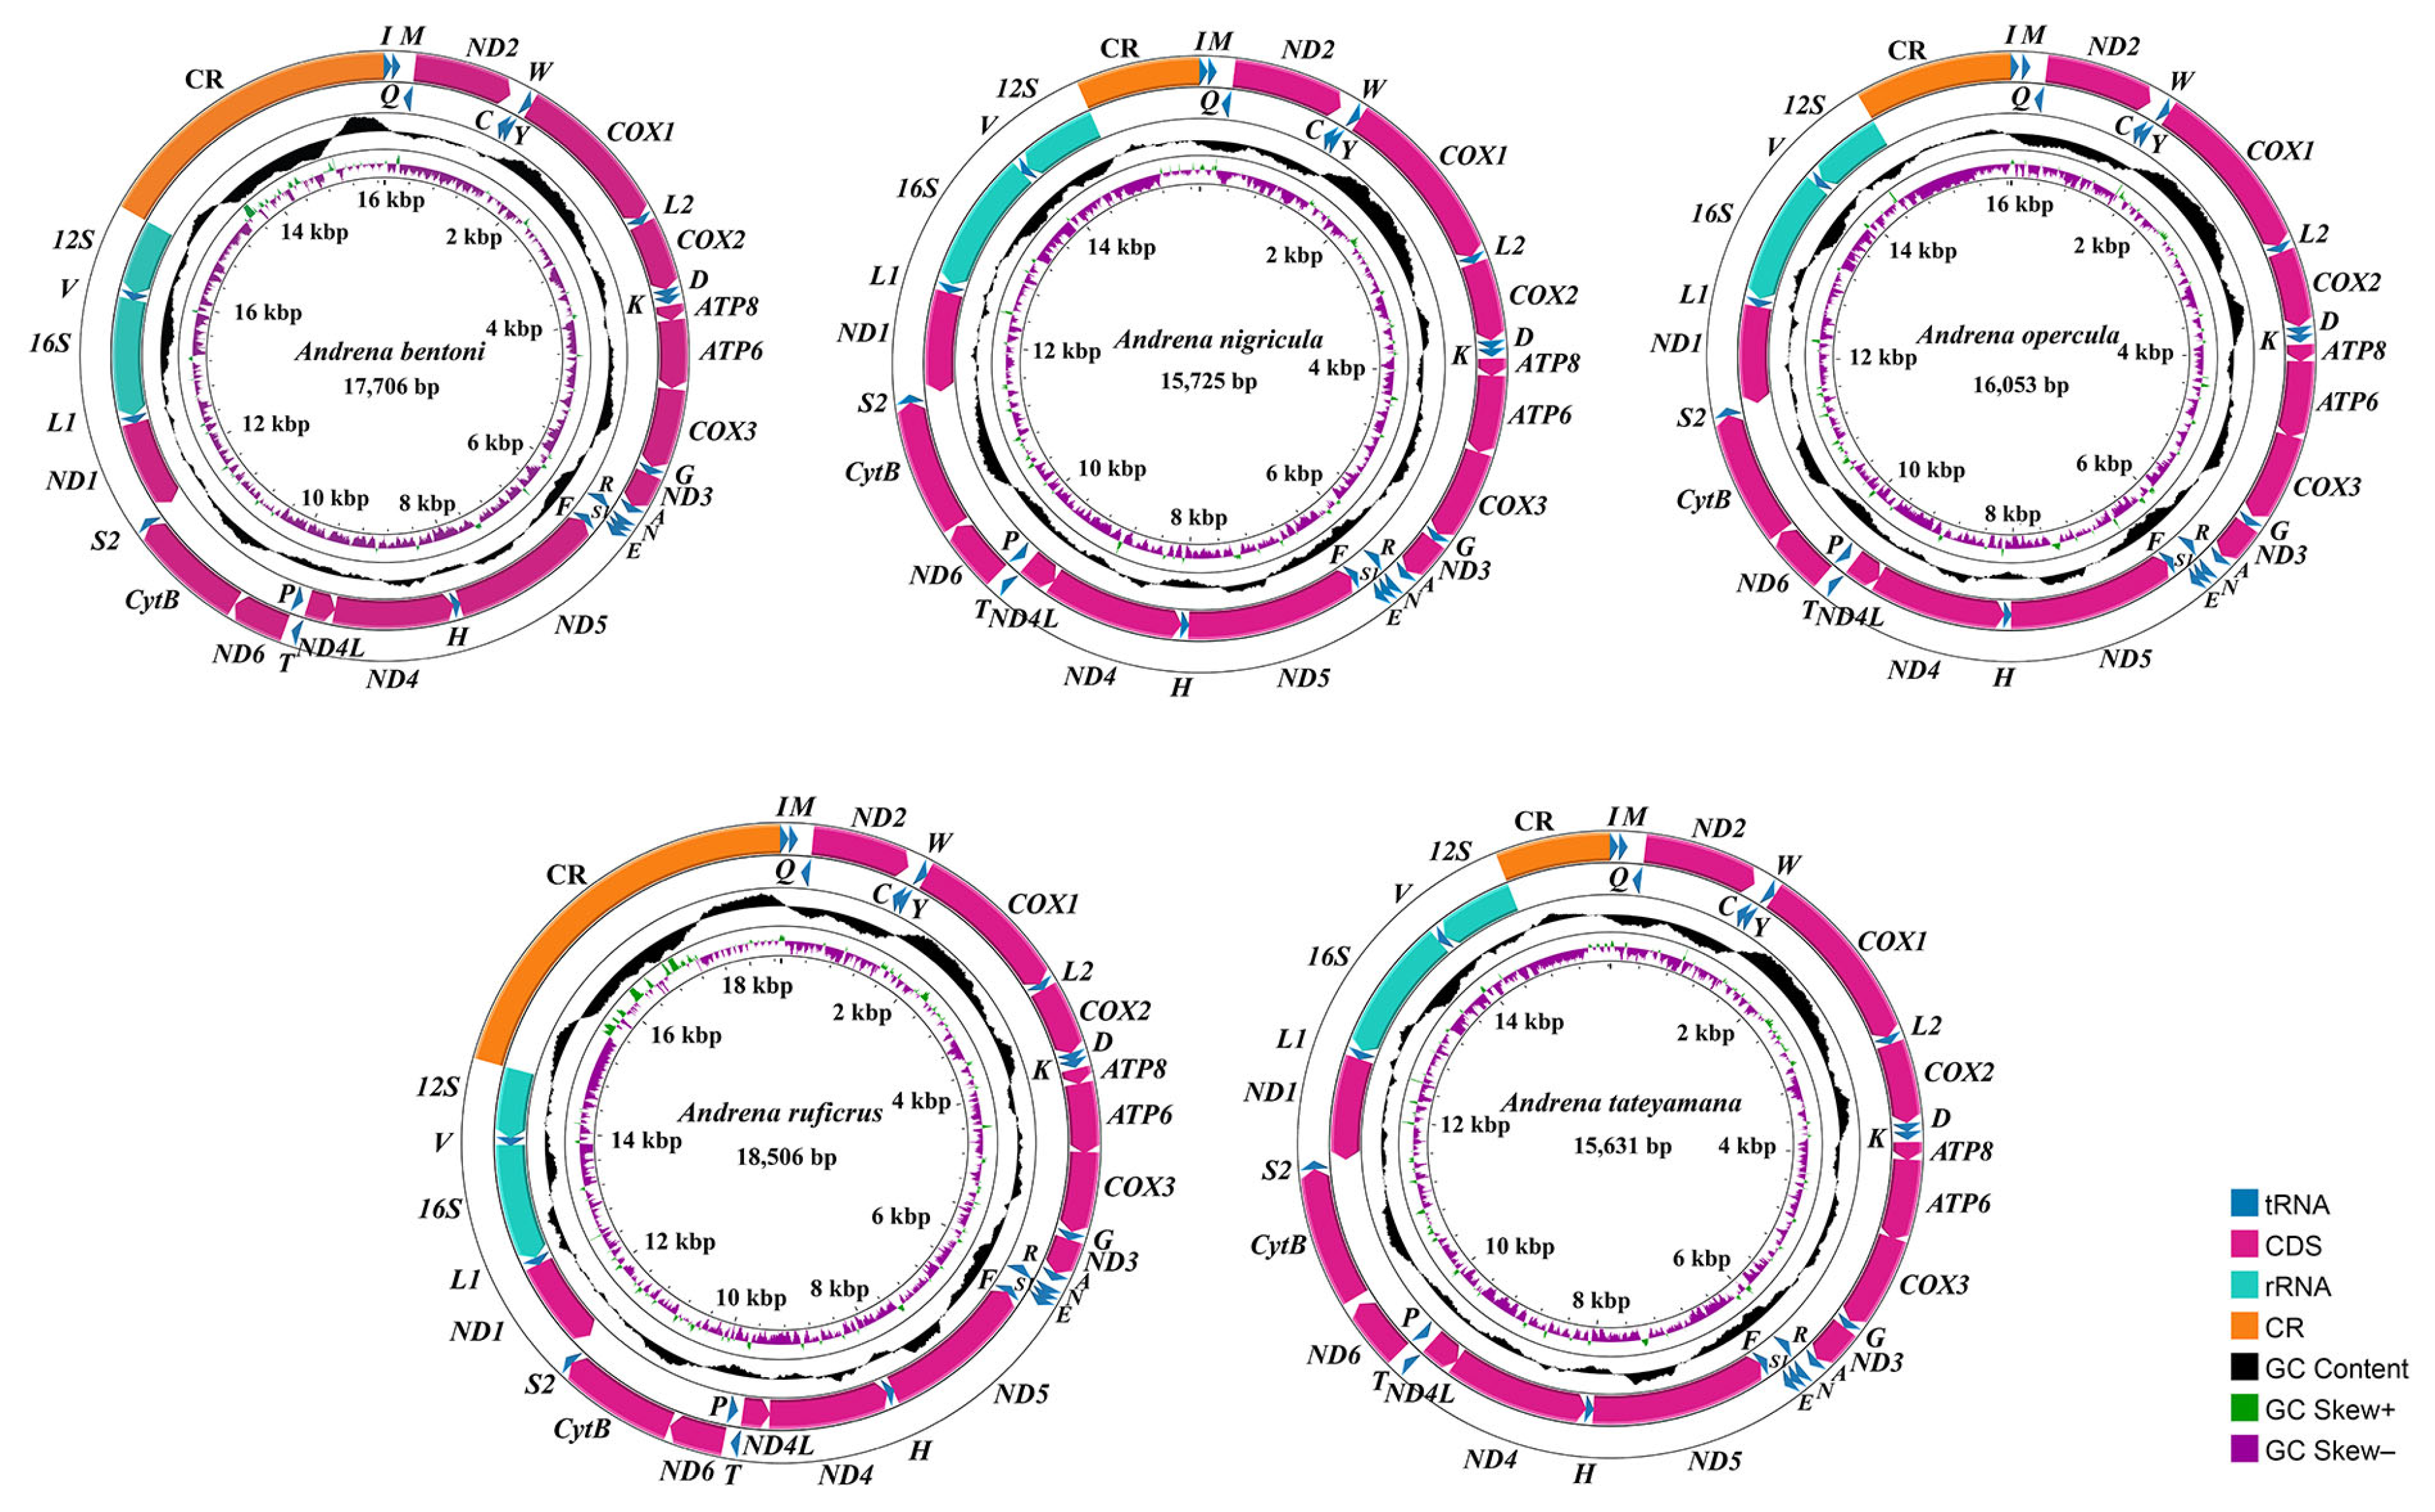
Figure 1. Mitogenome maps of the newly sequenced species. Arrows indicate transcription direction. Standard abbreviations denote PCGs (amaranth) and rRNAs (blue-green), and single-letters abbreviations represent tRNAs (dark blue). The thirds circle shows GC content (dark), the fourth displays GC skew (green and purple), and the innermost circle represents genome length.
Biology 14 01374 g001
Figure 2. RSCU of PCGS in newly sequenced species. The X-axis represents amino acids, and the Y-axis indicates RSCU values.
Biology 14 01374 g002
Figure 3. Evolutionary rates of the 13 PCGs in five newly sequenced mitogenomes. X-axis shows PCGS, and the Y-axis shows the evolutionary ratio.
Biology 14 01374 g003
Figure 4. Gene order of newly sequenced mitogenomes. PCGs, rRNAs, tRNAs, and the control region are marked with yellow, pink, grey and orange.
Biology 14 01374 g004
Figure 5. Phylogenetic relationship of bee families from different matrices. (A), topology 1; (B), topology2; (C), topology 3; (D), topology 4. LT-bees and ST-bees were marked with blue, and pink, respectively.
Biology 14 01374 g005
Figure 6. Phylogenetic relationship of bees based on the analysis of cds_fna with the partition model in IQTREE. Support values on nodes indicate SH-aLRT/UFBoot2.
Biology 14 01374 g006
Table 1. Sampling information for the species newly sequenced in this study.
Species LocationLongitude and
Latitude
Elevation (m)DateCollectorAccession
Number
Andrena bentoniXizang, YadongE88.9330, N27.519836602023.7.9Qingtao WuPX147440
Andrena nigriculaXizang, JilongE85.2393, N28.580840822023.7.15Qingtao WuPX147441
Andrena operculaXizang, JilongE85.3086, N28.398728582023.7.17Qingtao WuPX147442
Andrena ruficrusXizang, JilongE85.4555, N28.388132652023.7.22Qingtao WuPX147443
Andrena tateyamanaXizang, BomiE94.8044, N30.251022622023.6.26Qingtao WuPX147444
Table 2. Base composition of newly sequenced species.
SamplesRegionsLength
(bp)
A (%)T (%)C (%)G (%)A + T (%)G + C (%)AT-SkewGC-Skew
Andrena bentoniWhole genome17,70642.49 32.11 17.19 8.14 74.60 25.32 0.139 −0.357
PCGs11,07434.92 38.38 15.61 11.07 73.30 26.68 −0.047 −0.170
Site 1369240.52 31.29 13.89 14.30 71.81 28.19 0.128 0.014
Site 2369123.09 49.75 16.36 10.80 72.84 27.16 −0.366 −0.205
Site 12738331.80 40.52 15.13 12.55 72.33 27.67 −0.121 −0.093
Site 3369141.15 34.10 16.57 8.10 75.25 24.68 0.094 −0.343
tRNA142942.20 39.19 7.56 11.06 81.39 18.61 0.037 0.188
l-rRNA127835.99 43.74 6.49 13.77 79.73 20.27 −0.097 0.359
s-rRNA76535.42 41.70 6.14 16.73 77.12 22.88 −0.081 0.463
CR297540.40 35.93 13.78 9.55 76.33 23.33 0.059 −0.181
Andrena nigriculaWhole genome15,72542.52 34.10 15.80 7.55 76.62 23.35 0.110 −0.353
PCGs11,05136.34 40.00 13.43 10.23 76.34 23.66 −0.048 −0.135
Site 1368543.63 32.06 11.62 12.69 75.69 24.31 0.153 0.044
Site 2368423.09 50.26 15.90 10.76 73.34 26.66 −0.370 −0.193
Site 12736933.36 41.16 13.76 11.72 74.52 25.48 −0.105 −0.080
Site 3368242.30 37.69 12.76 7.25 79.99 20.01 0.058 −0.275
tRNA142440.66 40.66 8.01 10.67 81.32 18.68 0.000 0.142
l-rRNA128036.72 42.97 5.94 14.37 79.69 20.31 −0.078 0.415
s-rRNA77639.56 41.88 5.15 13.40 81.44 18.56 −0.028 0.445
CR103242.73 32.75 18.31 5.72 75.48 24.03 0.132 −0.524
Andrena operculaWhole genome16,05345.21 34.57 13.68 6.47 79.78 20.15 0.133 −0.358
PCGs11,07137.68 42.02 11.04 9.26 79.69 20.31 −0.054 −0.088
Site 1369143.53 34.17 9.72 12.59 77.69 22.31 0.120 0.129
Site 2369023.43 50.34 15.14 11.09 73.77 26.23 −0.365 −0.155
Site 12738133.48 42.25 12.43 11.84 75.73 24.27 −0.116 −0.024
Site 3369046.07 41.54 8.27 4.11 87.61 12.39 0.052 −0.336
tRNA141943.55 40.38 6.77 9.30 83.93 16.07 0.038 0.157
l-rRNA126836.51 45.58 5.52 12.38 82.10 17.90 −0.110 0.383
s-rRNA74637.40 43.83 5.63 13.14 81.23 18.77 −0.079 0.400
CR135749.01 29.26 18.13 2.73 78.27 20.86 0.252 −0.738
Andrena ruficrusWhole genome18,50643.82 36.02 12.98 7.14 79.84 20.13 0.098 −0.290
PCGs11,08037.60 42.08 10.96 9.36 79.68 20.32 −0.056 −0.079
Site 1369442.88 33.18 10.76 13.18 76.06 23.94 0.128 0.101
Site 2369323.35 50.67 15.07 10.91 74.02 25.98 −0.369 −0.160
Site 12738733.12 41.92 12.92 12.04 75.04 24.96 −0.117 −0.035
Site 3369346.56 42.40 7.04 4.00 88.96 11.04 0.047 −0.276
tRNA142343.08 40.34 6.89 9.70 83.42 16.58 0.033 0.169
l-rRNA126735.44 45.15 6.08 13.34 80.58 19.42 −0.120 0.374
s-rRNA74436.83 43.55 6.05 13.58 80.38 19.62 −0.084 0.384
CR383442.72 33.72 16.33 5.55 76.44 21.88 0.118 −0.493
Andrena tateyamanaWhole genome15,63144.17 35.68 13.27 6.83 79.85 20.11 0.106 −0.320
PCGs11,05937.47 42.23 11.05 9.25 79.70 20.30 −0.060 −0.089
Site 1368742.27 34.03 10.95 12.74 76.30 23.70 0.108 0.075
Site 2368623.08 50.65 15.07 11.20 73.74 26.26 −0.374 −0.147
Site 12737332.68 42.34 13.01 11.97 75.02 24.98 −0.129 −0.042
Site 3368647.04 42.02 7.13 3.81 89.06 10.94 0.056 −0.303
tRNA143143.26 39.97 7.27 9.50 83.23 16.77 0.040 0.133
l-rRNA126937.27 44.92 5.67 12.14 82.19 17.81 −0.093 0.363
s-rRNA74337.28 44.41 4.98 13.32 81.70 18.30 −0.087 0.456
CR93743.65 37.79 11.95 7.38 81.44 19.33 0.072 −0.236
Disclaimer/Publisher’s Note: The statements, opinions and data contained in all publications are solely those of the individual author(s) and contributor(s) and not of MDPI and/or the editor(s). MDPI and/or the editor(s) disclaim responsibility for any injury to people or property resulting from any ideas, methods, instructions or products referred to in the content.