Article

Rulers of the Open Sky at Risk: Climate-Driven Habitat Shifts of Three Conservation-Priority Raptors in the Eastern Himalayas

by
Pranjal Mahananda
1,
Imon Abedin
2,
Anubhav Bhuyan
3,
Malabika Kakati Saikia
1,*,
Prasanta Kumar Saikia
1,
Hilloljyoti Singha
2,4 and
Shantanu Kundu
5,*
1
Animal Ecology and Wildlife Biology Lab, Department of Zoology, Gauhati University, Jalukbari 781014, India
2
Wildlife Ecology Lab, Department of Zoology, Bodoland University, Kokrajhar 783370, India
3
Department of Environmental Science, Tezpur University, Napaam 784028, India
4
Centre for Wildlife Research and Biodiversity Conservation, Bodoland University, Kokrajhar 783370, India
5
Ocean and Fisheries Development International Cooperation Institute, College of Fisheries Science, Pukyong National University, Busan 48513, Republic of Korea
*
Authors to whom correspondence should be addressed.
Biology 2025, 14(10), 1376; https://doi.org/10.3390/biology14101376 (registering DOI)
Submission received: 10 August 2025 / Revised: 2 October 2025 / Accepted: 3 October 2025 / Published: 8 October 2025

Abstract

Simple Summary

Raptors, as apex predators, serve as valuable bioindicators for assessing the impacts of climate change because of their specialized ecological traits, which render them particularly susceptible to environmental alterations. Globally, raptors are experiencing significant conservation concerns, with approximately 52% of species exhibiting declining populations and 18% being classified as threatened. Despite this, the effect of climate change on raptors is poorly studied in the Eastern Himalayan region. Three species, Falco severus, Gyps tenuirostris and Haliaeetus leucoryphus, were selected based on their conservation status in the region. This study provides a comprehensive assessment of climate change impacts on raptors in the northeastern part of the Eastern Himalayas, utilizing ensemble species distribution modeling for the projected periods 2041–2060 and 2061–2080. The future projections indicate a substantial decline in suitable habitats: Falco severus is projected to lose 33–41%, Gyps tenuirostris may lose 53–96%, and Haliaeetus leucoryphus is anticipated to experience a loss of approximately 94–99% of its suitable habitats.

Abstract

Raptors, being at top of the food chain, serve as important models to study the impact of changing climate, as they are more vulnerable due to their unique ecology. They are vulnerable to extinction, with 52% species declining population and 18% are threatened globally. The effect of climate change on raptors is poorly studied in the Eastern Himalayan region. The present study offers a complete investigation of climate change effects on the raptors in the northeast region of the Eastern Himalayas, employing ensemble species distribution modeling. The future predictions were employed to model the climate change across two socioeconomic pathways (SSP) i.e. SSP245 and SSP585 for the periods 2041–2060 and 2061–2080. Specifically, five algorithms were employed for the ensemble model, viz. boosted regression tree (BRT), generalized linear model (GLM), multivariate adaptive regression splines (MARS), maximum entropy (MaxEnt) and random forest (RF). The study highlights worrying results, as only 10.5% area of the NE region is presently suitable for Falco severus, 11.4% for the critically endangered Gyps tenuirostris, and a mere 6.9% area is presently suitable for the endangered Haliaeetus leucoryphus. The most influential covariates were precipitation of the driest quarter, precipitation of the wettest month, and temperature seasonality. Future projection revealed reduction of 33–41% in suitable habitats for F. severus, G. tenuirostris is expected to lose 53–96% of its suitable habitats, and H. leucoryphus has lost nearly 94–99% of its suitable habitats. Such decline indicates apparent habitat fragmentation, with shrinking habitat patches.

1. Introduction

In recent years, global ecological stability has faced considerable disorder due to the accelerating impacts of climate change and anthropogenic-induced stress [1]. This accelerated pace of climate change and its adverse impacts on species and their populations have emerged as a global conservation concern [2]. It alters the ecosystem structure and functioning of the habitats used by the faunal species [3]. Furthermore, human-induced land use changes have also led to a significant decline in overall species diversity and habitat quality, particularly within avian communities [4]. Therefore, understanding species habitats and the impacts of climate change has become imperative for the conservation of vulnerable and threatened taxa worldwide.
Raptors are important models for examining the effects of climatic change and habitat loss, as they occur worldwide, perform vital ecological roles and serve as surrogate species for preservation of biodiversity [5,6,7]. They face a higher risk of extinction compared to other avian groups due to their unique ecology and life history traits [8]. They are long-lived apex predators with large home ranges and feed on a diverse array of prey items from insects to mammals, and so are influenced by climate change effects on the lower trophic levels [9,10]. Hence, the raptors may amplify climate change effects by affecting the ecosystem disproportionately [11]. Also, raptors are vulnerable to extinction, with 52% species existing in declining population trend and 18% being threatened globally; additionally, the populations of 38% of Least Concern species are declining [8]. Apart from various threats, raptors are also highly threatened by habitat alteration [12,13] and changing climate [14,15].
The geographic range of a raptor is primarily governed by the intersection of thermal niche, preferred preys and suitable nesting ground [2]. The range shift trend of raptors is predominantly towards higher elevation, but the magnitude and direction of the range shift can vary between species owing to their life story, food habits and their breeding and wintering grounds [2,16,17]. These shifts might have a negative effect on the ecological structure, resulting in conservation consequences [2]. As raptors shift their ranges, new assemblages of species may emerge, leading to competition for resources, and changing prey–predator dynamics [18]. The changes in climatic conditions have also resulted in range shifts in diseases and pathogens, thus disrupting the local disease ecology [19,20]. The change in disease ecology due to climate change will further result in increased mortality of raptors and rapid population decline [2]. Climate change is shifting the distribution of diseases, parasites, and ectoparasites northward, disrupting host–pathogen dynamics and exposing young raptor populations to novel infections with potentially severe impacts on their survival [21].
Moreover, climatic shifts have affected the annual breeding cycles and phenology of raptors, with them now exhibiting early phenology [22,23]. There is a shift in breeding phenology due to climate change, particularly at higher altitudes, though responses may differ by species, diets and locations [24]. These responses may vary from larger clutches and improved survival to reduced success. Climate change profoundly influences raptor migratory patterns [25,26]. Raptors are altering migration schedules, delaying autumn departures while advancing spring arrivals [27,28]. Additionally, many species show migratory short-stopping wintering nearer their breeding ranges under changing environmental conditions. Change in climate also affects the thermal dynamics of soaring raptors [29,30], with resultant extreme weather events proving detrimental to endangered and restricted-range species, often causing significant population declines [31,32]. About 25% population of raptors significantly declined after severe hurricane [33,34].
According to research and conservation priority index [35], Falco severus (Horsfield, 1821), Gyps tenuirostris (Gray, 1844) and Haliaeetus leucoryphus (Pallas, 1771) are the three priority raptors for conservation that breed in northeastern India. However, currently, there are no comprehensive breeding and nesting data for these species in the region. The species Falco severus (Oriental hobby) has an IUCN range extending from India to Bhutan and Nepal, through Myanmar, China, Thailand, Laos, Vietnam, Cambodia, Philippines, Indonesia, and continuing eastwards to Papua New Guinea and Solomon Islands [36]. It was earlier considered to breed but recorded now as wintering in the Western Ghats, and there is no occurrence record in the 20th and 21st centuries [37]. The IUCN range of Gyps tenuirostris (Slender-billed vulture) extends from India through north of the Gangetic plain, west to Himachal Pradesh and Haryana, to southern West Bengal, eastwards through the Assam plains, to southern Nepal and Bangladesh [38]. As per IUCN, Haliaeetus leucoryphus (Pallas’s fish-eagle) ranges from India (with breeding grounds in Assam and Uttarakhand). Outside India, it is known to breed in Bangladesh, Nepal and Bhutan. The non-breeding range extends from Northern Himalayas towards Kazakhstan, Russia and Mongolia [39]. All three raptor species have overlapping breeding ranges in the northeast, and belong to different trophic niches [40,41]. The F. severus typically nests in trees and occurs in forests with clearings, foothill forests, and occasionally plantations [41]. In contrast, G. tenuirostris is primarily associated with open-country habitats, foothills, and areas near human settlements, where it builds nests on tall trees. The major threats to this species include exposure to the NSAID diclofenac, deliberate poisoning, habitat loss, and food scarcity [41]. The H. leucoryphus generally inhabits riverine systems and flooded wetlands, utilizing large nearby trees for nesting. The major threats to this species identified are habitat degradation, water pollution, and overfishing [41].
The Himalayas are the best place to study climate change impacts, as the region has varied climatic zones and habitat, with diverse flora and fauna adversely affected by climate change [42]. The northeast region of the Eastern Himalayas is home to about 54 species of diurnal raptors, which accounts for about 77% of the total raptors found in the Indian subcontinent [43]. Out of these, as per IUCN, three species are Critically Endangered, two are Endangered, and 4 species are Near Threatened. There has been no status assessment of raptors in the region. According to Mahananda et al. [35], this region has only 4% of the studies conducted in India. Many raptor species in this region with Least Concern status (IUCN) have declining population trends [44]. This region also falls within the Circum Himalayan Corridor of the Central Asian Flyways, which is used by many migrating raptors [45,46]. The terai grasslands and forests of the Eastern Himalayas represents areas of highest species vulnerability, and the region is facing extensive habitat alterations [47]. Although ornithological studies have flourished in the region in recent times, raptors remain poorly studied [35]. Also, the region has suffered significant loss of bird habitats, with 60% of all tree cover loss between 2001 and 2023 (www.globalforestwatch.org, accessed on 5 June 2025) and conversion to monoculture plantations. Hence, to study the impact of climate and species range shifts, species distribution models (SDMs) are commonly used globally [48]. SDMs recognize the environmental envelope of species presence and forecast changes in their ranges on the basis of future climatic conditions, serving as common conservation prioritizing tool [49,50]. Recent studies have highlighted alarming trends in raptor population decline due to habitat loss [2,51,52]. Furthermore, changes in climatic conditions have forced the raptors to shift to suitable habitats or face extinction [2,53]. Taking this into account, the present study aims to (i) assess the impact of climate change on the three selected raptor species (F. severus, G. tenuirostris and H. leucoryphus) with the use of species distribution model (sdm) under current and future climate scenarios, (ii) and to evaluate the extent of habitat loss of the raptors in NE India.

2. Materials and Methods

2.1. Study Area

The Northeast region of India forms a major portion of the Himalaya and Indo-Burma biodiversity hotspots [54] (Figure 1). The region has three broadly distinguished areas: the Eastern Himalayas in the north [55,56], and NE hills to the south, separated by the Brahmaputra River basin in between [55,57]. The region exhibits a unique biogeography due to multiple reasons such as its location at the junction of biogeographic realms [55], paleoclimatic history, geology, etc. It is characterized by diverse habitats from tropical and montane forest to snow-capped mountains, including elevation range from 100 msl to 7000 msl.
The selected study area, i.e., northeast region of the Eastern Himalayas, encompasses the IUCN distribution extent of the three raptors breeding in the region. This method of delineating the suitable extent of the species enables us to predict the suitable habitats accommodating all three species. The field surveys (permission No. WL/FG.31/Pt/Technical Committee/2018dt. 24 January 2019) were conducted in the northeastern India in Assam during the period 2018–2022; the occurrence coordinates were obtained with handheld Garmin GPS (Garmin, Gurgaon, India) and photographs were captured with Nikon Coolpix P510 (Nikon, Gurgaon, India) and Nikon P600 camera (Nikon, Gurgaon, Haryana). Furthermore, secondary occurrence records were also incorporated to expand the overall distribution range for all species. These records were obtained from the IUCN Geospatial Conservation Assessment Tool (GeoCAT), which compiles data from multiple reputable repositories and is widely recognized as a reliable source [58]. The dataset contains diverse record types, including direct field observations, captive individuals, and historical museum specimens. Since not all of these accurately reflect the present habitat or environmental envelope of the species, records associated with museum specimens and captive individuals were excluded. Therefore, only direct human observations were retained to enhance the reliability of model predictions. To develop the ensemble models, occurrences from both field surveys and secondary sources were utilized. From field surveys, five occurrence points were used for Falco severus and six for H. leucoryphus. From secondary data sources, a total of 145 occurrence points for Falco severus [59], 104 points for G. tenuirostris [60], and 108 points for H. leucoryphus [61] were used to develop the ensemble models, selecting spatially independent occurrence points using the SDM Toolbox v2.4 [62]. A resolution of 1 km2 was used to conduct the spatial correlation between occurrences, equal to pixel size in the raster data, thus avoiding over-fitting of the model [63].

2.2. Covariates for Suitable Habitat Evaluation

The 19 bioclimatic variables were obtained from the WorldClim database to represent the diverse climatic envelopes associated with the species (Table S1) [64]. Further, the topographic data such as aspect, slope and elevation, were attained from the Diva-Gis database at 90 m resolution [65]. All selected variables were resampled to a spatial resolution of 30 arcseconds (~1 km2) using ArcGIS 10.6. The spatial multicollinearity among the variables was assessed in VisTrails software using the SAHM package v2.2.3 [66]. The variables with pairwise correlation coefficients below 0.8 based on Pearson, Spearman, and Kendall correlation coefficients were retained for further analysis (Figures S1–S3). Following this correlation analysis, a final set of 10 variables was selected for the model
The future predictions were employed to model the climate change across two socioeconomic pathways (SSP)—SSP245 and SSP585, for the periods 2041–2060 and 2061–2080. The SSP245 represents an intermediate scenario in which global development follows a “middle-of-the-road” trajectory, with moderate population growth, technological progress, and policies that gradually stabilize greenhouse gas (GHG) emissions by the end of the century, despite significant challenges [67]. Alternatively, SSP585 depicts a fossil fuel-intensive world with rapid population growth, high energy demand, limited climate policies, and continuously rising GHG emissions, leading to stronger climate forcing and associated impacts on ecosystems [68]. Additionally, the Hadley Centre Global Environment Model in Global Coupled Configuration 3.1 (HadGEM3-GC31 LL) of the sixth Coupled Model Intercomparison Project (CMIP6) was utilized during the study [69]. This general circulation model (GCM) was selected based on its known effective performance in South and Southeast Asia, and its capability to indicate time-based variations and correctly representing temperature dispersal, as observed in earlier studies [63,70,71,72,73].

2.3. Species Distribution Modeling

An ensemble modeling approach was employed for the three species, integrating multiple algorithms to combine their individual strengths. This method effectively captures the diverse ecological and statistical relationships that shape species distributions. Specifically, five algorithms were employed for the ensemble model, viz., boosted regression tree (BRT), generalized linear model (GLM), multivariate adaptive regression splines (MARS), maximum entropy (MaxEnt) and random forest (RF) [73,74]. Furthermore, the pseudo-absence points were randomly generated within the study area to enable fitting of the ensemble SDM. The Software for Assisted Habitat Modeling (SAHM) software v2.2.3 was used to run the ensemble model using the VisTrails workflow system [74,75]. The models generated continuous habitat suitability maps, with predicted values ranging from 0 (unsuitable) to 1 (highly suitable). Furthermore, for generating the binary presence–absence maps, these continuous outputs were subsequently thresholded using the sensitivity-equals-specificity (SES) criterion. This criterion balances omission and commission errors, offering an objective and widely applied cutoff in species distribution modeling. It helps minimize systematic overprediction or underprediction of suitable habitats and enables consistent comparisons across multiple algorithms. The exclusion criteria for the selected models were based on the area under curve (AUC) threshold value of 0.75 [76,77]. The ensemble map was produced scaling from 0 to 5, where the model agreement was denoted by each pixel, with the value of 5 signifying unanimity in agreement across all the models, facilitating the investigation of habitat conformation. Furthermore, to evaluate models’ performance, different metrics such as area under curve (AUC), true skill statistic (TSS), Cohen’s Kappa, proportion correctly classified (PCC), and sensitivity and specificity were measured for both training data and cross-validation (n = 10) [78,79].

2.4. Habitat Quality Assessment

In order to assess the quantitative and qualitative features of the suitable habitat areas in present and future climate set-ups, different class-level metrics were applied with FRAGSTATS software version 4.2.1 [80,81]. It analyzes the spatial patterns in landscapes and provides useful metrics to evaluate landscape characteristics. For this study, the metrics used were as follows: total number of patches (NP), largest patch index (LPI), total edge (TE), landscape shape index (LSI) and aggregate index (AI). NP, LPI and TE provide detailed analysis of the geometry, such as patch size and edge features. LSI provides information on the complexity and irregularity of the shape of patches, while AI evaluates the distance of the patches from one another within the landscapes. These metrics are significant in highlighting the effects of transformation in suitable ranges within a landscape [82,83]. These metrics were used to evaluate the habitat structures and assess the extent of fragmentation in the selected area in present and future climate scenarios [84,85].

3. Results

3.1. Model Performance

All models performed strongly on both training and cross validation data (Figures S4–S6, Table 1). The models showed an AUC value above 0.80 for training and cross-validation datasets for all three species (Figures S4–S6, Table 1). The maximum training AUC value was attained by the GLM algorithm for F. severus (AUC = 0.951), while the BRT model generated the highest training AUC both for G. tenuirostris (0.985) and H. leucoryphus (0.988). In terms of model performance during cross-validation, the maximum AUC value was generated by RF for F. severus (AUC = 0.891), while for G. tenuirostris the model RF attained highest value (AUC = 0.937) and for H. leucoryphus, both BRT and RF models generated highest AUC value during cross-validation (AUC = 0.958). The highest ΔAUC value was seen in the GLM for F. severus (0.122) indicating model overfitting, while for G. tenuirostris the highest ΔAUC was achieved by the BRT model (0.068), and for H. leucoryphus the BRT and RF models produced the highest ΔAUC value (0.038). On the other hand, the RF model showed the lowest ΔAUC values across all the three species. The good performance of the models was also supported by the valuation metrics such as TSS, PCC, Kappa, Sensitivity and Specificity, which yielded maximum values, thus supporting the predictive consistency of the ensemble modeling approach.

3.2. Variable Importance

The model for F. severus showed that across the five models, on an average (μ), the variable precipitation of coldest quarter (bio19) was the highest contributor (29.02%) (Table 2). Elevation (23.66%) was the variable most contributing topographic to the models (Table 2). Similarly, the ensemble model for G. tenuirostris indicated elevation as the highest contributor (37.14%), while temperature seasonality (bio4) was the highest bioclimatic contributor (23.18%). For H. leucoryphus, the most influencing habitat variable was elevation (54.02%), and precipitation of the driest month (bio14) was the highest contributing bioclimatic variable (16.41%) (Table 2).

3.3. Habitat Suitability

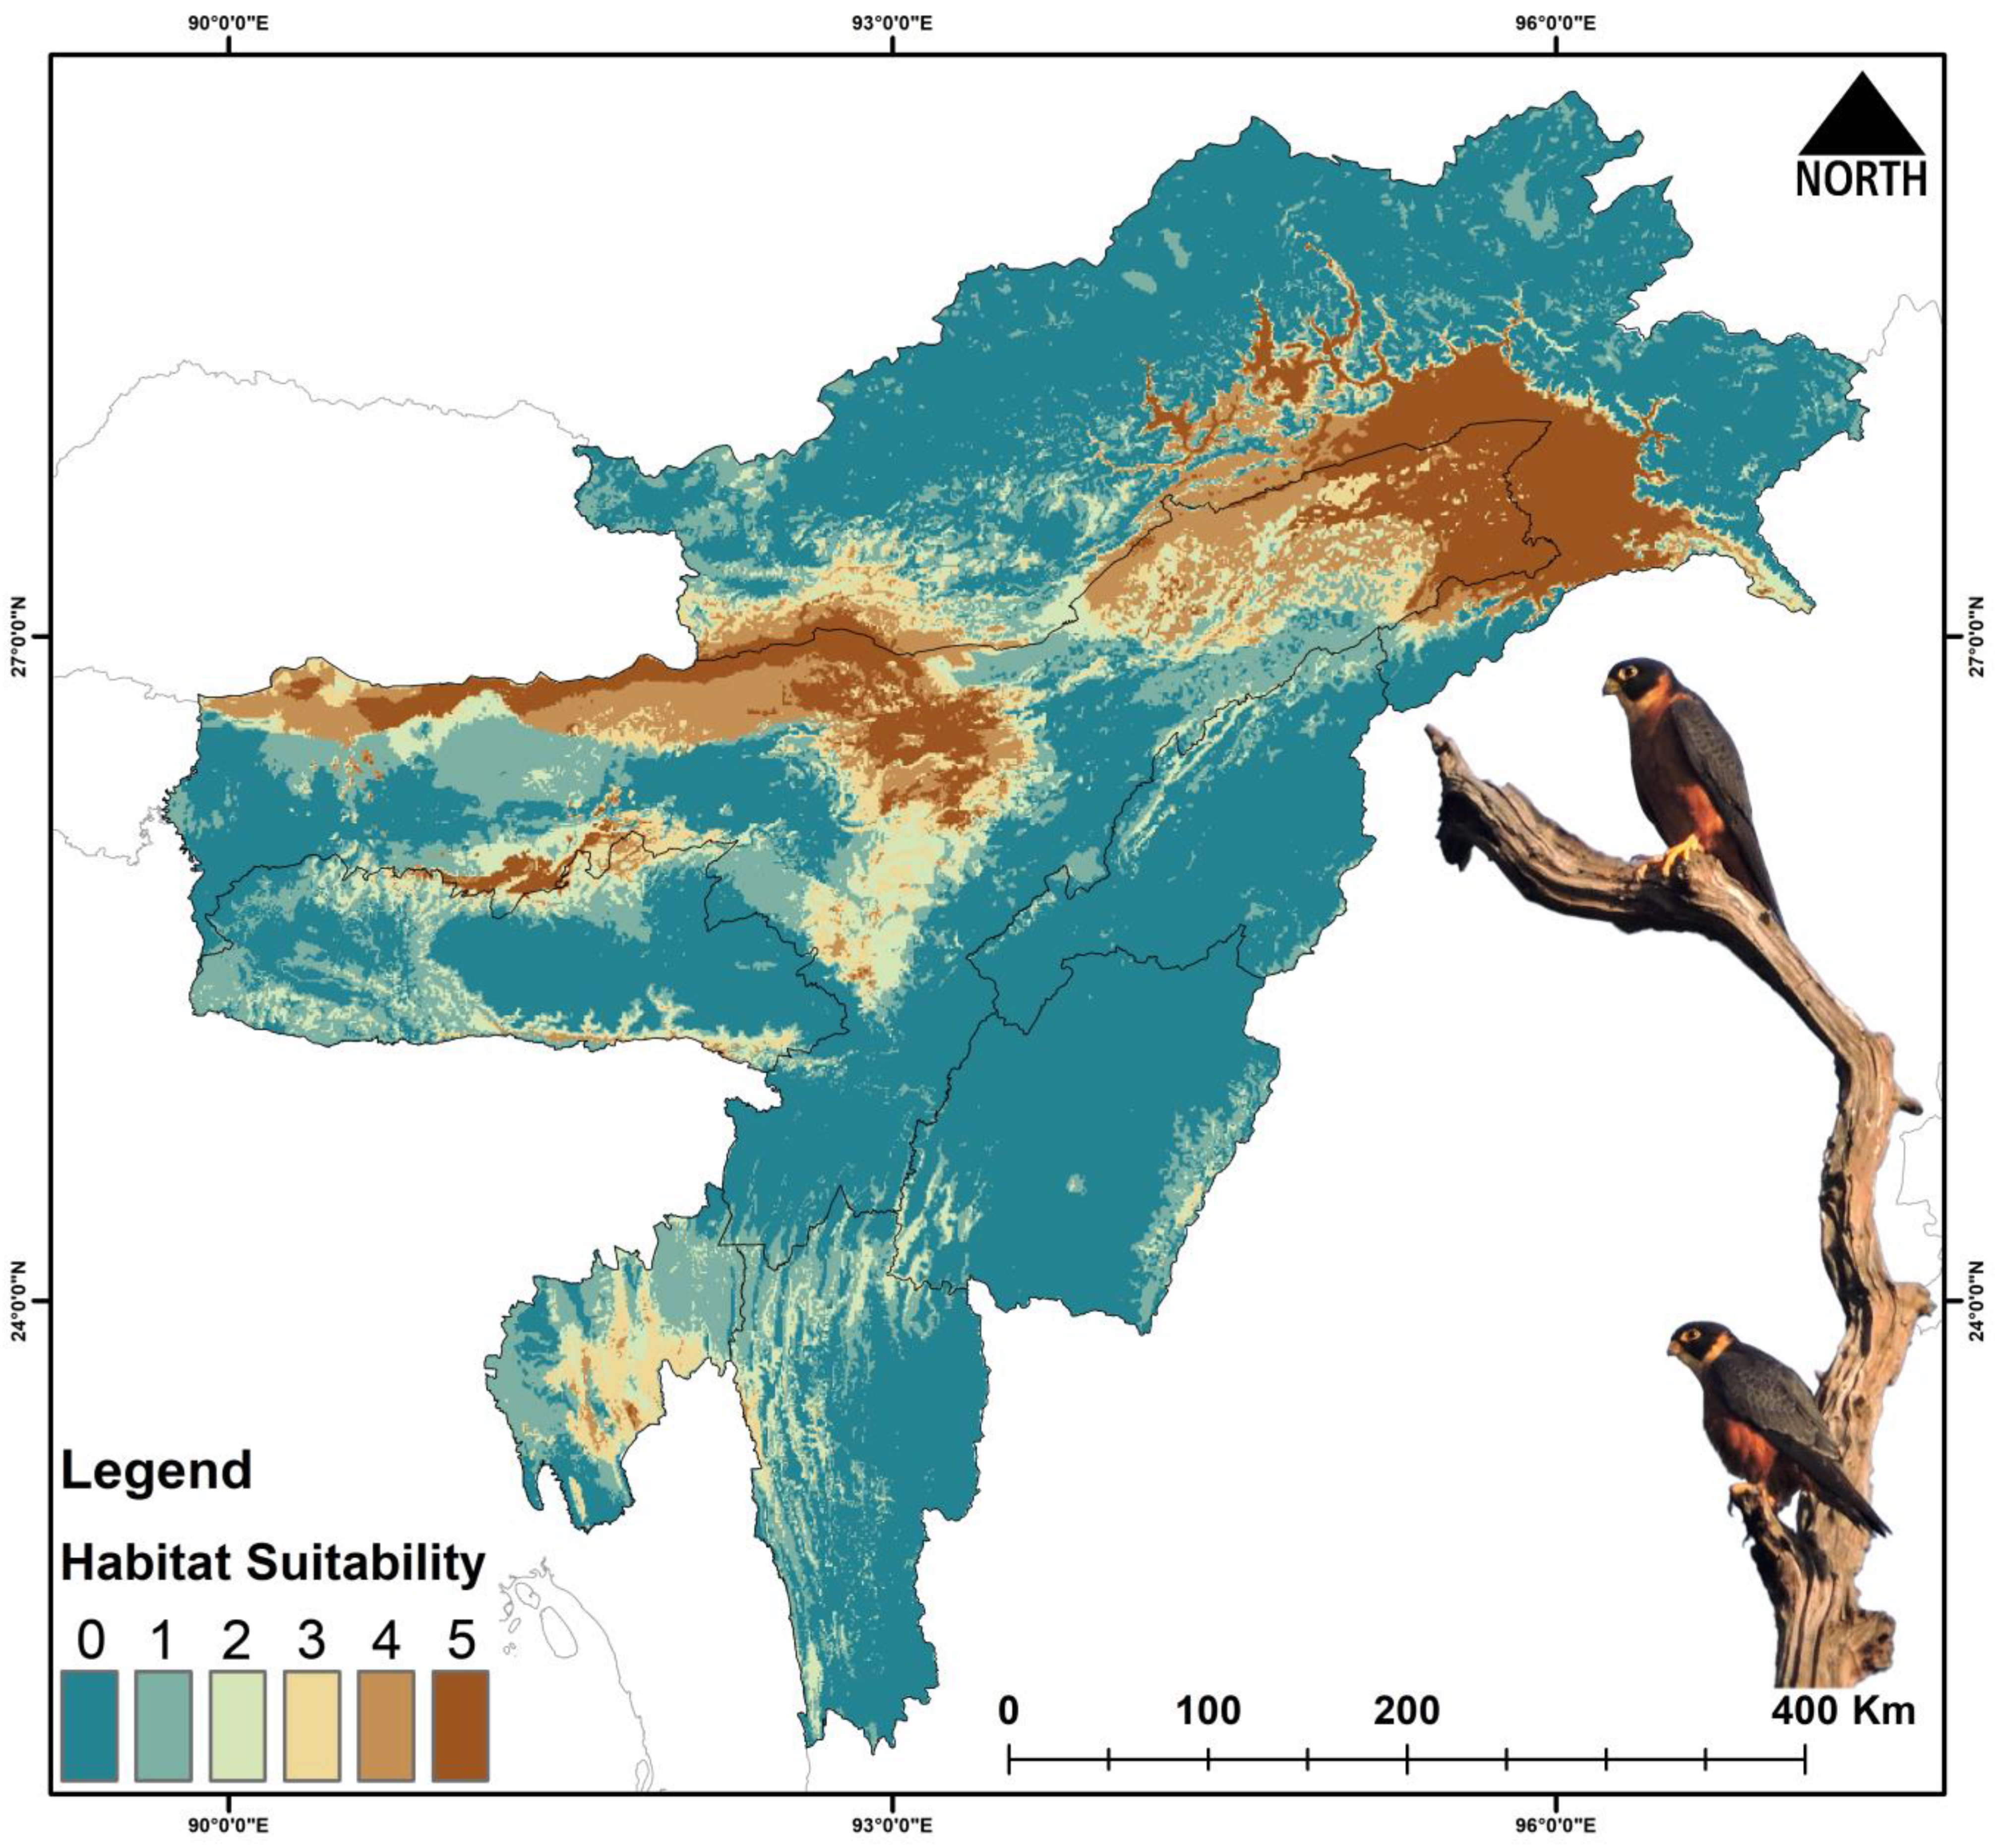
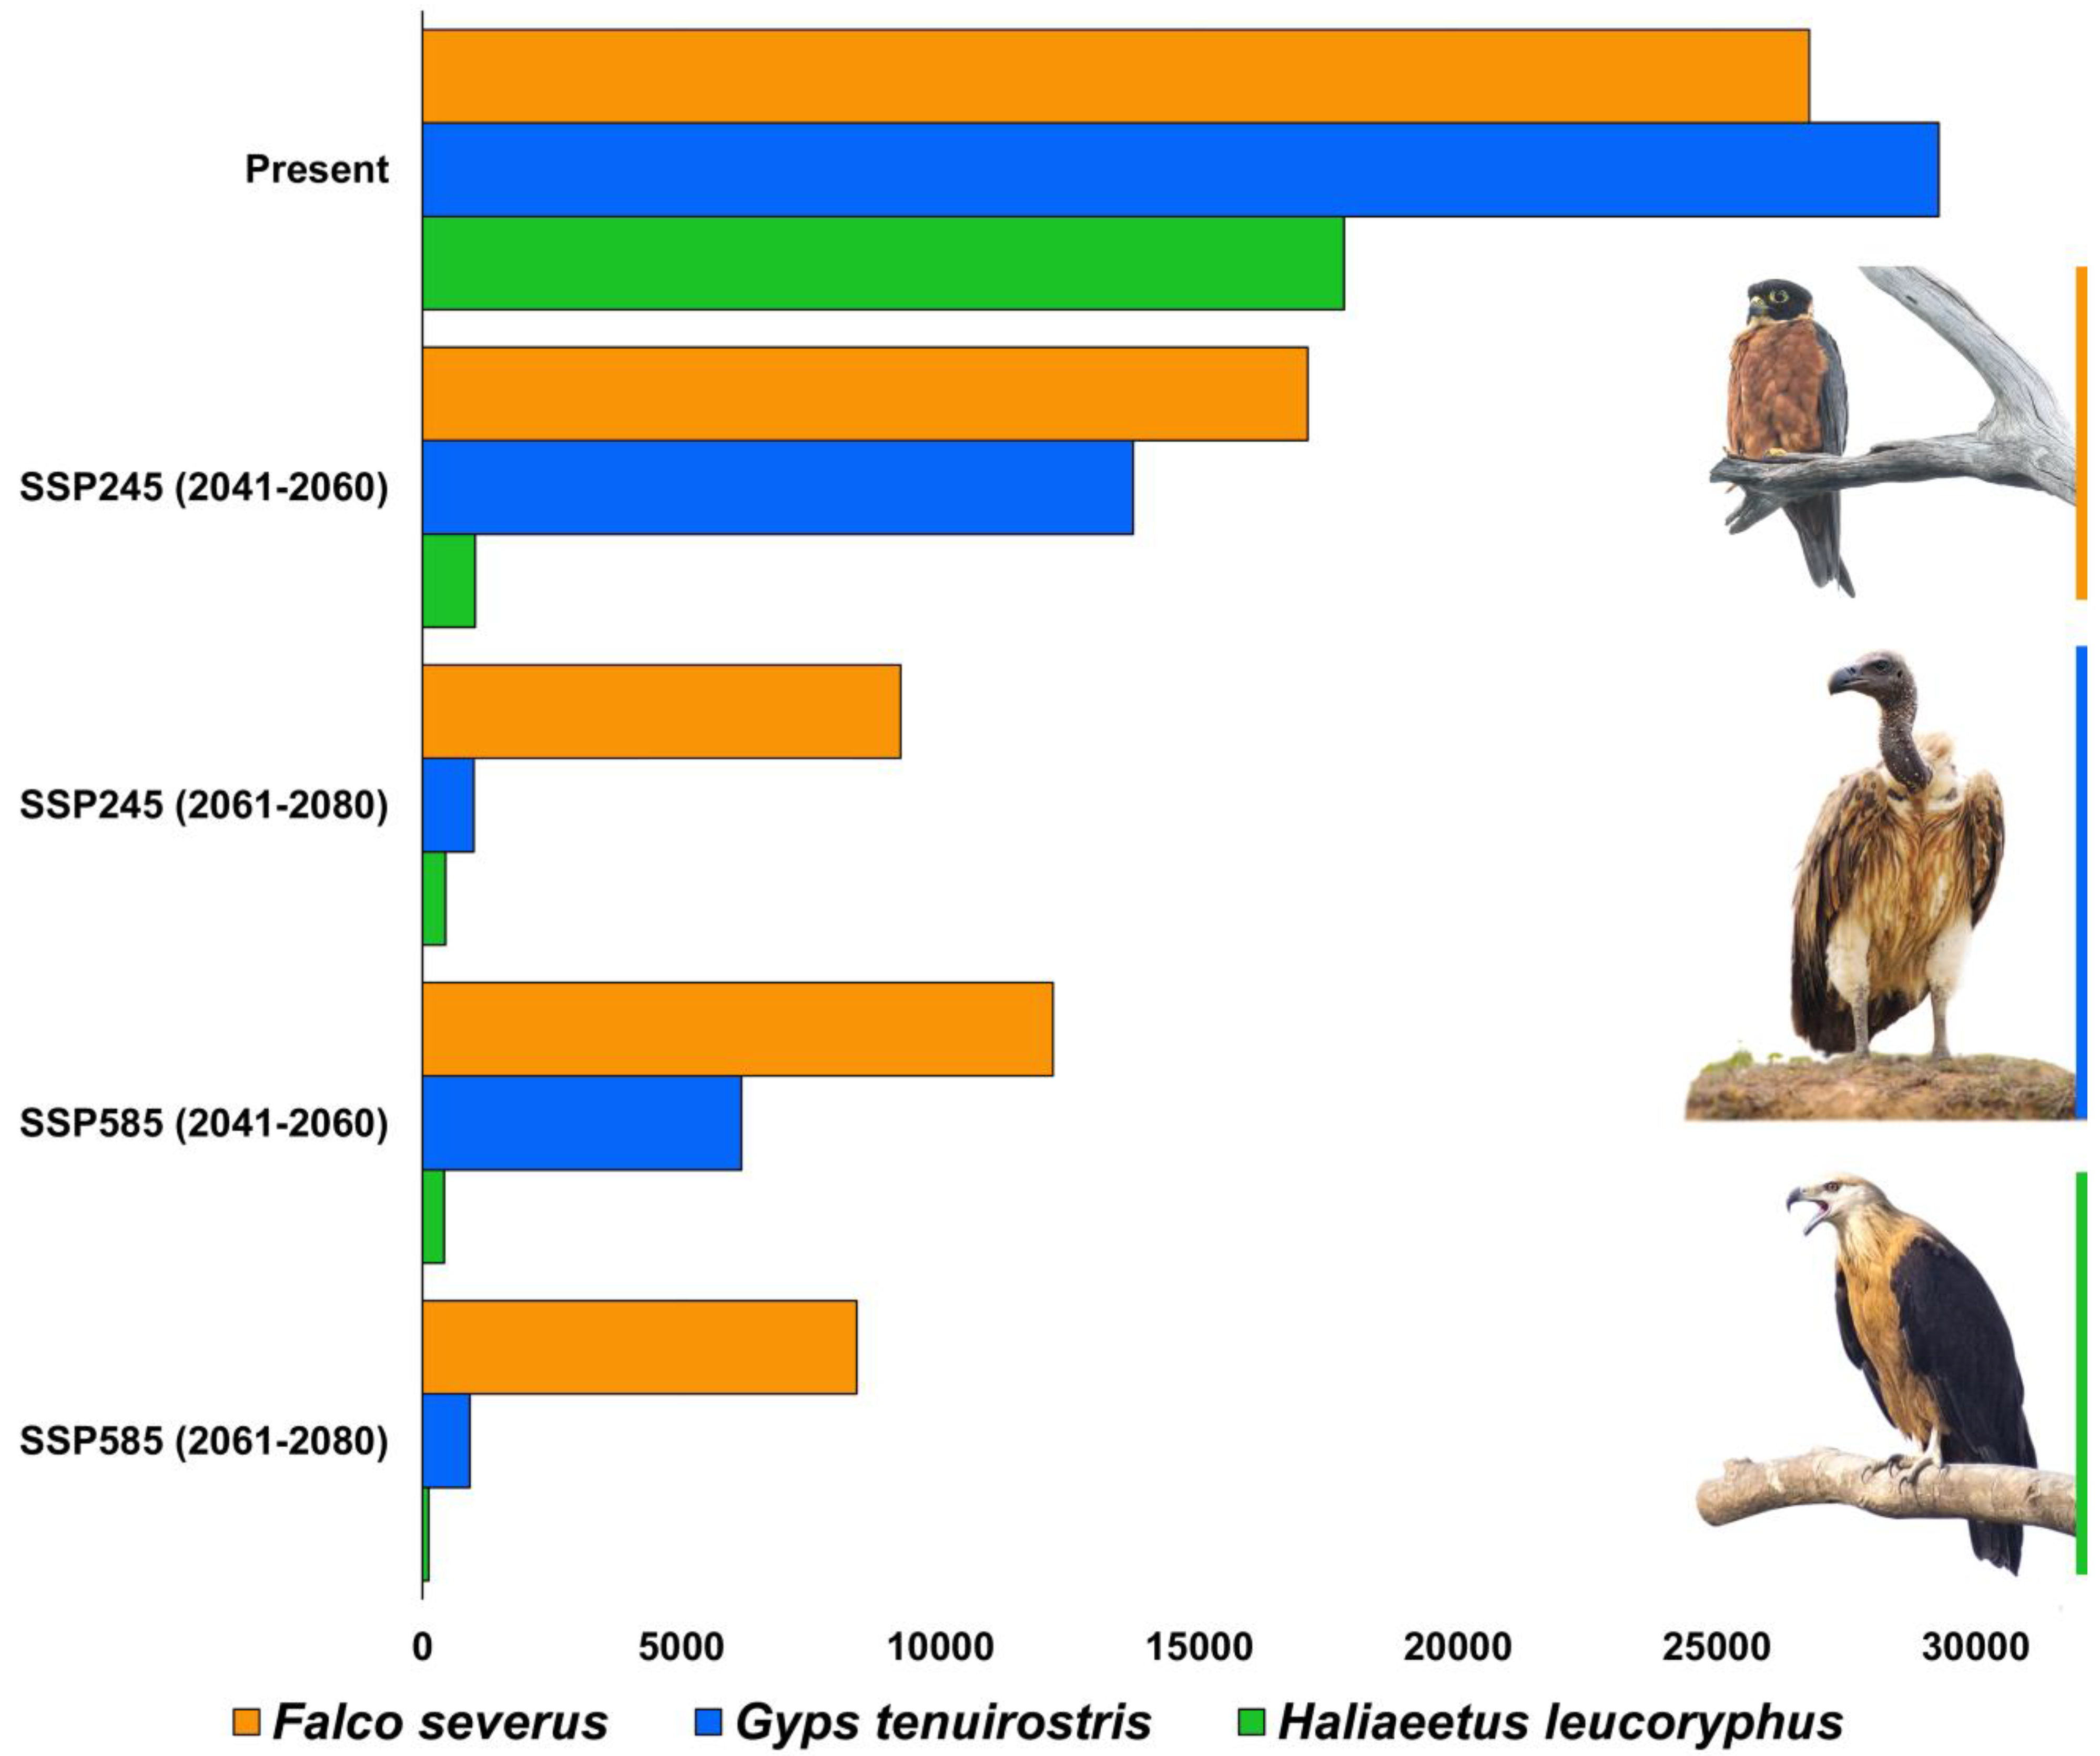
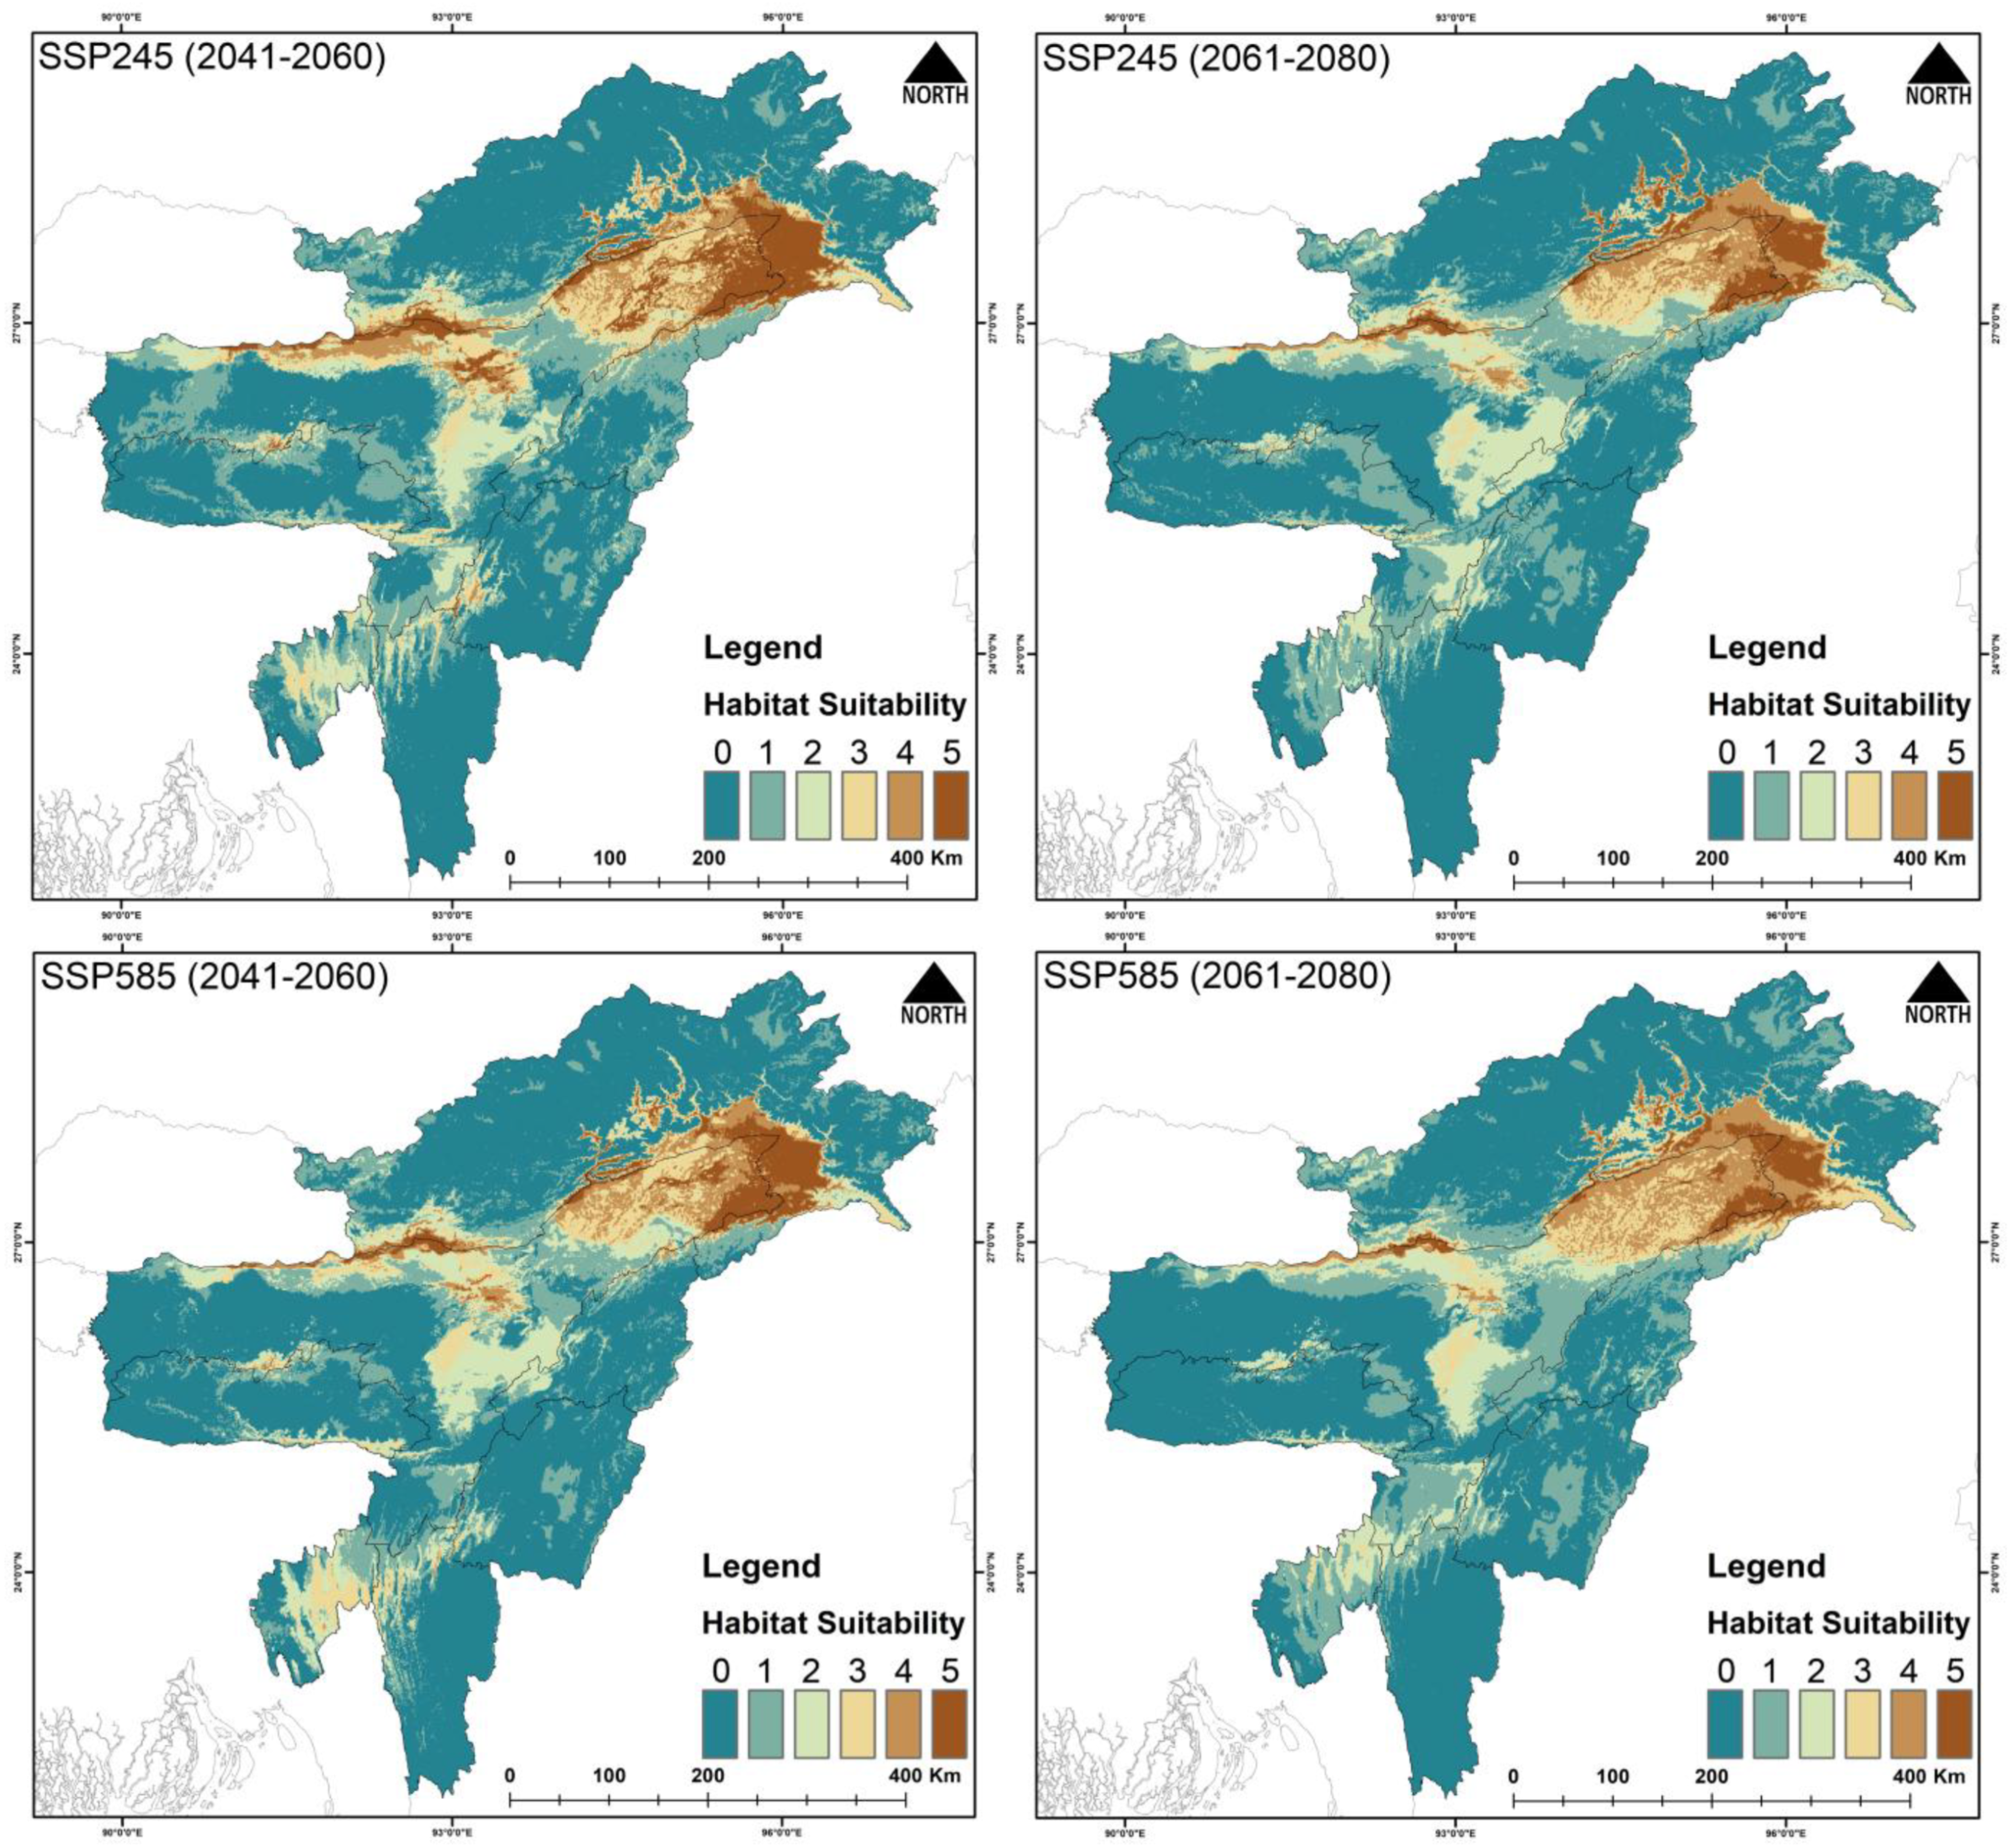
The total area selected for the study is about 255,083 km2. Out of this area, for F. severus, the present suitable area is 26,801 km2, which is 10.5% of the total area (Figure 2, Table 3 and Table S2). During the years 2041–2060 (SSP245), the suitable area is reduced to 17,109 km2, and during 2061–2080 (SSP245) the area is 9231 km2. Similarly, the suitable area during the period 2041–2060 (SSP585) is 12,184 km2, and during 2061–2080 (SSP585) the area is further reduced to 8389 km2. The percentage of suitable area loss from the present area is 36.16% during 2041–2060 (SSP245), and the loss during 2061–2080 (SSP245) is 65.55%. Similarly, the percent suitable area loss during 2041–2060 (SSP585) is 54.53% and there is 68.69% loss during 2061–2080 (SSP585).
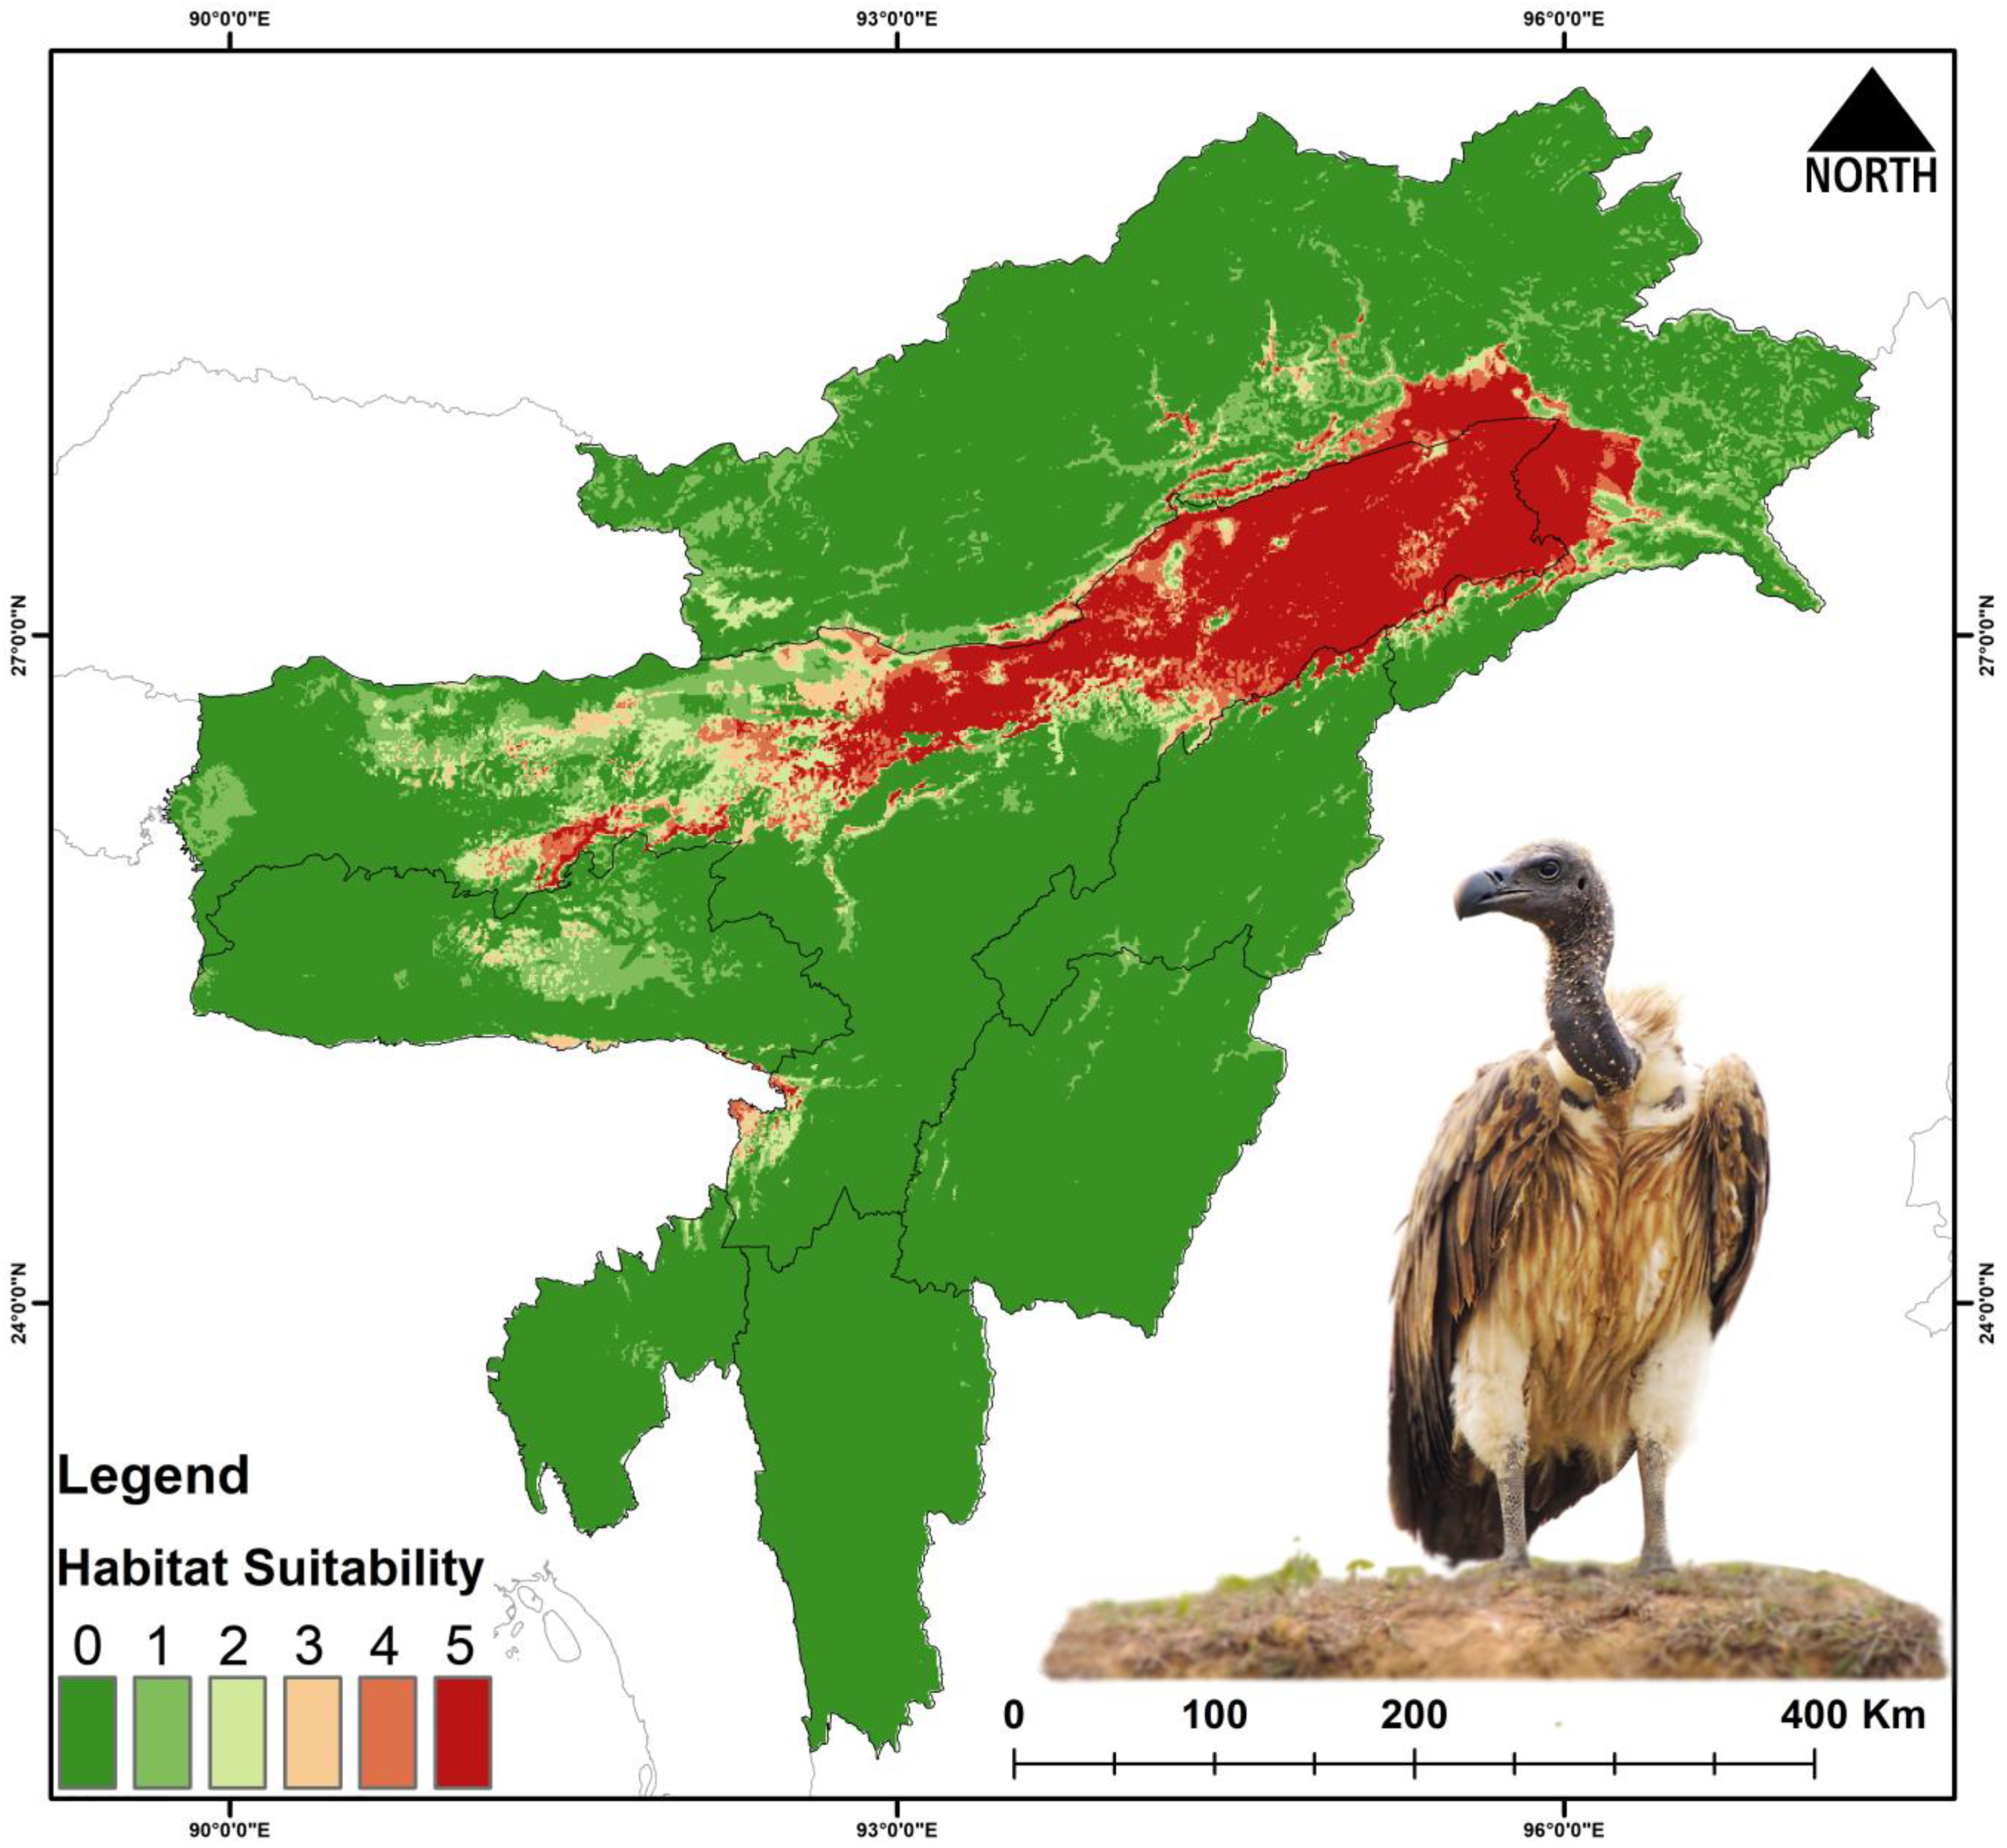
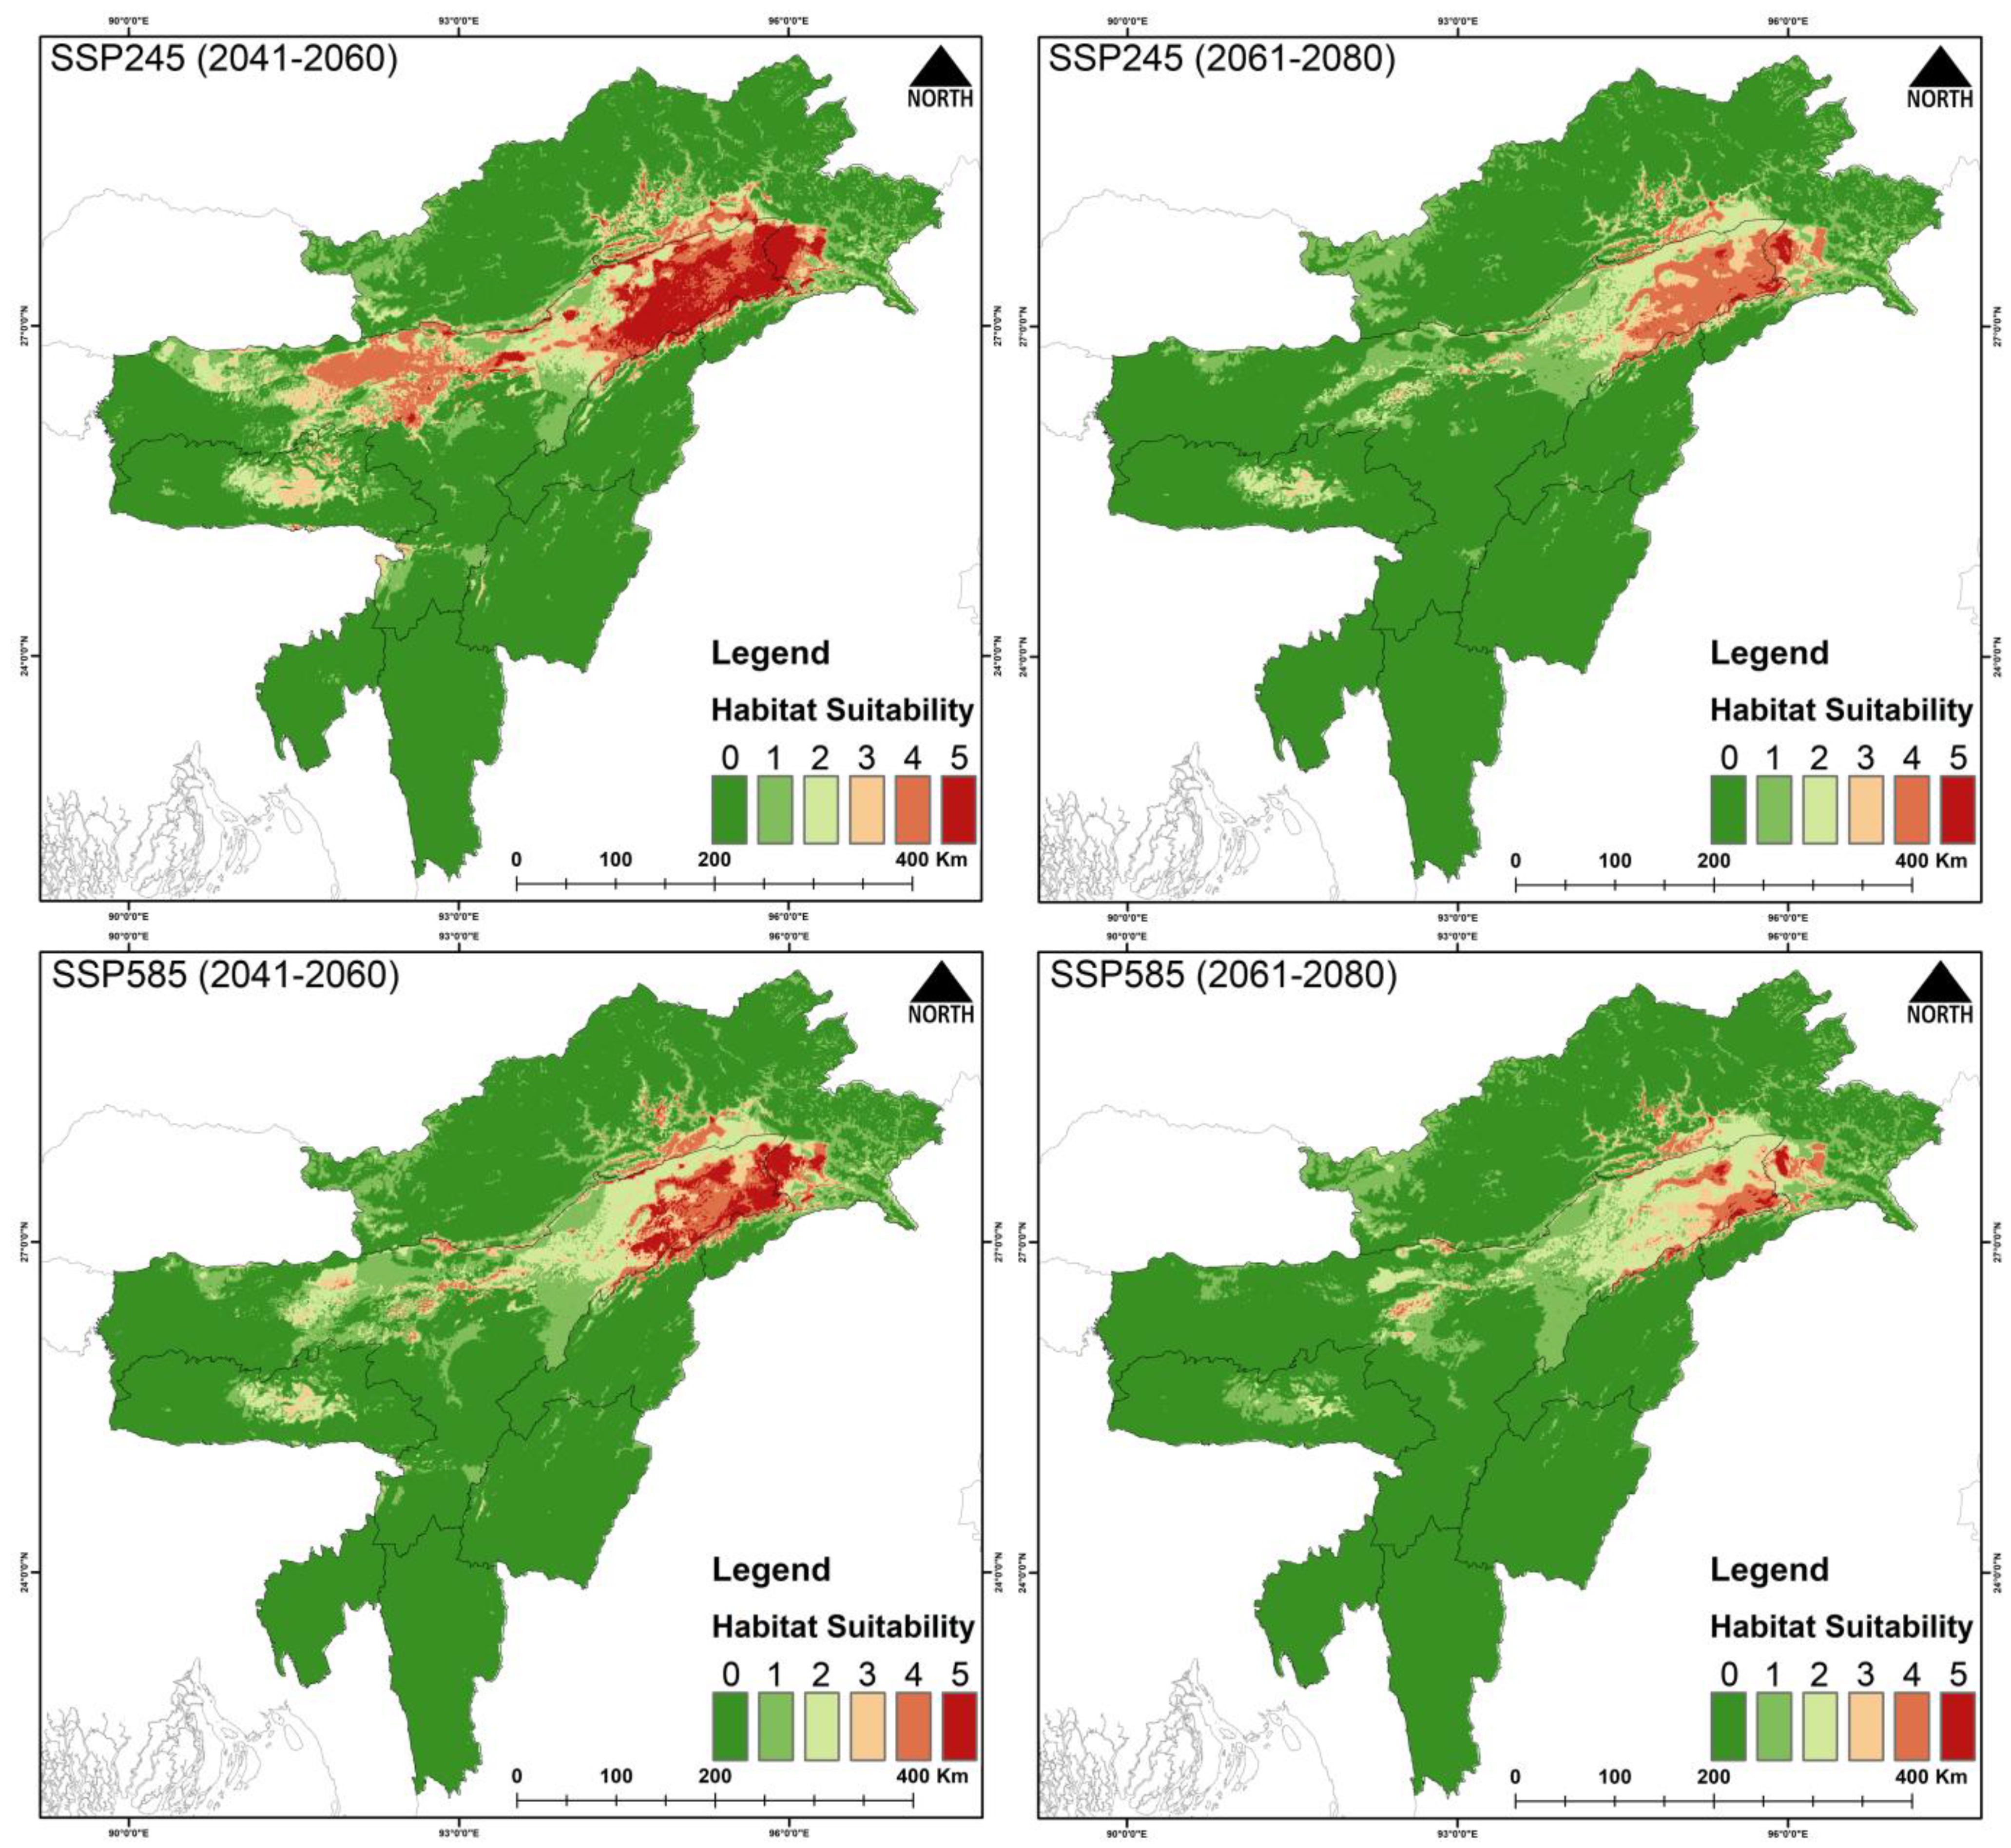
For G. tenuirostris, 29,297 km2 (11.4%) is currently suitable (Figure 3, Table 3 and Table S2). During the years 2041–2060 (SSP245), the suitable area is reduced to 13,731 km2, and during 2061–2080 (SSP245) the area is 989 km2. Similarly, the suitable area during the period 2041–2060 (SSP585) is 6160 km2, and during 2061–2080 (SSP585) the area is further reduced to 919 km2. The percentage of suitable area loss from the present area is 53.13% during 2041–2060 (SSP245), and the loss during 2061–2080 (SSP245) is 96.62%. Similarly, the percent suitable area loss during 2041–2060 (SSP585) is 78.97%, and there is 96.86% loss during 2061–2080 (SSP585).
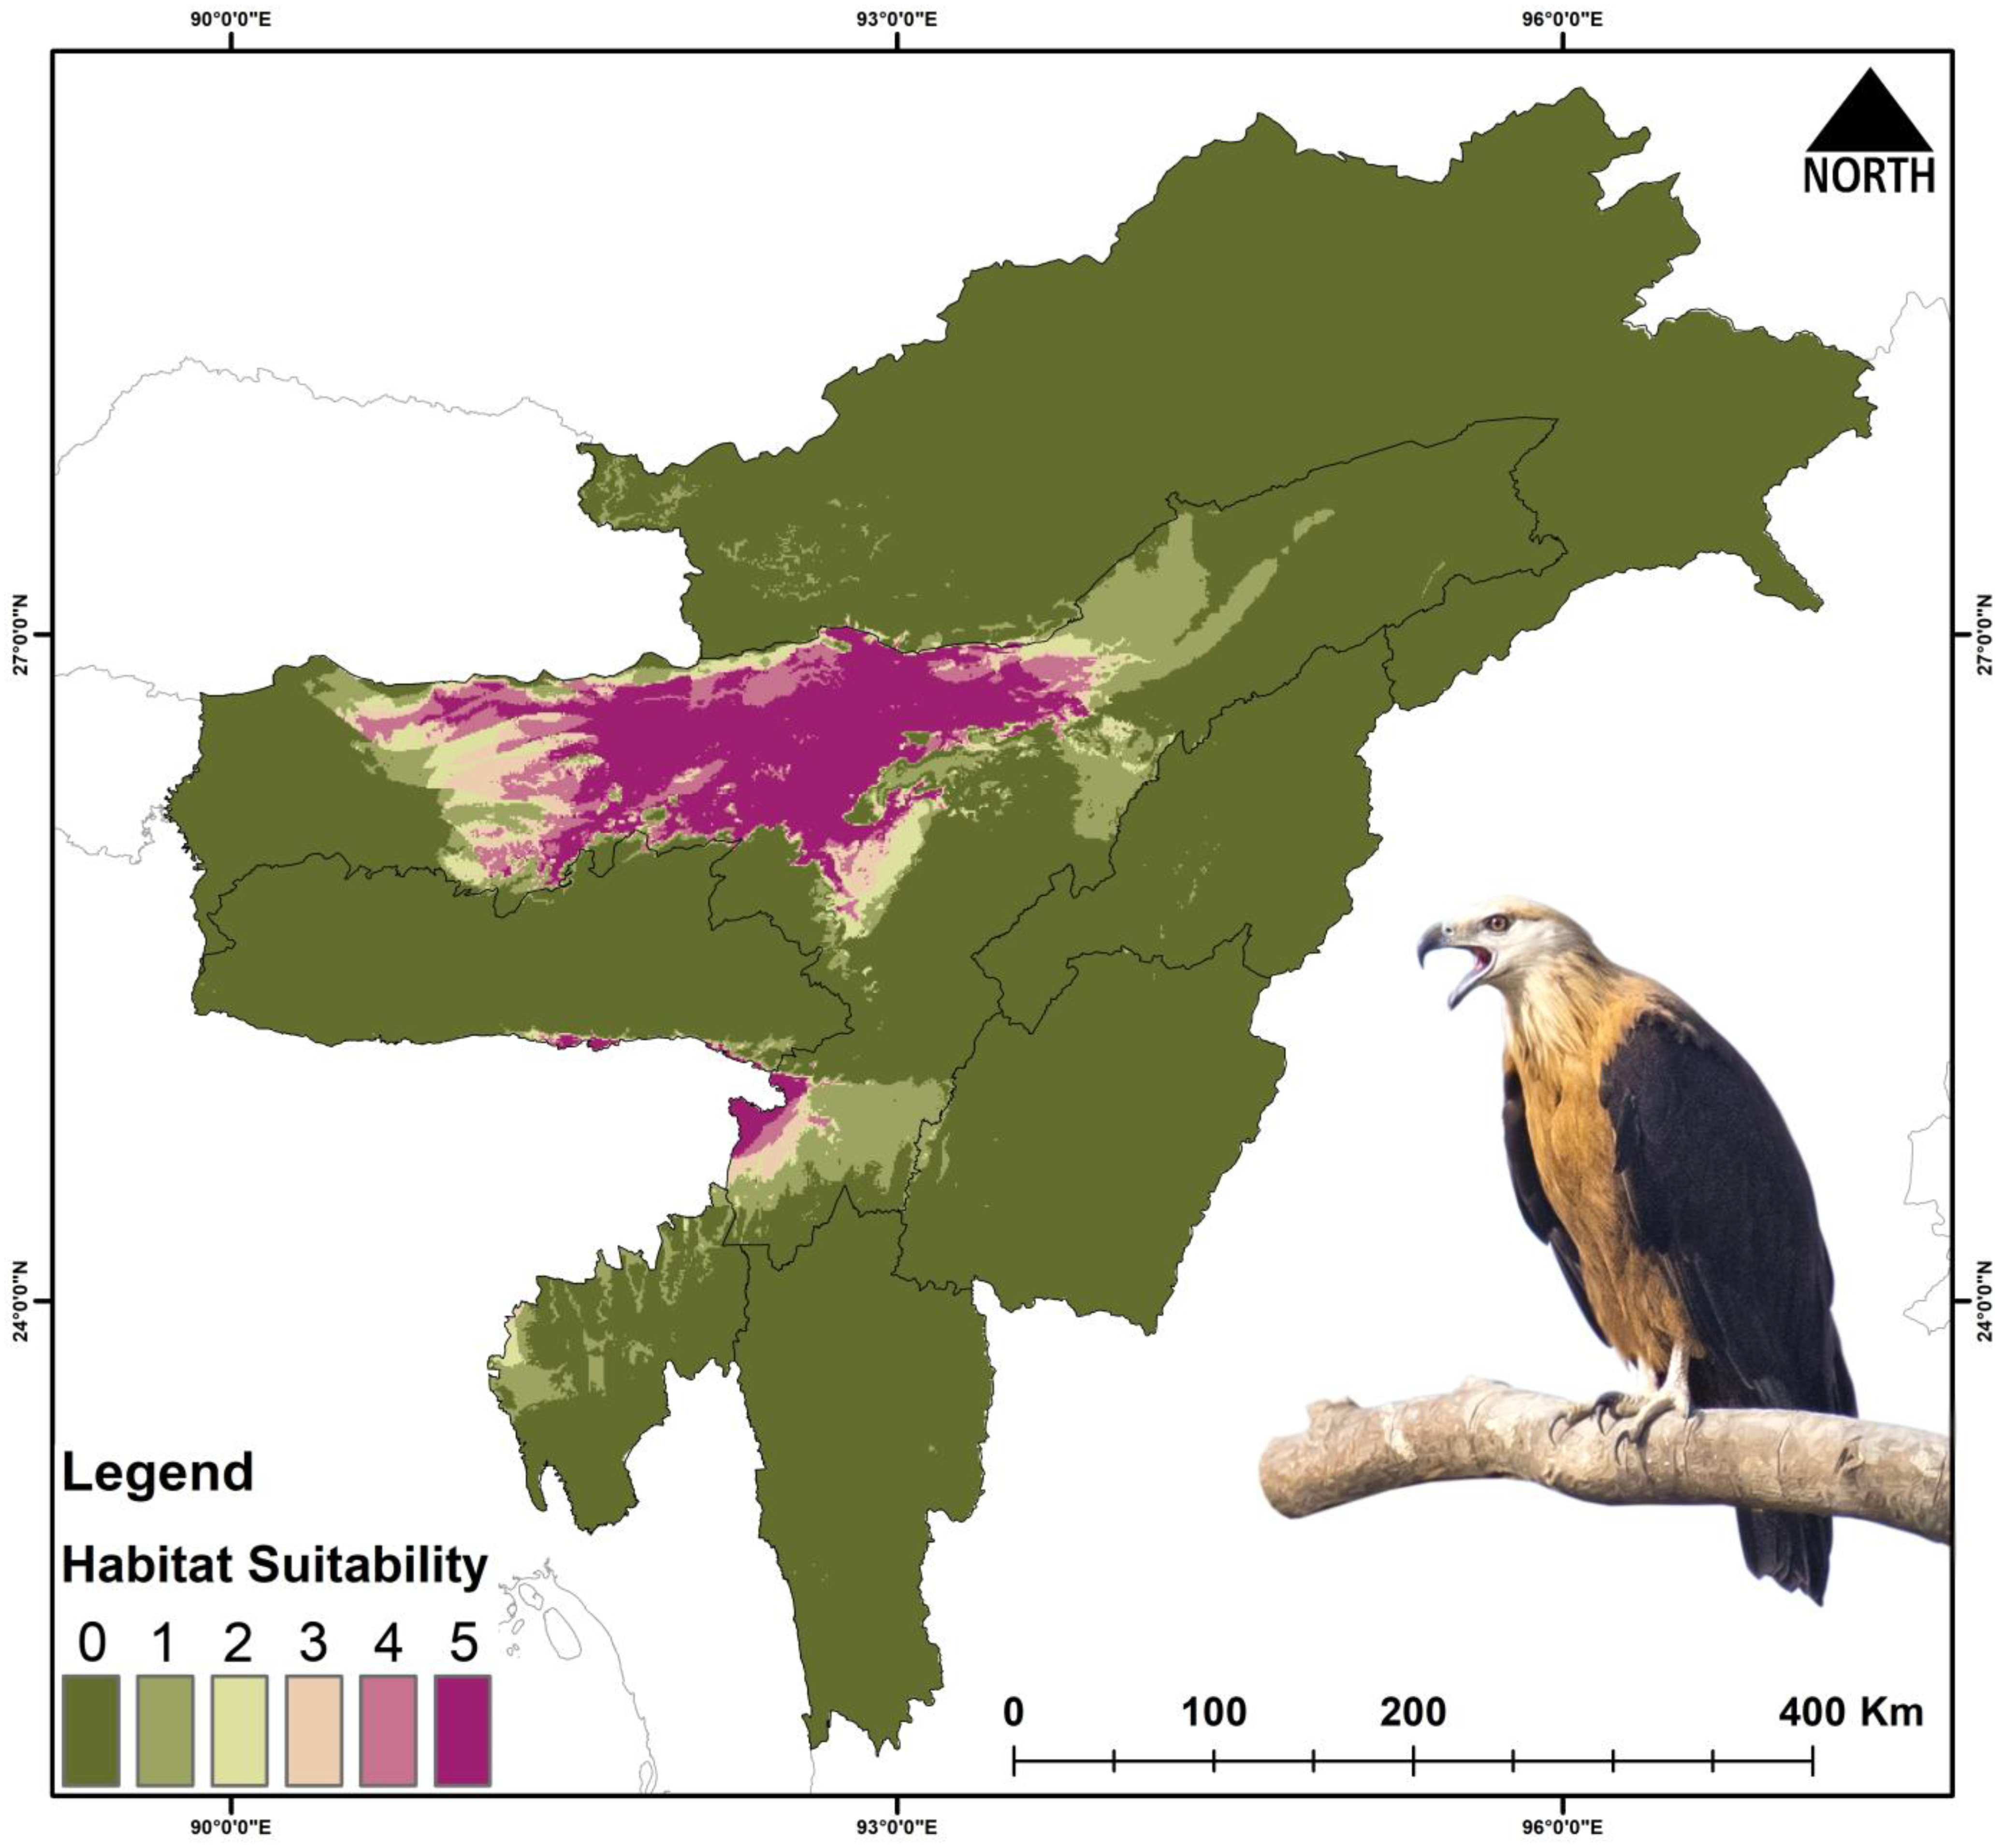
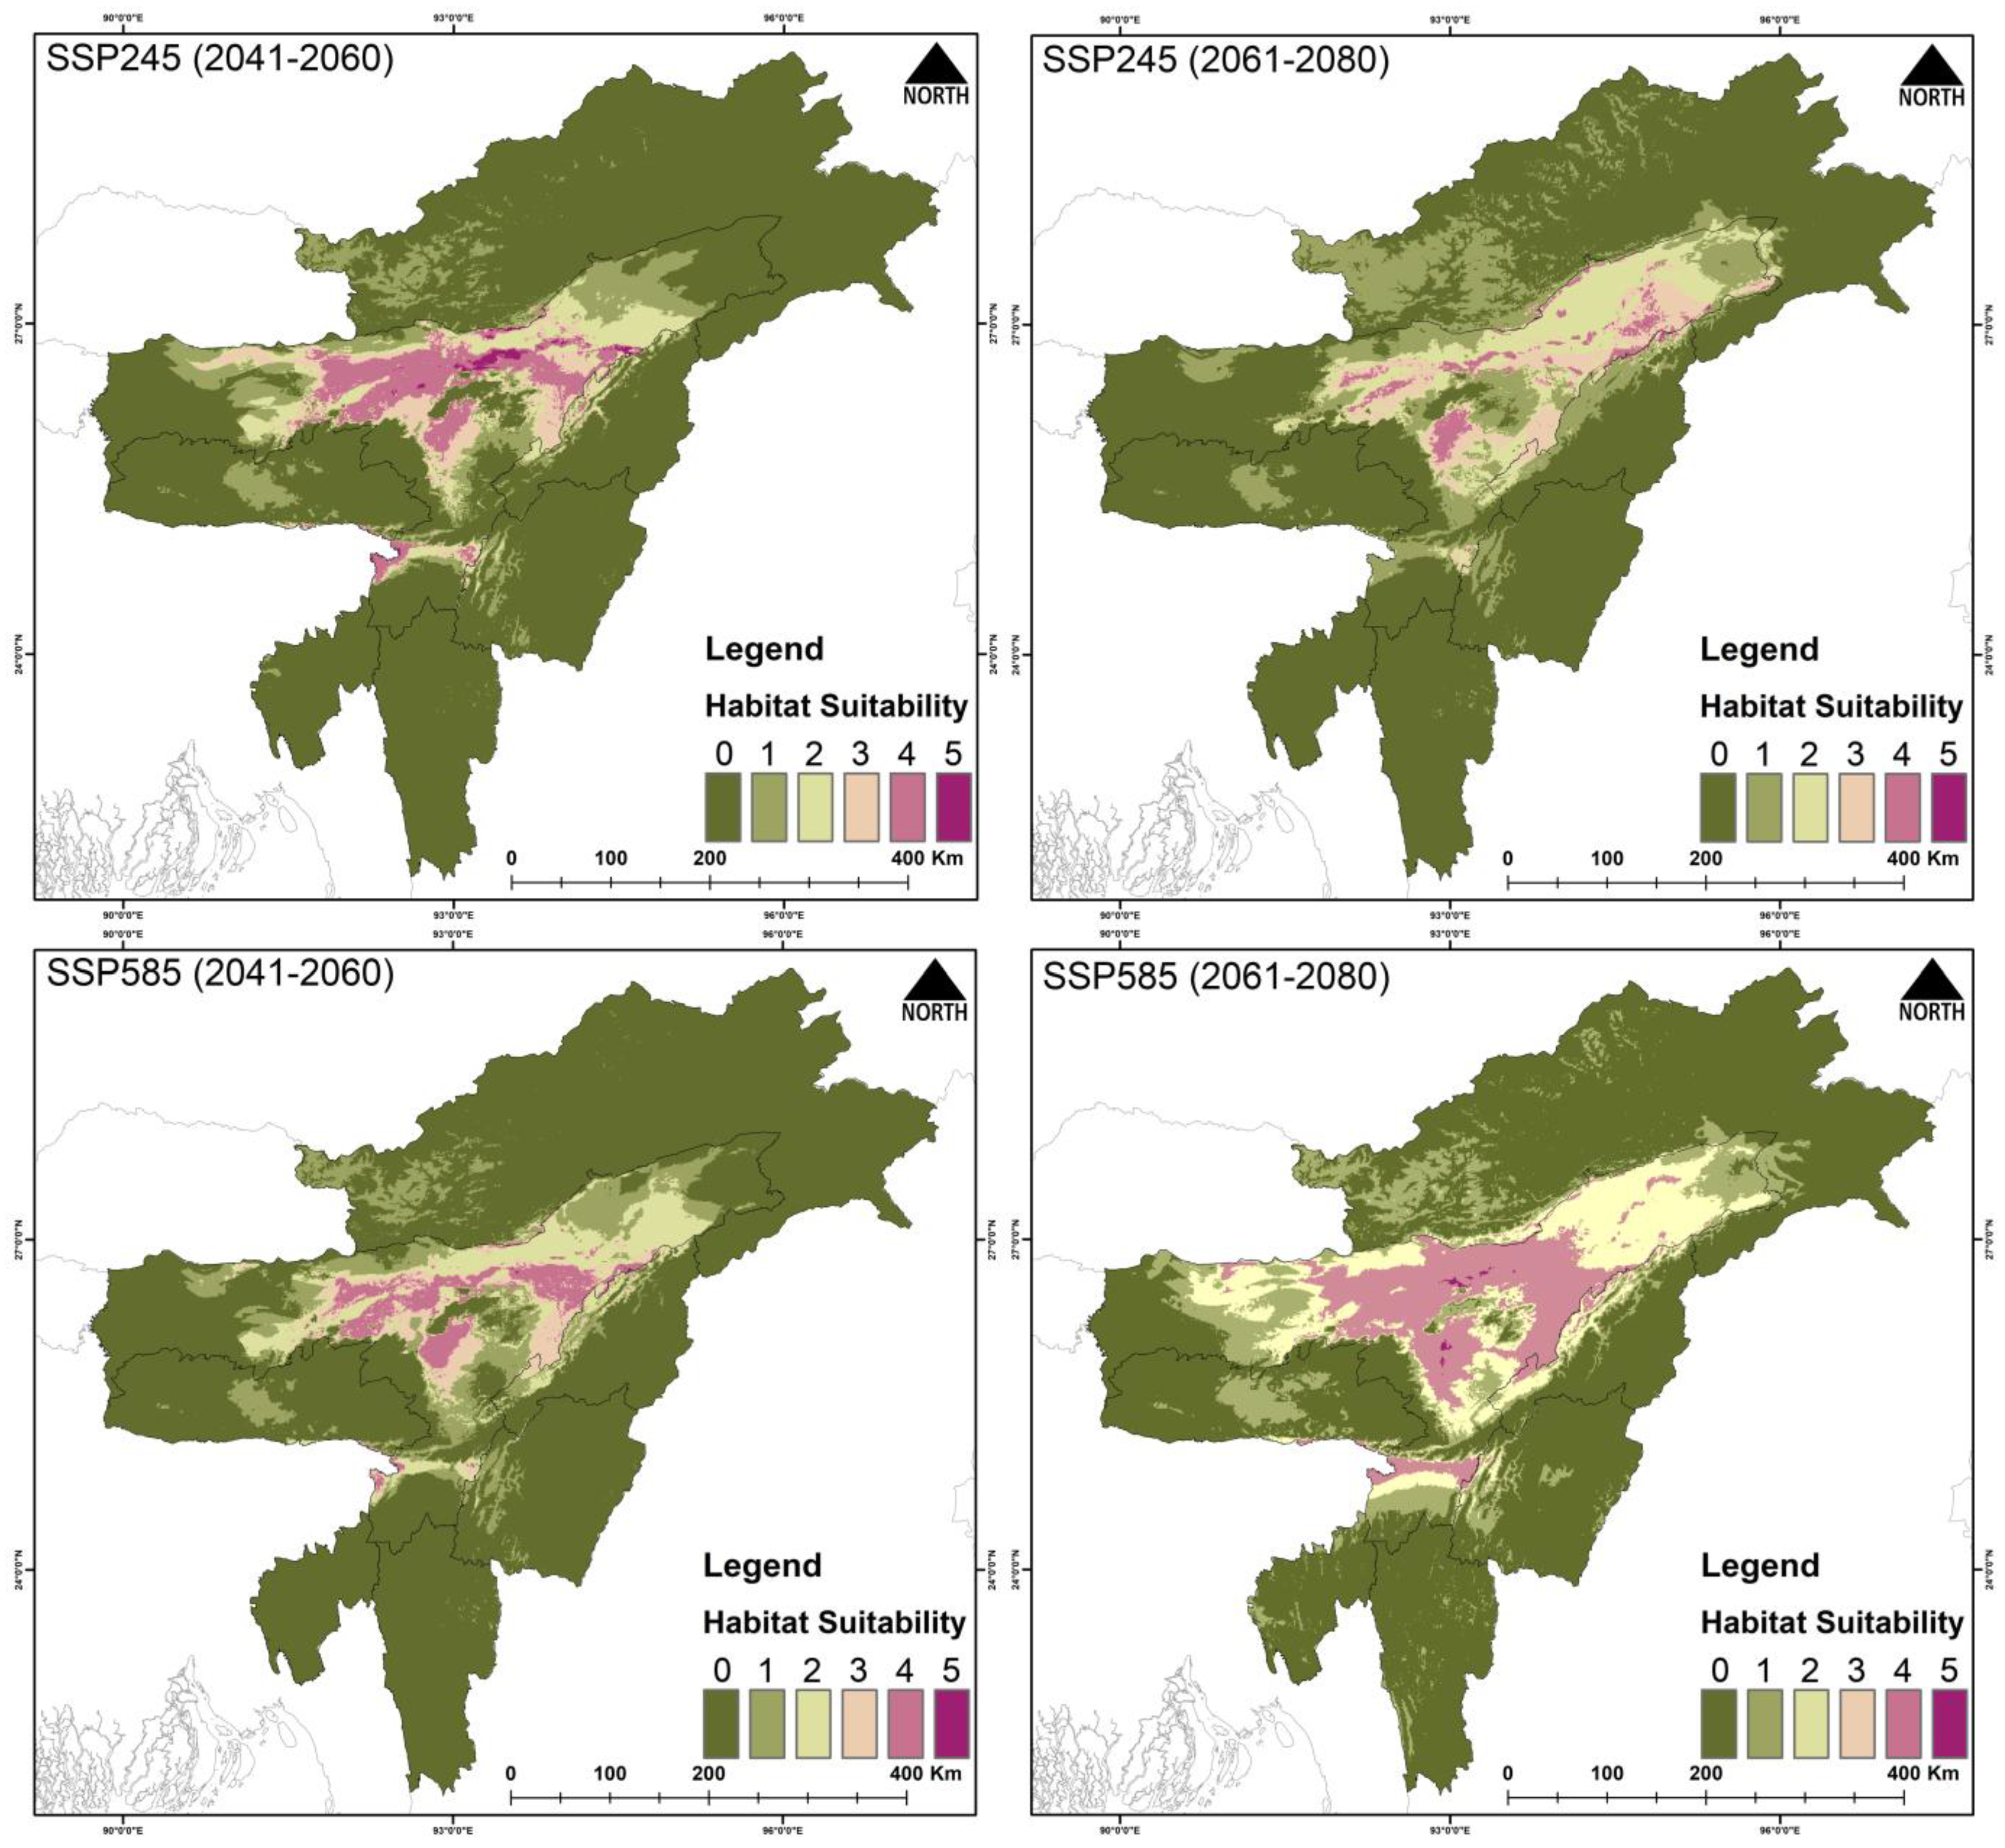
The present suitable area for Haliaeetus leucoryphus is 17,808 km2, which is 6.9% of the total area (Figure 4, Table 3 and Table S2). During the years 2041–2060 (SSP245), the suitable area is reduced to 1021 km2, and during 2061–2080 (SSP245) the area is 444 km2. Similarly, the suitable area during the period 2041–2060 (SSP585) is 419 km2, and during 2061–2080 (SSP585) the area is further reduced to 119 km2. The percentage of suitable area loss from present area is 94.26% during 2041–2060 (SSP245), and the loss during 2061–2080 (SSP245) is 97.5%. Similarly, the percent suitable area loss during 2041–2060 (SSP585) is 97.64%, and there is 99.33% loss during 2061–2080 (SSP585).
The future climate projection indicated vast loss of habitats with 36–68% loss in the habitats for Falco severus under SSP245 and SSP585 scenarios (Figure 5 and Figure 6, Table 3 and Table S2). For G. tenuirostris, the habitat loss in future climate scenarios was 53–96% (Figure 5 and Figure 7, Table 3 and Table S2). The most extreme loss of habitat under future climate was observed for Haliaeetus leucoryphus, which suffered 94–99% loss under SSP245 and SSP585 scenarios (Figure 5 and Figure 8, Table 3). All three species showed severe reductions in suitable habitat area in present and future climate (Figure 5, Table S2).

3.4. Quality of the Suitable Habitat

The severe loss of habitat of the raptors has resulted in significant changes to the geometry of the area. Fragmentation analysis suggests significant changes in the geometry of the area due to the severe loss of suitable habitats. For F. severus, there was a 33% decrease in the number of patches (NP) in SSP245, and 41% in SSP585 scenarios (Table 4). There was a significant reduction in the suitable areas for F. severus, with about 64.64% decrease in patch sizes (LPI) in SSP245 and 79.37% in SSP585. Also, there was a 70.20% decrease in number of fragmented patches in SSP245 and 77.25% in SSP585 scenarios within the suitable habitats of G. tenuirostris, with a 98.45% reduction in patch sizes (LPI) in SSP245 and 99.04% decrease in SSP585 scenarios. For H. leucoryphus, there was a 77.05% decrease in number of patches (NP) in SSP245 and 90.16% in SSP585 climate scenarios. There was also a severe reduction in patch size (LPI) by 99.96% in SSP245 and by 99.98% decrease in SSP585 scenarios (Table 4). The metrics indicating the patch proximity (AI) showed a noteworthy decline, while edge structures (TE and LSI) also showed an increase in edge shape complexity for all the three species (Table 4).

4. Discussion

4.1. Present Suitable Habitats

The model outputs have highlighted the major influence of climate change on the raptors’ occurrence and distribution in Northeast India. Among the three species, G. tenuirostris has the broadest suitable habitat under current climatic conditions, spreading over 29,297 km2, followed by F. severus, which has an area of 26,801 km2, while H. leucoryphus has the lowest suitable habitat area of 17,808 km2. Out of the total study area, the limited availability of suitable habitats for F. severus (10.5%), G. tenuirostris (11.4%), and H. leucoryphus (6.9%) highlights noteworthy spatial restraints within the study area. These results suggest likely habitat loss and fragmentation susceptibility, probably driven by anthropogenic causes. The highly suitable areas for F. severus were observed in Assam and Arunachal Pradesh. In Assam, Tinsukia, Dibrugarh, Golaghat, Biswanath, Sonitpur, Kamrup districts, and the northern BTR region showed high suitability areas, while Changlang, Lohit and Lower Dibang Valley districts of Arunachal showed many suitable areas. For G. tenuirostris, the high suitability area extends from Biswanath, Sonitpur and Golaghat districts to throughout the upper Assam area, including Changlang, Lower Dibang Valley, Namsai and Lohit districts of Arunachal Pradesh. Our result aligns with a study conducted on G. leucoryphus in Arunachal Pradesh [86]. The present suitable area of H. leucoryphus extends from middle Assam to the lower Assam, including the districts Golaghat, Biswanath, Sonitpur, Nagaon and BTR regions. The current predictive distribution evaluation also concerningly suggests a about 50–90% loss of suitable habitats in projected future climatic conditions. The expected reduction in suitable habitats has also been validated by other studies on raptors globally [87,88].
The predictors responsible for such effects are bioclimatic and topographic. The bioclimatic variables such as precipitation of the driest quarter, precipitation of the wettest month, and temperature seasonality were the most influencing factors. Climate predictive modeling studies have suggested that raptors in tropical regions have a multidirectional shift in their range [2,88]. These raptors track precipitation variations rather than temperature alone, as fluctuations in precipitation regimes highly influence the breeding success in the tropical regions [88]. Precipitation exerts differential effects on the abundance and survival of various species within the genus Falco, as observed by other researchers [89]. Increased precipitation has been directly associated with higher nestling mortality in falcons [90]. Studies have shown that temperature has been linked to brood loss in raptors [91], and temperature has also been linked to delayed migration [92] and to prey availability [2]. Heavy precipitation has been seen to increase juvenile mortality in raptors [92], decrease survival rate in nests [93], and reduce prey supply to the nest [94]. Thereby, precipitation is seen as a vital factor for the survival of raptors, as also observed in our study. Similarly, elevation was found to be the highly influential variable driving the distribution of G. tenuirostris (37.1%) and of H. leucoryphus (50.0%). Our findings draw similarity with Biju et al. (2024) [86], who observed elevation as the most influencing variable for the occurrence of Gyps tenuirostris. The study suggested that the species prefers a low-elevation foothill belt with high temperature and high precipitation.
The habitat suitability of raptors in the eastern Himalayas is mainly governed by elevation and temperature-related variables, showing the region’s complex topography and climate [95]. On the contrary, the main predictors in African savannas are precipitation and rainfall seasonality, which influence prey richness and open habitats crucial for raptors [96]. In temperate Europe, habitat suitability models are dominated by topographic variety, food availability, and precipitation, highlighting the importance of landscape patchiness [97]. Other South Asian regions exhibit habitat suitability for raptors that is influenced by a combination of elevation gradients, diverse habitat types such as forests and wetlands, and anthropogenic factors including proximity to human refuse sites. These environmental and human-related variables collectively shape raptor distribution patterns by affecting resource availability and habitat quality [98]. The suitability of raptor habitats is consistently influenced by climatic and topographic factors. However, the significance of variables such as rainfall, land use, and human-induced changes differs considerably across regions [99].

4.2. Future Climatic Predictions

In future climatic projections (under SSP245 and SSP585), it was observed that F. severus has lost 36–68% of its suitable habitats. Also, the quality of the habitat has degraded considerably, with a 33% decrease in the number of habitat patches in SSP245 and 41% in SSP585 scenarios (Table 4). Subsequently, there was a 64.64% reduction in the patch size, and increased distance from one patch to another. This raptor, being a species of forested foothills, utilizes tall trees to build nests in suitable forest habitats in the region [36,43]. The current and future trends in loss of habitats are concerning for this species, as they will likely negatively affect its population [100]. Similarly, the vulture G. tenuirostris is likely to lose 53–96% of its suitable habitation in future climate scenarios. The habitat quality has also deteriorated, with a 70.20% decrease in the number of patches in SSP245 and 77.25% reduction in SSP585 scenarios within the suitable habitats, resulting in a 98% decrease in patch size within its habitats. Apart from the drug diclofenac, vultures are also threatened by other factors such as habitat loss, food scarcity and electrocutions from power lines [101]. This trend of shrinking suitable habitats may push this critically endangered (CR) species to further decline. In future climate scenarios, it was observed that H. leucoryphus lost nearly 94–99% of its suitable habitats. The species showed a 77.05% decrease in the number of patches (NP) in SSP245 and 90.16% reduction in SSP585 climate scenarios, with a severe 99% reduction in patch size (Table 4). This species is primarily dependent on wetlands for prey, and it builds nests in tall trees near wetlands. The key threats to this species are habitat loss, degradation of wetlands, and over fishing [102]. Hence, this alarming trend of habitat loss is critical for this endangered (EN) species.
According to research and conservation priority index [35], F. severus, G. tenuirostris and H. leucoryphus are the three priority raptors for conservation, which all breed in northeastern India. However, the region has also faced about 60% forest cover loss within a span of the last twenty years (www.globalforestwatch.org/ accessed on 5 June 2025). In addition, studies have reported a declining trend in monsoon precipitation in Northeast India over the last few decades [103]. Such a trend might lead to the loss of wetlands, which are a primary source of prey for species like H. leucoryphus. Also, land use change is a multifaceted issue in Northeast India, influenced by many socio-economic and environmental factors. Rapid urbanization, shifting cultivations, monocultural plantations like tea and oil palm, etc., have led to a decline in the forest lands in the region [104,105]. Although vultures have been the most studied group of raptors in the region, F. severus and H. leucoryphus have received negligible research attention. Furthermore, there has been almost no research on the impact of climate change and habitat loss on these three raptors. As per the SoIB (2023) [44], there are insufficient data on the current annual trend and long-term trend in the population for F. severus in India. Also, for G. tenuirostris, there is inadequate data on its population trend. And the current trend in H. leucoryphus suggests a rapid decline in the population.
Across the Indian subcontinent, the dramatic decline in vultures has resulted in notable increases in mammalian scavenger populations, particularly rats (Rattus sp.) and feral dogs (Canis lupus familiaris) [106,107]. These species act as key reservoirs of pathogens responsible for diseases such as bubonic plague and rabies. Consequently, the public health costs associated with the loss of vultures’ regulating ecosystem services have been estimated to exceed USD 2 billion annually [107]. The decomposition of carcasses also enhances nutrient inputs into soils [108], with potential cascading effects on microbial communities, vegetation, and invertebrate assemblages. Moreover, both diurnal and nocturnal raptors, as avian predators, are considered pivotal in regulating rodent population dynamics [109,110]. Designating raptors as “flagship species” ensures that conserving their habitats benefits many, though not all, co-occurring species and ecosystems, thereby enhancing the cost-effectiveness of conservation investments and advancing global environmental objectives [111]. Shifting species distributions can generate novel assemblages that modify ecosystem processes, such as prey regulation and resource competition, with outcomes that remain difficult to anticipate due to the complexity of interacting variables [112]. Such changes in community structure are expected to disproportionately affect specialists [113,114] and species with narrow ranges, particularly those confined to polar or alpine environments where contractions are projected, for instance, the tundra biome, and may diminish by up to 34% [115]. Climate change is expected to have a severe impact on birds, and hence it is imperative to assess the effectiveness of conservation programs by comprehending the current and projected effect of the changing climate [116].
The areas of high suitability for F. severus in Assam are primarily in the BTR regions and Upper Assam areas. These regions need focused conservation actions such as enhancement of community-level forest protection programs at the forest–edge interface to reduce habitat alteration; the creation of buffer areas and green corridors connecting fragmented patches, especially between the BTR regions and adjacent foothill forests; and the use of pesticide is agricultural areas, which are used by raptors as foraging grounds, should be monitored and regulated. The key areas of distribution of G. tenuirostris mostly lie within the upper Assam and eastern Arunachal. Assam has a Vulture Breeding Centre, which plays a vital role in establishing a good reintroduced vulture population in the wild. The success of species reintroduction programs relies heavily on knowledge of their climatic and habitat requirements, which is particularly vital for the conservation of critically endangered vultures. The subsequent stage involves releasing captive-bred individuals into climatically stable, diclofenac-free areas or officially designated vulture safe zones. Therefore, identifying suitable climatic niches is fundamental to ensuring the effective reintroduction of vultures into the wild. Food source availability is one of the key drivers of vulture population. Supplementary feeding approaches such as “vulture restaurants” have been employed to sustain populations, signifying the importance of reliable food bases in vulture conservation. Research has shown that supplying uncontaminated food through vulture restaurants can help lower diclofenac-related mortality within vulture colonies [117]. Tracking data from tagged vultures revealed that the restaurant also influenced foraging behavior, leading to smaller home ranges, reduced flight time, and shorter daily travel distances once the predictable food source was available [117]. H. leucoryphus migrates to the Northeastern region in winter for breeding [118]. The conservation of forest areas near wetlands is important for their nesting. The water bodies in the Brahmaputra plains and the foothills of eastern Himalayas need to be conserved, as they act as prey resources for this species. To safeguard this migratory raptor, transboundary collaboration will play a key role. The different threats and conservation implications have been added in a tabular form (Table 5).

5. Limitations

This study is subject to several important limitations, primarily linked to the application of SDMs. These models generate predictive results that are highly dependent on the quality, completeness, and accuracy of the input data. Consequently, even small changes in input parameters may lead to slight variations in the results, while the overall distribution patterns and trends typically remain consistent. Additionally, the pseudo-absences were generated randomly across the study area which might influence the suitability estimates. The study used conventional k-fold cross-validations which might also inflate the model evaluation, when there is spatial clustering of occurrence data. Hence, future studies can apply block or spatial cross-validations approach is suggested to deal with spatially clustered occurrence data. While the raptors considered in this study have broad distributions across the Northeast region, confirmed occurrence records are largely concentrated within protected areas, where detections are more frequent, often facilitated by citizen science initiatives. Therefore, targeted large-scale surveys are recommended across the landscape to identify more areas of species presence. Furthermore, the study used current habitat data to project future environment suitability, given the high uncertainty surrounding future land cover dynamics. Consequently, the projections do not incorporate probable shifts in land use that may occur in the future. The distributional changes in species ranges observed in this study are therefore accredited only to climatic variables. Although this approach provides important insights into climate-driven range alterations, it may underrate or overlook the combined effects of land use change. Hence, future studies should try to integrate land cover projections alongside climatic variables to produce more comprehensive and ecologically realistic assessments. Furthermore, relying on a single GCM may not fully capture the variability among future climate projections. Therefore, future studies are recommended to incorporate multiple GCMs for each species to improve predictive accuracy and better identify potential areas of species presence. Thus, building on the foundation established by this study, such approaches can provide more detailed and robust insights for conservation planning.

6. Conclusions

All three species have a restricted distribution range within the eastern Himalayas and the northeast biogeographic region of India. Our findings highlight that climate change and topographical restraints could potentially diminish the suitable habitat ranges for the studied species. Hence, our study predicts the fate of these important bird species and their vulnerability to the inevitable climate change effect in the future. In Northeast India, priority needs to be given to protect the Eastern Himalaya foothill regions, which include important wetlands, lowland forests and contiguous habitats, and which provide refuge to different raptors. These species are already threatened by anthropogenic pressures and may be further vulnerable to environmental stress. Hence, the effects of changing climate on their limiting factors, such as nesting biology, habitat ecology, and food resources, etc., need long-term assessment for effective conservation actions. With more extreme weather conditions expected in the future, evaluation of species-specific traits such as food habits, nest type, breeding phenology, body size, etc., that are linked to species’ resistance to climate change, is highly important. Through this study, the need for revaluation of the status of these species and the inclusion of climate change and habitat fragmentation for conservation threat assessments is also emphasized.

Supplementary Materials

The following supporting information can be downloaded at: https://www.mdpi.com/article/10.3390/biology14101376/s1, Figure S1. Final set of variables retained for ensemble model approach after excluding highly correlated covariates. The figure illustrates the pairwise correlations (|r| < 0.8) among variables selected for Falco severus. The Pearson’s correlation coefficient is used as the primary measure. If either the Spearman or Kendall coefficient exceeds the Pearson value for a given pair, it is indicated with an “s” (Spearman) or “k” (Kendall) in the bottom-right corner of the corresponding cell. Figure S2. Final set of variables retained for ensemble model approach after excluding highly correlated covariates. The figure illustrates the pairwise correlations (|r| < 0.8) among variables selected for Gyps tenuirostris. The Pearson’s correlation coefficient is used as the primary measure. If either the Spearman or Kendall coefficient exceeds the Pearson value for a given pair, it is indicated with an “s” (Spearman) or “k” (Kendall) in the bottom-right corner of the corresponding cell. Figure S3. Final set of variables retained for ensemble model approach after excluding highly correlated covariates. The figure illustrates the pairwise correlations (|r| < 0.8) among variables selected for Haliaeetus leucoryphus. The Pearson’s correlation coefficient is used as the primary measure. If either the Spearman or Kendall coefficient exceeds the Pearson value for a given pair, it is indicated with an “s” (Spearman) or “k” (Kendall) in the bottom-right corner of the corresponding cell. Figure S4. The ROC plots and variable importance analyses for five SDM algorithms applied to Falco severus: (A) BRT, (B) GLM, (C) MARS, (D) MaxEnt, and (E) RF. The left panels present ROC curves indicating model performance for both training and cross-validation datasets, along with the corresponding AUC values. The right panels display the relative importance of environmental predictors as determined by each model. All graphs were generated using the SAHM (Software for Assisted Habitat Modeling) package integrated within the VisTrails platform and manually refined in Adobe Photoshop CS 8.0. Figure S5. The ROC plots and variable importance analyses for five SDM algorithms applied to Gyps tenuirostris: (A) BRT, (B) GLM, (C) MARS, (D) MaxEnt, and (E) RF. The left panels present ROC curves indicating model performance for both training and cross-validation datasets, along with the corresponding AUC values. The right panels display the relative importance of environmental predictors as determined by each model. All graphs were generated using the SAHM (Software for Assisted Habitat Modeling) package integrated within the VisTrails platform and manually refined in Adobe Photoshop CS 8.0. Figure S6. The ROC plots and variable importance analyses for five SDM algorithms applied to Haliaeetus leucoryphus: (A) BRT, (B) GLM, (C) MARS, (D) MaxEnt, and (E) RF. The left panels present ROC curves indicating model performance for both training and cross-validation datasets, along with the corresponding AUC values. The right panels display the relative importance of environmental predictors as determined by each model. All graphs were generated using the SAHM (Software for Assisted Habitat Modeling) package integrated within the VisTrails platform and manually refined in Adobe Photoshop CS 8.0. Table S1. This table lists all the initial variables considered in the study, along with their categories and data sources, prior to performing correlation analysis for variable selection. Table S2. The table shows the suitable area (in km2) within the study area for the three raptor species under present and future climatic scenarios.

Author Contributions

Conceptualization: P.M., I.A. and S.K.; methodology: P.M., I.A. and A.B.; software: I.A. and A.B.; validation: M.K.S., P.K.S., H.S. and S.K.; formal analysis: I.A. and S.K.; investigation: P.M., A.B. and M.K.S.; resources: P.M., M.K.S. and P.K.S.; data curation: P.M., A.B. and H.S.; writing—original draft: P.M., I.A. and S.K.; writing—review and editing: M.K.S., P.K.S. and H.S.; visualization: I.A., H.S. and S.K.; supervision: M.K.S. and P.K.S.; project administration: M.K.S. and P.K.S.; funding acquisition: M.K.S. and P.K.S. All authors have read and agreed to the published version of the manuscript.

Funding

The study was funded by National Mission on Himalayan Studies (NMHS) grant under Ministry of Environment, Forest and Climate Change (MoEF&CC), Government of India (Grant ID: NMHS/HF/2017-18/IF-13/01) to P.K.S. and M.K.S.

Institutional Review Board Statement

This research relies exclusively on primary field surveys by the authors and data obtained from the secondary resources. No animals were harmed, and their habitats were not disturbed in the wild. Therefore, this study does not require ethical approval.

Informed Consent Statement

Not applicable.

Data Availability Statement

The original contributions presented in this study are included in the article/Supplementary Material. Further inquiries can be directed to the corresponding author(s).

Acknowledgments

The authors thank the Animal Ecology and Wildlife Biology Lab, Department of Zoology, Gauhati University for lab facilities. The authors are grateful to the Head, Department of Zoology, Gauhati University for the institutional support. The author gratefully acknowledges the invaluable assistance provided by the forest field staff of the Assam Forest Department during the course of field surveys. Their expertise, logistical support, and commitment in facilitating access to field sites under often challenging conditions were critical to the successful execution of this research. The authors thank Wich’yanan Limparungpatthanakij and Nilutpal Mahanta for providing the photographs of the bird species.

Conflicts of Interest

On behalf of all co-authors, it is hereby confirmed that there are no conflicts of interest regarding the publication of this manuscript, and all co-authors have approved the final version of the manuscript.

References

  1. Halpern, B.S.; Frazier, M.; Afflerbach, J.C.; Lowndes, J.S.; Micheli, F.; O’Hara, C.C.; Scarborough, C.; Selkoe, K.A. Recent Pace of Change in Human Impact on the World’s Ocean. Sci. Rep. 2019, 9, 11609. [Google Scholar] [CrossRef] [PubMed]
  2. Martínez-Ruiz, M.; Dykstra, C.R.; Booms, T.L.; Henderson, M.T. Conservation Letter: Effects of Global Climate Change on Raptors. J. Raptor Res. 2023, 57, 92–105. [Google Scholar] [CrossRef]
  3. Singh, H.; Kumar, N.; Kumar, M.; Singh, R. Modelling Habitat Suitability of Western Tragopan (Tragopan melanocephalus) a Range-Restricted Vulnerable Bird Species of the Himalayan Region, in Response to Climate Change. Clim. Risk Manag. 2020, 29, 100241. [Google Scholar] [CrossRef]
  4. Zhao, Y.; Lu, S.; Hua, J.; Liu, Z.; Xu, J. Effect of Climate and Land-Use Changes on a Threatened Forest Resident Bird. Forests 2024, 15, 348. [Google Scholar] [CrossRef]
  5. Sergio, F.; Marchesi, L.; Pedrini, P.; Penteriani, V. Coexistence of a Generalist Owl with Its Intraguild Predator: Distance-Sensitive or Habitat-Mediated Avoidance? Anim. Behav. 2007, 74, 1607–1616. [Google Scholar] [CrossRef]
  6. Sergio, F.; Newton, I.A.N.; Marchesi, L.; Pedrini, P. Ecologically Justified Charisma: Preservation of Top Predators Delivers Biodiversity Conservation. J. Appl. Ecol. 2006, 43, 1049–1055. [Google Scholar] [CrossRef]
  7. Donázar, J.A.; Cortés-Avizanda, A.; Fargallo, J.A.; Margalida, A.; Moleón, M.; Morales-Reyes, Z.; Moreno-Opo, R.; Pérez-García, J.M.; Sánchez-Zapata, J.A.; Zuberogoitia, I.; et al. Roles of Raptors in a Changing World: From Flagships to Providers of Key Ecosystem Services. Ardeola 2016, 63, 181–234. [Google Scholar] [CrossRef]
  8. McClure, C.J.W.; Westrip, J.R.S.; Johnson, J.A.; Schulwitz, S.E.; Virani, M.Z.; Davies, R.; Symes, A.; Wheatley, H.; Thorstrom, R.; Amar, A.; et al. State of the World’s Raptors: Distributions, Threats, and Conservation Recommendations. Biol. Conserv. 2018, 227, 390–402. [Google Scholar] [CrossRef]
  9. Meserve, P.L.; Kelt, D.A.; Milstead, W.B.; Gutiérrez, J.R. Thirteen Years of Shifting Top-Down and Bottom-Up Control. BioScience 2003, 53, 633–646. [Google Scholar] [CrossRef]
  10. Schmidt, J.H.; McIntyre, C.L.; Roland, C.A.; MacCluskie, M.C.; Flamme, M.J. Bottom-Up Processes Drive Reproductive Success in an Apex Predator. Ecol. Evol. 2018, 8, 1833–1841. [Google Scholar] [CrossRef]
  11. Urban, M.C.; Zarnetske, P.L.; Skelly, D.K. Searching for biotic multipliers of climate change. Integr. Comp. Biol. 2017, 57, 134–147. [Google Scholar] [CrossRef] [PubMed]
  12. Thiollay, J.-M. Current Status and Conservation of Falconiformes in Tropical Asia. J. Raptor Res. 1998, 32, 5–15. [Google Scholar]
  13. Goriup, P.; Tucker, G. Assessment of the Merits of a CMS Instrument Covering Migratory Raptors in Africa and Eurasia; DEFRA: Bristol, UK, 2007. [Google Scholar]
  14. Iknayan, K.J.; Beissinger, S.R. Collapse of a Desert Bird Community over the Past Century Driven by Climate Change. Proc. Natl. Acad. Sci. USA 2018, 115, 10583–10588. [Google Scholar] [CrossRef]
  15. Dykstra, C.R.; Hays, J.L.; Simon, M.M.; Wegman, A.R.; Dykstra, L.R.; Williams, K.A. Habitat and Weather Conditions Influence Reproductive Rates of Suburban and Rural Red-Shouldered Hawks Buteo lineatus. Ibis 2021, 163, 623–640. [Google Scholar] [CrossRef]
  16. Reside, A.E.; VanDerWal, J.J.; Kutt, A.S.; Perkins, G.C. Weather, Not Climate, Defines Distributions of Vagile Bird Species. PLoS ONE 2010, 5, e13569. [Google Scholar] [CrossRef]
  17. Curley, S.R.; Manne, L.L.; Veit, R.R. Differential Winter and Breeding Range Shifts: Implications for Avian Migration Distances. Divers. Distrib. 2020, 26, 415–425. [Google Scholar] [CrossRef]
  18. Gilman, S.E.; Urban, M.C.; Tewksbury, J.; Gilchrist, G.W.; Holt, R.D. A framework for community interactions under climate change. Trends Ecol. Evol. 2010, 25, 325–331. [Google Scholar] [CrossRef]
  19. Bradley, M.J.; Kutz, S.J.; Jenkins, E.; O’Hara, T.M. The Potential Impact of Climate Change on Infectious Diseases of Arctic Fauna. Int. J. Circumpolar Health 2005, 64, 468–477. [Google Scholar] [CrossRef]
  20. Merino, S.; Møller, A.P. Host-Parasite Interactions and Climate Change. In Effects of Climate Change on Birds; Møller, A.P., Fiedler, W., Berthold, P., Eds.; Cambridge University Press: Cambridge, UK, 2010; pp. 213–226. [Google Scholar]
  21. Dudek, B.M.; Henderson, M.T.; Hudon, S.F.; Hayden, E.J.; Heath, J.A. Haematophagous ectoparasites lower survival of and have detrimental physiological effects on golden eagle nestlings. Conserv. Physiol. 2021, 9, coab060. [Google Scholar] [CrossRef] [PubMed]
  22. Terraube, J.; Villers, A.; Ruffino, L.; Iso-Iivari, L.; Henttonen, H.; Oksanen, T.; Korpimäki, E. Coping with Fast Climate Change in Northern Ecosystems: Mechanisms Underlying the Population-Level Response of a Specialist Avian Predator. Ecography 2015, 38, 690–699. [Google Scholar] [CrossRef]
  23. Rosenfield, R.N.; Hardin, M.G.; Bielefeldt, J.; Keyel, E.R. Are Life History Events of a Northern Breeding Population of Cooper’s Hawks Influenced by Changing Climate? Ecol. Evol. 2017, 7, 399–408. [Google Scholar] [CrossRef]
  24. Dunn, P.O. Changes in timing of breeding and reproductive success in birds. In Effects of Climate Change on Birds, 2nd ed.; Dunn, P.O., Møller, A.P., Eds.; Oxford University Press: Oxford, UK, 2019; pp. 108–119. [Google Scholar]
  25. Callery, K.R.; Smallwood, J.A.; Hunt, A.R.; Snyder, E.R.; Heath, J.A. Seasonal Trends in Adult Apparent Survival and Reproductive Trade-Offs Reveal Potential Constraints to Earlier Nesting in a Migratory Bird. Oecologia 2022, 199, 91–102. [Google Scholar] [CrossRef]
  26. Curk, T.; Pokrovsky, I.; Lecomte, N.; Aarvak, T.; Brinker, D.F.; Burnham, K.; Dietz, A.; Dixon, A.; Franke, A.; Gauthier, G.; et al. Arctic Avian Predators Synchronise Their Spring Migration with the Northern Progression of Snowmelt. Sci. Rep. 2020, 10, 7220. [Google Scholar] [CrossRef]
  27. Condro, A.A.; Higuchi, H.; Mulyani, Y.A.; Raffiudin, R.; Rusniarsyah, L.; Setiawan, Y.; Prasetyo, L.B. Climate change leads to range contraction for Japanese population of the Oriental Honey-Buzzards: Implications for future conservation strategies. Glob. Ecol. Conserv. 2022, 34, e02044. [Google Scholar] [CrossRef]
  28. Morrison, J.L.; Baird, J.M. Using banding and encounter data to investigate movements of Red-tailed Hawks in the Northeast. J. Raptor Res. 2016, 50, 161–175. [Google Scholar] [CrossRef]
  29. Powers, B.F.; Winiarski, J.M.; Requena-Mullor, J.M.; Heath, J.A. Intra-Specific Variation in Migration Phenology of American Kestrels (Falco sparverius) in Response to Spring Temperatures. Ibis 2021, 163, 1448–1456. [Google Scholar] [CrossRef]
  30. Duerr, A.E.; Miller, T.A.; Lanzone, M.; Brandes, D.; Cooper, J.; O’Malley, K.; Maisonneuve, C.; Tremblay, J.A.; Katzner, T. Flight Response of Slope-Soaring Birds to Seasonal Variation in Thermal Generation. Funct. Ecol. 2015, 29, 779–790. [Google Scholar] [CrossRef]
  31. Mallon, J.M.; Bildstein, K.L.; Fagan, W.F. Inclement Weather Forces Stopovers and Prevents Migratory Progress for Obligate Soaring Migrants. Mov. Ecol. 2021, 9, 35. [Google Scholar] [CrossRef]
  32. Wichmann, M.C.; Jeltsch, F.; Dean, W.R.J.; Moloney, K.A.; Wissel, C. Implication of Climate Change for the Persistence of Raptors in Arid Savanna. Oikos 2003, 102, 186–202. [Google Scholar] [CrossRef]
  33. Monadjem, A.; Virani, M.Z.; Jackson, C.; Reside, A. Rapid Decline and Shift in the Future Distribution Predicted for the Endangered Sokoke Scops Owl Otus ireneae due to Climate Change. Bird Conserv. Int. 2013, 23, 247–258. [Google Scholar] [CrossRef]
  34. Lynch, J.F. Effects of Hurricane Gilbert on Birds in a Dry Tropical Forest in the Yucatan Peninsula. Biotropica 1991, 23, 488–496. [Google Scholar] [CrossRef]
  35. Mahananda, P.; Jelil, S.N.; Saikia, M.K. Raptor Research in India: Inadequate Data and Species’ Status Uncertainty for Many Species. J. Raptor Res. 2022, 56, 201–211. [Google Scholar] [CrossRef]
  36. Clark, W.S.; Boesman, P.F.D.; Marks, J.S. Oriental Hobby (Falco severus), Version 1.0. In Birds of the World; del Hoyo, J., Elliott, A., Sargatal, J., Christie, D.A., de Juana, E., Eds.; Cornell Lab of Ornithology: Ithaca, NY, USA, 2020. [Google Scholar]
  37. Owen, R.P. New Bird Records for Micronesia and Major Island Groups in Micronesia. Micronesica 1977, 13, 57–63. [Google Scholar]
  38. Rasmussen, P.C.; Anderton, J.C. Birds of South Asia: The Ripley Guide: Attributes and Status, 2nd ed.; Smithsonian Institution: Washington, DC, USA; Lynx Edicions: Barcelona, Spain, 2005. [Google Scholar]
  39. BirdLife International. Species Factsheet: Pallas’s Fish-Eagle Haliaeetus leucoryphus. Available online: https://datazone.birdlife.org/species/factsheet/pallass-fish-eagle-haliaeetus-leucoryphus (accessed on 8 August 2025).
  40. Green, R.E.; Newton, I.A.N.; Shultz, S.; Cunningham, A.A.; Gilbert, M.; Pain, D.J.; Prakash, V. Diclofenac Poisoning as a Cause of Vulture Population Declines across the Indian Subcontinent. J. Appl. Ecol. 2004, 41, 793–800. [Google Scholar] [CrossRef]
  41. IUCN. The IUCN Red List of Threatened Species, Version 2024-2. Available online: https://www.iucnredlist.org (accessed on 10 June 2025).
  42. Chauhan, H.K.; Gallacher, D.; Bhatt, A.; Bisht, A.K. The Himalayas: A Climate Change Laboratory. Environ. Dev. 2023, 45, 100814. [Google Scholar] [CrossRef]
  43. Naoroji, R. Birds of Prey of the Indian Subcontinent; Christopher Helm, A&C Black Publishers Ltd.: London, UK, 2006. [Google Scholar]
  44. SOIB. State of India’s Birds: Range, Trends, and Conservation Status; The SoIB Partnership: Bengaluru, India, 2023; p. 119. [Google Scholar] [CrossRef]
  45. Chettri, N.; Rastogi, A.; Singh, O. Assessment of raptor migration and status along the Tsangpo-Brahmaputra corridor (India) by a local communities participatory survey. Avocetta-Parma 2006, 30, 61. [Google Scholar]
  46. Juhant, M.A.; Bildstein, K.L. Raptor migration across and around the Himalayas. In Bird Migration Across the Himalayas: Wetland Functioning amidst Mountains and Glaciers; Cambridge University Press: Cambridge, UK, 2017; Volume 6, pp. 98–116. [Google Scholar]
  47. Banerjee, S.; Niyogi, R.; Sarkar, M.S.; John, R. Assessing the vulnerability of protected areas in the eastern Himalayas based on their biological, anthropogenic, and environmental aspects. Trees For. People 2022, 8, 100228. [Google Scholar] [CrossRef]
  48. Casajus, N.; Périé, C.; Logan, T.; Lambert, M.-C.; de Blois, S.; Berteaux, D. An Objective Approach to Select Climate Scenarios When Projecting Species Distribution Under Climate Change. PLoS ONE 2016, 11, e0152495. [Google Scholar] [CrossRef] [PubMed]
  49. Schuetz, J.G.; Langham, G.M.; Soykan, C.U.; Wilsey, C.B.; Auer, T.; Sanchez, C.C. Making Spatial Prioritizations Robust to Climate Change Uncertainties: A Case Study with North American Birds. Ecol. Appl. 2015, 25, 1819–1831. [Google Scholar] [CrossRef]
  50. Morley, J.W.; Selden, R.L.; Latour, R.J.; Frölicher, T.L.; Seagraves, R.J.; Pinsky, M.L. Projecting Shifts in Thermal Habitat for 686 Species on the North American Continental Shelf. PLoS ONE 2018, 13, e0196127. [Google Scholar] [CrossRef] [PubMed]
  51. Butet, A.; Rantier, Y.; Bergerot, B. Land Use Changes and Raptor Population Trends: A Twelve-Year Monitoring of Two Common Species in Agricultural Landscapes of Western France. Glob. Ecol. Conserv. 2022, 34, e02027. [Google Scholar] [CrossRef]
  52. Shaw, P.; Ogada, D.; Dunn, L.; Buij, R.; Amar, A.; Garbett, R.; Herremans, M.; Virani, M.Z.; Kendall, C.J.; Croes, B.M.; et al. African Savanna Raptors Show Evidence of Widespread Population Collapse and a Growing Dependence on Protected Areas. Nat. Ecol. Evol. 2024, 8, 45–56. [Google Scholar] [CrossRef] [PubMed]
  53. Arumugam, R.; Guichard, F.; Lutscher, F. Persistence and Extinction Dynamics Driven by the Rate of Environmental Change in a Predator–Prey Metacommunity. Theor. Ecol. 2020, 13, 629–643. [Google Scholar] [CrossRef]
  54. Mittermeier, R.A.; Gil, P.R.; Hoffman, M.; Pilgrim, J.; Brooks, T.; Mittermeier, C.G.; Lamoreux, J.; da Fonseca, G.A.B. Hotspots Revisited: Earth’s Biologically Richest and Most Endangered Terrestrial Ecoregions; CEMEX: Mexico City, Mexico, 2005. [Google Scholar]
  55. Olson, D.M.; Dinerstein, E. The Global 200: Priority Ecoregions for Global Conservation. Ann. Mo. Bot. Gard. 2002, 89, 199–224. [Google Scholar] [CrossRef]
  56. Pawar, S.S.; Birand, A.C.; Ahmed, M.F.; Sengupta, S.; Raman, T.R.S. Conservation Biogeography in North-East India: Hierarchical Analysis of Cross-Taxon Distributional Congruence. Divers. Distrib. 2007, 13, 53–65. [Google Scholar] [CrossRef]
  57. Mani, M.S. Ecology and Biogeography in India; Springer Science & Business Media: Dordrecht, The Netherlands, 2012. [Google Scholar]
  58. Bachman, S.; Moat, J.; Hill, A.W.; de la Torre, J.; Scott, B. Supporting Red List Threat Assessments with GeoCAT: Geospatial Conservation Assessment Tool. ZooKeys 2011, 150, 117–126. [Google Scholar] [CrossRef] [PubMed]
  59. GBIF.org. GBIF Occurrence Download: Falco severus. 2025. Available online: https://doi.org/10.15468/dl.pfc2ej (accessed on 23 September 2025).
  60. GBIF.org. GBIF Occurrence Download. 2025. Available online: https://doi.org/10.15468/dl.duqyk2 (accessed on 23 September 2025).
  61. GBIF.org. GBIF Occurrence Download: Haliaeetus leucoryphus. 2025. Available online: https://doi.org/10.15468/dl.pttttq (accessed on 23 September 2025).
  62. Brown, J.L.; Bennett, J.R.; French, C.M. SDMtoolbox 2.0: The Next Generation Python-Based GIS Toolkit for Landscape Genetic, Biogeographic and Species Distribution Model Analyses. PeerJ 2017, 5, e4095. [Google Scholar] [CrossRef] [PubMed]
  63. Abedin, I.; Mukherjee, T.; Kim, A.R.; Kim, H.-W.; Kang, H.-E.; Kundu, S. Distribution Model Reveals Rapid Decline in Habitat Extent for Endangered Hispid Hare: Implications for Wildlife Management and Conservation Planning in Future Climate Change Scenarios. Biology 2024, 13, 198. [Google Scholar] [CrossRef]
  64. Fick, S.E.; Hijmans, R.J. WorldClim 2: New 1-km Spatial Resolution Climate Surfaces for Global Land Areas. Int. J. Climatol. 2017, 37, 4302–4315. [Google Scholar] [CrossRef]
  65. Hijmans, R.J.; Cruz, M.; Rojas, E.; Guarino, L. DIVA-GIS, Version 1.4. A Geographic Information System for the Management and Analysis of Genetic Resources Data. Plant Genet. Resour. Newsl. 2001, 127, 15–19. [Google Scholar]
  66. Morisette, J.T.; Jarnevich, C.S.; Holcombe, T.R.; Talbert, C.B.; Ignizio, D.; Talbert, M.K.; Silva, C.; Koop, D.; Swanson, A.; Young, N.E. VisTrails SAHM: Visualization and Workflow Management for Species Habitat Modeling. Ecography 2013, 36, 129–135. [Google Scholar] [CrossRef]
  67. O’Neill, B.C.; Kriegler, E.; Riahi, K.; Ebi, K.L.; Hallegatte, S.; Carter, T.R.; Mathur, R.; van Vuuren, D.P. A New Scenario Framework for Climate Change Research: The Concept of Shared Socioeconomic Pathways. Clim. Change 2014, 122, 387–400. [Google Scholar] [CrossRef]
  68. Riahi, K.; Van Vuuren, D.P.; Kriegler, E.; Edmonds, J.; O’neill, B.C.; Fujimori, S.; Bauer, N.; Calvin, K.; Dellink, R.; Fricko, O.; et al. The Shared Socioeconomic Pathways and Their Energy, Land Use, and Greenhouse Gas Emissions Implications: An Overview. Glob. Environ. Change 2017, 42, 153–168. [Google Scholar] [CrossRef]
  69. Andrews, M.B.; Ridley, J.K.; Wood, R.A.; Andrews, T.; Blockley, E.W.; Booth, B.; Burke, E.; Dittus, A.J.; Florek, P.; Gray, L.J.; et al. Historical Simulations with HadGEM3-GC3.1 for CMIP6. J. Adv. Model. Earth Syst. 2020, 12, e2019MS001995. [Google Scholar] [CrossRef]
  70. Desmet, Q.; Ngo-Duc, T. A Novel Method for Ranking CMIP6 Global Climate Models over the Southeast Asian Region. Int. J. Climatol. 2022, 42, 97–117. [Google Scholar] [CrossRef]
  71. Norgate, M.; Tiwari, P.R.; Das, S.; Kumar, D. On the Heat Waves over India and Their Future Projections under Different SSP Scenarios from CMIP6 Models. Int. J. Climatol. 2024, 44, 973–995. [Google Scholar] [CrossRef]
  72. Bhuyan, A.; Hazarika, S.; Baidya, S.; Sarma, K.; Thakur, B.; Prakash, A.; Devi, A. Assessing Current and Future Potential Habitat of Vatica lanceaefolia (Roxb.) Blume, a Critically Endangered Tree Species of Northeastern India. Theor. Appl. Climatol. 2025, 156, 1–13. [Google Scholar] [CrossRef]
  73. Elith, J.; Leathwick, J.R. Species Distribution Models: Ecological Explanation and Prediction across Space and Time. Annu. Rev. Ecol. Evol. Syst. 2009, 40, 677–697. [Google Scholar] [CrossRef]
  74. Hao, T.; Elith, J.; Lahoz-Monfort, J.J.; Guillera-Arroita, G. Testing Whether Ensemble Modelling Is Advantageous for Maximising Predictive Performance of Species Distribution Models. Ecography 2020, 43, 549–558. [Google Scholar] [CrossRef]
  75. Talbert, C.B.; Talbert, M.K. User Manual for SAHM Package for VisTrails; U.S. Geological Survey: Reston, VA, USA, 2012.
  76. Salas, E.A.L.; Valdez, R.; Michel, S.; Boykin, K.G. Habitat Assessment of Marco Polo Sheep (Ovis ammon polii) in Eastern Tajikistan: Modeling the Effects of Climate Change. Ecol. Evol. 2018, 8, 5124–5138. [Google Scholar] [CrossRef] [PubMed]
  77. Lavazza, L.; Morasca, S.; Rotoloni, G. On the Reliability of the Area under the ROC Curve in Empirical Software Engineering. In Proceedings of the 27th International Conference on Evaluation and Assessment in Software Engineering, Oulu, Finland, 19–21 June 2023; Association for Computing Machinery: New York, NY, USA, 2023; pp. 93–100. [Google Scholar] [CrossRef]
  78. Phillips, S.J.; Elith, J. POC Plots: Calibrating Species Distribution Models with Presence-Only Data. Ecology 2010, 91, 2476–2484. [Google Scholar] [CrossRef]
  79. Jiménez-Valverde, A.; Acevedo, P.; Barbosa, A.M.; Lobo, J.M.; Real, R. Discrimination Capacity in Species Distribution Models Depends on the Representativeness of the Environmental Domain. Glob. Ecol. Biogeogr. 2013, 22, 508–516. [Google Scholar] [CrossRef]
  80. McGarigal, K. FRAGSTATS: Spatial Pattern Analysis Program for Quantifying Landscape Structure; USDA Forest Service, General Technical Report PNW-GTR-351; U.S. Department of Agriculture, Forest Service, Pacific Northwest Research Station: Portland, OR, USA, 1995; p. 122.
  81. Brown, J.L.; Collopy, M.W.; Smallwood, J.A. Habitat Fragmentation Reduces Occupancy of Nest Boxes by an Open-Country Raptor. Bird Conserv. Int. 2014, 24, 364–378. [Google Scholar] [CrossRef]
  82. Wang, X.; Blanchet, F.G.; Koper, N. Measuring Habitat Fragmentation: An Evaluation of Landscape Pattern Metrics. Methods Ecol. Evol. 2014, 5, 634–646. [Google Scholar] [CrossRef]
  83. Midha, N.; Mathur, P.K. Assessment of Forest Fragmentation in the Conservation Priority Dudhwa Landscape, India Using FRAGSTATS Computed Class Level Metrics. J. Indian Soc. Remote Sens. 2010, 38, 487–500. [Google Scholar] [CrossRef]
  84. Gülçin, D.; Yılmaz, T. Evaluation of Forest Fragmentation with Particular Reference to Landscape-Based Ecological Assessment and Wildlife Conservation. Turk. J. For. 2020, 21, 84–93. [Google Scholar] [CrossRef]
  85. Barwicka, S.; Milecka, M. The Use of Selected Landscape Metrics to Evaluate the Transformation of the Rural Landscape as a Result of the Development of the Mining Function—A Case Study of the Puchaczów Commune. Sustainability 2021, 13, 12279. [Google Scholar] [CrossRef]
  86. Biju, T.; Kimsing, A.T.; Ngukir, J.; Saurav, G.K.; Mize, D. Habitat Suitability and Distribution Range Modelling for Slender-Billed Vulture G. tenuirostris in Arunachal Pradesh, North East India Using MaxEnt. Curr. Sci. 2024, 127, 1093–1099. [Google Scholar] [CrossRef]
  87. Bellocq, M.I.; Gómez-Insausti, R. Raptorial Birds and Environmental Gradients in the Southern Neotropics: A Test of Species-Richness Hypotheses. Austral Ecol. 2005, 30, 892–898. [Google Scholar] [CrossRef]
  88. Jankowiak, L.; Polakowski, M.; Kułakowski, T.; Świętochowski, P.; Tumiel, T.; Broniszewska, M.; Takács, V. Habitat and Weather Requirements of Diurnal Raptors Wintering in River Valleys. Biologia 2015, 70, 1136–1142. [Google Scholar] [CrossRef]
  89. Amato, M.; Ossino, A.; Angelini, J.; Brunelli, M.; De Lisio, L.; De Rosa, D.; Andreotti, A.; Leonardi, G. Effects of Rainfall and Temperature on Timing and Breeding Performances of a Threatened Large Falcon: Case Study of the Lanner Falcon (Falco biarmicus feldeggii) in Italy. Biologia 2021, 76, 3751–3760. [Google Scholar] [CrossRef]
  90. Jha, R.; Jha, K.K. Environmental Factors Shaping Habitat Suitability of Gyps Vultures: Climate Change Impact Modelling for Conservation in India. Ornithol. Res. 2023, 31, 119–140. [Google Scholar] [CrossRef]
  91. Mcdonald, P.G.; Olsen, P.D.; Cockburn, A. Weather dictates reproductive success and survival in the Australian brown falcon Falco berigora. J. Anim. Ecol. 2004, 73, 683–692. [Google Scholar]
  92. Sharikov, A.V.; Volkov, S.V.; Sviridova, T.V.; Buslakov, V.V. Cumulative effect of trophic and weather–climatic factors on the population dynamics of the vole-eating birds of prey in their breeding habitats. Biol. Bull. 2019, 46, 1097–1107. [Google Scholar] [CrossRef]
  93. Anctil, A.; Franke, A.; Bety, J. Heavy rainfall increases nestling mortality of an arctic top predator: Experimental evidence and long-term trend in peregrine falcons. Oecologia 2014, 174, 1033–1043. [Google Scholar] [CrossRef] [PubMed]
  94. Ngila, P.M.; Chiawo, D.O.; Owuor, M.A.; Wasonga, V.O.; Mugo, J.W. Mapping Suitable Habitats for Globally Endangered Raptors in Kenya: Integrating Climate Factors and Conservation Planning. Ecol. Evol. 2023, 13, e10443. [Google Scholar] [CrossRef]
  95. Kumar, S.; Sohil, A.; Kichloo, M.A.; Sharma, N. Landscape heterogeneity affects diurnal raptor communities in a sub-tropical region of northwestern Himalayas, India. PLoS ONE 2022, 17, e0246555. [Google Scholar] [CrossRef]
  96. Nayeri, D.; Cushman, S.; Ganey, J.; Hysen, L.; Gunther, M.S.; Willey, D.; Wan, H.Y. Multiscale habitat suitability modeling for a threatened raptor offers insight into ecological model transferability. Ecol. Model. 2024, 496, 110845. [Google Scholar] [CrossRef]
  97. Monteagudo, N.; Rebollo, S.; Pérez-Camacho, L.; Martínez-Hesterkamp, S.; Fernández-Pereira, J.M.; Pataro, L.; Rey-Benayas, J.M. Relative importance of vegetation features and intra- and inter-specific interactions on habitat preferences of a raptor guild in eucalypt plantations. For. Ecol. Manag. 2024, 554, 121656. [Google Scholar] [CrossRef]
  98. Koufaki, T.; Barboutis, C.; Theodorou, K. Differential impact of climate and land use change on habitat suitability of migrant passerines according to habitat preferences. Anthropocene 2024, 47, 100447. [Google Scholar] [CrossRef]
  99. Sutton, L.J.; Anderson, D.L.; Franco, M.; McClure, C.J.; Miranda, E.B.; Vargas, F.H.; Vargas González, J.D.J.; Puschendorf, R. Reduced Range Size and Important Bird and Biodiversity Area Coverage for the Harpy Eagle (Harpia harpyja) Predicted from Multiple Climate Change Scenarios. Ibis 2022, 164, 649–666. [Google Scholar] [CrossRef]
  100. Pearce-Higgins, J.W.; Green, R.E. Birds and Climate Change: Impacts and Conservation Responses; Cambridge University Press: Cambridge, UK, 2014. [Google Scholar]
  101. Jaffré, M.; Beaugrand, G.; Goberville, É.; Jiguet, F.; Kjellén, N.; Troost, G.; Dubois, P.J.; Leprêtre, A.; Luczak, C. Long-Term Phenological Shifts in Raptor Migration and Climate. PLoS ONE 2013, 8, e79112. [Google Scholar] [CrossRef]
  102. Sourav, S.H.; Ahmed, B.; Thompson, P. Pallas’s fish eagle Haliaeetus leucoryphus in Bangladesh. Birding ASIA 2011, 16, 101–105. [Google Scholar]
  103. Choudhury, B.A.; Saha, S.K.; Konwar, M.; Sujith, K.; Deshamukhya, A. Rapid drying of Northeast India in the last three decades: Climate change or natural variability? J. Geophys. Res. Atmos. 2019, 124, 227–237. [Google Scholar] [CrossRef]
  104. Ahirwal, J.; Thangjam, U.; Sahoo, U.K. Land use change and its impacts on soil carbon dynamics in Mizoram, Northeast India. In Soil Carbon Dynamics in Indian Himalayan Region; Springer: Singapore, 2023; pp. 217–234. [Google Scholar] [CrossRef]
  105. Lalthakimi, C.; Singh, N.S.; Vanlalfakawma, D.C.; Upadhyay, K.K.; Tripathi, S.K. Land use change effects on soil physical and biochemical properties during wet and dry season in forest and shifting cultivation (jhum) sites in Northeast India. Environ. Ecol. 2023, 41, 2584–2594. [Google Scholar] [CrossRef]
  106. Pain, D.J.; Cunningham, A.A.; Donald, P.F.; Duckworth, J.W.; Houston, D.C.; Katzner, T.; Parry-Jones, J.; Poole, C.; Prakash, V.; Round, P.; et al. Causes and effects of temporal and spatial declines of Gyps vultures in Asia. Conserv. Biol. 2003, 17, 661–671. [Google Scholar] [CrossRef]
  107. Markandya, A.; Taylor, T.; Longo, A.; Murty, M.N.; Murty, S.; Dhavala, K. Counting the cost of vulture decline—An appraisal of the human health and other benefits of vultures in India. Ecol. Econ. 2008, 67, 194–204. [Google Scholar] [CrossRef]
  108. Melis, C.; Selva, N.; Teurlings, I.; Skarpe, C.; Linnell, J.D.C.; Andersen, R. Soil and vegetation nutrient response to bison carcasses in Białowieza Primeval Forest, Poland. Ecol. Res. 2007, 22, 807–813. [Google Scholar] [CrossRef]
  109. Fargallo, J.A.; Martínez-Padilla, J.; Viñuela, J.; Blanco, G.; Torre, I.; Vergara, P.; De Neve, L. Kestrel–prey dynamic in a Mediterranean region: The effect of generalist predation and climatic factors. PLoS ONE 2009, 4, e4311. [Google Scholar] [CrossRef] [PubMed]
  110. Millon, A.S.; Petty, J.; Little, B.; Giménez, O.; Cornulier, T.; Lambin, X. Dampening prey cycle overrides the impact of climate change on predator population dynamics: A long-term demographic study on tawny owls. Glob. Change Biol. 2014, 20, 1770–1781. [Google Scholar] [CrossRef]
  111. Sergio, F.; Newton, I.; Marchesi, L. Top predators and biodiversity: Much debate, few data. J. Appl. Ecol. 2008, 45, 992–999. [Google Scholar] [CrossRef]
  112. Parejo, D. Informational mismatches: A neglected threat of climate change to interspecific interactions. Front. Ecol. Evol. 2016, 4, 31. [Google Scholar] [CrossRef]
  113. Hof, A.R.; Jansson, R.; Nilsson, C. Future climate change will favour non-specialist mammals in the (sub)Arctics. PLoS ONE 2012, 7, e52574. [Google Scholar] [CrossRef] [PubMed]
  114. Lurgi, M.; López, B.C.; Montoya, J.M. Novel communities from climate change. Philos. Trans. R. Soc. B Biol. Sci. 2012, 367, 2913–2922. [Google Scholar] [CrossRef]
  115. Boonman, C.C.F.; Huijbregts, M.A.J.; Benítez-López, A.; Schipper, A.M.; Thuiller, W.; Santini, L. Trait-based projections of climate change effects on global biome distributions. Divers. Distrib. 2022, 28, 25–37. [Google Scholar] [CrossRef]
  116. Abedin, I.; Mukherjee, T.; Singha, H.; Go, Y.; Kang, H.E.; Kim, H.W.; Kundu, S. Predicting Climate-Driven Habitat Dynamics of Adjutants for Implementing Strategic Conservation Measures in South and Southeast Asian Landscape. Sci. Rep. 2025, 15, 5986. [Google Scholar] [CrossRef] [PubMed]
  117. Gilbert, M.; Watson, R.T.; Ahmed, S.; Asim, M.; Johnson, J.A. Vulture restaurants and their role in reducing diclofenac exposure in Asian vultures. Bird Conserv. Int. 2007, 17, 63–77. [Google Scholar] [CrossRef]
  118. Davaasuren, B.; Boesman, P.F.D.; Hansasuta, C.; Pyle, P. Pallas’s Fish-Eagle (Haliaeetus leucoryphus), version 2.0. In Birds of the World; Billerman, S.M., Ed.; Cornell Lab of Ornithology: Ithaca, NY, USA, 2025. [Google Scholar] [CrossRef]
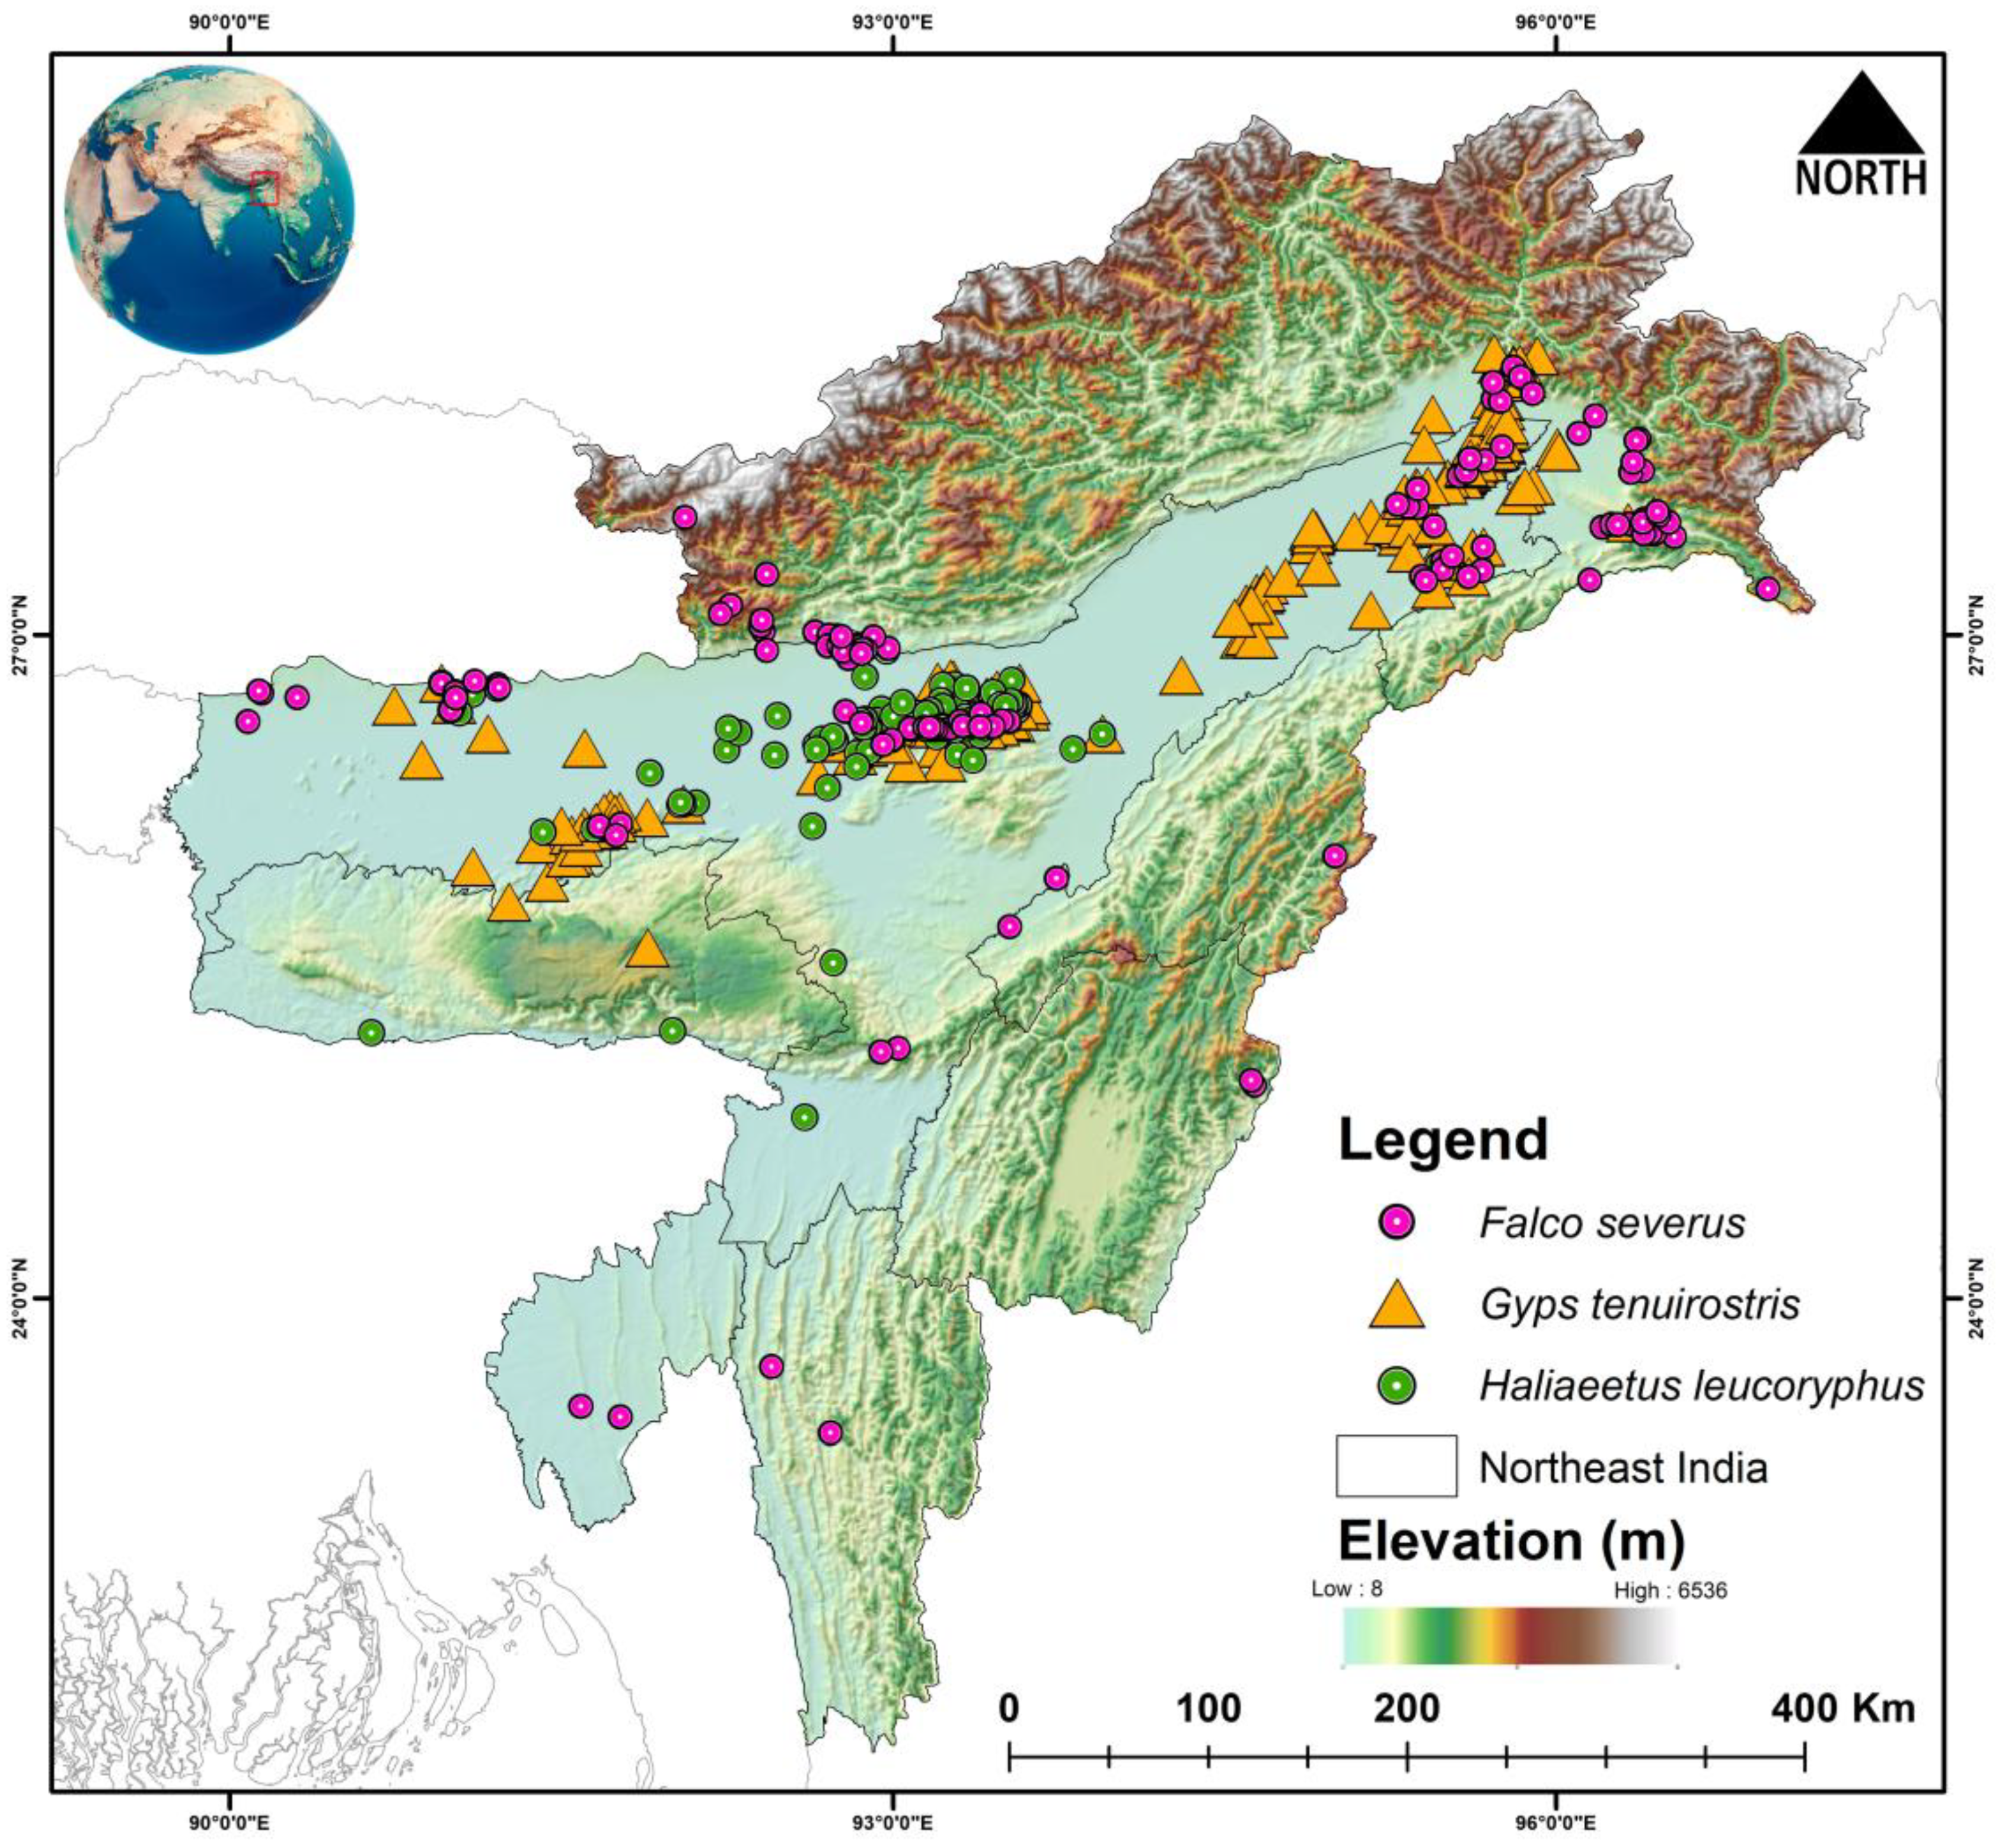
Figure 1. Location occurrences of three raptor species, i.e., Falco severus, Gyps tenuirostris, and Haliaeetus leucoryphus within the study area (Northeast India), compiled from primary field surveys and secondary sources. The map was created in ArcGIS v10.6, and the inset globe was manually edited in Adobe Photoshop CC.
Biology 14 01376 g001
Figure 2. Habitat suitability of Falco severus in Northeast India under the present scenario. The scale (0–5) represents the level of ensemble model agreement, where ‘0’ indicates no model agreement for a pixel and ‘5’ indicates full agreement across all models, denoting habitat suitability. The inset photograph of the species was taken by the first author (P.M.).
Biology 14 01376 g002
Figure 3. Habitat suitability of Gyps tenuirostris in Northeast India under the present scenario. The scale (0–5) represents the level of ensemble model agreement, where ‘0’ indicates no model agreement for a pixel and ‘5’ indicates full agreement across all models, denoting habitat suitability. The inset photograph of the species was taken by the Nilutpal Mahanta.
Biology 14 01376 g003
Figure 4. Habitat suitability of Haliaeetus leucoryphus in Northeast India under the present scenario. The scale (0–5) represents the level of ensemble model agreement, where ‘0’ indicates no model agreement for a pixel and ‘5’ indicates full agreement across all models, denoting habitat suitability. The inset photograph of the species was taken by Nilutpal Mahanta.
Biology 14 01376 g004
Figure 5. Bar chart showing the habitat suitability (in km2) of three raptor species, Falco severus, Gyps tenuirostris, and Haliaeetus leucoryphus, within the study area (Northeast India) under present and future climatic scenarios. Inset photographs are credited to Wich’yanan Limparungpatthanakij (Falco severus) and Nilutpal Mahanta (Gyps tenuirostris and Haliaeetus leucoryphus).
Biology 14 01376 g005
Figure 6. Habitat suitability of Falco severus in Northeast India under future climatic scenarios SSP245 and SSP585 for two time periods: 2041―2060 and 2061―2080. The scale (0―5) indicates ensemble model agreement, where ‘0’ denotes no model agreement for a pixel and ‘5’ denotes full agreement across all models, indicating high habitat suitability.
Biology 14 01376 g006
Figure 7. Habitat suitability of Gyps tenuirostris in Northeast India under future climatic scenarios SSP245 and SSP585 for two time periods: 2041―2060 and 2061―2080. The scale (0―5) indicates ensemble model agreement, where ‘0’ denotes no model agreement for a pixel and ‘5’ denotes full agreement across all models, indicating high habitat suitability.
Biology 14 01376 g007
Figure 8. Habitat suitability of Haliaeetus leucoryphus in Northeast India under future climatic scenarios SSP245 and SSP585 for two time periods: 2041―2060 and 2061―2080. The scale (0―5) indicates ensemble model agreement, where ‘0’ denotes no model agreement for a pixel and ‘5’ denotes full agreement across all models, indicating high habitat suitability.
Biology 14 01376 g008
Table 1. Model fit metrics for the used models and for the ensemble model of habitat suitability evaluation of the three raptors. The five modeling algorithms are: Boosted Regression Tree (BRT), Generalized Linear Model (GLM), Multivariate Adaptive Regression Splines (MARS), Maximum Entropy (MaxEnt), and Random Forest (RF). AUC: Area under Curve, ΔAUC: Change in Area under Curve (Training–Cross Validation), PCC: Proportion Correctly Classified, TSS: True Skill Statistic.
SpeciesModelDatasetAUCΔAUCPCCTSSKappaSpecificitySensitivity
Falco severusBRTTrain0.9210.05385.5000.8520.8600.7110.709
CV0.86880.0000.8450.7470.5920.593
GLMTrain0.9510.12288.1000.8830.8790.7610.760
CV0.82976.5000.7760.7500.5260.525
MARSTrain0.9100.06683.0000.8280.8320.6600.658
CV0.84479.6000.8190.7690.5880.588
MaxEntTrain0.9340.06287.6000.8740.8790.7530.751
CV0.87279.5000.8250.7620.5870.584
RFTrain0.9080.01785.1000.8520.8500.7020.700
CV0.89182.5000.8600.7860.6470.648
Gyps
tenuirostris
BRTTrain0.9850.06892.7000.9240.9350.8590.838
CV0.91786.1000.8710.8450.7150.693
GLMTrain0.9260.05885.2000.8480.8600.7080.677
CV0.86882.5000.8360.8080.6440.619
MARSTrain0.9550.05387.9000.8790.8790.7580.733
CV0.90284.6000.8490.8450.6940.664
MaxEntTrain0.9480.04189.7000.8970.8970.7940.772
CV0.90784.5000.8530.8350.6880.662
RFTrain0.9340.00385.2000.8530.8500.7030.675
CV0.93788.2000.9070.8350.7410.734
Haliaeetus
leucoryphus
BRTTrain0.9880.03093.3000.9330.9330.8660.866
CV0.95888.6000.8740.9000.7740.772
GLMTrain0.9550.02290.9000.9110.9080.8190.818
CV0.93387.9000.8900.8670.7560.759
MARSTrain0.9700.03892.5000.9260.9240.8500.850
CV0.93290.6000.9110.9000.8110.811
MaxEntTrain0.9780.02392.5000.9260.9240.8500.849
CV0.95590.5000.9040.9080.8110.810
RFTrain0.9570.00189.4000.7870.7870.8910.896
CV0.95889.4000.7890.7870.9000.889
Table 2. The mean contribution in percentage of different covariate used in the ensemble model for raptors.
SpeciesPredictorsBRTGLMMARSMaxEntRFμ (Mean)μ (Mean) %
Falco severusaspect0.0000.0070.0050.0170.0000.0061.030
bio150.0000.2850.0600.0980.0030.08915.390
bio180.0000.2220.0000.0520.0010.0559.490
bio190.2890.3150.1390.0770.0230.16929.020
bio20.0000.1280.0740.0960.0100.06210.630
bio40.0000.0870.0590.1030.0010.0508.580
elevation0.1390.1950.1700.1650.0190.13723.660
slope0.0000.0000.0000.0610.0020.0132.210
Gyps tenuirostrisaspect0.0000.0040.0080.0060.0010.0041.110
bio150.0190.0000.0580.0170.0070.0205.960
bio180.0170.0520.0000.0170.0040.0185.250
bio190.0000.0000.0000.0000.0000.0000.110
bio20.0200.0360.0750.0280.0060.0339.620
bio40.0810.1840.0480.0770.0070.07923.180
elevation0.0820.2540.0520.1870.0610.12737.140
slope0.0170.0570.0760.0160.0050.0349.940
bio140.0000.0170.0550.0590.0000.0267.700
Haliaeetus leucoryphusaspect0.0000.0000.0000.0010.0000.0000.130
bio150.0000.0810.0220.0040.0010.0227.430
bio180.0000.0000.0000.0000.0000.0000.120
bio190.0000.0000.0000.0000.0000.0000.120
bio20.0000.0000.0070.0200.0010.0061.960
bio40.0280.0930.0340.0190.0000.03511.940
elevation0.2860.2410.0560.1490.0560.15854.020
slope0.0000.0000.0600.0350.0020.0196.670
bio140.0460.0640.0440.0850.0000.04816.410
bio160.0000.0000.0160.0000.0010.0031.190
Table 3. The suitable habitat extent (km2) of the three raptors in present and future climate scenarios. The “-” sign denotes loss in habitat area.
SpeciesPresentSSP245 (2041–2060)Habitat Loss from Present in SSP245 (2041–2060) (%)SSP245 (2061–2080)Habitat Loss from Present in SSP245 (2061–2080) (%)SSP585 (2041–2060)Habitat Loss from Present in SSP585 (2041–2060) (%)SSP585 (2061–2080)Habitat Loss from Present in SSP585 (2061–2080) (%)
Falco severus26,80117,109−36.169231−65.5512,184−54.538389−68.69
Gyps
tenuirostris
29,29713,731−53.13989−96.626160−78.97919−96.86
Haliaeetus leucoryphus17,8081021−94.26444−97.50419−97.64119−99.33
Table 4. Habitat quality assessment and shape geometry of the raptors in present and future climate conditions. NP: Number of patches; LPI: Largest patch index; TE: Total Edge; LSI: Landscape shape index; AI: Aggregate Index.
SpeciesScenarioNPLPITELSIAI
Falco severusPresent2005.09180.36815.31491.187
SSP245
(2041–2060)
3033.19875.39217.98586.895
SSP245
(2061–2080)
1341.81643.69614.15086.108
SSP585
(2041–2060)
2122.51750.09614.16787.949
SSP585
(2061–2080)
1181.05139.18413.31086.351
Gyps tenuirostrisPresent2558.37184.64015.42391.507
SSP245
(2041–2060)
2033.63753.04014.10688.688
SSP245
(2061–2080)
760.1328.0808.01676.919
SSP585
(2041–2060)
1850.66838.73615.42081.386
SSP585
(2061–2080)
580.0897.7127.90276.308
Haliaeetus
leucoryphus
Present614.99841.0249.60393.502
SSP245
(2041–2060)
460.1718.5128.31376.340
SSP245
(2061–2080)
140.0030.9444.21439.189
SSP585
(2041–2060)
80.0020.432337.931
SSP585
(2061–2080)
60.0020.4012.33032.681
Table 5. Threat and conservation implications of the raptors in the present study.
SpeciesThreats (IUCN)Necessary ResponsesScale of Action
Falco severusClimate change, habitat loss and fragmentation. The percentage of suitable area loss from present area is 36.16% during 2041–2060 (SSP245), and loss during 2061–2080 (SSP245) is 65.55%. Similarly, the percent suitable area loss during 2041–2060 (SSP585) is 54.53%, and there is 68.69% loss during 2061–2080 (SSP585).Long-term population trend monitoring by citizen science program. Impact assessment. Strict law enforcement. Awareness and education. Climate change adaptive management. Regional
Gyps tenuirostrisClimate change, habitat loss and fragmentation. The percentage of suitable area loss from present area is 53.13% during 2041–2060 (SSP245), and loss during 2061–2080 (SSP245) is 96.62%. Similarly, the percent suitable area loss during 2041–2060 (SSP585) is 78.97%, and there is 96.86% loss during 2061–2080 (SSP585).Updated vulture action plan. Updated areas of vulture safe zones. Awareness and advocacy. Long-term population trend monitoring by citizen science program. Impact assessment. Climate change adaptive management.Regional
Haliaeetus leucoryphusClimate change, Habitat loss and fragmentation. The percentage of suitable area loss from present area is 94.26% during 2041–2060 (SSP245), and loss during 2061–2080 (SSP245) is 97.5%. Similarly, the percent suitable area loss during 2041–2060 (SSP585) is 97.64% and there is 99.33% loss during 2061–2080 (SSP585).Identification of suitable sites for protection. Recommend sustainable wetland management practices. Regulate pollution of wetlands. Nesting trees plantation around waterbodies. Conduct education and awareness programs in rural areas having wetlands. Long-term population trend monitoring by citizen science program. Impact assessment.Regional and International
Disclaimer/Publisher’s Note: The statements, opinions and data contained in all publications are solely those of the individual author(s) and contributor(s) and not of MDPI and/or the editor(s). MDPI and/or the editor(s) disclaim responsibility for any injury to people or property resulting from any ideas, methods, instructions or products referred to in the content.