Simple Summary
The cardiovascular pathophysiology’s complexity has been sharply rising, as a consequence of the advanced mechanical and pharmacological treatments. Pressure–volume loops (PVLs) depict in depth the intrinsic and extrinsic properties of both ventricles, as well as their interdependence. Therefore, the deep understanding of cardiac physiology based on PVLs provide a unique tool to interpret the increasingly demanding clinical scenarios.
Abstract
Knowing cardiac physiology is essential for health care professionals working in the cardiovascular field. Pressure–volume loops (PVLs) offer a unique understanding of the myocardial working and have become pivotal in complex pathophysiological scenarios, such as profound cardiogenic shock or when mechanical circulatory supports are implemented. This review provides a comprehensive summary of the left and right ventricle physiology, based on the PVL interpretation.
1. Introduction
The use of mechanical circulatory support and multimodal pharmacological treatments has been sharply growing in the last decade [1]. As a consequence, a deep understanding of the cardiac physiology is a crucial requirement for health care professionals working in the cardiovascular field.
The heart is an electrically self-acting hydraulic pump consisting of two elastic muscle chambers connected in series, which simultaneously feed an approximately equal volume of blood into the pulmonary and systemic circulation. As first described by Suga and Sagawa [2], the force of the cardiac muscle strips at a given chamber volume generates a pressure that is related to the length of the muscle strips themselves. Since the force–length relationship of cardiac muscle underlies the ventricular pressure–volume relationship, a full understanding of cardiac pathophysiology is provided by ventricular pressure–volume loops (PVLs). The latter represent a unique approach for the real-time monitoring of both load–dependent and load–independent compounds of cardiac mechanics and, therefore, a complementary tool to figure out hemodynamic derangements and tailor appropriate treatments [3,4].
Cardiac physiology is presented below with reference to the left and right ventricular (LV and RV) PVLs.
2. Cardiac Cycle
By means of PVLs, each single cardiac cycle can be described by plotting instantaneous ventricular pressure on the y-axis and simultaneous ventricular volume on the x-axis, as shown in Figure 1A. At point a, ventricular pressure falls below atrial pressure, and the mitral valve opens, thus initiating ventricular filling. In a normally compliant heart, ventricular pressure is relatively low while ventricular volume is relatively high at the end of diastole (point b). Subsequently, isovolumic contraction begins. During this phase, the rise of wall tension results in an increased ventricular pressure as described by the Laplace law [5]: since this pressure is lower than the aortic pressure, the aortic valve remains closed, thus preventing changes in the ventricular volume. The rate of intraventricular pressure rise is an index of intrinsic ventricular contractility, due to its independence from the afterload. It can be described in terms of the maximum rate as dP/dtmax, which is moderately sensitive to large increases in preload [6], or indexed for end-diastolic volume (EDV) to overcome preload dependency [7]. As soon as intraventricular pressure exceeds aortic pressure, the aortic valve opens and the ejection of blood into the arterial system occurs (point c). Following a peak chamber pressure, intraventricular pressure begins to fall until the end-systolic Pressure (ESP) point is reached (point d). Stroke volume (SV) is the amount of blood ejected by the ventricle with each cardiac cycle and equals the difference between end-diastolic and end-systolic volumes (SV = EDV − ESV). At the end of the ejection phase, the aortic valve closes and isovolumic relaxation begins. The rate of pressure decay defines ventricular lusitropy and is characterized by an exponential time constant of decay (τ), which reflects the rate of cross-bridge uncoupling within the myocytes [3]. Isovolumic relaxation continues until point a, when the cardiac cycle starts again.

Figure 1.
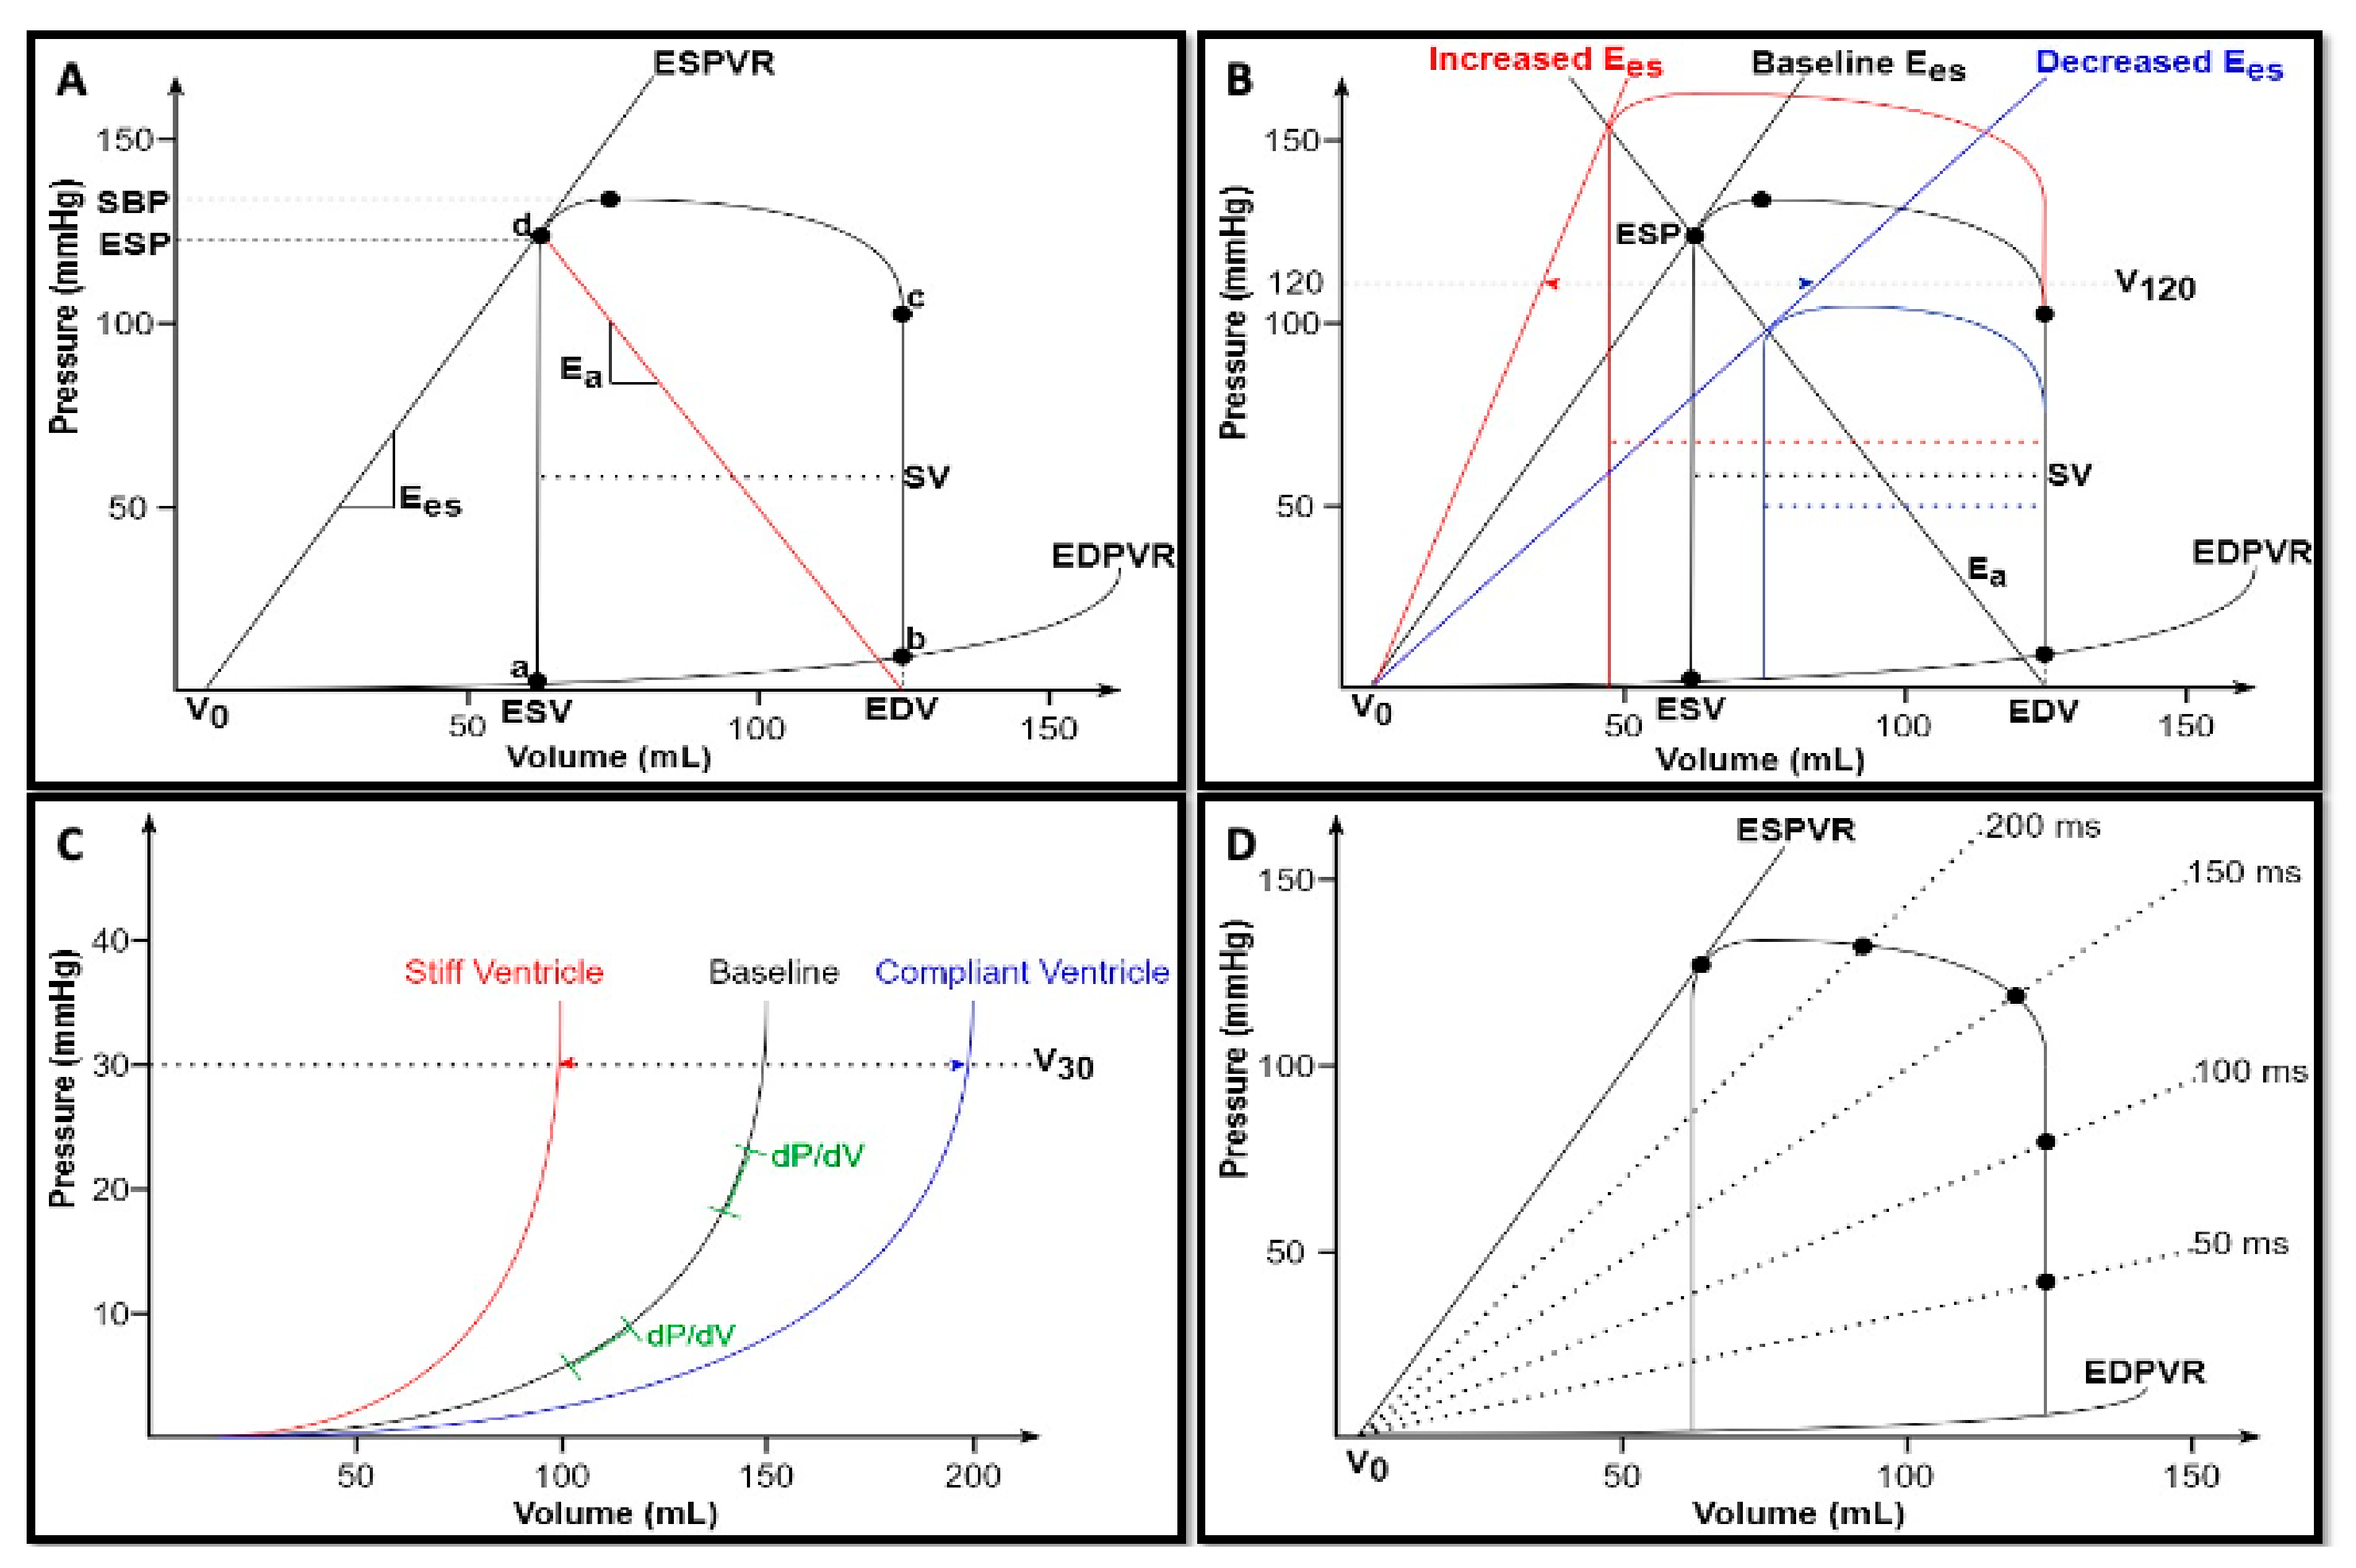
(A) Normal pressure–volume loop of the left ventricle. Ventricular volumes are on the x-axis, and ventricular pressures are on the y-axis. Each segment of the loop represents a phase of the cardiac cycle: a–b, ventricular filling; b–c, isovolumic contraction; c–d, ejection; and d–a, isovolumic relaxation. See text for details. (B) Changes in ventricular contractility. Under constant preload (EDV) and afterload (Ea) conditions, a rise in contractility (red) results in a leftward shift of the ESPVR or V120, accompanied by an increase in both ESP and SV; on the contrary, a depression in myocardial contractility (blue) results in a rightward shift of the ESPVR or V120, with a consequent reduction in both ESP and SV. (C) Changes in diastolic properties. The curvilinear shape of the EDPVR suggests that the ventricle becomes increasingly stiffer at higher volumes (green). A stiff ventricle (red) shows a leftward shift of the EDPVR or V30, while a compliant ventricle shows (blue) a rightward shift of the EDPVR or V30. (D) Time-varying elastance. Pressure–volume curve of multiple points of the cardiac cycle which progressively increases the elastance from diastole to the end of systole (revised from [5]). ESV, end-systolic volume; EDV, end-diastolic volume; ESP, end-systolic pressure; SBP, systolic blood pressure; SV, stroke volume; ESPVR, end-systolic pressure-volume relationship; EDPVR, end-diastolic pressure-volume relationship; Ees, ventricular elastance; and Ea, arterial elastance.
- [summary Table 1]
 Table 1. Cardiac cycle.
3. Intrinsic Properties
The loops are determined by the intrinsic properties of the heart: end–systolic pressure–volume relationship (ESPVR) and end–diastolic pressure–volume relationship (EDPVR).
Within a physiological range, the ESPVR is an approximately straight line connecting each individual ESP points belonging to multiple PVL, experimentally obtained by changing both preload and afterload at constant ventricular contractility [8,9] (Figure 1A). This linear association can be expressed as follows [10]:
where ESP = end-systolic pressure, Emax = maximum ventricular elastance, VES = end-systolic volume, and V0 = volume axis intercept.
ESP = Emax × (VES − V0)
The first factor of the aforementioned equation is Emax which is the slope of this linear association and can be expressed as follows:
Aortic ejection is prolonged shortly after Emax is reached, as a consequence of the aortic impedance and the blood inertia exiting the aortic valve. Therefore, Emax is not exactly reached at the end of systole but very close to it [5]. Emax represents an excellent index of intrinsic ventricular contractility, due to its load independence. Indeed, as shown by Suga and colleagues in canine left ventricles, under constant contractile state achieved through nerve section, extensive changes in heart rate and preload and afterload (or both) did not alter Emax. However, the latter was profoundly changed by epinephrine infusion [11].
Another important factor is V0, which is considered as a functionally “dead volume” at which the ventricle cannot generate any force and, therefore, any pressure [10]. It is a function of cardiac size and can occur at negative volume values since ESPVR is approximated to be a linear relationship. However, the real ESPVR is always curvilinear, with a nonlinearity degree that depends on ventricular contractile state. This curvilinear fit (concave with respect to the volume axis) properly predicts the minute positive value of V0 [12].
A rise in contractility corresponds to an increased ventricular capacity to develop strength and, thus, pressure, for any given chamber volume. Nevertheless, the ventricular dead volume V0 does not change since the chamber size itself remains the same. As a consequence, in the pressure–volume diagram, the ESPVR can theoretically shift leftward or rightward (causing SV and ESP increases or drops, respectively) without any changes in V0 [9] (Figure 1B). However, V0 may also shift with changes in contractility. For instance, the infarcted ventricle shows Emax reduction accompanied by an increase in ventricular chamber size, which ultimately shifts the volume intercept [10,13]. Therefore, it is necessary to account for changes in both Emax and V0 to adequately interpret the ESPVR as a contractility index [4]. To mitigate this problem with the interpretation of V0, the ventricular volume at which the ESPVR reaches 120 mmHg (V120) is suggested as an alternative: the higher its value, the lower the ventricular contractility, and vice versa [4] (Figure 1B).
The EDPVR is a curvilinear function enclosing the lower boundaries of multiple PVL obtained across different preloads and defines the passive diastolic properties of the ventricle [3] (Figure 1A). Nonlinearity accounts for the complexity of indexing diastolic properties. Therefore, in the past, a variety of exponential, cubic, and power curve fits have been applied to EDPVR, with the aim of developing a simple index of ventricular stiffness [7]. The latest proposed approach adapts the same curvilinear relationship to the following mathematically similar equation [5]:
where S = diastolic myocardial stiffness, a size-independent parameter having the units of stress; Vm = the maximum diastolic ventricular volume; V0 = volume axis intercept, the equilibrium diastolic volume at which pressure is zero.
The maximum volume (Vm) is asymptotically approached with the progressive increase in pressure, which would eventually lead to ventricular rupture [14]. Vm is not merely established by the dimension of the heart, but it is also strongly determined by the pericardium. The latter also tightly couples the right and left ventricular chambers and, therefore, their respective diastolic pressure, thus exerting a substantial effect on the left ventricular EDPVR. For this reason, the diastolic left ventricle should not be seen as “an unconstrained elastic shell of myocardium”, but rather as “a composite shell of stiff pericardium and elastic muscle, subdivided by the compliant interventricular septum” [15]. From a histological point of view, the curvilinear shape is due to different types of fibers being stretched at different pressure–volume ranges. Indeed, at a low pressure–volume range, the stretch of compliant elastin fibers determines only a small increase in pressure for a given volume increment. At larger volume ranges, on the other hand, the stretch of collagen fibers beyond their lengths allows the pressure to rise more steeply [7]. Therefore, the analysis of the EDPVR suggests the key diastolic features of the ventricle: at low volumes, it is highly compliant and fills easily, but becomes increasingly stiffer at higher volumes (Figure 1C).
In clinical practice, the shifts of the EDPVR reflect changes in myocardial material properties (e.g., fibrosis and edema) and physiological or pathological remodeling [7]. A stiff ventricle shows a left-shifted EDPVR, whereas a compliant ventricle has a right-shifted EDPVR. Similarly, as described for systole, another index of diastolic properties is ventricular capacitance (V30), being defined as the volume at which ventricular pressure reaches 30 mmHg [4]. V30 reflects ventricular compliance and indexes the degree of remodeling (as in heart failure with reduced ejection fraction) or diastolic dysfunction (as in restrictive and hypertrophic cardiomyopathy) (Figure 1C).
All the aforementioned intrinsic myocardial properties have been integrated by Suga and Sagawa into a unifying concept of time-varying elastance [16]. Indeed, it is possible to build a pressure–volume curve for each individual point in the cardiac cycle (Figure 1D). Since the slopes of all these lines have the dimension of elastance (∆P/∆V), the entire cardiac cycle can be seen in terms of cyclic variation in chamber elastance over time [5]. Thus, the time-varying elastance model consists of a single elastic element which cycles from low elastance (high compliance) during diastole to high elastance (low compliance) during systole. Therefore, this elastance increases gradually during the ejection phase, reaching its peak at the end of the systole [5,16].
- [summary Table 2]
Table 2. Intrinsic properties.
4. Extrinsic Properties
The position and shape of each single PVL are influenced by two fundamental extrinsic properties of the heart: preload and afterload.
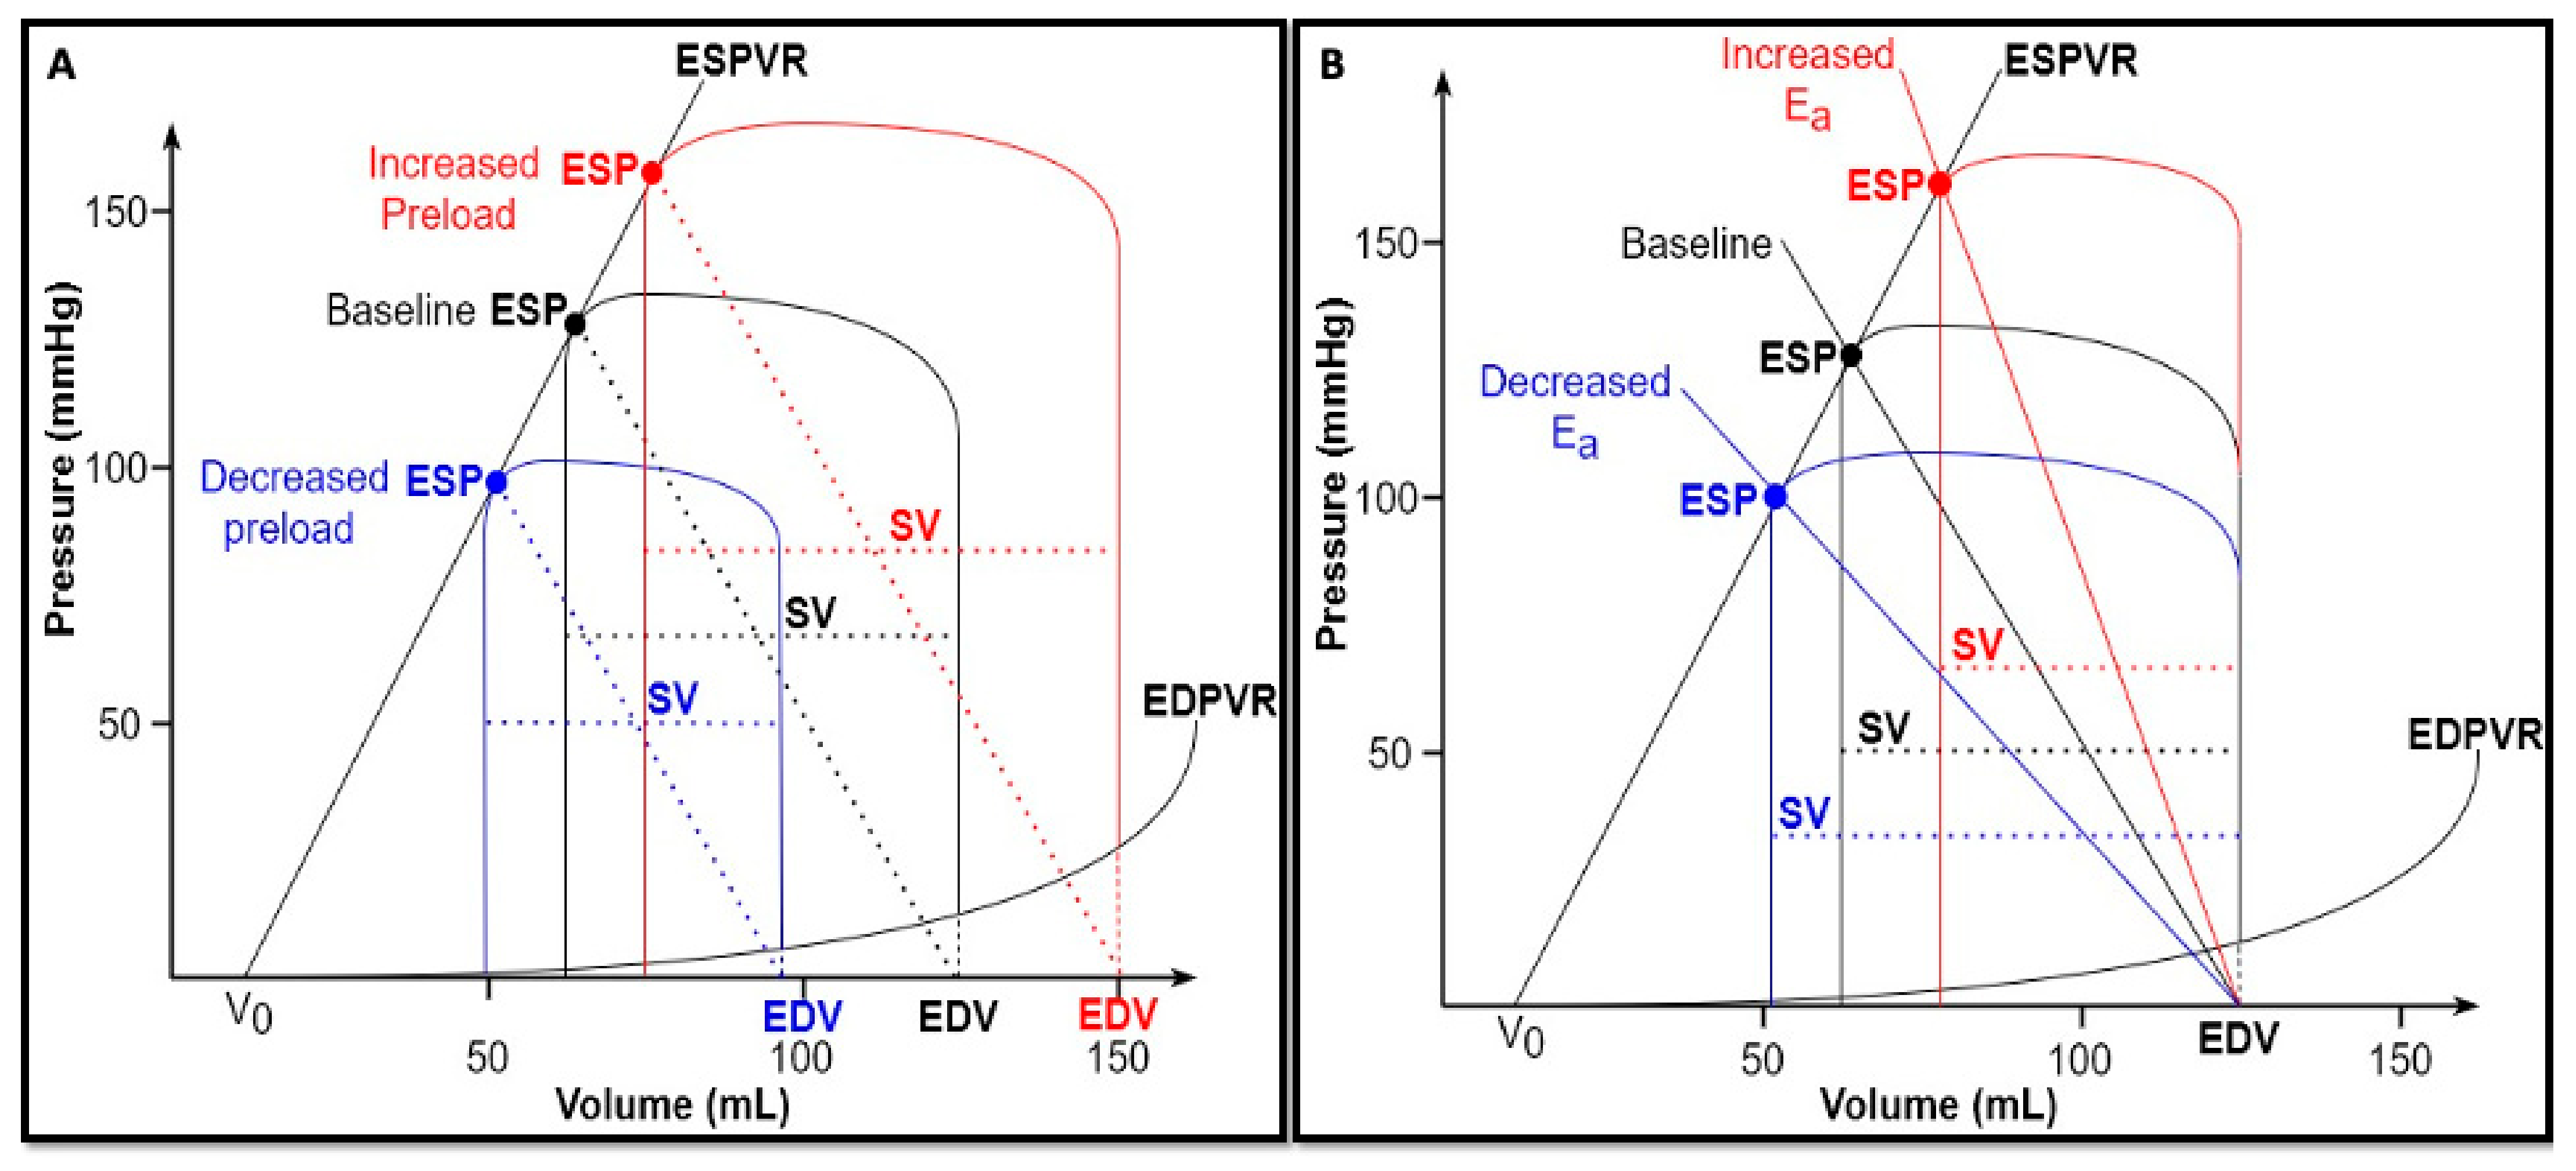
Preload is defined as the myocardial stretch at the end of diastole and is ultimately related to the maximal sarcomere length prior to systolic contraction [17]. It is indexed by end-diastolic pressure (EDP) or EDV [4], even though the relationship between filling pressure and filling volume varies in disease states involving diastolic dysfunction. According to the classic Frank–Starling law, the greater the stretch on the myocardium, the stronger the subsequent contraction [18]. This relationship is curvilinear, and therefore, at high preload, a further increase in volume would result in a smaller increase in cardiac output. Thereafter, many authors investigated the effects of preload changes on the PVL. In the experimental context, changes in preload can be obtained either in vivo, through inferior vena cava occlusion [3], or ex vivo. The ex vivo setting offers the unique possibility to investigate isolated changes in preload, afterload, and contractile state [8]. These experiments showed that, if afterload and contractility were kept constant, a decrease in preload would result in a smaller EDV and, consequently, a smaller and leftward shift of the PVL. Conversely, volume loading would lead to a larger and rightward shifted PVL, thus resulting in an increase in both ESP and SV (Figure 2A).
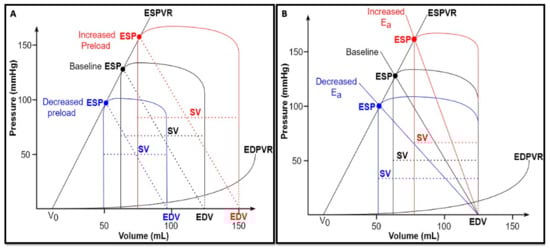
Figure 2.
(A) Changes in preload. Under constant afterload (Ea) and contractility (Emax) conditions, a volume depletion (blue) results in a smaller and leftward-shifted PVL, with smaller EDV, ESP, and SV; on the contrary, a volume overload (red) results in a bigger and rightward-shifted PVL, with higher EDV, ESP, and SV. (B) Changes in afterload. Under constant preload (EDV) and contractility (Ees) conditions, an increased afterload (rightward shift of Ea—red) determines an increased ESP accompanied by a lower SV; on the contrary, a reduced afterload (leftward shift of Ea—blue) determines a reduced ESP accompanied by a higher SV.
Afterload can be defined as the load the ventricle must overcome to eject the blood into the arterial system. It has been classically defined according to the modified Laplace law, assuming a spherical shape of the ventricle:
where τ = wall stress, p = intraventricular pressure, r = chamber radius, and h = wall thickness.
However, this formula has two main limitations. First, ventricular shape is merely approximated and ignores the structure and geometry of the ventricle [17]. Second, the aortic vascular contribution is disregarded. As a consequence, the arterial input impedance was proposed as a viable alternative to estimate the afterload. It is derived from the Fournier analysis of aortic pressure and flow waves, and characterizes the mean and pulsatile properties of the vascular loading circuit [19]. However, the coupling of impedance to heart’s mechanical properties is mathematically complicated, due to its different domains (frequency and time domains, respectively). Therefore, Sunagawa et al. [20,21] developed the concept of “effective arterial elastance (Ea)”, which best approximates the afterload based on the pressure–volume plane. The slope of the Ea line is approximately equal to the following [4]:
where TPR = total peripheral resistance, and T = RR interval in seconds.
However, at the end of ejection phase, the proximal artery contains an amount of blood volume which equals SV at a pressure that equals ESP. Therefore, Ea can be considered a lumped measure of the total arterial load that incorporates both resistive and pulsatile components, reflecting the net impact of this load on the ventricles [19]. Since Ea is graphically represented by the negative slope originating from ventricular elastance at ESP and intersecting the x axis at EDV (Figure 1A), it can be adequately estimated with the following simple formula [22]:
An increase in afterload causes an increase in the Ea slope along the ESPVR, and, consequently, a rightward shift of the PVL (if ESPVR remains constant), accompanied by a rise in ESP and a decrease in SV. In other words, an increased afterload results in an increased ESP at the expense of ejection, thus reducing the mechanical efficiency of the heart (Figure 2B).
- [summary Table 3]
Table 3. Extrinsic properties.
5. Myocardial Work and Oxygen Consumption
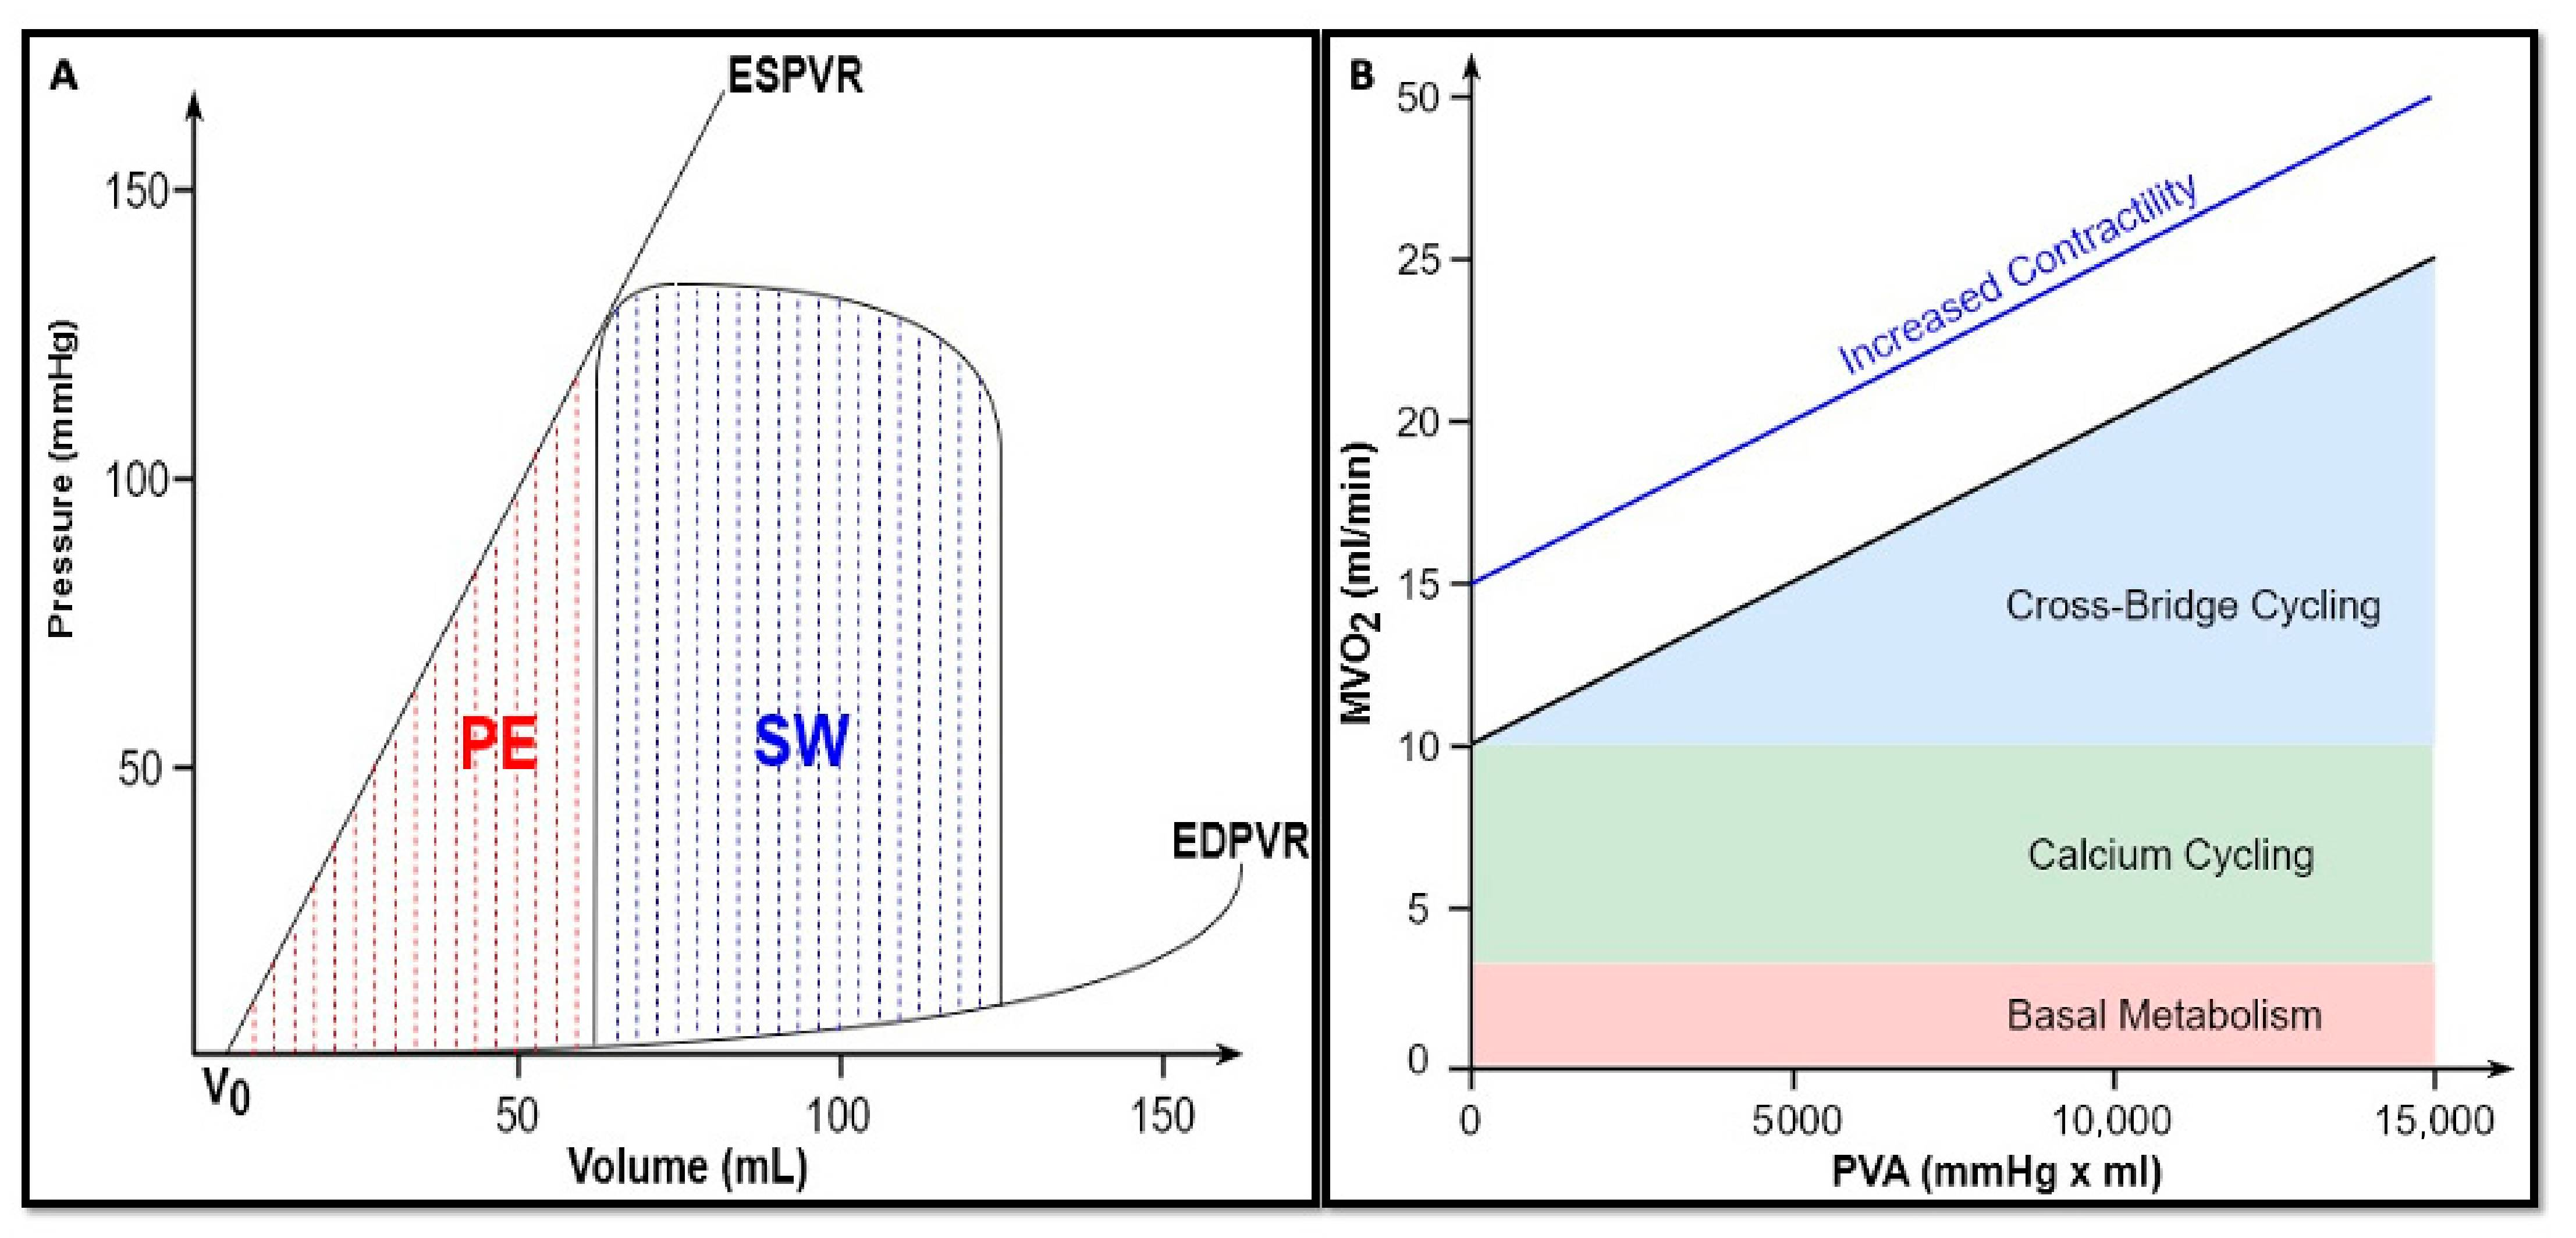
The time-varying elastance model provides the theoretical basis for quantifying the total mechanical energy produced with every single heartbeat. During the counterclockwise rotation of the instantaneous PVL, the ventricle generates an amount of mechanical energy to increase its elastance and allow ejection. This energy can be indexed by the area enclosed within the ESPVR, EDPVR, and the systolic limb of the same plot, named pressure–volume area (PVA) [23,24]. Only a part of the total energy produced by the ventricle is converted into external work and, thus, into cardiac output. Hence, the PVA equals the sum of two smaller areas, as assessed by the following formula:
where SW = stroke work, the area within the loop, and PE = potential energy, the area bound by both the ESPVR and EDPVR and the isovolumic relaxation limb of the same plot [25] (Figure 3A).
PVA = SW + PE,

Figure 3.
(A) Ventricular energetics. SW, stroke work, expressed by the following formula: . PE, potential energy, expressed by the following formula: . (B) Myocardial oxygen consumption. The x-axis is the PVA. The y-axis is the MVO2. The association between MVO2 and PVA is highly linear and does not change in terms of slope and y-axis intercept under conditions of constant contractility. Conversely, an enhanced contractility increased the MVO2 intercept without any change in the slope, reflecting a higher oxygen consumption due to an additional cross-bridge cycling (revised from Bastos et al. [3]).
SW is the external mechanical work that the ventricle performs to pump blood into the arterial system [24]. SW alone is not uniformly related to the myocardial oxygen consumption (MVO2) per beat, as it does not include the oxygen expenditure which occurs during isovolumic contraction and relaxation, when there is no ejection. Therefore, PE represents the potential energy accumulated during systole and not converted into external work, but rather stored at the end of the ejection phase in the elasticity of ventricular wall. In other words, it can be considered as the work against the viscoelastic properties of the myocardium [26].
As experimentally demonstrated by Suga and colleagues [27], it is not possible to convert all the PE into SW, thus reaching 100% of efficiency. However, as the relaxing ventricle can still perform the external mechanical work when allowed to reduce its volume against a decreased pressure load, up to 70% of this “wasted energy” can be effectively turned into SW. This work reasonably derives from some of the PE built during systole and then stored in ventricular wall.
The MVO2 can be approximated by the means of coronary sinus blood flow (CSbf) and arterial–coronary sinus oxygen content difference [28]:
MVO2 = CSbf × (CaO2 − CcsO2).
In the perspective of PVL, a highly linear correlation was experimentally found between the MVO2 per beat and PVA, as energy expenditure is related to both internal and external work (Figure 3B). Therefore, the cardiac oxygen consumption can be expressed as follows [24,25]:
where a is the slope of this linear relationship and reflects the heart efficiency in converting chemical energy into mechanical energy, being close to 30% under physiological conditions [29,30], and b is the MVO2 axis intercept. Total MVO2 includes basal metabolism, intracellular calcium cycling (both independent of PVA), and cross-bridge cycling (directly proportional to PVA) [3]. As this straight line intercepts the MVO2 axis, even though the PVA work is theoretically reduced to zero, the heart keeps consuming oxygen to maintain basal metabolism and to recycle calcium back into the sarcoplasmic reticulum [5,30]. Therefore, for a given contractile state, these two parameters (a and b) remain constant [23]. In contrast, the MVO2/PVA relationship is affected by different inotropic states: an enhanced contractility results in an increased oxygen consumption intercept (b) without any changes in the slope (a). This illustrates that the extra energy consumption is due to the excitation–contraction coupling, whereas the basal metabolism remains unchanged [30]. On the contrary, chronotropism does not alter the same relationship [31].
It should be noted that the energy conversion efficiency (a), as assessed by MVO2/PVA relation’s slope, is different from the conventional mechanical efficiency of the heart (E), corresponding to the following [23]:
Under physiological conditions, this ratio is approximately 25%. In other words, only about a quarter of oxygen consumed to produce energy is converted into external power [32]. The residual energy is dissipated as heat [33].
- [summary Table 4]
Table 4. Myocardial work and oxygen consumption.
6. Ventriculo-Arterial Coupling
The heart and the vascular system are anatomically and functionally linked. The interaction between ventricular elastance (Ees) and arterial elastance (Ea) during the ejection phase can be mathematically expressed as follows [34]:
where VAC defines the concept of ventriculo-arterial coupling, a major determinant of cardiac mechanoenergetics [35]. As mentioned above, Ees represents a load-independent myocardial contractility index. While Ea can be considered an integrative measure of the arterial system properties, including peripheral vascular resistances, the total arterial compliance, impedance, systolic and diastolic time intervals [35].
VAC = Ea/Ees.
Consequently, VAC can be considered an appropriate tool to assess the cardiovascular performance, as it summarizes how preload, afterload, and contractility interact with each other to determine ventricular stroke volume and mean arterial pressure (MAP) [4]. SV and MAP can be expressed as follows [4,36]:
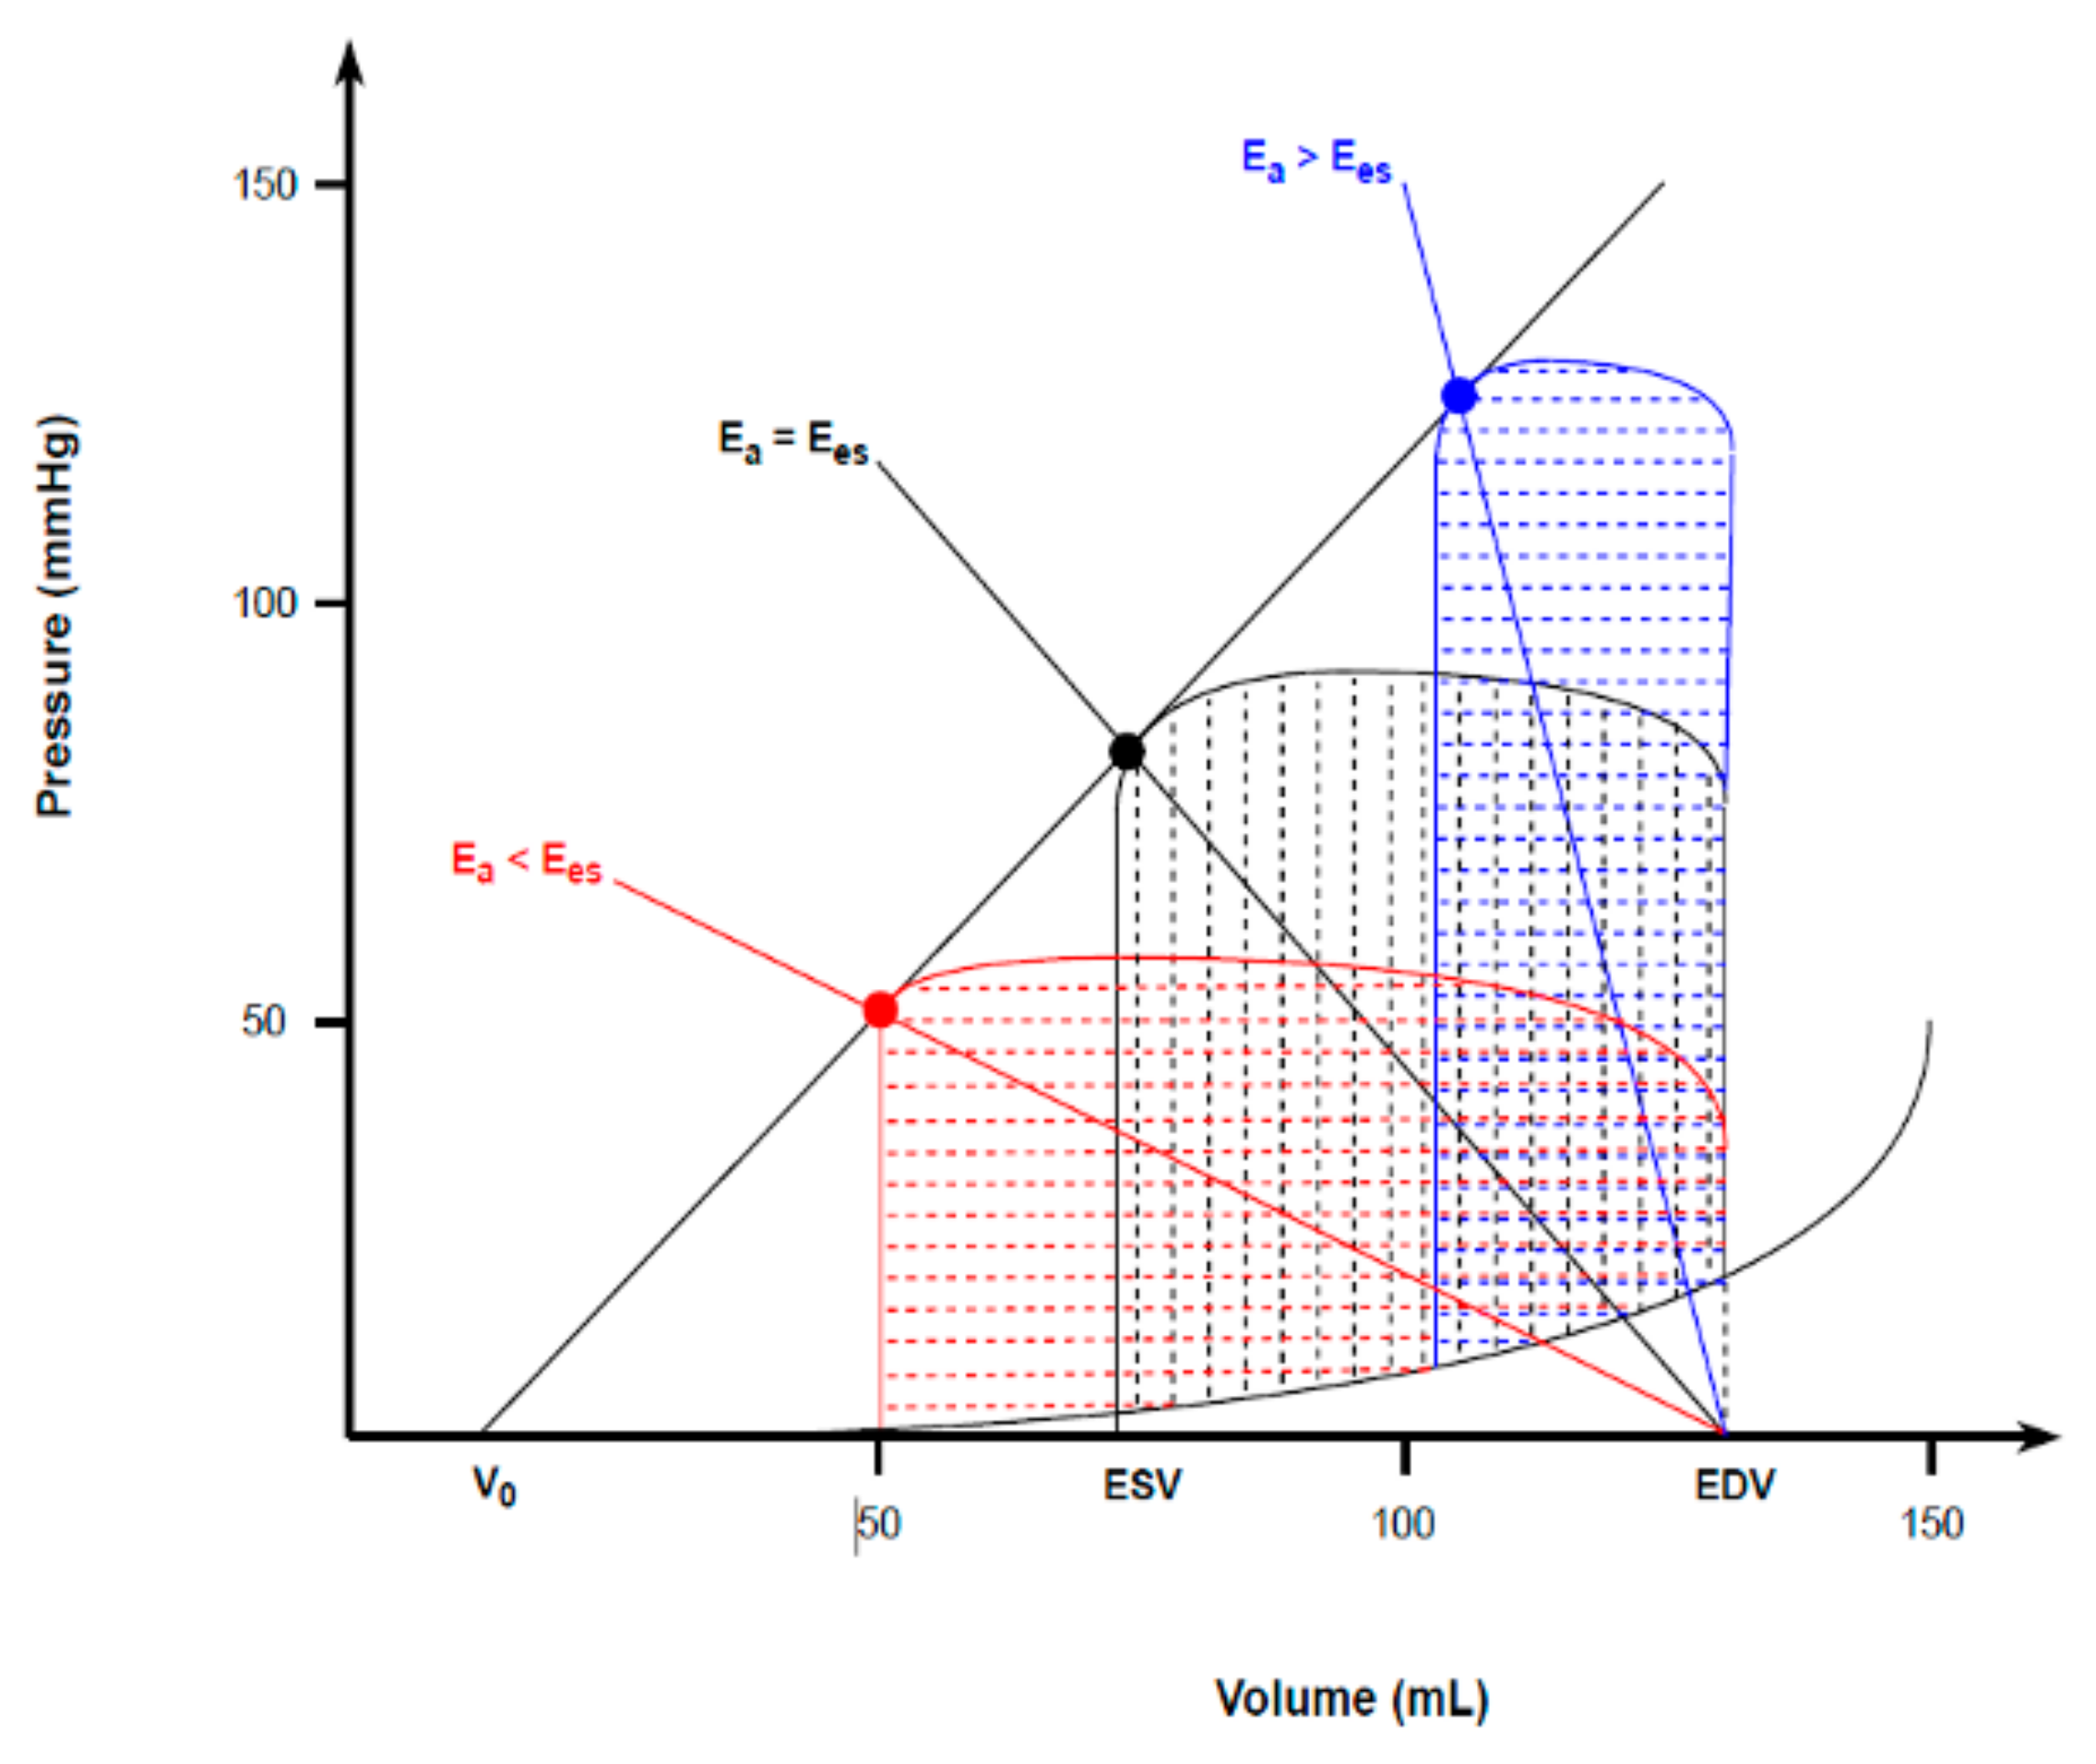
Under physiological and resting conditions, cardiac function and arterial load are matched to maximize mechanical efficiency rather than the SW alone [37]. This is represented by a VAC ranging between 0.5 and 0.7 [3,36,37,38]. Under pathological or stressful conditions, the ventricle tends to maximize the SW at the expense of its efficiency, thus leading Ea and Ees to equalize (VAC~1) and yielding the best combination to deliver the maximal mechanical energy from the ventricle to the arterial tree [5,34,36]. As such, the heart works to minimize the oxygen consumption and maximize ventricular efficiency (metabolic optimization) during physiological conditions. However, under pathological conditions, maximizing the stroke work becomes a priority, thus leading to ventricular and arterial elastance equalization [37]. At very high VAC values (Ea > Ees), the blood transfer from the ventricle to the arterial system becomes significantly inefficient, causing hemodynamic derangement and ineffective contraction (Figure 4) [35].

Figure 4.
Ventriculo-arterial coupling and the corresponding ventricular energetics. Under resting conditions, the optimal VAC of < 1 (red) maximizes mechanical efficiency of the heart. Under pathological or stressful conditions, the ventricle maximizes the SW at the expense of mechanical efficiency, thus equalizing ventricular and arterial elastances (VAC = 1 − black). When VAC > 1 (blue), the extremely high PE makes ventricular contraction totally inefficient, causing hemodynamic derangements.
- [summary Table 5]
Table 5. VAC.
7. Right Ventricle
The RV is a “thin-walled crescent-shaped structure coupled to systemic venous return on one side and to the pulmonary circulation on the other” [39]. From a physiological point of view, the primary role of the RV is to transfer all the venous return into the pulmonary circulation while preventing a rise in right atrial pressure [40]. This is possible because a healthy RV is coupled with a low-pressure and high-compliance arterial tree, thus resulting in lower wall stress during the entire cardiac cycle compared with the LV.
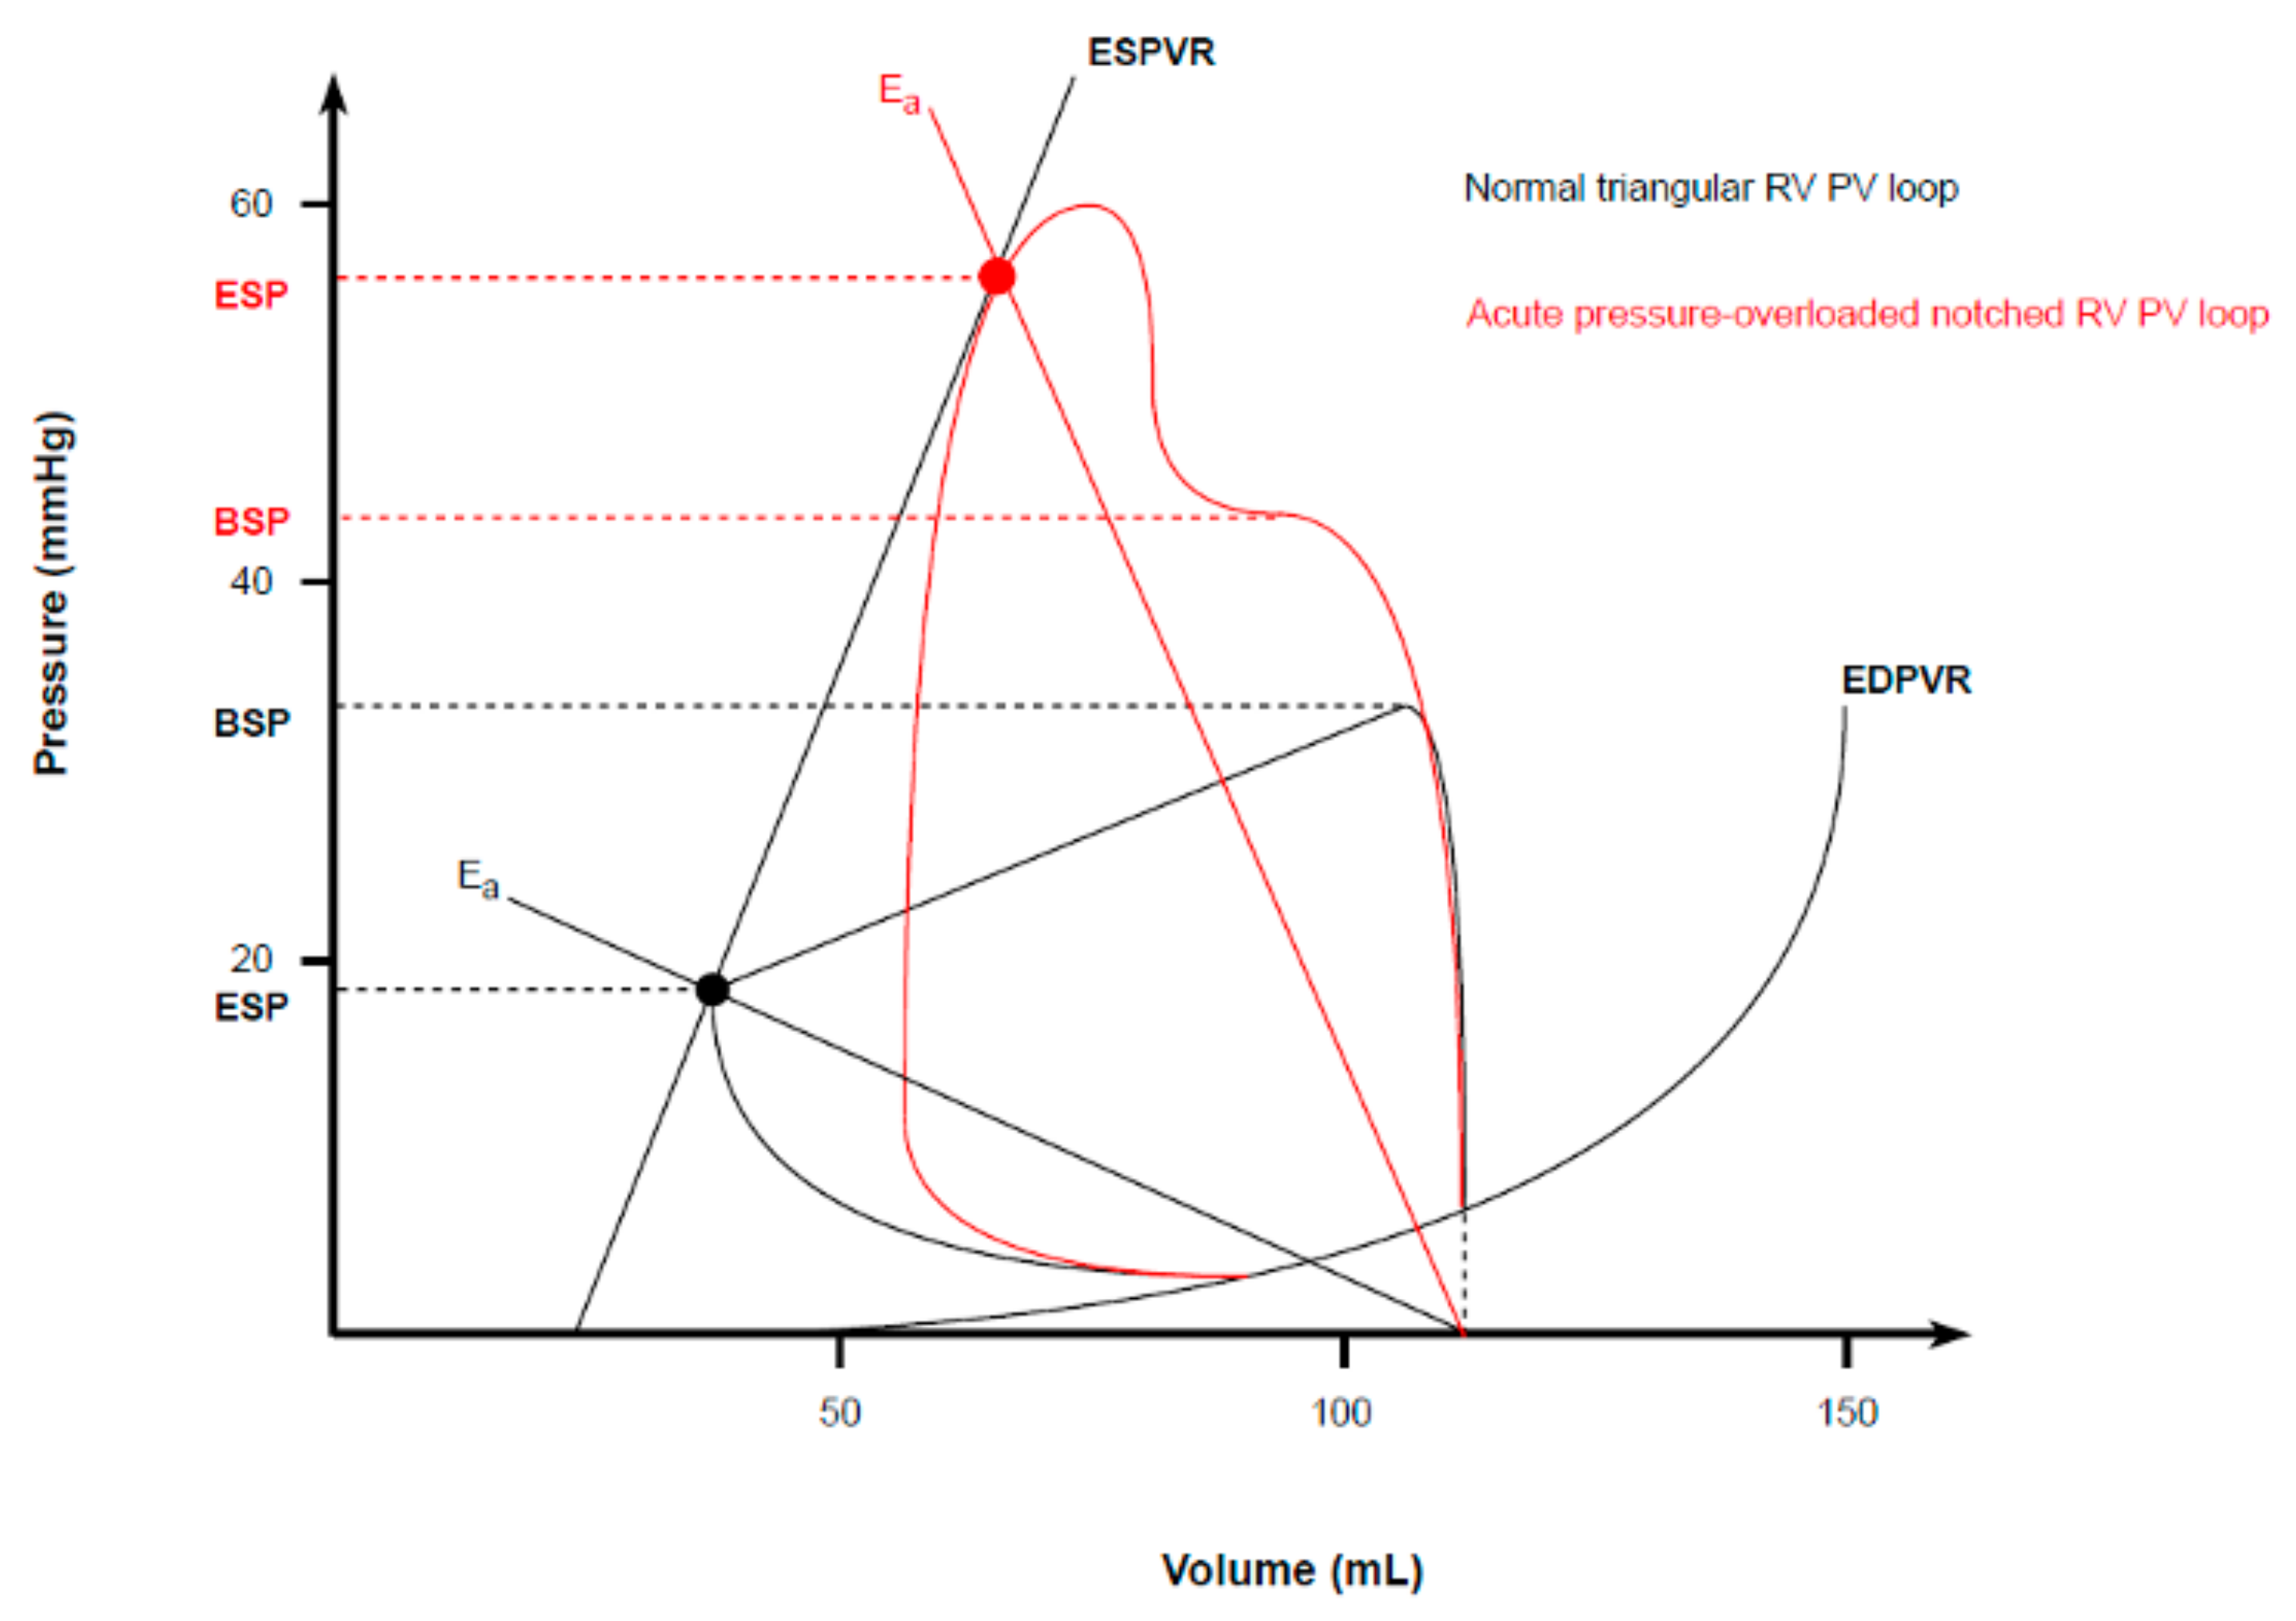
Although from an anatomical point of view, the RV differs substantially from the LV, only minor differences in the classic PVL model exist, owing to its lower operating pressures and higher working volumes [41]. These differences make the appearance of a normal right ventricular PVL slightly different. As the RV pumps blood into a low-pressure system, the isovolumic contraction time is shortened, and thus, the ejection occurs early during a pressure rise. Consequently, peak chamber pressure is achieved quickly during systole. Then, the ESP decays nearly to the diastolic pressure, as the RV continues to eject blood into the pulmonary artery long after the beginning of its relaxation. All of this results in a more triangular round shape of a normal RV PV loop, compared to the square shape of normal LV PVL [42,43,44,45] (Figure 5). Therefore, despite the development of the same SV (since the average cardiac output must be roughly the same from both ventricles), RV external mechanical work, as indexed by the area within the triangular PVL, is proportionally smaller than that of square LV plot. The SW and MVO2 of the RV are approximately one-quarter of the LV energetic expenditure [45].
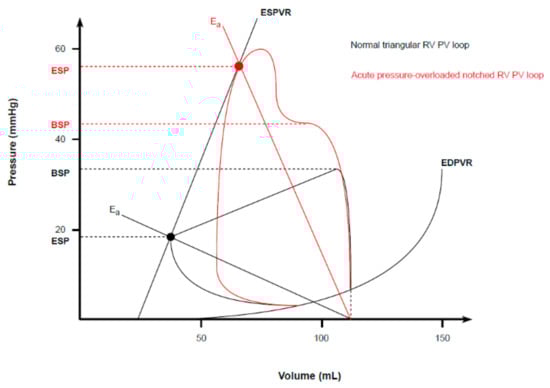
Figure 5.
Normal and pathological RV PVL. Physiological RV PVL shows a triangular shape due to a shortened isovolumic contraction, an early peak chamber pressure, and a lower ESP point (closed to the diastolic pressure). An acute pressure overload alters the RV PVL shape into a trapezoid or notched one, with a late peak chamber pressure and an increased ESP.
Since RV mechanoenergetic efficiency strictly depends on the low impedance imposed by the pulmonary circulation, its systolic function is highly sensitive to any acute changes in afterload. Indeed, an acute rise in pulmonary vascular resistances (as indexed by an increased Ea slope) promptly alters the RV PVL shape, which progressively becomes trapezoid or notched, with a late peak chamber pressure and an increased ESP (Figure 5) [44,46]. In case of compensatory hypertrophy, the RV develops a large contractile reserve when its afterload increases slowly [45]. A similar observation can be made for preload. Owing to the thinner wall and lower volume to wall surface area, healthy RV is a higher compliant chamber compared to the LV [39,42]. Indeed, the RV readily adapts to a chronically increased preload, being able to achieve even a threefold EDV with little or no change in EDP and, therefore, in basal compliance characteristics (rightward-shifted PVL with unchanged ESPVR and EDPVR [47]). On the contrary, the diastolic ventricular filling is markedly preload–dependent, and RV responds to an acute volume overload by dilating and altering its stiffness more than the LV (steeper EDPVR) [39,45].
Moreover, as for the left side, a contractile dysfunction responsible for RV failure manifests itself by lowering the ESPVR relationship slope (thus reducing Emax), which in turn results in a marked reduction in both SV and ESP [47].
Lastly, VAC is a sensitive and independent estimate of cardiovascular system efficiency. The right VAC is more often calculated as the ratio between Ees and Ea, the reversed ratio compared to the left ventricle [48]. As confirmed by prior studies, the optimal Ees/Ea ratio ranges between 1.5–2.0 [49,50]. In the setting of chronically increased afterload, Ees initially increases due to the development of ventricular hypertrophy, in order to offset the increased Ea and, therefore, to maintain the RV–PA coupling. During an acute or chronic decompensated phase, a lack of additional contractile reserve leads to a disproportionate increase in Ea compared to Ees, thus resulting in RV–PA decoupling, as indicated by a ratio below 0.6 to 0.8 and worse outcomes [48,49].
- [summary Table 6]
Table 6. RV.
8. Ventricular Interdependence
The concept of ventricular interdependence resides in an intimate anatomic relationship between the two ventricles, which includes the interlacing of superficial muscle bundles, a common interatrial and interventricular septum, and shared coronary blood flow and pericardium [41]. This interaction occurring during both systole and diastole and is amplified by the pericardium.
The diastolic interaction is exemplified by the fact that a distention from one of the two ventricles during the filling phase alters the compliance and geometry of the contralateral ventricle [51].
As originally demonstrated in postmortem-isolated hearts by Taylor and colleagues [52], changing pressure and volume in one ventricle profoundly influenced the contralateral size and compliance through the interventricular septum [53] and/or the pericardium [54]. Furthermore, in experimental setting, in the case of closed pericardium, RV pressure was the most powerful LV pressure determinant; on the contrary, as soon as the pericardium had been opened, LV geometry became predominant [15]. However, the ventricular interdependence becomes more intricate in in vivo animal, as well as in human physiology scenarios, as shown by Dell’Italia and colleagues [41,55]. First, pericardial restraint was the predominant mechanism when acute changes in preload and afterload affected both ventricular chambers simultaneously. Conversely, septum displacement and peripheral circulatory impedance appear dominant when acute changes affected only one ventricle. This mechanism represents an efficient cross-talking system between the two heart chambers. Indeed, during acute pulmonary embolism, the overloaded and distended RV shifted the interventricular septum leftward, thus decreasing LV chamber size and preload. At the same time, an acute reduction in LV stroke volume (due to the Starling mechanism) reduces systemic systolic pressure and, therefore, LV afterload. The simultaneous decrease in LV preload and afterload prevented the upward shift of its diastolic PVL, as differently showed in the previous experiments.
The systolic ventricular interdependence highlights the crucial role of the LV in generating right ventricular systolic pressure. Several authors in the past showed that up to 80% of right ventricular myocardium could be destroyed without any significant impact on right pump function [51,56,57]. Based on this finding, different theories were proposed varying from the central role of the LV in supporting the RV function to the need of a limited amount of RV fibers to ensure a normal RV performance [57]. The crucial role of the LV was further observed by experiments finding a significant impaired RV function as a consequence of the alterations in LV volume as well as LV free wall ischemia or a loss of its structural integrity [58,59]. Therefore, as stated by Damiano et al., the left ventricular contraction is fundamental for the right ventricular developed pressure and volume outflow, contributing over 50% of its mechanical work.
- [summary Table 7]
Table 7. Ventricular interdependence.
9. Future Perspective
Although PV loops represent the gold standard technique for thoroughly understanding cardiac pathophysiology, given the invasiveness of the procedure due to the cardiac catheterization; however, to date, they are still mostly relegated to the realm of research, with no real application in daily clinical practice yet. Therefore, the future is heading towards the development of computer simulation models [60,61], which allow the use of PV loops to be transferred from research laboratories to patients’ bedside, where they can effectively guide clinicians during the pathophysiology assessment and the hemodynamic management of patients admitted in the cardiovascular intensive care unit, especially if supported with mechanical circulatory supports.
10. Conclusions
Pressure–volume loops represent a unique tool to fully understand cardiac physiology. This results into a valuable means for clinicians to deeply appreciate the differences between right and left ventricular physiology, to understand how the ventricular chambers interact with each other or with implanted mechanical support systems and, accordingly, to prevent and adequately treat conditions in which physiology progresses towards pathology, resulting in hemodynamic derangements.
Author Contributions
Conceptualization, I.P., A.v.d.E., N.M.V.M., C.L.M. and P.M.; Methodology, I.P., A.v.d.E., N.M.V.M., C.L.M. and P.M.; Validation, I.P., A.v.d.E., N.M.V.M., C.L.M. and P.M.; Investigation, I.P., A.v.d.E., N.M.V.M., C.L.M. and P.M.; Writing—Original Draft Preparation, I.P., A.v.d.E., N.M.V.M., C.L.M. and P.M.; Writing—Review and Editing, I.P., A.v.d.E., N.M.V.M., C.L.M. and P.M.; Supervision, N.M.V.M., C.L.M. and P.M.; Project Administration, N.M.V.M., C.L.M. and P.M. All authors have read and agreed to the published version of the manuscript.
Funding
This research received no external funding.
Institutional Review Board Statement
Not applicable.
Informed Consent Statement
Not applicable.
Data Availability Statement
Not applicable.
Conflicts of Interest
N.M.V.M. reports research grant support from Abbott Vascular, Boston Scientific, Medtronic, Edwards Lifesciences, PulseCAth BV, Abiomed, and Daiichi Sankyo. The other authors declare no conflicts of interest.
References
- Schwartz, B.; Jain, P.; Salama, M.; Kapur, N.K. The Rise of Endovascular Mechanical Circulatory Support Use for Cardiogenic Shock and High Risk Coronary Intervention: Considerations and Challenges. Expert Rev. Cardiovasc. Ther. 2021, 19, 151–164. [Google Scholar] [CrossRef] [PubMed]
- Suga, H.; Sagawa, K. Mathematical interrelationship between instantaneous ventricular pressure-volume ratio and myocardial force-velocity relation. Ann. Biomed. Eng. 1972, 1, 160–181. [Google Scholar] [CrossRef] [PubMed]
- Bastos, M.B.; Burkhoff, D.; Maly, J.; Daemen, J.; den Uil, C.A.; Ameloot, K.; Lenzen, M.; Mahfoud, F.; Zijlstra, F.; Schreuder, J.J.; et al. Invasive left ventricle pressure-volume analysis: Overview and practical clinical implications. Eur. Heart J. 2020, 41, 1286–1297. [Google Scholar] [CrossRef]
- Burkhoff, D.; Sayer, G.; Doshi, D.; Uriel, N. Hemodynamics of Mechanical Circulatory Support. J. Am. Coll. Cardiol. 2015, 66, 2663–2674. [Google Scholar] [CrossRef] [PubMed]
- Walley, K.R. Left ventricular function: Time-varying elastance and left ventricular aortic coupling. Crit. Care 2016, 20, 270. [Google Scholar] [CrossRef] [PubMed]
- Mahler, F.; Ross, J., Jr.; O’Rourke, R.A.; Covell, J.W. Effects of changes in preload, afterload and inotropic state on ejection and isovolumic phase measures of contractility in the conscious dog. Am. J. Cardiol. 1975, 35, 626–634. [Google Scholar] [CrossRef] [PubMed]
- Burkhoff, D.; Mirsky, I.; Suga, H. Assessment of systolic and diastolic ventricular properties via pressure-volume analysis: A guide for clinical, translational, and basic researchers. Am. J. Physiol. Heart Circ. Physiol. 2005, 289, H501–H512. [Google Scholar] [CrossRef]
- Suga, H.; Sagawa, K. Instantaneous pressure-volume relationships and their ratio in the excised, supported canine left ventricle. Circ. Res. 1974, 35, 117–126. [Google Scholar] [CrossRef] [PubMed]
- Sagawa, K.; Suga, H.; Shoukas, A.A.; Bakalar, K.M. End-systolic pressure/volume ratio: A new index of ventricular contractility. Am. J. Cardiol. 1977, 40, 748–753. [Google Scholar] [CrossRef]
- Sagawa, K. The end-systolic pressure-volume relation of the ventricle: Definition, modifications and clinical use. Circulation 1981, 63, 1223–1227. [Google Scholar] [CrossRef] [PubMed]
- Suga, H.; Sagawa, K.; Shoukas, A.A. Load independence of the instantaneous pressure-volume ratio of the canine left ventricle and effects of epinephrine and heart rate on the ratio. Circ. Res. 1973, 32, 314–322. [Google Scholar] [CrossRef] [PubMed]
- Kass, D.A.; Maughan, W.L. From ‘Emax’ to pressure-volume relations: A broader view. Circulation 1988, 77, 1203–1212. [Google Scholar] [CrossRef] [PubMed]
- Grossman, W.; Braunwald, E.; Mann, T.; McLaurin, L.P.; Green, L.H. Contractile state of the left ventricle in man as evaluated from end-systolic pressure-volume relations. Circulation 1977, 56, 845–852. [Google Scholar] [CrossRef] [PubMed]
- Walley, K.R.; Cooper, D.J. Diastolic stiffness impairs left ventricular function during hypovolemic shock in pigs. Am. J. Physiol. 1991, 260 Pt 2, H702–H712. [Google Scholar] [CrossRef] [PubMed]
- Glantz, S.A.; Misbach, G.A.; Moores, W.Y.; Mathey, D.G.; Lekven, J.; Stowe, D.F.; Parmley, W.W.; Tyberg, J.V. The pericardium substantially affects the left ventricular diastolic pressure-volume relationship in the dog. Circ. Res. 1978, 42, 433–441. [Google Scholar] [CrossRef] [PubMed]
- Suga, H.; Yamada, O.; Goto, Y. Pressure-volume relations in isolated cat trabecula. Circ. Res. 1984, 54, 208–210. [Google Scholar] [CrossRef] [PubMed]
- Sorajja, P.; Borlaug, B.A.; Dimas, V.V.; Fang, J.C.; Forfia, P.R.; Givertz, M.M.; Kapur, N.K.; Kern, M.J.; Naidu, S.S. SCAI/HFSA clinical expert consensus document on the use of invasive hemodynamics for the diagnosis and management of cardiovascular disease. Catheter. Cardiovasc. Interv. 2017, 89, E233–E247. [Google Scholar] [CrossRef]
- Patterson, S.W.; Piper, H.; Starling, E.H. The regulation of the heart beat. J. Physiol. 1914, 48, 465–513. [Google Scholar] [CrossRef]
- Borlaug, B.A.; Kass, D.A. Invasive hemodynamic assessment in heart failure. Cardiol. Clin. 2011, 29, 269–280. [Google Scholar] [CrossRef]
- Sunagawa, K.; Maughan, W.L.; Burkhoff, D.; Sagawa, K. Left ventricular interaction with arterial load studied in isolated canine ventricle. Am. J. Physiol. 1983, 245 Pt 1, H773–H780. [Google Scholar] [CrossRef]
- Sunagawa, K.; Maughan, W.L.; Sagawa, K. Optimal arterial resistance for the maximal stroke work studied in isolated canine left ventricle. Circ. Res. 1985, 56, 586–595. [Google Scholar] [CrossRef] [PubMed]
- Kelly, R.P.; Ting, C.T.; Yang, T.M.; Liu, C.P.; Maughan, W.L.; Chang, M.S.; Kass, D.A. Effective arterial elastance as index of arterial vascular load in humans. Circulation 1992, 86, 513–521. [Google Scholar] [CrossRef] [PubMed]
- Suga, H. Ventricular energetics. Physiol. Rev. 1990, 70, 247–277. [Google Scholar] [CrossRef] [PubMed]
- Suga, H. Total mechanical energy of a ventricle model and cardiac oxygen consumption. Am. J. Physiol. 1979, 236, H498–H505. [Google Scholar] [CrossRef]
- Landesberg, A.; Sideman, S. Regulation of energy consumption in cardiac muscle: Analysis of isometric contractions. Am. J. Physiol. 1999, 276, H998–H1011. [Google Scholar] [CrossRef]
- Herman, D.; Prevorovska, S.; Marsik, F. Determination of myocardial energetic output for cardiac rhythm pacing. Cardiovasc. Eng. 2007, 7, 156–161. [Google Scholar] [CrossRef] [PubMed]
- Suga, H. External mechanical work from relaxing ventricle. Am. J. Physiol. 1979, 236, H494–H497. [Google Scholar] [CrossRef]
- Kameyama, T.; Asanoi, H.; Ishizaka, S.; Yamanishi, K.; Fujita, M.; Sasayama, S. Energy conversion efficiency in human left ventricle. Circulation 1992, 85, 988–996. [Google Scholar] [CrossRef]
- Suga, H.; Hayashi, T.; Shirahata, M. Ventricular systolic pressure-volume area as predictor of cardiac oxygen consumption. Am. J. Physiol. 1981, 240, H39–H44. [Google Scholar] [CrossRef]
- Suga, H.; Hisano, R.; Goto, Y.; Yamada, O.; Igarashi, Y. Effect of positive inotropic agents on the relation between oxygen consumption and systolic pressure volume area in canine left ventricle. Circ. Res. 1983, 53, 306–318. [Google Scholar] [CrossRef]
- Suga, H.; Hisano, R.; Hirata, S.; Hayashi, T.; Yamada, O.; Ninomiya, I. Heart rate-independent energetics and systolic pressure-volume area in dog heart. Am. J. Physiol. 1983, 244, H206–H214. [Google Scholar] [CrossRef] [PubMed]
- Sorensen, J.; Harms, H.J.; Aalen, J.M.; Baron, T.; Smiseth, O.A.; Flachskampf, F.A. Myocardial Efficiency: A Fundamental Physiological Concept on the Verge of Clinical Impact. JACC Cardiovasc. Imaging 2020, 13, 1564–1576. [Google Scholar] [CrossRef] [PubMed]
- Knaapen, P.; Germans, T.; Knuuti, J.; Paulus, W.J.; Dijkmans, P.A.; Allaart, C.P.; Lammertsma, A.A.; Visser, F.C. Myocardial energetics and efficiency: Current status of the noninvasive approach. Circulation 2007, 115, 918–927. [Google Scholar] [CrossRef] [PubMed]
- Sunagawa, K.; Sagawa, K.; Maughan, W.L. Ventricular interaction with the loading system. Ann. Biomed. Eng. 1984, 12, 163–189. [Google Scholar] [CrossRef]
- Trambaiolo, P.; Figliuzzi, I.; Salvati, M.; Bertini, P.; Brizzi, G.; Tocci, G.; Volpe, M.; Ferraiuolo, G.; Guarracino, F. Ventriculo-arterial coupling in the intensive cardiac care unit: A non-invasive prognostic parameter. Int. J. Cardiol. 2022, 348, 85–89. [Google Scholar] [CrossRef]
- Burkhoff, D.; Sagawa, K. Ventricular efficiency predicted by an analytical model. Am. J. Physiol. 1986, 250 Pt 2, R1021–R1027. [Google Scholar] [CrossRef]
- Monge Garcia, M.I.; Santos, A. Understanding ventriculo-arterial coupling. Ann. Transl. Med. 2020, 8, 795. [Google Scholar] [CrossRef]
- De Tombe, P.P.; Jones, S.; Burkhoff, D.; Hunter, W.C.; Kass, D.A. Ventricular stroke work and efficiency both remain nearly optimal despite altered vascular loading. Am. J. Physiol. 1993, 264 Pt 2, H1817–H1824. [Google Scholar] [CrossRef]
- Sanz, J.; Sanchez-Quintana, D.; Bossone, E.; Bogaard, H.J.; Naeije, R. Anatomy, Function, and Dysfunction of the Right Ventricle: JACC State-of-the-Art Review. J. Am. Coll. Cardiol. 2019, 73, 1463–1482. [Google Scholar] [CrossRef]
- Pinsky, M.R. The right ventricle: Interaction with the pulmonary circulation. Crit. Care 2016, 20, 266. [Google Scholar] [CrossRef]
- Dell’Italia, L.J. The right ventricle: Anatomy, physiology, and clinical importance. Curr. Probl. Cardiol. 1991, 16, 653–720. [Google Scholar] [CrossRef] [PubMed]
- Brener, M.I.; Masoumi, A.; Ng, V.G.; Tello, K.; Bastos, M.B.; Cornwell, W.K., 3rd; Hsu, S.; Tedford, R.J.; Lurz, P.; Rommel, K.P.; et al. Invasive Right Ventricular Pressure-Volume Analysis: Basic Principles, Clinical Applications, and Practical Recommendations. Circ. Heart Fail. 2022, 15, e009101. [Google Scholar] [CrossRef] [PubMed]
- Vieillard-Baron, A. Assessment of right ventricular function. Curr. Opin. Crit. Care 2009, 15, 254–260. [Google Scholar] [CrossRef] [PubMed]
- Richter, M.J.; Hsu, S.; Yogeswaran, A.; Husain-Syed, F.; Vadasz, I.; Ghofrani, H.A.; Naeije, R.; Harth, S.; Grimminger, F.; Seeger, W.; et al. Right ventricular pressure-volume loop shape and systolic pressure change in pulmonary hypertension. Am. J. Physiol. Lung Cell. Mol. Physiol. 2021, 320, L715–L725. [Google Scholar] [CrossRef] [PubMed]
- Redington, A.N. Right ventricular function. Cardiol. Clin. 2002, 20, 341–349. [Google Scholar] [CrossRef]
- Adamo, M.; Inciardi, R.M.; Tomasoni, D.; Dallapellegrina, L.; Estevez-Loureiro, R.; Stolfo, D.; Lupi, L.; Pancaldi, E.; Popolo Rubbio, A.; Giannini, C.; et al. Changes in Right Ventricular-to-Pulmonary Artery Coupling After Transcatheter Edge-to-Edge Repair in Secondary Mitral Regurgitation. JACC Cardiovasc. Imaging 2022, 15, 2038–2047. [Google Scholar] [CrossRef]
- Kanwar, M.K.; Everett, K.D.; Gulati, G.; Brener, M.I.; Kapur, N.K. Epidemiology and management of right ventricular-predominant heart failure and shock in the cardiac intensive care unit. Eur. Heart J. Acute Cardiovasc. Care 2022, 11, 584–594. [Google Scholar] [CrossRef]
- Tello, K.; Dalmer, A.; Axmann, J.; Vanderpool, R.; Ghofrani, H.A.; Naeije, R.; Roller, F.; Seeger, W.; Sommer, N.; Wilhelm, J.; et al. Reserve of Right Ventricular-Arterial Coupling in the Setting of Chronic Overload. Circ. Heart Fail. 2019, 12, e005512. [Google Scholar] [CrossRef]
- Houston, B.A.; Brittain, E.L.; Tedford, R.J. Right Ventricular Failure. N. Engl. J. Med. 2023, 388, 1111–1125. [Google Scholar] [CrossRef]
- Fourie, P.R.; Coetzee, A.R.; Bolliger, C.T. Pulmonary artery compliance: Its role in right ventricular-arterial coupling. Cardiovasc. Res. 1992, 26, 839–844. [Google Scholar] [CrossRef]
- Bove, A.A.; Santamore, W.P. Ventricular interdependence. Prog. Cardiovasc. Dis. 1981, 23, 365–388. [Google Scholar] [CrossRef] [PubMed]
- Taylor, R.R.; Covell, J.W.; Sonnenblick, E.H.; Ross, J., Jr. Dependence of ventricular distensibility on filling of the opposite ventricle. Am. J. Physiol. 1967, 213, 711–718. [Google Scholar] [CrossRef] [PubMed]
- Santamore, W.P.; Lynch, P.R.; Meier, G.; Heckman, J.; Bove, A.A. Myocardial interaction between the ventricles. J. Appl. Physiol. 1976, 41, 362–368. [Google Scholar] [CrossRef] [PubMed]
- Janicki, J.S.; Weber, K.T. The pericardium and ventricular interaction, distensibility, and function. Am. J. Physiol. 1980, 238, H494–H503. [Google Scholar] [CrossRef]
- Dell’Italia, L.J.; Walsh, R.A. Right ventricular diastolic pressure-volume relations and regional dimensions during acute alterations in loading conditions. Circulation 1988, 77, 1276–1282. [Google Scholar] [CrossRef] [PubMed]
- Kagan, A. Dynamic responses of the right ventricle following extensive damage by cauterization. Circulation 1952, 5, 816–823. [Google Scholar] [CrossRef] [PubMed]
- Donald, D.E.; Essex, H.E. Pressure studies after inactivation of the major portion of the canine right ventricle. Am. J. Physiol. 1954, 176, 155–161. [Google Scholar] [CrossRef]
- Santamore, W.P.; Lynch, P.R.; Heckman, J.L.; Bove, A.A.; Meier, G.D. Left ventricular effects on right ventricular developed pressure. J. Appl. Physiol. 1976, 41, 925–930. [Google Scholar] [CrossRef]
- Santamore, W.P.; Lynch, P.R. Mechanical Interactions between Left and Right Ventricles. Fed. Proc. 1975, 34, 463. [Google Scholar]
- Donker, D.W.; Brodie, D.; Henriques, J.P.; Broomé, M. Left Ventricular Unloading During Veno-Arterial ECMO: A Simulation Study. ASAIO J. 2019, 65, 11–20. [Google Scholar] [CrossRef]
- Leisman, S.; Burkhoff, D. Use of an iPad App to simulate pressure-volume loops and cardiovascular physiology. Adv. Physiol. Educ. 2017, 41, 415–424. [Google Scholar] [CrossRef] [PubMed]
Disclaimer/Publisher’s Note: The statements, opinions and data contained in all publications are solely those of the individual author(s) and contributor(s) and not of MDPI and/or the editor(s). MDPI and/or the editor(s) disclaim responsibility for any injury to people or property resulting from any ideas, methods, instructions or products referred to in the content. |
© 2024 by the authors. Licensee MDPI, Basel, Switzerland. This article is an open access article distributed under the terms and conditions of the Creative Commons Attribution (CC BY) license (https://creativecommons.org/licenses/by/4.0/).