Article

World Spread of Tropical Soda Apple (Solanum viarum) under Global Change: Historical Reconstruction, Niche Shift, and Potential Geographic Distribution

1
State Key Laboratory for Biology of Plant Diseases and Insect Pests, Institute of Plant Protection, Chinese Academy of Agricultural Sciences, Beijing 100193, China
2
Fujian Key Laboratory for Technology Research of Inspection and Quarantine, Technology Centre of Fuzhou Customs, Fuzhou 350001, China
*
Authors to whom correspondence should be addressed.
These authors contributed equally to this work.
Biology 2023, 12(9), 1179; https://doi.org/10.3390/biology12091179
Submission received: 26 July 2023 / Revised: 24 August 2023 / Accepted: 25 August 2023 / Published: 29 August 2023
(This article belongs to the Special Issue Risk Assessment for Biological Invasions)

Abstract

:

Simple Summary

Solanum viarum has been a widely invasive species. We aimed to understand the prevailing historical dispersal, ecological niche dynamics, and distribution patterns. The invasion history of S. viarum consisted of three phases: lagging (before 1980), dispersal (1980–2010), and equilibrium (2010–present). Ecological niches remained conservative. The potential geographic distribution of S. viarum will reach a maximum in the 2050s, SSP5–8.5, and in the future, it will migrate to higher latitudes. Global factors continue to increase this threat. The relevant quarantine authorities should take prevention and control measures.

Abstract

Solanum viarum has become extensively invasive owing to international trade, climate change, and land–use change. As it is classified as a quarantine weed by countries such as the U.S. and Mexico, it is critical to understand the prevailing historical dispersal, ecological niche dynamics, and distribution patterns. We reconstructed the historical invasion countries and analyzed the ecological niche shift of S. viarum. Using MaxEnt based on the conservativeness of ecological niches, we studied variations in the potential geographical distributions (PGDs) of S. viarum in ecosystems and variations in suitability probabilities along latitudinal gradients. The invasion history in six continents involved three phases: lag (before 1980), spread (1980–2010), and equilibrium (2010–present). The ecological niche remains conserved. The area of S. viarum PGDs had increased by 259 km2; the PGDs will expand to reach a maximum in the 2050s, SSP5–8.5. The PGDs of S. viarum will migrate to higher latitudes under the same future climate scenarios. The latitudes subject to high threats range from 20° to 30° in forest and cropland ecosystems, 15.5° to 27.5° (northern hemisphere) and 33.1° to 42.8° (southern hemisphere) in grassland ecosystems, and 20° to 35° in urban ecosystems. Global change has led to an increased threat of S. viarum at high latitudes. These findings provide a theoretical basis to monitor and control S. viarum.

1. Introduction

Plant invasions impact ecosystem functions, including accelerated competition for resources and reduced native plant diversity [1,2]. Global factors, such as international trade, climate change, and land–use change (LUC), can act individually or together to exacerbate the threat of plant invasion [3]. International trade in propagules, seeds, live plants, and flowers directly leads to the introduction of alien plants to new target regions, reshaping the biogeography [4]. However, international trade also plays an indirect role by altering the natural resources and social environments of exporting and importing countries [5]. Climate change may affect the ability of alien plants to survive and reproduce, enhancing adaptations to colonize otherwise unsuitable areas, such as high latitudes [6]. LUC, such as urban expansion, causes habitat fragmentation and the destruction of native ecosystems which affect the richness and frequency of alien plants [7]; it provides vacant ecological niches and creates feasible conditions for the invasion of alien plants [8]. Moreover, international trade, climate change, and LUC have resulted in land pollution and dramatic urbanization [9,10], which have a combined effect on plant invasion. Understanding the role of global changes in plant invasion is essential for ensuring sustainable development.
Solanum viarum Dunal (Solanaceae), commonly known as tropical soda apple, is a perennial seed propagated weed [11] native to South America (Brazil, Paraguay, Uruguay, and Argentina) and is now widely distributed (except Antarctica) [12]. Solanum viarum is spread via three main ways, namely as a popular medicinal plant by anthropic activity (international trade), as fruits by animals (e.g., birds and cattle), and naturally by vectors such as wind or water [13]. The species has been observed in pine forests, pastures, citrus plantations, and urban riparian habitats [14]. The species loss, health damage, and economic costs it causes in different ecosystems are of great concern, despite its medicinal value in India [15]. The whole plant of S. viarum is spiny; in forest and cropland ecosystems, it often occupies the space of neighboring plants, affecting the growth of native plants and reducing the yield of commercial crops [16]. Solanum viarum contains toxic alkaloid chemicals. The fruits, especially the immature ones, are more toxic and may cause respiratory distress, weakness, and even death when ingested by humans or livestock in grassland and urban ecosystems [17,18]. Moreover, injuries to humans and livestock from thorny plants often occur. As a result, the United States Department of Agriculture declared it a troublesome invasive weed in 15 states in 2012; Mexico added it to the list of quarantine pests in 2018 and Chile added it to the list of quarantine pests in category A1 in 2019 [19,20].
Reconstruction of the invasion history and identification of potential geographical distribution (PGDs) are key components of risk assessment. Invasion history reconstruction can identify the temporal phases of invasion and trends in different phases [21]. Species distribution models (SDMs) are used to predict the PGDs of invasive species prior to the occurrence of an invasion and have the advantage of requiring only occurrence records and environmental variables to model the maximum probability of species distribution [22]. They are based on the assumption of “niche conservatism”. However, ecological niches may shift during the process of global change and interactions between organisms; thus, the extent of the niche shift (whether it is stable) needs to be assessed. The two–dimensional centroid shift, overlap, unfilling, and expansion (COUE) framework is a common method to assess niche shifts. Guisan et al. [23] first proposed the COUE framework and stated that it can be used for invasion studies (including plants and pathogens). Pili et al. [24] used the COUE framework to compare the realized ecological niches of four alien species and assessed the extent of niche conservatism. The assessment of the ecological niche shift can be used to validate MaxEnt model results, which guarantees the accuracy of the predictions. Additionally, most recent studies have focused on PGDs and ecological niche shifts of alien species under trade, climate change, or LUC alone [25,26], with some studies emphasizing how LUC is associated with future trade and climate change affects alien species [27,28,29]. However, the intricacies of PGDs and ecological niche shifts of alien species under simultaneous variation in all three have been neglected.
Solanum viarum causes serious damage to natural ecosystems and has a negative impact on ecological balance. Studying ecological niche shifts and PGDs under global change provides guidance for early warning systems. Here, we (1) reconstructed the historical invasion of S. viarum in three temporal phases, (2) calculated ecological niche shifts to ensure the predictions of the MaxEnt model, (3) predicted the global PGDs of S. viarum in different ecosystems under climate change in the 2030s and 2050s, and (4) analyzed the variation in suitability probabilities along latitudinal gradients in different ecosystems. This study will provide an ecological and theoretical reference for assessing the invasion and spread of S. viarum.

2. Materials and Methods

2.1. Occurrence Records and Reconstruction of Invasion

We obtained 2037 global occurrence records of S. viarum from the open literature and databases (Table S1). Thereafter, we removed the occurrence data that did not contain detailed geographic information. ENMTools were used to screen the occurrence data such that only one distribution point was retained within each 5 km × 5 km raster [30]. Finally, we obtained 1074 occurrence records of S. viarum to model the PGDs using SDMs.
To reconstruct S. viarum invasion, based on the available documented countries from the Centre for International Agricultural and Biological Sciences (CABI), European and Mediterranean Plant Protection Organization (EPPO), Global Biodiversity Information Facility (GBIF), and Web of Science (WOS), we confirmed that 157 countries worldwide do not have relevant databases, documentation, or detailed geographical information on the occurrence of S. viarum. The earliest recorded time for field sampling and documentation was assumed to be the time of invasion in each country. We used four native countries of S. viarum publicly listed by CABI as the starting points for the pathway. The global spatiotemporal dynamics of S. viarum invasions were reconstructed, considering invaded countries prior to 1970 as a category and invaded countries from 1970 to 2023 as a category (with 10–year intervals). Additionally, we investigated the dynamics of the number of invaded countries based on a time series to analyze the invasion trends of S. viarum in different phases. The geographical observations were set to the World Geodetic System 1984 geographic coordinate system and imported into ArcGIS.

2.2. Climate Variables

The geospatial raster layers of the climate variables were available in ArcGIS (ESRI), and 19 unique covariates were included in the SDM. These covariates for 1970–2000 were obtained from the PaleoClim database with a resolution of 5 arc minutes [31]. Future covariates were derived from the WorldClim database [32]. Three shared socioeconomic paths, SSP1–2.6, SSP2–4.5, and SSP5–8.5, were used for the 2030s and 2050s. These indicate low, medium, and high CO2 concentrations in future scenarios based on the BCC–CSM2–MR, respectively. When two covariates had Pearson correlations, that is, |r| > 0.8, only the larger contributor was selected for modeling.

2.3. Land–Use Harmonization Data

Land–use harmonization data (LUH2) (https://luh.umd.edu/ (accessed on 20 June 2023)) is the latest complete set of land–use scenario data that links historical reconstructions of land use with future predictions to study variations in the suitability of S. viarum in different ecosystems under climate change. The dataset provided land use types, potential type shifts, and valuable agricultural reference information at a 1 km resolution per year, covering the period of 2015 to 2100 [33]. Historical reconstructions of the land–use dataset from 2015 were considered to match the near–current climate dataset [34] and used as the near–current LUC dataset. Future datasets cover scenarios SSP1–2.6, SSP2–4.5, and SSP5–8.5 and cover the 2040s and 2060s. The land use types (i.e., the ecosystems of S. viarum) were selected and classified as forest (consisting of primary and secondary forests), cropland, grassland (consisting of natural and managed grazing), and urban areas. We predicted the PGDs and non–PGDs of S. viarum for the near–current and future periods and quantified the proportion of PGDs to that ecosystem type in each grid cell, thereby obtaining information on variations in S. viarum PGDs in different ecosystems.

2.4. Model Settings and Evaluation

We predicted the PGDs of S. viarum under near–current climate and future scenarios based on occurrence records and environmental variables (including climate data and harmonized land–use data) using the MaxEnt model, which performs better than the species distribution model. As the most important parameters of the MaxEnt model, the calibration of FCs and RM can significantly improve prediction accuracy [35,36]. To simulate species responses to covariates, MaxEnt uses parameters with five characteristics: linear, L; quadratic, Q; product, P; threshold, T; and hinge, H. The range of the RM settings was increased from 0.5 to 4, and interval tests were performed using 0.5 intervals. Candidate models were built using the ENMeval package in R [37]. Finally, the model with the most significant delta values was selected.
The receiver operating characteristic (ROC) curve is based on a series of different dichotomies (cutoff values or decision thresholds), with the true positive rate (sensitivity) as the vertical coordinate and false positive rate (1–specificity) as the horizontal coordinate. The area under the curve (AUC), defined as the area under the ROC curve, is a performance indicator of accuracy [38]. The closer the AUC value is to 1.0, the higher the authenticity of the assay. The probability (p) of S. viarum occurrence was generated in an ASCII raster and ranged from zero to one in the model results. We classified the geographical distributions of S. viarum into two categories based on cutoff values: non–PGDs (0 < p ≤ 0.23) and PGDs (0.23 < p ≤ 1).

2.5. Ecological Niche Comparison Method

Based on the framework originally proposed by Broennimann et al. [39], the COUE framework was used to study the ecological niche shift of alien species in native and invaded countries. In the COUE framework, the ecological niche overlap index D proposed by Schoener was used to compare the ecological niches occupied by S. viarum in its native and invasive ranges [39]. Specifically, the ecological niche overlap index D, ranging from 0 to 1, indicates the degree of overlap between the ecological niches of alien species in native and invaded countries; large values indicate a high degree of overlap between ecological niches. Principal component analysis was performed using real occurrence records, and 8000 pseudo–absence points were randomly generated within the native and invasive ranges of S. viarum (points with latitudes greater than 70° were removed). The native and invasive ranges included all climatic zones in which S. viarum survives [40,41].
Equivalence and similarity tests were performed using the method proposed by Warren et al. [42]. The ecological niche equivalence test was used to determine whether the ecological niches of the native and invaded countries were equivalent, that is, random points were reassigned and the ecological niche overlap index D was calculated in the native and invaded countries; the iterations were repeated 100 times to ensure high confidence in rejecting the original hypothesis. If the achieved niche was within the 95% confidence range of the simulated value, the original hypothesis could not be rejected (ecological niche equivalence). The ecological niche similarity test was used to verify whether the environmental niche occupied in one range was more similar to the environmental niche occupied in a range other than that expected. If the niche achieved is greater than 95% of the simulated value after 100 iterations, the environmental conditions of the native and invaded countries are more similar than expected.
We evaluated three indicators of ecological niche shifts: stability, expansion, and unfilling [23,39]. Stability is the ability of a species to adapt to environmental change, expansion is the extension of the range of a species’ ecological niche in a new habitat, and unfilling is a vacant ecological niche in a new habitat that is not occupied by a species. The ecological niche comparison method was performed in R using the ecospat package [43,44].

3. Results

3.1. Reconstruction of Invasion

The invasion history of S. viarum was grouped into three phases: lag (before 1980), spread (1980–2010), and equilibrium (2010–present), based on the characteristics of the temporal curve of the number of occurrence countries (Figure 1). The lag phase was a period of slow growth in the number of countries invaded by S. viarum, that is, the establishment phase. Prior to the 1970s, S. viarum was recorded as invasive in seven countries, and from 1970 to 1980, only two more countries were added. The spread phase was a period of rapidly increasing spread, during which the number of invading countries increased significantly. From 1980 to 1990, S. viarum invaded six additional countries, and from 1990 to 2000 S. viarum invaded seven additional countries. From 2000 to 2010, its spread peaked with S. viarum invading 14 countries. By 2010, S. viarum had spread to South America, southern North America, central Africa, Asia, and eastern Australia. The subsequent invasion by S. viarum reached a relative equilibrium. Since 2010, S. viarum has invaded five additional countries, for a total of forty–one countries, and is widely distributed across Asia, Europe, North America, South America, southern Africa, and Oceania. To date, 156 countries have not been affected by S. viarum.

3.2. Global Variation in the Ecological Niche of Solanum viarum

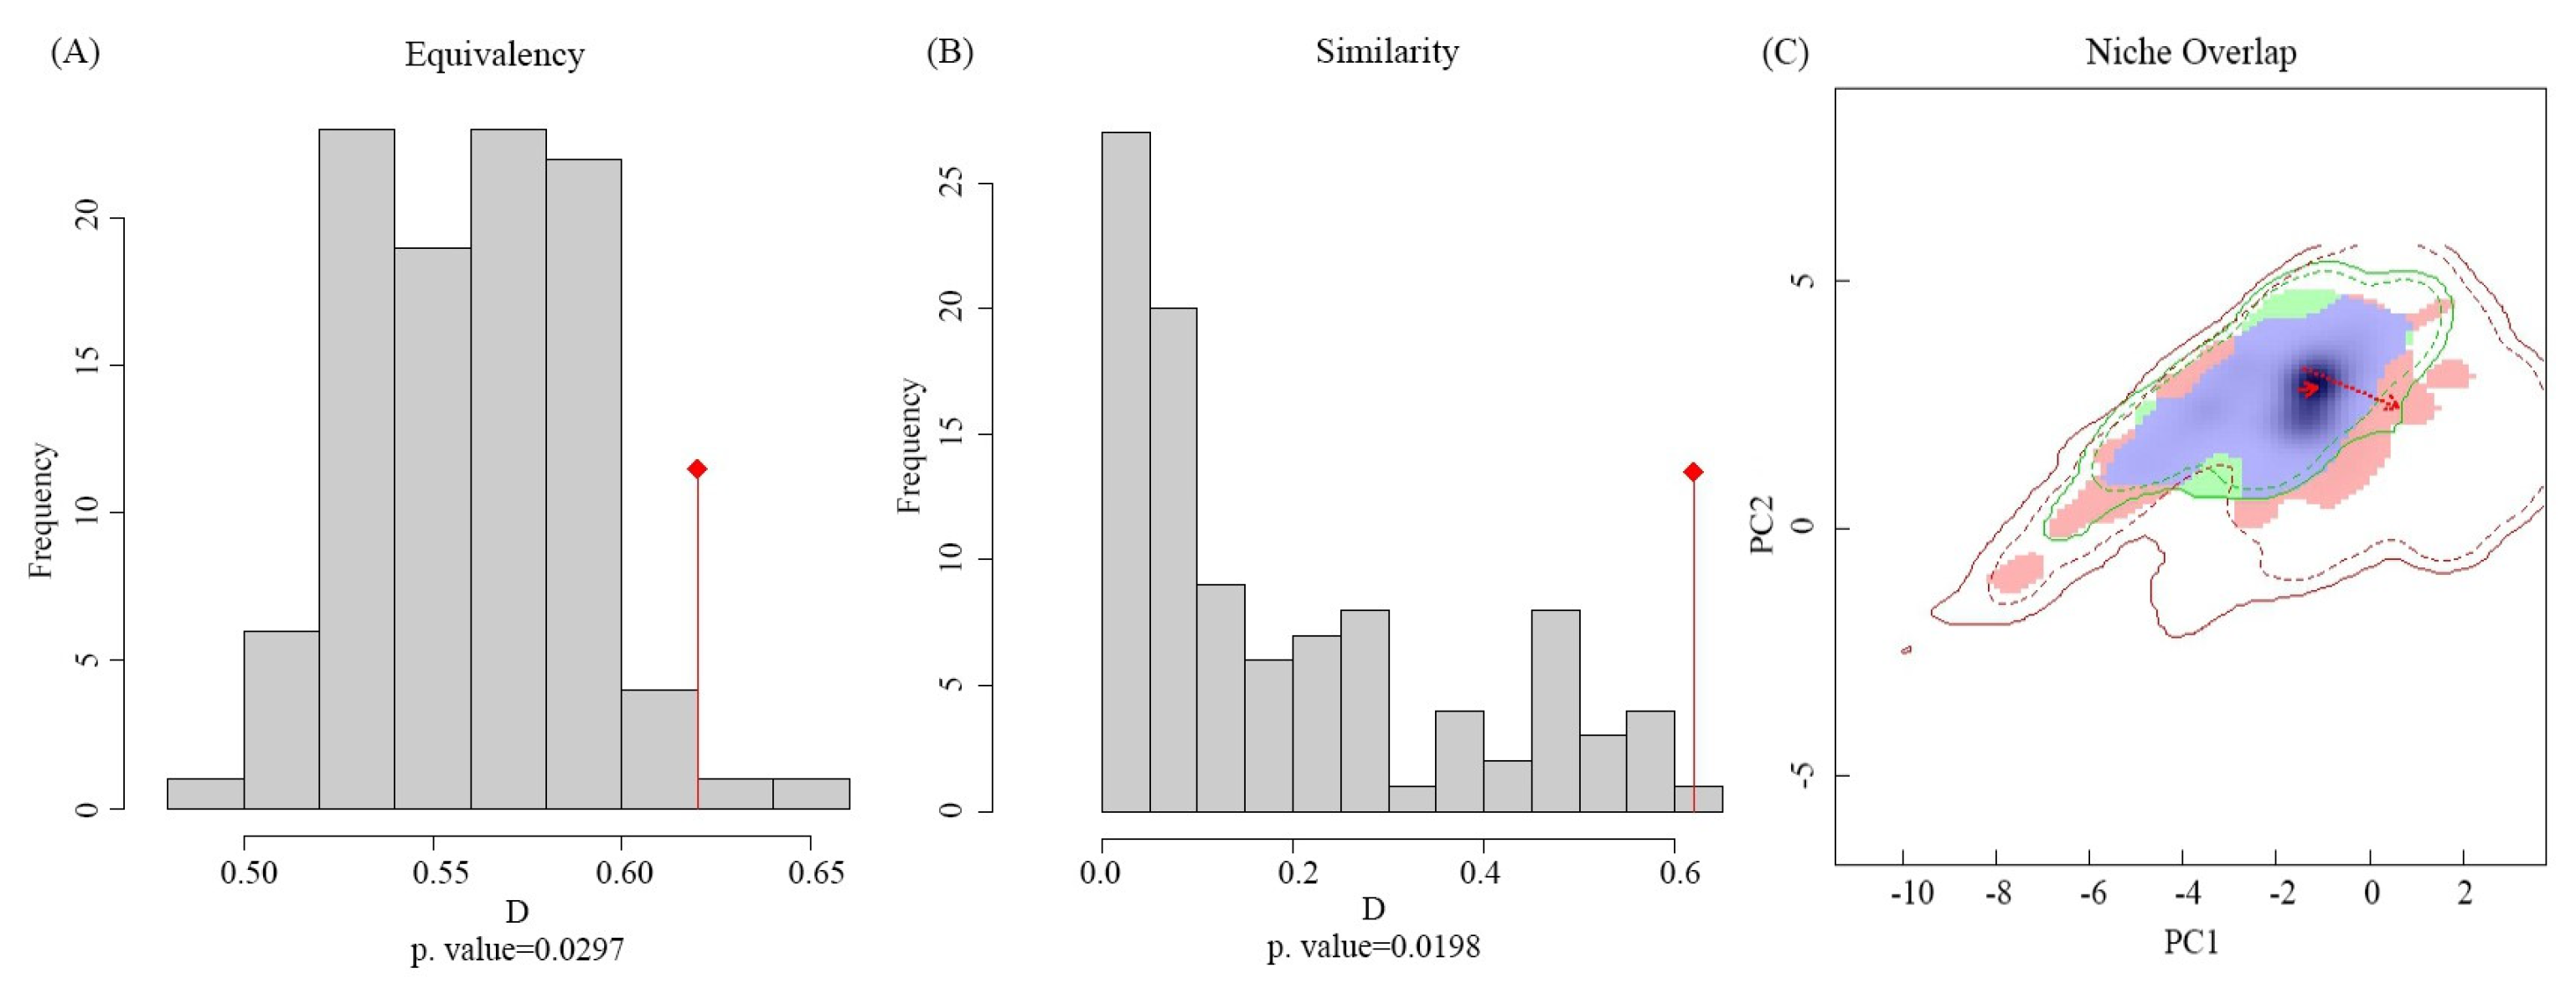
The variation in the ecological niche of S. viarum was verified by comparing the differences in the ecological space between native and invaded countries (Figure 2). The results showed an ecological niche overlap index D of 0.62, indicating a high degree of ecological niche overlap between native and invaded countries. The equivalence (p = 0.0297) and similarity (p = 0.0198) tests indicated that S. viarum occupied a similar, but not identical, ecological niche in native and invaded countries. The values for the stability, expansion, and unfilling of the ecological niche were 0.951, 0.049, and 0.037, respectively. The ecological niche stability value was the highest and was greater than 0.95, indicating a conservative niche after invasion. Overall, the ecological niche of S. viarum expanded to a lesser extent and remained relatively stable.

3.3. Model Performance and Significant Variables

We chose the best model with significant delta values for the parameter optimization results of RM = 0.5 and FC = LQHPT (Figure S1). The AUC for the best model was 0.947 (Figure S2), indicating that the optimized MaxEnt model was excellent for predicting PGDs in S. viarum. Using the jackknife method (Figure S3), bio1, bio12, and bio7 were the three most significant variables. Based on an analysis of the variable contributions (Table S2), bio12, bio1, and bio3 were considered the three most significant variables. Therefore, the significant variables were three temperature factors and one precipitation factor (bio1, bio3, bio7, and bio12). Based on the response curves of the significant variables (Figure S4), the highest suitability probability value for S. viarum was 0.8 at an annual mean temperature of 20 °C. Solanum viarum had the highest suitability probability value of 0.85 when the value of isothermality was 53, annual temperature was 25 °C, and annual precipitation was approximately 1300 mm. Overall, the contribution of the LUC to the model was much smaller than that of the bioclimatic variables.

3.4. PGDs in Forest, Grassland, Cropland, and Urban Ecosystems

The extracted PGDs of S. viarum in forests, grasslands, croplands, and urban ecosystems were distributed over southern and southeastern Asia, western Europe, southern and southeastern North America, Central America, northern and central South America, most of Central and Southeastern Africa, and eastern Oceania based on LUCs under near–current and future climate scenarios (Figure 3). Compared with those in the near–current climate, the predicted total global cropland and urban areas increased significantly under the future climate scenario, and the predicted total forest and grassland areas decreased to some extent (Table 1). However, the PGDs of S. viarum showed an expanding trend regardless of the four ecosystems in which they occurred, particularly in SSP5–8.5, in which the area of S. viarum PGDs reached a maximum in the 2030s and 2050s.
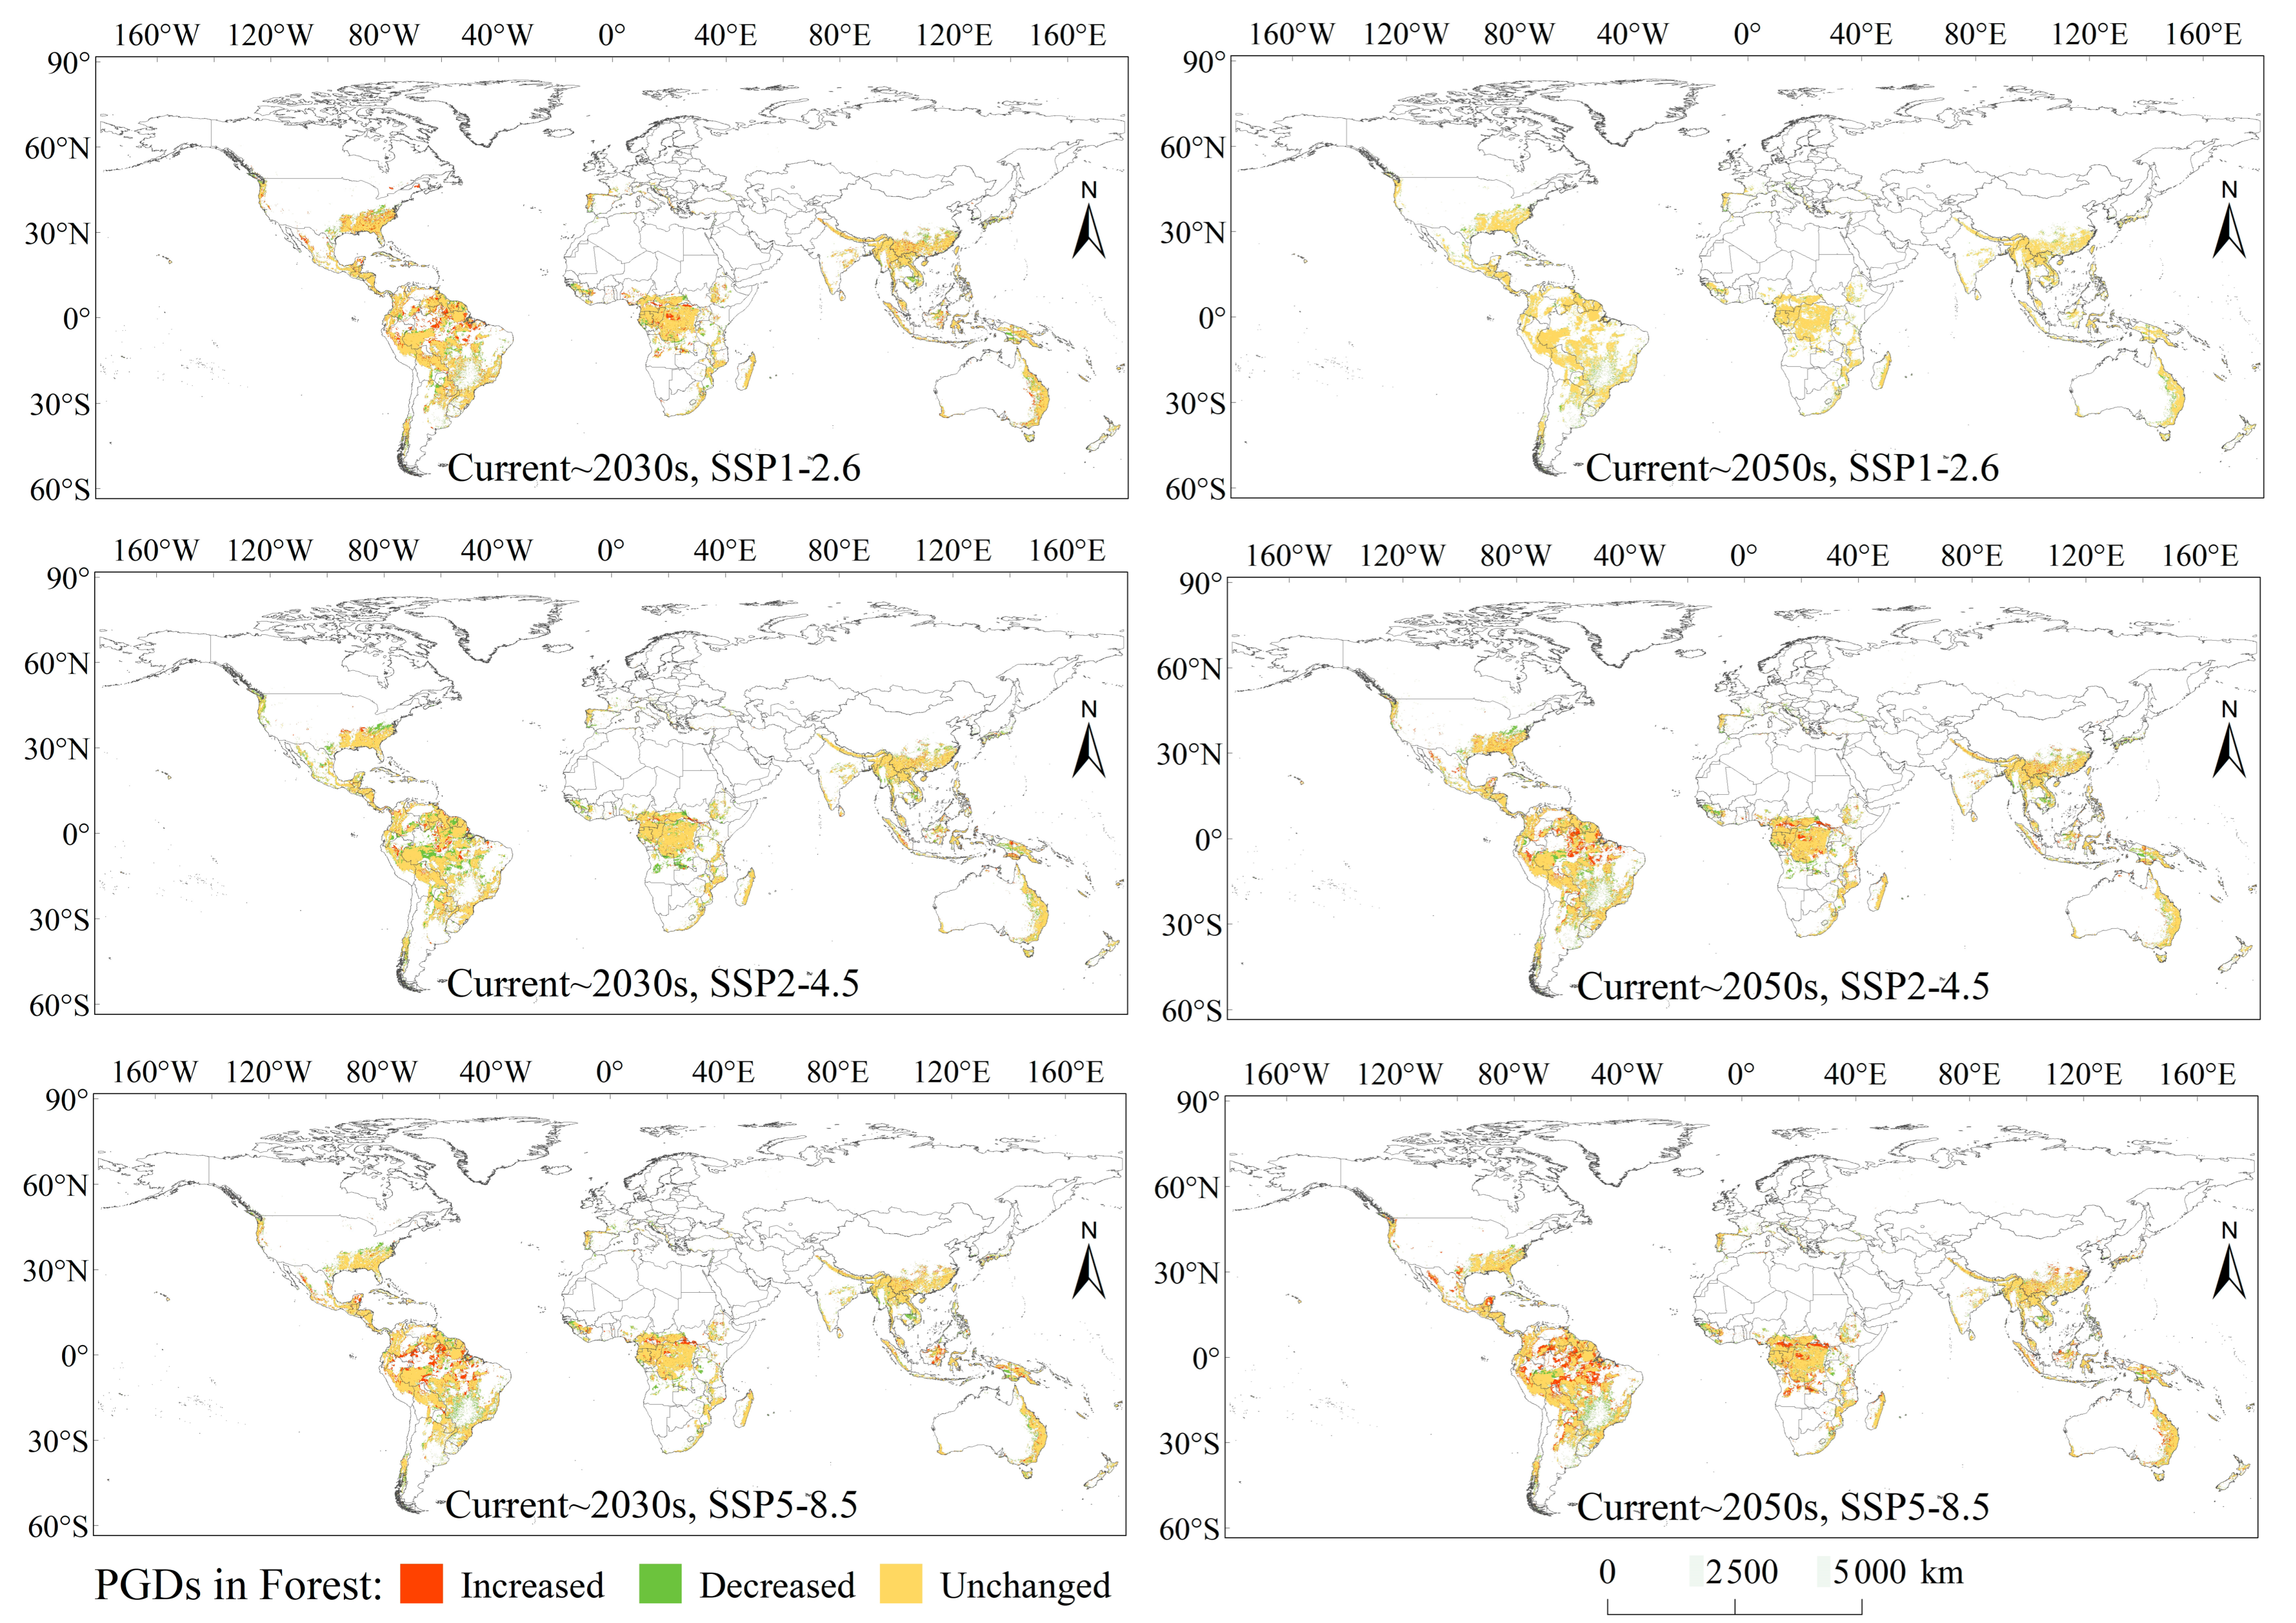
Under the current climate scenario, the PGDs of S. viarum in the forest were mainly in eastern and southern Asia, southeast Asia, eastern North America, Central America, northern and eastern South America, central and southeastern Africa, and eastern Australia, covering an area of 1467.42 km2. The geographical pattern of S. viarum PGDs in the forest did not change significantly under the future climate scenario, but the area of PGDs continued to increase and reached a maximum of 1748.15 km2 under the scenario SSP1–2.6 in the 2050s. Under the current climate scenario, the PGDs of S. viarum in grasslands were mainly found in southern North America, central and eastern South America, southern Africa, and New Zealand, covering an area of 151.83 km2. Under future climate scenarios, the PGDs of S. viarum in grasslands were mainly in southern North America, central and eastern South America, southern Africa, New Zealand in Oceania, and western Europe, with the area reaching a maximum of 159.98 km2 under the SSP2–4.5 scenario in the 2030s. Under the current climate scenario, the PGDs of S. viarum in croplands were mainly in southern Asia, south–central North America, south–central South America, central Africa, southwestern Europe, and eastern Australia, covering an area of 417.49 km2. Under future climate scenarios, the PGDs of S. viarum in croplands were mainly in southern and southeastern Asia, south–central North America, south–central South America, central and southeastern Africa, southwestern Europe, and eastern Australia, with a maximum area of 576.79 km2 under the SSP5–8.5 scenario in the 2050s. Under the near–current climate scenario, the PGDs of S. viarum in urban areas were mainly in southeastern North America and eastern South America, covering an area of 15.25 km2. Under future climate scenarios, the PGDs of S. viarum in urban areas were mainly in eastern Asia, southeastern North America, and eastern South America, with a maximum area of 30.53 km2 under the SSP5–8.5 scenario in the 2050s. Owing to the relatively small area of urban ecosystems globally, S. viarum also had fewer PGDs in urban areas, but not at a lower percentage.

3.5. Variations of PGDs in Forest, Grassland, Cropland, and Urban Ecosystems

In the forest ecosystems (Figure 4), future increases in PGDs were mainly located in northern South America (Peru, Colombia, Venezuela, Brazil, Guyana, and Suriname) and central Africa (Congo and the Democratic Republic of Congo), with more significant increases in the 2050s. The largest area of increased PGDs was 456.53 km2 under the SSP5–8.5 scenario. Future decreases in PGDs were mainly located in eastern North America (USA), central South America (Brazil, Bolivia, Paraguay, and Argentina), central Africa (Central Africa, Gabon, Democratic Republic of Congo, and Tanzania), and southeastern Asia (China, India, Cambodia, Malaysia, and Indonesia), with more significant decreases in the 2050s. Under the SSP5–8.5 scenario, the decreases in PGDs reached the maximum area of 296.25 km2.
In the grassland ecosystems (Figure S5), future increases in PGDs were mainly located in southern North America (USA) and northern South America (Venezuela and Brazil), with more significant increases in the 2050s, and the largest area of increased PGDs was 51.06 km2 under the SSP5–8.5 scenario. Future decreases in PGDs were mainly located in eastern North America (USA), central South America (Bolivia, Paraguay, and Argentina), western Europe (Ireland, UK, and France), central Africa (Central Africa and DRC), and Australia, with more significant decreases in the 2050s. The largest decreases reached an area of 71.86 km2 under the SSP5–8.5 scenario.
In cropland ecosystems (Figure S6), future increases in PGDs were mainly located in eastern South America (Brazil and Argentina), central (Guinea, Côte d’Ivoire, Nigeria, the Democratic Republic of Congo, and Uganda), eastern Africa (Ethiopia, Tanzania, Mozambique, and South Africa), eastern (China) and southern Asia (India, Myanmar, Thailand, Philippines, and Indonesia), and Australia, with a more significant increase in the 2050s. The largest increase in PGDs reached 231.72 km2 under the SSP5–8.5 scenario. Future decreases in PGDs were mainly observed in North America (USA), Western Europe (France, Spain, and Portugal), Central Africa (Democratic Republic of Congo and Tanzania), Southern Asia (Thailand and Vietnam), and Australia, with more significant decreases in the 2050s, and the largest area being 137.85 km2 under the SSP2–4.5 scenario.
In urban ecosystems (Figure S7), the area of the PGDs did not decrease but continued to increase, with distributions in southeastern North America (USA), eastern South America (Brazil and Argentina), western Africa (Nigeria), eastern Asia (China), and Australia. The increase was more pronounced in the 2050s. Under SSP5–8.5, the area of increased PGDs reached its largest, at approximately 51.06 km2.

3.6. Suitability Probabilities along Latitudinal Gradients

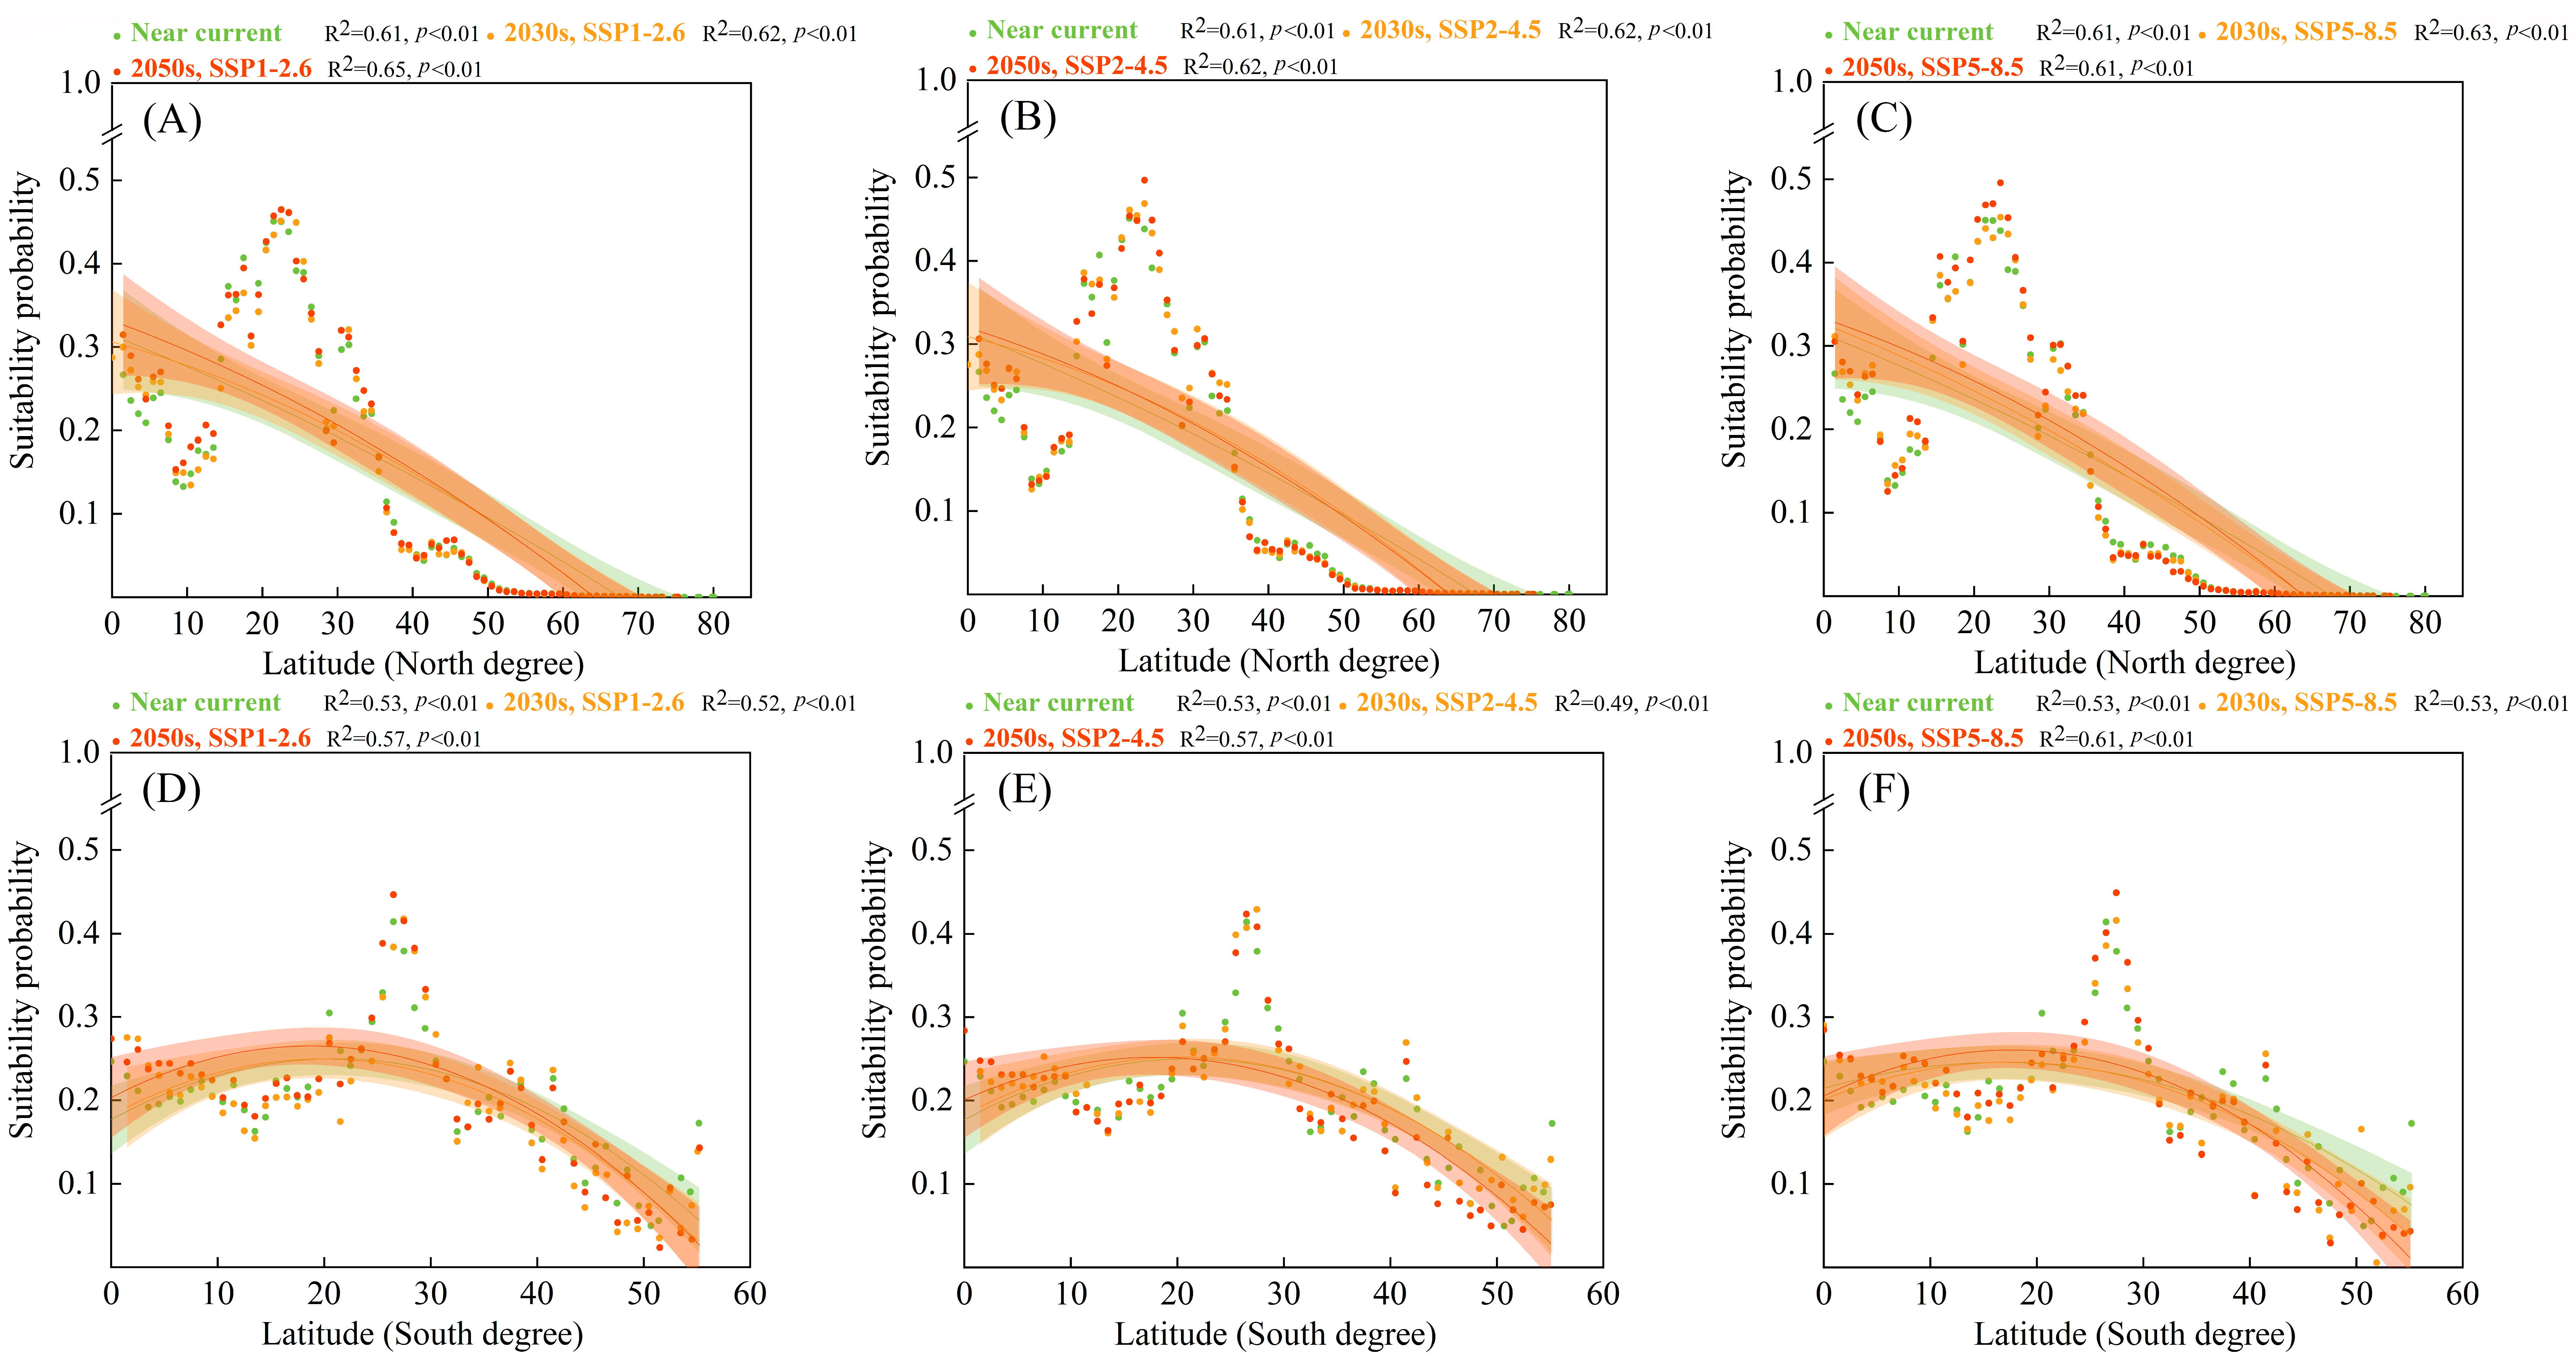
In the forest ecosystem (Figure 5), high suitability probabilities for S. viarum along latitudinal gradients were distributed within approximately 20–30° in the Northern and Southern Hemispheres. The high suitability probabilities for S. viarum shifted toward higher latitudes. In the Northern hemisphere, the highest suitability probabilities for S. viarum in the forest ecosystem were mainly located at 22.1°, whereas under the same future scenario, the highest future suitability probabilities for S. viarum were located at 23.5° under the SSP5–8.5 scenario in the 2050s, with an increase of 1.4°. In the Southern hemisphere, the highest suitability probabilities for S. viarum were mainly located at 26.5°, whereas under the same future scenario, the highest suitability probability for S. viarum was located at 27.9°.
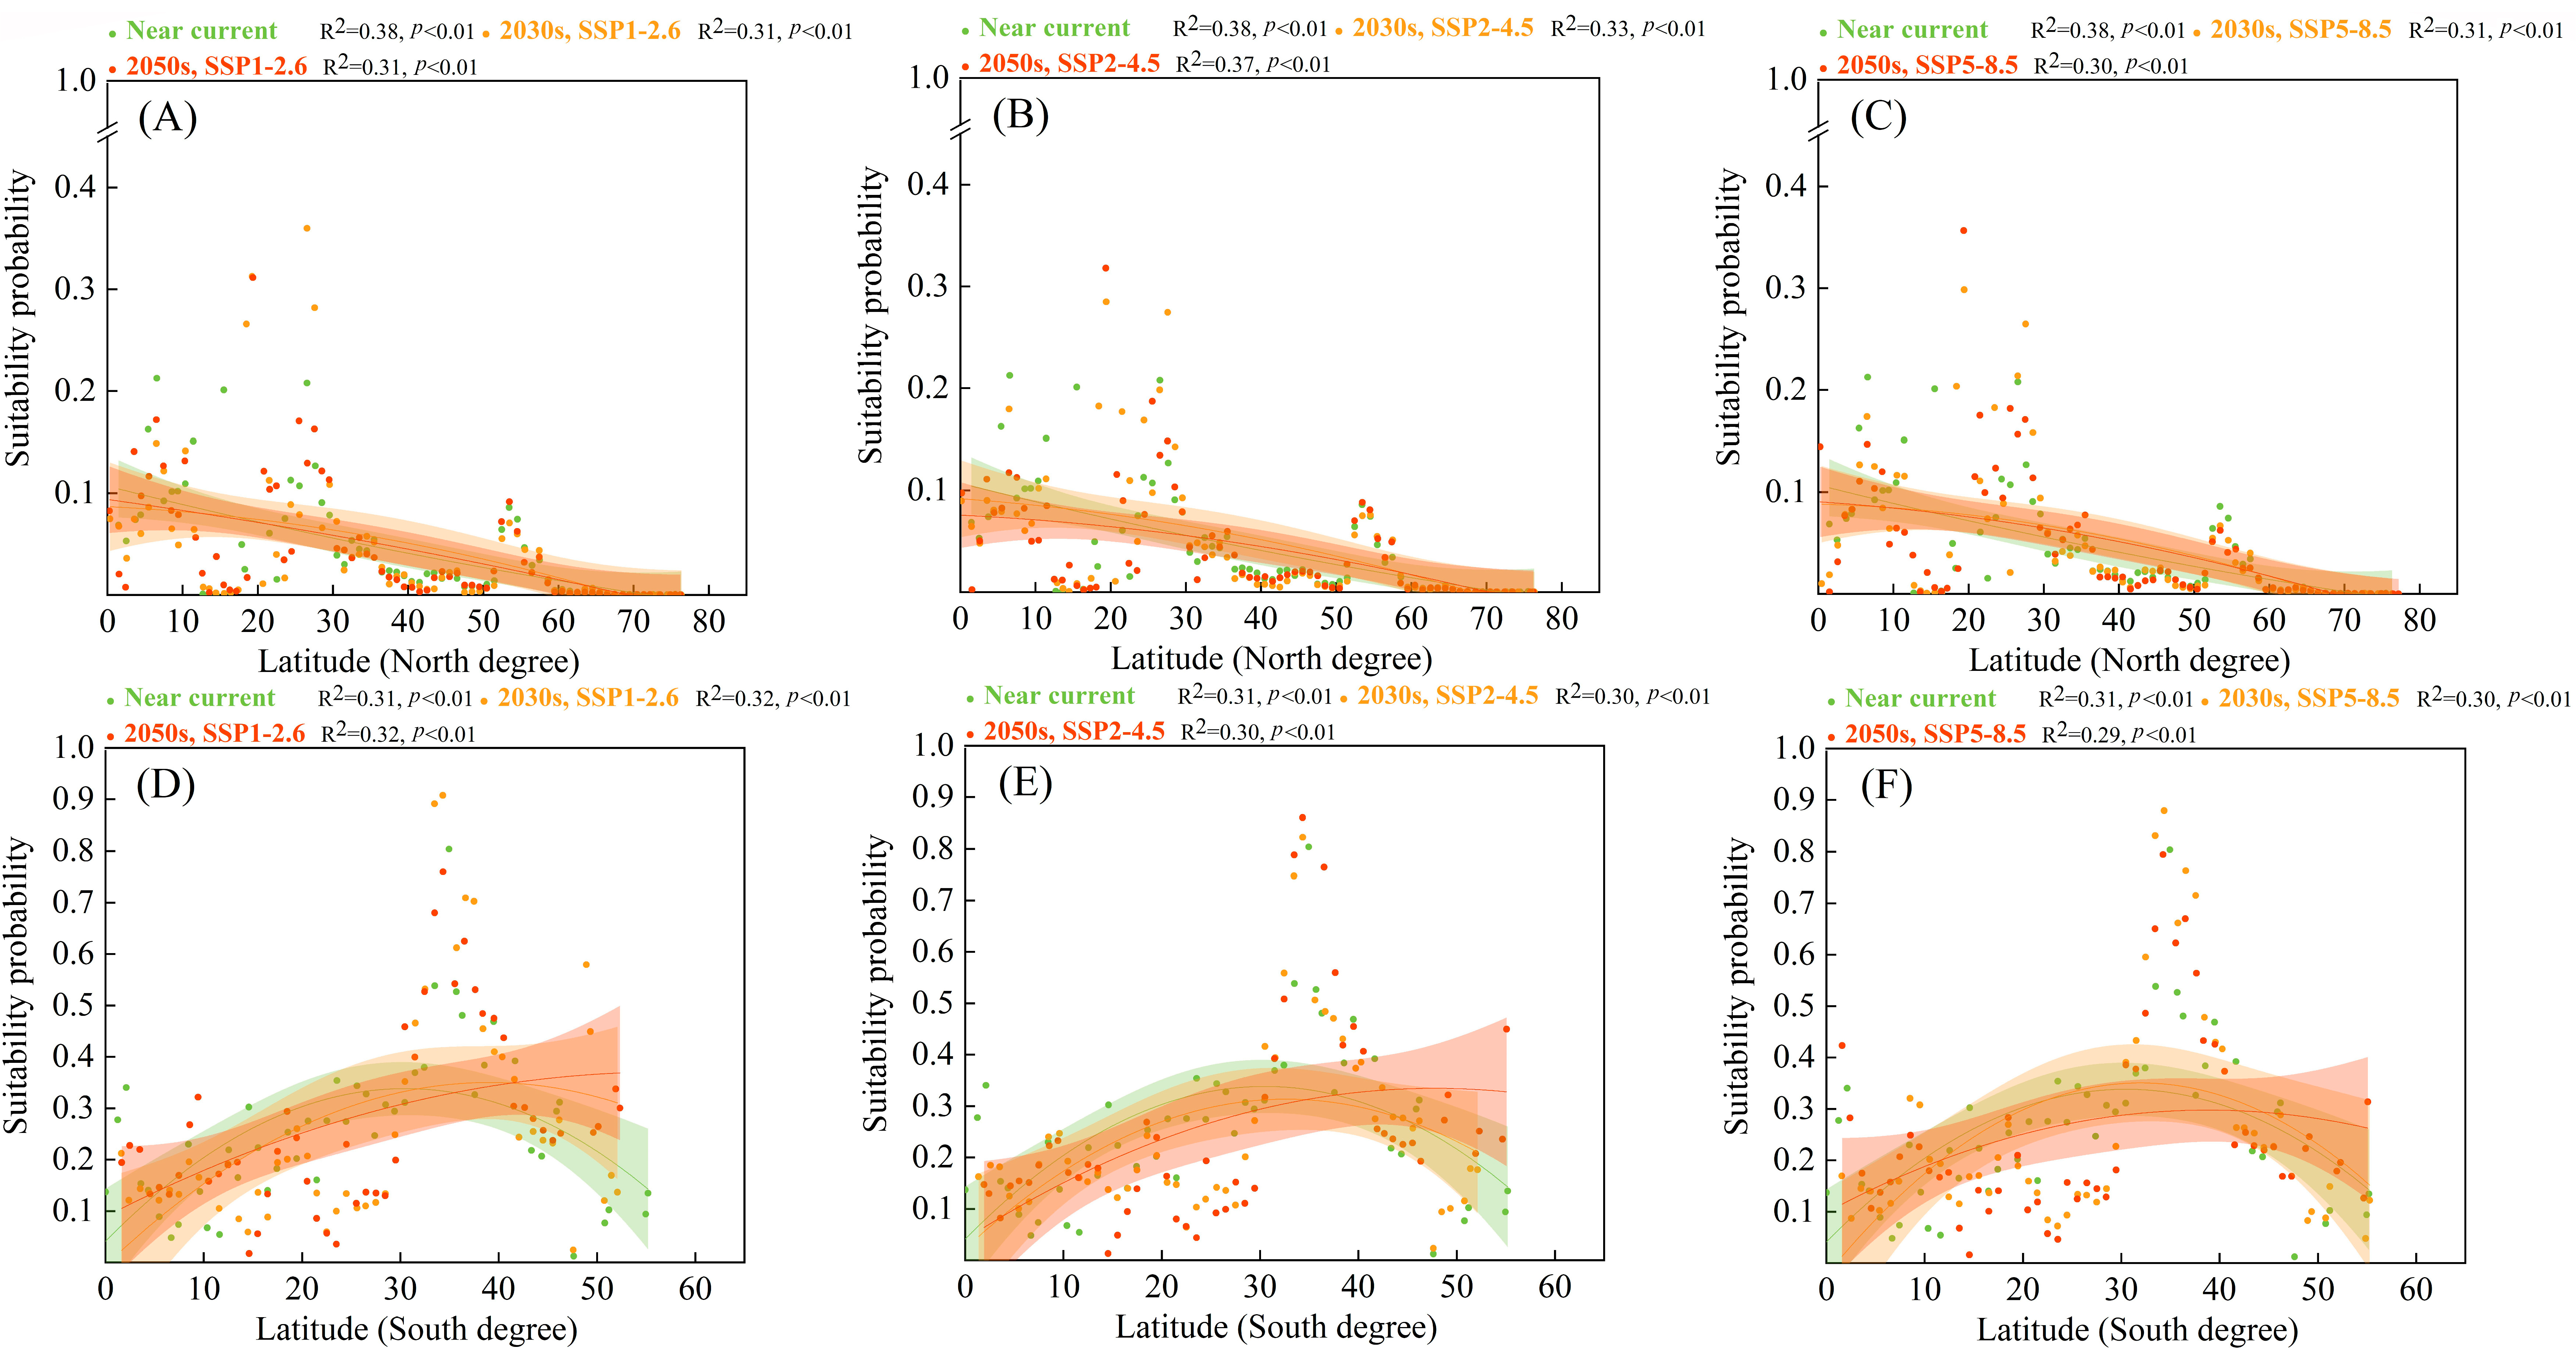
In the grassland ecosystem (Figure 6), the distribution of high suitability probabilities for S. viarum in the Northern and Southern hemispheres differed significantly with latitude. However, the high suitability probabilities of S. viarum shifted toward higher latitudes. In the Northern hemisphere, the highest suitability probabilities for S. viarum in the grassland ecosystems were mainly located from 15.5° to 27.5°, and toward 30° in the future. In the Southern hemisphere, the highest suitability probabilities for S. viarum were located from 33.1° to 42.8° and toward 40° in the future.
In the cropland ecosystem (Figure 7), the high suitability probabilities for S. viarum along the latitudinal gradients were distributed within approximately 20–30° in the Northern and Southern hemispheres. The high suitability probabilities for S. viarum shifted toward higher latitudes. In the Northern hemisphere, the high suitability probabilities for S. viarum in the cropland ecosystem were mainly located at 4.5° and 23.5°, shifting toward 25° under the SSP5–8.5 scenario in the 2050s. In the Southern hemisphere, the high suitability probabilities for S. viarum in the cropland ecosystem were mainly located at 21.6° and 24.2°, shifting toward 25° under the SSP5–8.5 scenario in the 2050s.
In the urban ecosystem (Figure 8), high suitability probabilities for S. viarum along latitudinal gradients were distributed within approximately 20–35° in the Northern and Southern hemispheres. The high suitability probabilities for S. viarum were dense in urban ecosystems and reached higher latitudes. In the Northern hemisphere, the high suitability probability for S. viarum in urban ecosystems shifted from approximately 30° to greater than 30°. In the Southern Hemisphere, the high suitability probabilities for S. viarum shifted toward 25° and even 30°.

4. Discussion

The tropical soda apple (S. viarum) is a troublesome invasive plant, and its global invasion has disturbed biodiversity and economics. However, this issue has received insufficient attention. Previous studies have focused primarily on its biological properties and hazards [11,15]. Few studies have examined potentially suitable areas, yet they have focused on localized areas [45]. Therefore, the present study is the first attempt to reconstruct the global invasion history of S. viarum, verify its ecological niche conservation, and predict PGDs using MaxEnt to provide theoretical guidance for early warning and prevention.

4.1. Reconstruction of Invasion History

The spread of invasive species is classified into three phases (lag, spread, and equilibrium), which can help determine the stage and process of invasion [21]. Our study showed that these three phases also apply to the global invasion patterns of S. viarum. S. viarum is mainly carried by wind or rivers and was mis—introduced as a potential fruit in South America and nearby (a few countries in Africa and Asia) in the lag phase (before 1980) [13]. Archaeological evidence suggests that human activity began to expand in the mid–to–late Holocene; alien plants were often transported as food by contemporary humans [46]. However, this hypothesis remains controversial [47]. The number of countries that S. viarum spread to in this phase was small, and no large–scale spread had yet occurred. There was an increase in the spread of S. viarum during the spread phase (1980–2010), with several continents invaded (except for Europe and Antarctica). Global plant trade networks emerged in the 18th and 19th centuries when alien plants began to appear frequently in non–native wild areas, particularly in the 19th century [48]. Increased trade in species, the complexity of trade networks, improved long–distance connectivity, and new trade patterns contributed to S. viarum invasion [49]. As a major source of pharmaceutical compounds (especially solasodine), S. viarum established colonies along trade routes and rapidly expanded during this phase. Solanum viarum successfully spread to all continents (except Antarctica) in the equilibrium phase (2010–present). Although the number of countries affected by S. viarum continues to increase, its spread rate has decreased significantly. Because S. viarum occupies an invasive ecological niche, when the ecological niche reaches saturation, a relative equilibrium state is formed [50]. However, symbiotic and antagonistic relationships may have arisen between S. viarum and native species, that is, potential competition is reduced or expansion is inhibited [51]. Biological control and management measures may be implemented to limit and mitigate the spread of S. viarum [52]. The equilibrium phase of S. viarum invasion does not imply that it no longer poses a threat to native organisms and ecosystems. Therefore, early warning and prevention of S. viarum invasion are essential to protect the integrity of ecosystems.

4.2. Ecological Niches and PGDs in Different Ecosystem

Many invasive plants expand their range to adapt to global change, and the extent to which their ecological niche changes following invasion has become a focus of biogeographic research [53]. Our study concluded that S. viarum has rapidly expanded its invasive range globally but largely occupies the same realized ecological niches as its native ranges, indicating ecological niche conservatism. This is inextricably linked to the biological characteristics of S. viarum [45]. Because of its limited drought tolerance, S. viarum thrives under hot and humid conditions [54]. A lack of precipitation limits photosynthesis in S. viarum leaves, and annual precipitation determines whether it can grow normally during the dry season [18]. The range of annual precipitation to which S. viarum is adapted in native countries (e.g., Brazil) is 800–1800 mm, with little variation in invaded countries. This suggests that it occupies a similar ecological space after invasion and has evolved adaptively to the environment [55]. A key insight from these results is that ecological niche variations cannot be ignored when predicting the future spatial distribution of species. SDMs are commonly used to predict expansion or invasion based on the premise that species maintain their original ecological niche when colonizing new habitats [56]. The conservative ecological niche of S. viarum demonstrated the excellent predictive ability of the MaxEnt model and provided assurance for the prediction of PGDs in different ecosystems.
Global changes affect the PGDs of S. viarum in different ecosystems. Studies have shown that climate change is already destroying parts of forests, and this species continues to migrate to higher latitudes (even polar regions) [57,58]. This is consistent with the results of this study. This trend is expected to become more pronounced under future climate change [57,59,60]. International trade, climate change, and LUC jointly influenced the PGDs of S. viarum; however, the first two factors were more significant. Although international trade and climate change play a dominant role in the distribution of S. viarum on a large spatial scale (i.e., global), LUC exerts a greater influence on a small spatial scale [61]. In the future, urban land is expected to continue to increase because of urbanization and population booms. The cropland area will also expand because an increasing number of people are in urgent need of food [62,63]. Anthropogenic activity promotes S. viarum invasion. This is consistent with our prediction that the areas of PGDs in croplands and urban ecosystems will continue to increase. In the future, PGDs will continue to expand under global change, and the risk assessment of S. viarum will contribute to an in–depth understanding of its spread dynamics.

4.3. Early Warning and Prevention Efforts

Invasive plants can spread through both natural and anthropogenic means [13]. Human activities, such as international trade and travel, help them cross geographical barriers and be introduced to distant countries where they do not occur. Globalization may exacerbate this problem [64]. A previous study suggested that unintentional human carriage is responsible for the spread of S. viarum in Africa [45]. Therefore, countries with suitable conditions for S. viarum that have not yet been invaded, particularly the Philippines, New Zealand, the United Kingdom, and Ireland, which are major agricultural and livestock countries [65], should focus on the global trade of plant and livestock vectors that can transport S. viarum seeds, seedlings, and fruits. Countries at risk of invasion should adopt appropriate quarantine measures to prevent the introduction of weeds. For example, in New Zealand, centralized livestock management is the main method used to control this weed [66]. Countries already invaded by S. viarum should intensify on–farm control using hexazinone and imazapyr herbicides [67] or release the natural enemy Gratiana boliviana [14]. All countries need to establish more effective quarantine processes at international borders, which are essential for interrupting the international transmission routes of S. viarum. Future global changes will increase the threat to countries, such as the United States, Nigeria, China, and Australia. Because there is usually a time lag between large–scale outbreaks and observations [68], these countries should establish a sound system for early monitoring and timely control.

5. Conclusions

Under global change, S. viarum has become widespread across six continents (except Antarctica), with 156 countries remaining uninvaded. The invasion history of S. viarum went through a lag phase (before 1980), spread phase (1980–2010), and equilibrium phase (2010–present). Moreover, the ecological niche of S. viarum remains conserved. The main ecosystems in which S. viarum is suitable are forests, grasslands, croplands, and urban areas; croplands and urban areas will become more suitable in the future. The PGDs in all four ecosystems continued to expand and were expected to reach a maximum in the 2050s under the SSP5–8.5 scenario. The latitudes subject to high threats range from 20° to 30° in forest and cropland ecosystems, 15.5° to 27.5° (northern hemisphere), 33.1° to 42.8° (southern hemisphere) in grassland ecosystems, and 20° to 35° in urban ecosystems. Global change has led to an increased threat by S. viarum at high latitudes. Analysis of the invasion history, ecological niche shifts, and future distribution dynamics provides a more reliable risk assessment for S. viarum.

Supplementary Materials

The following supporting information can be downloaded at: https://www.mdpi.com/article/10.3390/biology12091179/s1, Table S1: Occurrence records of Solanum viarum details; Table S2: Environmental variable contributions related to the distribution of Solanum viarum; Figure S1: Parameter optimization results of Maxent on the occurrence records of Solanum viarum; Figure S2: The Maxent model performance results; Figure S3: Results of the jackknife test of variable importance; Figure S4: Response curves of important variables; Figure S5: Variations of PGDs in grassland under climate changes; Figure S6: Variations of PGDs in cropland under climate changes; Figure S7: Variations of PGDs in urban under climate changes.

Author Contributions

Conceptualization, Y.Q., X.X., H.Z. and W.L.; methodology, Y.Q.; software, Y.Q.; validation, Y.Q., X.X., W.Y. and W.L.; formal analysis, Y.Q., X.X. and H.Z.; investigation, Y.Q., Y.Z. and M.Y.; resources, Y.Q., H.Z., M.Y. and Y.Z.; data curation, Y.Q.; writing—original draft preparation, Y.Q.; writing—review and editing, Y.Q., X.X. and H.Z.; visualization, Y.Q.; supervision, Y.Q., X.X. and W.L.; project administration, X.X., W.Y. and W.L.; funding acquisition, W.L. All authors have read and agreed to the published version of the manuscript.

Funding

This research was funded by the National Key R&D Program of China (grant No. 2021YFC2600400) and Technology Innovation Program of Chinese Academy of Agricultural Sciences (grant No. caascx–2022–2025–IAS).

Institutional Review Board Statement

Not applicable.

Informed Consent Statement

Not applicable.

Data Availability Statement

The data presented in this study are available in this article.

Conflicts of Interest

The authors declare no conflict of interest.

References

  1. Sitzia, T.; Campagnaro, T.; Kotze, D.J.; Nardi, S.; Ertani, A. The invasion of abandoned fields by a major alien tree filters understory plant traits in novel forest ecosystems. Sci. Rep. 2018, 8, 8410. [Google Scholar] [CrossRef] [PubMed]
  2. Skubel, S.A.; Su, X.; Poulev, A.; Foxcroft, L.C.; Dushenkov, V.; Raskin, I. Metabolomic differences between invasive alien plants from native and invaded habitats. Sci. Rep. 2020, 10, 9749. [Google Scholar] [CrossRef] [PubMed]
  3. Vilà, M.; Pujadas, J. Land–use and socio–economic correlates of plant invasions in European and North African countries. Biol. Conserv. 2001, 100, 397–401. [Google Scholar] [CrossRef]
  4. Capinha, C.; Essl, F.; Seebens, H.; Moser, D.; Pereira, H.M. The dispersal of alien species redefines biogeography in the Anthropocene. Science 2015, 348, 1248–1251. [Google Scholar] [CrossRef] [PubMed]
  5. Hulme, P.E. Unwelcome exchange: International trade as a direct and indirect driver of biological invasions worldwide. One Earth 2021, 4, 666–679. [Google Scholar] [CrossRef]
  6. Lu, X.; Siemann, E.; Shao, X.; Wei, H.; Ding, J. Climate warming affects biological invasions by shifting interactions of plants and herbivores. Glob. Chang. Biol. 2013, 19, 2339–2347. [Google Scholar] [CrossRef] [PubMed]
  7. Brothers, T.S.; Spingarn, A. Forest fragmentation and alien plant invasion of central Indiana old–growth forests. Conserv. Biol. 1992, 6, 91–100. [Google Scholar] [CrossRef]
  8. Carlson, B.S.; Rotics, S.; Nathan, R.; Wikelski, M.; Jetz, W. Individual environmental niches in mobile organisms. Nat. Commun. 2021, 12, 4572. [Google Scholar] [CrossRef] [PubMed]
  9. Janssens, C.; Havlik, P.; Krisztin, T.; Baker, J.; Frank, S.; Hasegawa, T.; Leclere, D.; Ohrel, S.; Ragnauth, S.; Schmid, E.; et al. International trade is a key component of climate change adaptation. Nat. Clim. Chang. 2021, 11, 915–916. [Google Scholar] [CrossRef]
  10. Dalmazzone, S.; Giaccaria, S. Economic drivers of biological invasions: A worldwide, bio–geographic analysis. Ecol. Econ. 2014, 105, 154–165. [Google Scholar] [CrossRef]
  11. Randall, R.P. A Global Compendium of Weeds; RP Randall: South Perth, Australia, 2017. [Google Scholar]
  12. Nee, M. Synopsis of Solanum in the New World. In Solanaceae IV: Advances in Biology and Utilization; Royal Botanic Gardens, Kew: Richmond, UK, 1999; pp. 285–333. [Google Scholar]
  13. CABI Database. Available online: https://www.cabidigitallibrary.org/doi/10.1079/cabicompendium.50562 (accessed on 20 June 2023).
  14. Medal, J.; Bustamante, N.; Overholt, W.; Diaz, R.; Stansly, P.; Roda, A.; Amalin, D.; Hibbard, K.; Gaskalla, R.; Sellers, B.; et al. Biological control of Tropical soda apple (Solanaceae) in Florida: Post–release evaluation. Fla Entomol. 2010, 93, 130–132. [Google Scholar] [CrossRef]
  15. Singha, H.R.; Sinha, S.; Sinha, R.K. Karyomorphology of Solanum viarum Dunal–an ethnomedicinal species of Tripura. Vegetos 2016, 29, 65–68. [Google Scholar] [CrossRef]
  16. Welman, W.G. The genus Solanum (Solanaceae) in southern Africa: Subgenus Leptostemonum, the introduced sections Acanthophora and Torva. Bothalia 2003, 33, 1–18. [Google Scholar] [CrossRef]
  17. Bryson, C.T.; Reddy, K.N.; Byrd, J.D., Jr. Growth, development, and morphological differences among native and nonnative prickly nightshades (Solanum spp.) of the southeastern United States. Invasive Plant Sci. Manag. 2012, 5, 341–352. [Google Scholar] [CrossRef]
  18. Medal, J.C.; Charudattan, R.; Mullahey, J.J.; Pitelli, R.A. An exploratory insect survey of tropical soda apple in Brazil and Paraguay. Fla Entomol. 1996, 79, 70–73. [Google Scholar] [CrossRef]
  19. USDA Natural Resources Conservation Service. The Plants Database. Available online: http://plants.usda.gov/ (accessed on 20 June 2023).
  20. EPPO Global Database. Available online: https://gd.eppo.int/taxon/SOLVI/categorization (accessed on 20 June 2023).
  21. Aikio, S.; Duncan, R.P.; Hulme, P.E. Lag–phases in alien plant invasions: Separating the facts from the artefacts. Oikos 2010, 119, 370–378. [Google Scholar] [CrossRef]
  22. Phillips, S.J.; Dudik, M. Modeling of species distributions with Maxent: New extensions and a comprehensive evaluation. Ecography 2008, 31, 161–175. [Google Scholar] [CrossRef]
  23. Guisan, A.; Petitpierre, B.; Broennimann, O.; Daehler, C.; Kueffer, C. Unifying niche shift studies: Insights from biological invasions. Trends Ecol. Evol. 2014, 29, 260–269. [Google Scholar] [CrossRef]
  24. Pili, A.N.; Tingley, R.; Sy, E.Y.; Diesmos, M.L.L.; Diesmos, A.C. Niche shifts and environmental non–equilibrium undermine the usefulness of ecological niche models for invasion risk assessments. Sci. Rep. 2020, 10, 7972. [Google Scholar] [CrossRef]
  25. Urvois, T.; Auger–Rozenberg, M.A.; Roques, A.; Rossi, J.P.; Kerdelhue, C. Climate change impact on the potential geographical distribution of two invading Xylosandrus ambrosia beetles. Sci. Rep. 2021, 11, 1339. [Google Scholar] [CrossRef]
  26. Cao, J.; Xu, J.; Pan, X.; Monaco, T.A.; Zhao, K.; Wang, D.; Rong, Y. Potential impact of climate change on the global geographical distribution of the invasive species, Cenchrus spinifex (Field sandbur, Gramineae). Ecol. Indic. 2021, 131, 108204. [Google Scholar] [CrossRef]
  27. Puchalka, R.; Dyderski, M.K.; Vitkova, M.; Sadlo, J.; Klisz, M.; Netsvetov, M.; Prokopuk, Y.; Matisons, R.; Mionskowski, M.; Wojda, T.; et al. Black locust (Robinia pseudoacacia L.) range contraction and expansion in Europe under changing climate. Glob. Chang. Biol. 2021, 27, 1587–1600. [Google Scholar] [CrossRef] [PubMed]
  28. Murray, J.V.; Stokes, K.E.; van Klinken, R.D. Predicting the potential distribution of a riparian invasive plant: The effects of changing climate, flood regimes and land–use patterns. Glob. Chang. Biol. 2012, 18, 1738–1753. [Google Scholar] [CrossRef]
  29. Dyderski, M.; Zarnowiec, J.; Stebel, A.; Chmura, D. Propagule pressure and land–use are more important than climate for invasive bryophytes regional distributions. Landsc. Ecol. 2022, 37, 1871–1884. [Google Scholar] [CrossRef]
  30. Warren, D.L.; Glor, R.E.; Turelli, M. ENMTools: A toolbox for comparative studies of environmental niche models. Ecography 2010, 33, 607–611. [Google Scholar] [CrossRef]
  31. Brown, J.L.; Hill, D.J.; Dolan, A.M.; Carnaval, A.C.; Haywood, A.M. PaleoClim, high spatial resolution paleoclimate surfaces for global land areas. Sci. Data 2018, 5, 180254. [Google Scholar] [CrossRef]
  32. Fick, S.E.; Hijmans, R.J. WorldClim 2: New 1–km spatial resolution climate surfaces for global land areas. Int. J. Climatol. 2017, 37, 4302–4315. [Google Scholar] [CrossRef]
  33. Frieler, K.; Lange, S.; Piontek, F.; Reyer, C.P.O.; Schewe, J.; Warszawski, L.; Zhao, F.; Chini, L.; Denvil, S.; Emanuel, K.; et al. Assessing the impacts of 1.5 °C global warming—Simulation protocol of the Inter–Sectoral Impact Model Intercomparison Project (ISIMIP2b). Geosci. Model Dev. 2017, 10, 4321–4345. [Google Scholar] [CrossRef]
  34. Hurtt, G.C.; Chini, L.; Sahajpal, R.; Frolking, S.; Bodirsky, B.L.; Calvin, K.; Doelman, J.C.; Fisk, J.; Fujimori, S.; Goldewijk, K.K.; et al. Harmonization of global land use change and management for the period 850–2100 (LUH2) for CMIP6. Geosci. Model Dev. 2020, 13, 5425–5464. [Google Scholar] [CrossRef]
  35. Javidan, N.; Kavian, A.; Pourghasemi, H.R.; Conoscenti, C.; Jafarian, Z.; Rodrigo–Comino, J. Evaluation of multi–hazard map produced using MaxEnt machine learning technique. Sci. Rep. 2021, 11, 6496. [Google Scholar] [CrossRef]
  36. Betts, M.G.; Yang, Z.Q.; Hadley, A.S.; Smith, A.C.; Rousseau, J.S.; Northrup, J.M.; Nocera, J.J.; Gorelick, N.; Gerber, B.D. Forest degradation drives widespread avian habitat and population declines. Nat. Ecol. Evol. 2022, 6, 709–719. [Google Scholar] [CrossRef] [PubMed]
  37. Cobos, M.E.; Peterson, A.T.; Barve, N.; Osorio–Olvera, L. kuenm: An R package for detailed development of ecological niche models using Maxent. PeerJ 2019, 7, 15. [Google Scholar] [CrossRef] [PubMed]
  38. Zhao, H.X.; Xian, X.Q.; Zhao, Z.H.; Zhang, G.F.; Liu, W.X.; Wan, F.H. Climate change increases the expansion risk of Helicoverpa zea in China According to potential geographical distribution estimation. Insects 2022, 13, 79. [Google Scholar] [CrossRef] [PubMed]
  39. Broennimann, O.; Fitzpatrick, M.C.; Pearman, P.B.; Petitpierre, B.; Pellissier, L.; Yoccoz, N.G.; Thuiller, W.; Fortin, M.-J.; Randin, C.; Zimmermann, N.E.; et al. Measuring ecological niche overlap from occurrence and spatial environmental data. Glob. Ecol. Biogeogr. 2012, 21, 481–497. [Google Scholar] [CrossRef]
  40. Hill, M.P.; Terblanche, J.S. Niche Overlap of Congeneric Invaders Supports a Single–Species Hypothesis and Provides Insight into Future Invasion Risk: Implications for Global Management of the Bactrocera dorsalis Complex. PLoS ONE 2014, 9, e90121. [Google Scholar] [CrossRef] [PubMed]
  41. Hill, M.P.; Gallardo, B.; Terblanche, J.S. A global assessment of climatic niche shifts and human influence in insect invasions. Glob. Ecol. Biogeogr. 2017, 26, 679–689. [Google Scholar] [CrossRef]
  42. Warren, D.L.; Glor, R.E.; Turelli, M. Environmental niche equivalency versus conservatism: Quantitative approaches to niche evolution. Evolution 2011, 62, 2868–2883. [Google Scholar] [CrossRef]
  43. Di Cola, V.; Broennimann, O.; Petitpierre, B.; Breiner, F.T.; D’Amen, M.; Randin, C.; Engler, R.; Pottier, J.; Pio, D.; Dubuis, A.; et al. ecospat: An R package to support spatial analyses and modeling of species niches and distributions. Ecography 2017, 40, 774–787. [Google Scholar] [CrossRef]
  44. Marchioro, C.A.; Krechemer, F.S. Reconstructing the biological invasion of Tuta absoluta: Evidence of niche shift and its consequences for invasion risk assessment. J. Pest Sci. 2023, 1, 1–15. [Google Scholar] [CrossRef]
  45. Waheed, M.; Arshad, F.; Majeed, M.; Haq, S.M.; Aziz, R.; Bussmann, R.W.; Ali, K.; Subhan, F.; Jones, D.A.; Zaitouny, A. Potential distribution of a noxious weed (Solanum viarum Du–nal), current status, and future invasion risk based on MaxEnt modeling. Geol. Eco. Landsc. 2023, 12, 1–16. [Google Scholar] [CrossRef]
  46. Boivin, N.L.; Zeder, M.A.; Fuller, D.Q.; Crowther, A.; Larson, G.; Erlandson, J.M.; Denham, T.; Petraglia, M.D. Ecological consequences of human niche construction: Examining long–term anthropogenic shaping of global species distributions. Proc. Natl. Acad. Sci. USA 2016, 113, 6388–6396. [Google Scholar] [CrossRef]
  47. Fiacconi, M.; Hunt, C.O. Pollen taphonomy at Shanidar Cave (Kurdish Iraq): An initial evaluation. Rev. Palaeobot. Palynol. 2015, 223, 87–93. [Google Scholar] [CrossRef]
  48. van Kleunen, M.; Essl, F.; Pergl, J.; Brundu, G.; Carboni, M.; Dullinger, S.; Early, R.; Gonzalez–Moreno, P.; Groom, Q.J.; Hulme, P.E.; et al. The changing role of ornamental horticulture in alien plant invasions. Biol. Rev. Camb. Philos. Soc. 2018, 93, 1421–1437. [Google Scholar] [CrossRef] [PubMed]
  49. Dong, R.; Dong, B.C.; Fu, Q.Y.; Yang, Q.; Dai, Z.C.; Luo, F.L.; Gao, J.Q.; Yu, F.H.; van Kleunen, M. Cultivated alien plants with high invasion potential are more likely to be traded online in China. Ecol. Appl. 2023, 11, e2811. [Google Scholar] [CrossRef] [PubMed]
  50. Zhu, G.-P.; Redei, D.; Kment, P.; Bu, W.-J. Effect of geographic background and equilibrium state on niche model transferability: Predicting areas of invasion of Leptoglossus occidentalis. Biol. Invas. 2014, 16, 1069–1081. [Google Scholar] [CrossRef]
  51. Lu, X.; He, M.; Ding, J.; Siemann, E. Latitudinal variation in soil biota: Testing the biotic interaction hypothesis with an invasive plant and a native congener. ISME J. 2018, 12, 2811–2822. [Google Scholar] [CrossRef]
  52. Mullahey, J.J.; Shilling, D.G.; Mislevy, P.; Akanda, R.A. Invasion of tropical soda apple (Solanum viarum) into the U.S.: Lessons learned. Weed Technol. 1998, 12, 733–736. [Google Scholar] [CrossRef]
  53. Lustenhouwer, N.; Parker, I.M. Beyond tracking climate: Niche shifts during native range expansion and their implications for novel invasions. J. Biogeogr. 2022, 49, 1481–1493. [Google Scholar] [CrossRef]
  54. Overholt, W.A.; Diaz, R.; Markle, L.; Medal, J.C. The effect of Gratiana boliviana (Coleoptera: Chrysomelidae) herbivory on growth and population density of tropical soda apple (Solanum viarum) in Florida. Biocontrol Sci. Technol. 2010, 20, 791–807. [Google Scholar] [CrossRef]
  55. Mullahey, J.J.; Nee, M.; Wunderlin, R.P.; Delaney, K.R. Tropical soda apple (Solanum viarum): A new weed threat in subtropical regions. Weed Technol. 1993, 7, 783–786. [Google Scholar] [CrossRef]
  56. Pearman, P.B.; Guisan, A.; Broennimann, O.; Randin, C.F. Niche dynamics in space and time. Trends Ecol. Evol. 2008, 23, 149–158. [Google Scholar] [CrossRef] [PubMed]
  57. Pecl, G.T.; Araujo, M.B.; Bell, J.D.; Blanchard, J.; Bonebrake, T.C.; Chen, I.C.; Clark, T.D.; Colwell, R.K.; Danielsen, F.; Evengard, B.; et al. Biodiversity redistribution under climate change: Impacts on ecosystems and human well–being. Science 2017, 355, 9. [Google Scholar] [CrossRef] [PubMed]
  58. Greenwood, S.; Ruiz–Benito, P.; Martinez–Vilalta, J.; Lloret, F.; Kitzberger, T.; Allen, C.D.; Fensham, R.; Laughlin, D.C.; Kattge, J.; Bonisch, G.; et al. Tree mortality across biomes is promoted by drought intensity, lower wood density and higher specific leaf area. Ecol. Lett. 2017, 20, 539–553. [Google Scholar] [CrossRef] [PubMed]
  59. Engler, R.; Randin, C.F.; Thuiller, W.; Dullinger, S.; Zimmermann, N.E.; Araujo, M.B.; Pearman, P.B.; Le Lay, G.; Piedallu, C.; Albert, C.H.; et al. 21st century climate change threatens mountain flora unequally across Europe. Glob. Chang. Biol. 2011, 17, 2330–2341. [Google Scholar] [CrossRef]
  60. Parmesan, C.; Yohe, G. A globally coherent fingerprint of climate change impacts across natural systems. Nature 2003, 421, 37–42. [Google Scholar] [CrossRef] [PubMed]
  61. Sirami, C.; Caplat, P.; Popy, S.; Clamens, A.; Arlettaz, R.; Jiguet, F.; Brotons, L.; Martin, J.L. Impacts of global change on species distributions: Obstacles and solutions to integrate climate and land use. Glob. Ecol. Biogeogr. 2017, 26, 385–394. [Google Scholar] [CrossRef]
  62. Thebo, A.L.; Drechsel, P.; Lambin, E.F. Global assessment of urban and peri–urban agriculture: Irrigated and rainfed croplands. Environ. Res. Lett. 2014, 9, 9. [Google Scholar] [CrossRef]
  63. Bren d’Amour, C.B.; Reitsma, F.; Baiocchi, G.; Barthel, S.; Guneralp, B.; Erb, K.H.; Haberl, H.; Creutzig, F.; Seto, K.C. Future urban land expansion and implications for global croplands. Proc. Natl. Acad. Sci. USA 2017, 114, 8939–8944. [Google Scholar] [CrossRef]
  64. Bonnamour, A.; Gippet, J.M.W.; Bertelsmeier, C. Insect and plant invasions follow two waves of globalisation. Ecol. Lett. 2021, 24, 2418–2426. [Google Scholar] [CrossRef]
  65. Corson, M.S.; Mondiere, A.; Morel, L.; van der Werf, H.M.G. Beyond agroecology: Agricultural rewilding, a prospect for livestock systems. Agric. Syst. 2022, 199, 103410. [Google Scholar] [CrossRef]
  66. West, G.G.; Dean, M.G. The Use of Livestock to Control Weeds in New Zealand Forests. FRI Bull. 1990, 155, 128–132. [Google Scholar]
  67. Mislevy, P.; Martin, F.G. Tropical soda apple control as influenced by frost and herbicides. Soil Crop Sci. Soc. Fla Proc. 1999, 58, 107–109. [Google Scholar]
  68. Duncan, R.P. Time lags and the invasion debt in plant naturalisations. Ecol. Lett. 2021, 24, 1363–1374. [Google Scholar] [CrossRef] [PubMed]
Figure 1. Reconstruction of Solanum viarum invasion. Six intervals are shown from green to red until 2023 (except for the native countries). The bottom left shows a composite graph of the quantities and trend of invaded countries.
Biology 12 01179 g001
Figure 2. Global variation in the ecological niche of Solanum viarum. (A) p value of equivalency. (B) p value of Similarity. (C) Niche overlap: red and green blocks indicate expansion and unfilling areas, respectively, purple blocks indicate overlapping niches, and red arrow indicates variations in the niche centers of native and invasive areas.
Biology 12 01179 g002
Figure 3. PGDs in forest, grassland, cropland, and urban ecosystems (extracted by land cover) under current climate scenario (A) and future scenarios (B).
Biology 12 01179 g003
Figure 4. Variations of PGDs in forest under climate changes.
Biology 12 01179 g004
Figure 5. Suitability probabilities for Solanum viarum in the forest ecosystem under near–current and future climate scenarios (with 95% confidence bands via binomial fitting): (A,D) SSP1–2.6; (B,E) SSP2–4.5; (C,F) SSP5–8.5.
Biology 12 01179 g005
Figure 6. Suitability probabilities for Solanum viarum in the grassland ecosystem under near–current and future climate scenarios (with 95% confidence bands via binomial fitting): (A,D) SSP1–2.6; (B,E) SSP2–4.5; (C,F) SSP5–8.5.
Biology 12 01179 g006
Figure 7. Suitability probabilities for Solanum viarum in the cropland ecosystem under near–current and future climate scenarios (with 95% confidence bands via binomial fitting): (A,D) SSP1–2.6; (B,E) SSP2–4.5; (C,F) SSP5–8.5.
Biology 12 01179 g007
Figure 8. Suitability probabilities for Solanum viarum in urban ecosystem under near–current and future climate scenarios (with 95% confidence bands via binomial fitting): (A,D) SSP1–2.6; (B,E) SSP2–4.5; (C,F) SSP5–8.5.
Biology 12 01179 g008
Table 1. Area of PGDs in forest, grassland, cropland, and urban ecosystems under current and future climate scenarios.
Area
(×104 km2)
ForestGrasslandCroplandUrban
PGDsTotal PGDsTotal PGDsTotal PGDsTotal
Near current1467606924%152145010%417201021%155130%
2030s, SSP1–2.61512610325%144136311%432199622%237332%
2030s, SSP2–4.51602600627%160143611%489211623%237132%
2030s, SSP5–8.51475592025%148140311%502218323%247731%
2050s, SSP1–2.61748612329%135126711%505202625%258330%
2050s, SSP2–4.51456599224%147138511%468218621%268132%
2050s, SSP5–8.51557587527%147140310%577222426%319333%
Disclaimer/Publisher’s Note: The statements, opinions and data contained in all publications are solely those of the individual author(s) and contributor(s) and not of MDPI and/or the editor(s). MDPI and/or the editor(s) disclaim responsibility for any injury to people or property resulting from any ideas, methods, instructions or products referred to in the content.