Simple Summary
Using molecular techniques, we assessed the current situation of genetic structure and gene flow among different red deer groups living in the southern part of the Greater Khingan Mountains, the main distribution area of red deer in China. The result showed that the overall genetic diversity of red deer in the study area was intermediate. Significant genetic differentiation was observed, and a significant correlation was found between landscape variables and genetic differentiation, especially roads, altitude, and settlements, which were considered the main factors affecting the gene flow of red deer in this region. The research suggested that we should pay more attention to artificial landscapes and the supervision of human activities, and the distribution of human-made landscapes should avoid crossing the main habitats of red deer as much as possible.
Abstract
Red deer (Cervus canadensis xanthopygus) living in the north of China are restricted and threatened due to human activities and the changes in the natural environment, which influence the dispersal and effective gene flow between different groups of red deer. Effective gene flow plays an important role in maintaining genetic diversity and structure and ensuring population health. In order to evaluate the genetic diversity level and understand the gene flow between different red deer groups, 231 fresh fecal samples were collected from the southern part of the Greater Khingan Mountains, China. A microsatellite marker was used for genetic analysis. The results showed that the genetic diversity of red deer was intermediate in this region. Significant genetic differentiation among different groups was found in the main distribution area (p < 0.01) using F-statistics and the program STRUCTURE. Different degrees of gene flow existed in red deer groups, and the roads (importance = 40.9), elevation (importance = 38.6), and settlements (importance = 14.1) exerted main effects on gene flow between red deer groups. Human-made factors should be noticed and strictly supervised in this region to avoid excessive disturbance to the normal movement of the red deer. Further conservation and management of red deer should reduce the intensity of vehicular traffic in the concentrated distribution areas of red deer, especially during the heat season. This research helps us better understand the genetic level and health status of red deer in the southern part of the Greater Khingan Mountains and provides theoretical references for protecting and restoring the red deer populations in China.
1. Introduction
Dispersal is a central process in ecology and evolution [1,2,3]. In nature, the effective gene flow between individuals or populations is an important manifestation of wildlife migration or diffusion, which could lead to genetic diversity and structure changes based on the population level [4]. Maintaining sufficient effective gene flow plays an important role in ensuring population health and enhancing adaptability to the environment [5]. However, gene flow is affected by various factors, including food, natural enemies, reproductive ability, etc. In particular, it is mainly affected by habitat connectivity [6]. Habitat connectivity is always related to environmental factors and landscape features. As early as 1947, Fisher et al. proposed that the distribution pattern of landscapes affected the dispersal of wildlife and gene flow [7]. The effects of landscape features on gene flow are both positive and negative, which could inhibit or facilitate wildlife dispersal and gene exchange [8,9,10,11,12,13,14]. The red deer (Cervus canadensis xanthopygus) is an essential forest mammal in northern China, which plays an important role in maintaining the stability of forest ecosystems and the number of large carnivores, such as the Amur tiger [15]. However, the number of red deer declined rapidly in China due to hunting and logging before the 19th century [16]. At present, although considerable efforts have been made to protect the red deer population, its recovery rate is slow. The effects of human activities and changes in natural resources on red deer still need attention [17,18]. The assessment of the genetic status of red deer and the analysis of the factors affecting gene flow can effectively help us understand the health status of the red deer population, avoid potential threats and risks, and provide a theoretical basis and scientific references for timely updating and modifying management and protection measures.
The Greater Khingan Mountains, located in northeast China, have abundant wildlife resources. The Gaogesitai region is located in the southern part of the Greater Khingan Mountains, currently known as the most important distribution area of red deer in China [19]. However, the current genetic level and health status of the red deer population living in this region are still unknown. In addition, there were settlements and a well-developed transportation system, mainly used for transporting wood at the end of the 20th century. After establishing the nature reserve in 2011, these roads were used for vehicle traffic and daily patrol work of the natural reserve. There were still settlements in the main distribution areas of red deer [20]. The vehicles and human activities might affect the dispersal and gene flow of red deer. Therefore, it is necessary to evaluate the influence of environmental variables, including human factors, on the effective gene flow between red deer communities in this region, which is important for assessing the health of red deer populations in this region and ensuring the stability of red deer populations in China.
In this study, therefore, we investigated the genetic diversity of red deer in the southern part of the Greater Khingan Mountains to understand the impact of landscape features on red deer from a genetic perspective. The main objectives of the study are as follows: (1) evaluating the current level of genetic diversity; (2) revealing if potential genetic differentiation existed between different groups of red deer; and (3) analyzing the effects of environmental factors on gene flow.
2. Materials and Methods
2.1. Study Area
Gaogesitai region is located in the southern part of the Greater Khingan Mountains, belonging to Chifeng City, Inner Mongolia, China, with a total area of 1062.84 km2 (119°03′30″–119°39’08″ E, 44°41′03″–45°08′44″ N, Figure 1). This region is an important distribution area of red deer, with intact habitat and abundant red deer resources (average density = 1.11/km2) [18]. The region has forests, shrubs, grasslands, and wetlands ecosystems, with an altitude of 700–1600 m and a slope of 0–54°. The rich vegetation and water resources provide suitable habitats for red deer to survive and reproduce. In winter, the average snow cover is 30 d, and the longest snow cover is 100 d. The coldest month is January, with an average temperature of −16 °C and an extremely low temperature of −42 °C. In addition to the existing natural landscapes, there are artificial landscapes, including settlements and roads. Settlements include herders, staff, and workers. Roads are mainly used for traffic and daily patrol. Based on previous studies, local landscape environmental factors are likely to affect the dispersal and gene flow between different groups of red deer [21,22].
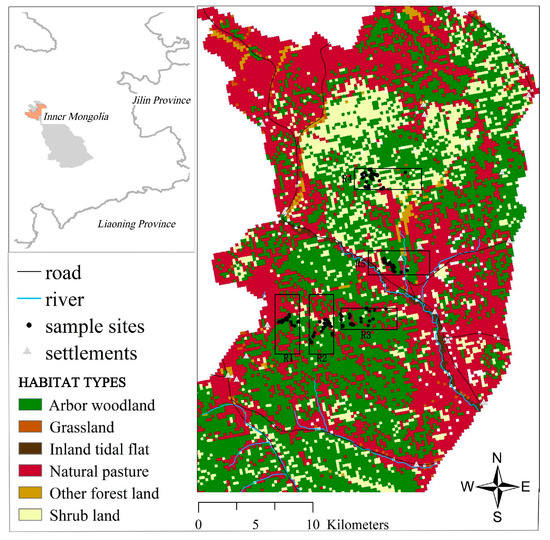
Figure 1.
Map of the study area. The points in the figure represent the sampling sites, and R1, R2, R3, R4, and R5 represent five different red deer groups. R1, Xishabutai (n = 29); R2, Sitehehundi (n = 57); R3, Shabutai (n = 55); R4, Luchangxi (n = 61); R5, Changbu (n = 29).
2.2. Sample Collection
During the winter of 2020, based on the results of previous infrared camera photography and the experience of local forest rangers, we conducted field surveys in five areas with high activity of the red deer in R1, R2, R3, R4, and R5 (full names and sample sizes are given in the legend of Figure 1). In January 2021, fresh fecal samples (<24 h) were collected by tracking the snowy trail chains of red deer. Disposable sterile collection bags were used for sampling, and the samples were immediately stored in liquid nitrogen. After sampling, the samples were shipped to the laboratory and stored in an ultra-low-temperature refrigerator at −80 °C for preservation. Finally, 231 samples were collected for this study.
2.3. DNA Extraction and Species Identification
We strictly applied the laboratory protocols throughout the experiment to prevent contamination by alien DNA and PCR products. Fecal DNA extraction was performed using the QIAamp Fast DNA Stool Mini Kit (Qiagen, Hilden, Germany) according to the manufacturer’s instructions. Using mitochondrial cytochrome b amplification primer L14724: 5′-CGA GAT CTG AAA AAC CAT CGT TG-3′; H15149: 5′-AAA CTG CAG CCC CTC AGA ATG ATA TTT GTC CTC A-3′ [23,24] for PCR amplification of fecal DNA (400–500 bp). The amplification system was shown in Table S1. Reaction conditions: pre-denaturation at 95 °C for 3 min; denaturation at 95 °C for 30 s; annealing at 53 °C for 30 s; extension at 72 °C for 30 s, for 35 cycles; then, extension at 72 °C for 5 min; and storage at 4 °C. Muscle DNA stored in the laboratory was used as a positive control for each amplification (from naturally deceased females found in the field). A negative control without DNA was added along with the amplification to monitor contamination. Each DNA extraction was amplified and indexed in three independent PCR reactions. These PCR replicates were used as technical replicates to remove the false-positive results [25]. The PCR products were examined on 1.5% agarose gel electrophoresis. The positive products were sent to the Shanghai Shengong Biological Company for purification and two-way sequencing. The forward and reverse sequences were spliced, aligned, and corrected by DNAStar software. Red deer species were identified by comparison with the NCBI GenBank reference databases [26]. If a sample was not identified as red deer, it was discarded from further analysis. Cervidae in the study area all have publicly available DNA references for the mitochondrial markers. Therefore, operational taxonomic units (OTUs) can be classified at the level of taxonomic species.
2.4. Individual Identification
Based on published studies on red deer, eight pairs of microsatellite primers (ETH225, T501, T156, BM848, T530, DM45, N, T507) were used for individual identification [27,28,29]. The 5′ end of the upstream primer in each microsatellite locus was fluorescently labeled (Table S2). The reaction conditions were the same as those used for species identification.
The multiple-tube approach was used to carry out several polymerase chain reactions at each locus for reliable genotypes [30]. The RelioType software was used to accept genotypes that achieved a 95% estimated probability of reliability [31]. Each locus was amplified by polymerase chain reaction at least four times. The PCR products were examined on 2% agarose gel electrophoresis. Genotypes were determined using an ABI 3730XL sequencer and the GeneMapper software package (Applied Biosystems Inc., Waltham, MA, USA). The software Excel microsatellite tool kit was used to look for matching genotypes in the data [32]. The principles for judging that different samples belong to the same individual are as follows: (1) the genotypes are the same at all loci, and (2) only one allele at one locus varies [33]. To assess genotype quality, Gimlet version 1.3.3 was used to construct consensus genotypes and estimate the false allele (FA) and allele dropout (ADO) rates [34].
2.5. Genetic Diversity Analysis
For microsatellite data, GenAlEx version 6.5 was used to transform the allele data and calculate the number of alleles (Na), the effective allele number (Ne), the expected heterozygosity (Ho), and the expected heterozygosity (He) [35]. The polymorphism information content (PIC) of microsatellite loci was calculated by Cervus version 3.0. Further, the individual identification probability PID of eight microsatellite loci was evaluated by Gimlet version 1.3.3 [34]. The Microchecker version 2.2.0.3 was used to detect null alleles at microsatellite loci [36]. Genepop version 4.0 was used to measure whether the population and each locus deviated from Hardy–Weinberg equilibrium (HWE) [37], and linkage disequilibrium (LD) between each locus was also examined. For LD and HWE tests, p-values were generated by the Markov chain method, and significance was corrected by the Bonferroni method [38].
2.6. Genetic Differentiation Analysis
Two methods were used to analyze the population differentiation. First, Genepop version 4.0 was used to calculate the genetic differentiation index (Fst) between the pairs of sampling sites [39]. Fisher’s exact test was used for significance values, and the Markov chain (MCMC) was set as 10,000 dememorization steps, 100 batches, and 500 iterations per batch [40,41].
The prior subdivision of the population by F-statistic can be subjective, leading to some bias in the estimates of population structure [42]. Therefore, a Bayesian clustering method was implemented in the program STRUCTURE version 2.3 to reduce the error when defining the population to analyze the genetic structure [43]. The software inferred the number of potential genetic clusters (K) using an individual-based Bayesian clustering method without defining populations a priori. The most likely number of populations (K) was estimated by conducting 20 independent runs for K = 1–5, using a burn-in of 105 replications and 50,000 Markov chain Monte Carlo steps, and assuming the admixture model with correlated allele frequencies. The running results were analyzed by Structure Harvester Web “http://taylor0.biology.ucla.edu/struct_harvest/ (accessed on 15 March 2023)” [44]. Then, the curves of Ln Pr (X|K) and delta K were calculated, and the best K value was determined by maximizing the delta K. CLUMPP version 1.1.2 [45] was used to average the results for the K value, and finally, plotted them with Distruct version 1.1 [46]. In addition, we further analyzed the genetic structure using the discriminant analysis of principal components (DAPC) with a non-Bayesian approach. DAPC was performed in R version 3.3.1 using the “adegenet” package to determine the clusters of groups according to the Bayesian Information Criterion (BIC) [47].
2.7. Isolation-by-Distance (IBD) Analysis
An Isolation-by-distance (IBD) test was performed in the study area to assess potential distance barriers to gene flow and investigate if genetic differentiation between sampling sites followed the IBD model [48,49]. The Center of Mass and Xtools Pro in ArcGIS version 10.3 were used to calculate the Euclidean distance between pairwise red deer groups. The pairwise genetic distance matrix was generated by Fst/(1-Fst). The natural logarithmic transformation of Euclidean distance generated the geographical distance matrix. The Mantel test [50] was performed using GenAlEx version 6.5 to test the correlation between genotype and geographical distance [51]. The p-value was obtained after 10,000 displacement tests.
2.8. Source of Environmental Variables
The environmental variables included vegetation, topography, water, and disturbance. Moreover, normalized difference vegetation index (NDVI) and habitat types were considered vegetation factors. The elevation and slope were considered topography factors. The tributaries in this area were considered water factors. Settlements and roads were considered disturbance factors. The vegetation factors were derived from MODIS images “https://modis.gsfc.nasa.gov (accessed on 20 December 2022)” and the Third National land resource survey (The survey is a national land and resources survey of China. According to the unified national standards, the survey uses remote sensing, surveying and mapping, geographic information, Internet, and other technologies to fully grasp the utilization of existing land resources in China, including the area and distribution of various habitats.). The topography factors were extracted from the Digital topographic Elevation Model (DEM) on the Geospatial Data Cloud platform of the Computer Network Information Center, Chinese Academy of Sciences “http://www.gscloud.cn/ (accessed on 20 December 2022)”. The water factors were based on the Euclidean distance layer generated from the river distribution layer in the study area, which can reflect the distance of sample sites from the nearest water source. The disturbance factors were the Euclidian distance layer generated by the human disturbance (settlements and roads) and the sample sites obtained from field surveys and stock maps in the study area. The details about environmental variables are given in Table 1.

Table 1.
The environment variables used in the MaxEnt model and their sources.
2.9. The Relationship between Landscape Environmental Variables and Gene Flow
2.9.1. The Dispersal Resistance of Study Area
The sample sites and environmental variables were input into MaxEnt model version 3.4.1. Before inputting the environment variables, river elements were removed because of their high autocorrelation with other variables. 75% of the red deer distribution points were selected as the training set to establish the prediction model, and the remaining 25% were used as the test set to verify the model. Other parameters selected the default value of the model. The knife-cutting method was selected in the environmental parameter settings, and the analysis results were output as an ASCII file. Furthermore, the habitat suitability index (HSI) between 0 (unsuitable) and 1 (most suitable) was evaluated. The MaxEnt model was considered an effective tool for habitat assessment [52].
This study used the area enclosed by the ROC and the abscissa to evaluate the model’s accuracy. The closer the AUC value was to 1, the better the model predicted [53]. The dispersal resistance was calculated by 1-HSI. The area with less suitable habitat had higher resistance to the dispersal of red deer [54,55,56].
2.9.2. Assessment of Dispersal Probability and Correlation with Gene Flow
Effective gene exchange among red deer is caused by dispersal, movement, and interpenetration among individuals or populations of red deer. The suitable area for red deer has less movement resistance and greater dispersal possibility, which indicates more extensive potential gene flow; on the contrary, the unsuitable area for red deer has higher movement resistance and less dispersal possibility, which indicates smaller potential gene flow. In order to better understand the relationship between gene flow, dispersal, and environmental variables, the circuit model and the least-cost path model were performed to obtain possible dispersal routes and dispersal cost distance.
Each red deer group was used as the ecological source, defined as source N. Other groups were used as the target N, producing independent ecological sources and one-to-one corresponding target sources. Based on the habitat suitability layer generated by the MaxEnt model, the resistance layer generated by 1-HSI was used as the base data source. The base data source was input into the circuit model. Then, the probability layer of red deer dispersing through the landscapes was obtained using Circuitscape version 4.0 [57]. The model parameters were selected in the pair-model pattern. Finally, the sampling sites, resistance, and probability layers of red deer dispersing through the landscapes were input into the least-cost path model to obtain the least-cost paths between different red deer groups [58]. In order to analyze the relationship between potential dispersal and gene flow, the least-cost path distance matrix and the genetic distance matrix among red deer groups were established. The Mantel test was performed in GenAlEx version 6.5 to obtain the p-values with 10,000 permutation tests.
3. Results
3.1. Species Identification and Individual Identification
231 fecal samples were collected in the study area, and 212 DNA samples were successfully extracted, with a sample utilization rate of 91.77%. The Cyt b gene was successfully amplified from 212 samples (424 bp). After a Blast comparison, 199 samples were finally identified as red deer.
Gimlet analysis showed that the combined Prod(unbias) of the 8 microsatellite loci was 6.888 × 10⁻¹⁰. Even in the case of full sibs, the probability of misjudgment, Prod(sibs), was only 0.0546%. When the most polymorphic loci failed to amplify, the Prod(sibs) increased to 0.46%, which was still less than 1% (Figure 2). Therefore, 193 DNA samples were successfully genotyped at ≥7 microsatellite loci (96.98% amplification success rate) with 95% reliability. The result of individual identification showed that 172 independent individuals of red deer were identified from 193 red deer fecal samples, which were used for subsequent analysis (Table 2). Moreover, the false allele (FA) and allele dropout (ADO) rates were 0.02 and 0.01, respectively.
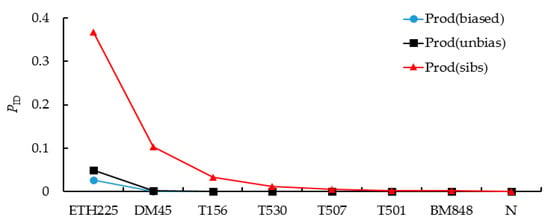
Figure 2.
The probability of identity (PID) curve generated eight microsatellite loci.

Table 2.
Information about the feces sample of red deer.
3.2. Genetic Diversity Analysis
The results of Microchecker showed no null alleles or allele loss, indicating that the genotyping results were reliable and could be used for subsequent analysis. The red deer in the study area significantly deviated from the Hardy–Weinberg equilibrium. However, the fixation index (Fis) was negative (Fis = −0.051), which proved no effect of a null allele or inbreeding. There was no linkage disequilibrium among the eight loci. Genotyping data were therefore available for subsequent population genetic analysis.
The number of alleles (Na) and effective alleles (Ne) were 8.0 ± 0.51 and 4.6 ± 0.32, respectively. A significant difference was found between Na and Ne (p < 0.01). Allelic richness (AR) was 5.978. The polymorphic information content (PIC) was 0.724. The expected heterozygosity (He) was 0.737 ± 0.018, and the observed heterozygosity (Ho) was 0.767 ± 0.031. A significant difference was found between observed heterozygosity and expected heterozygosity (p < 0.05). The details are shown in Table 3.

Table 3.
The amplification information for eight microsatellite primers.
3.3. Genetic Differentiation Analysis
The overall population differentiation was relatively low in this region (Fst = 0.014 < 0.05). The Fst among pairwise red deer groups ranged from 0.0041 to 0.0223. The details are shown in Table 4. A significant difference in genetic differentiation was found after Fisher’s exact test, which was R1-R2, R1-R3, R1-R4, R1-R5, R2-R3, R2-R4, R2-R5, and R3-R4 (p < 0.01).

Table 4.
Genetic distances between the five geographic populations sampled.
The Bayesian clustering showed that delta K reached its highest when K = 2, with the average Ln P(X|K) = −4701. When K > 2, Ln P(X|K) decreased significantly, and the variance between independent operations increased. Therefore, K = 2 might be the most probable number of clusters (Figure 3). Each individual at K = 2–4 was grouped and analyzed, and the grouping results of the 172 individuals are shown in Figure 4. When K = 2, the study area samples were divided into red and green clusters. Red clusters included most individuals living in the R4 and R5 groups, while the green group included the majority of individuals living in the R1, R2, and R3 groups. According to the multi-locus genotype assignment, the degree of genetic differentiation between R2 and R4 was the most obvious. The results of DAPC showed that all individuals were subdivided into five cluster groups, but the five clusters were not clearly separated, indicating that red deer communicated to different degrees between each cluster (Figure 5). And lower genetic differentiation and a more similar genetic composition could be found in R4 and R5, and R1, R2, and R3.
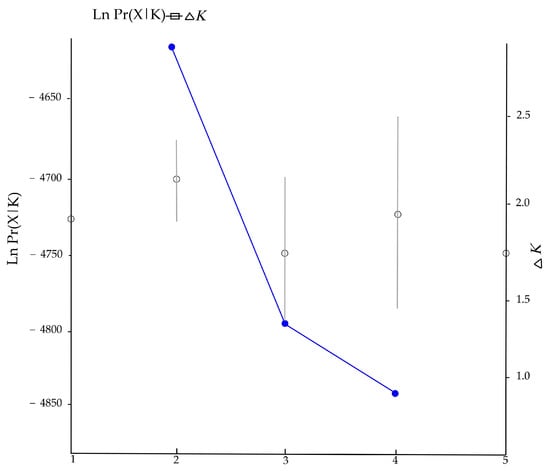
Figure 3.
Changing trends of Ln Pr(X|K) and Delta K from STRUCTURE clustering results.
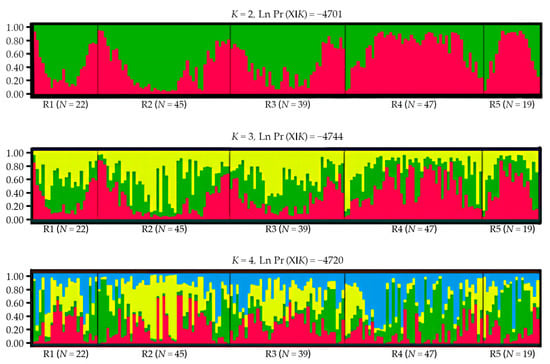
Figure 4.
Bayesian clustering results of red deer for the microsatellite (K = 2–4). A line represents each individual (N = 172), different colors represent different groups, and the proportions of different colors in the lines are the probability that an individual was assigned to a certain group. Individual numbers of each sampling group are shown at the bottom of the figure.
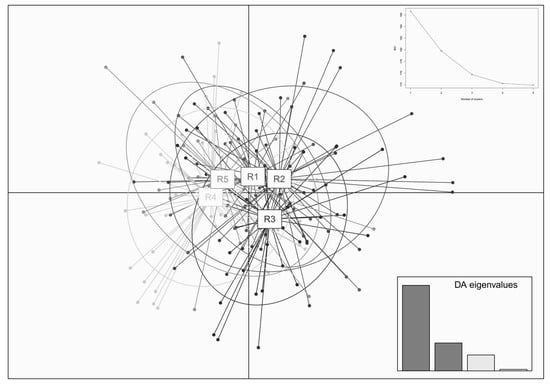
Figure 5.
Genetic clusters with DAPC method for red deer based on microsatellite data. The figure included the cluster graph of individuals from each group and the broken line graph corresponding to the cluster number K and BIC values.
3.4. Isolation by Distance Analysis
The average geographical distance among red deer groups was 4.5 km. Among them, the distance was the furthest between R2 and R4 and the closest between R1 and R2. The results of the Mantel test showed that there was a significant correlation between genetic differentiation and geographical distance (r = 0.54, p = 0.025 < 0.05) (Figure 6).
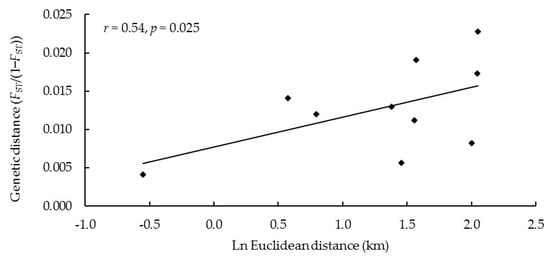
Figure 6.
Mantel test of Euclidean distance and genetic distance between different red deer groups.
3.5. Relationship between Gene Flow and Environmental Variables
The Maxent model with 10 replicates showed that the AUC index of the dataset used in the research reached 0.976, which indicated a good evaluation and explanation of the results. Roads (importance = 40.9%), elevation (importance = 38.6%), and settlements (importance = 14.1%) were the main landscape features affecting the dispersal of red deer. The closer the distance to the road, the greater the dispersal resistance of red deer and the lower the dispersal possibility. At the altitude range of 750–900 m, the dispersal resistance decreases gradually and increases rapidly after 900 m. And within a certain range, the farther away from the settlements, the smaller the dispersal resistance (Figure S1). Habitat type (importance = 4.0%), NDVI (importance = 2.2%), and slope (importance = 0.2%) had less effect on the dispersal of red deer.
Based on the MaxEnt model, six types of landscape variables in the study area were assigned a dispersal cost value, and the least-cost paths were generated based on the circuit model and the least-cost path model. And the least-cost paths among red deer groups are shown in Figure 7.
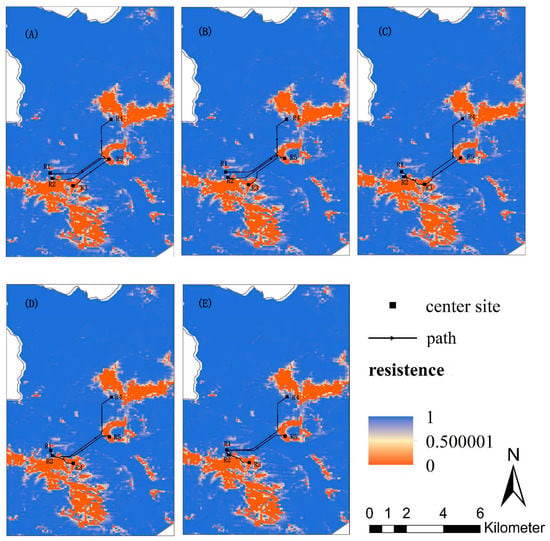
Figure 7.
The least-cost paths among main distribution areas: (A) The least-cost path from distribution R5 to other distributions; (B) Distribution R4 to other distributions; (C) Distribution R3 to other distributions; (D) Distribution R2 to other distributions; (E) Distribution R1 to other distributions.
The results of the Mantel test showed a significantly positive correlation between the cost distance of dispersal and the genetic distance of red deer groups (r = 0.5, p = 0.039) (Figure 8).
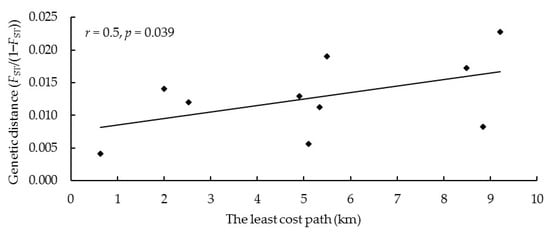
Figure 8.
Mantel test of the least-cost path and genetic distance between five sampling sites based on the microsatellite data.
4. Discussion
The studies focused on genetics and population dynamics could help us understand the health status of wildlife and avoid potential threats and risks. We investigated the genetic diversity level and structure of red deer living in the southern part of the Greater Khingan Mountains, China, which were considered dominant groups of red deer in China. The results suggested that the red deer in the southern part of the Greater Khingan Mountains might face the risk of decreasing their ability to adapt to the environment and forming local populations. We used microsatellite markers to understand the genetic status of red deer, as the microsatellites are suitable for inferring recent population genetic events [59]. In this study, eight microsatellite loci were used for analysis. There was a significant difference between the number of alleles and effective alleles (p < 0.01), which might lead to a risk of allele loss in the future. Heterozygosity is one of the most effective methods to quantify the level of genetic diversity. Gao (2020) studied the Alashan red deer (Cervus elaphus alashanicus) distributed in the Helan Mountains, Ningxia, and Inner Mongolia, China, and the results showed that the observed heterozygosity in the wild population was high (Ho = 0.792) [60]. Zhou (2015) conducted a population study on the Tianshan red deer (Cervus elaphus songaricus) distributed in the Tianshan Mountains, Xinjiang, China, and found that the overall genetic diversity was high (Ho = 0.850, He = 0.710) [61]. Based on 172 red deer individuals in this study, the observed heterozygosity (Ho) was 0.767 and the expected heterozygosity (He) was 0.737, which were lower than those of the Alashan red deer and Tianshan red deer. Compared with the results of other red deer subspecies based on microsatellite markers, the genetic diversity of red deer in the southern Greater Khingan Mountains in this study was at a medium level (Table 5).

Table 5.
Comparison of genetic diversity in the Cervus populations among different regions.
The interference of human activities and the change in nature may lead to the hindrance of gene exchange, the decrease in genetic diversity, and the increase in genetic differentiation, which is easy to form endangered populations [66]. We found a certain degree of genetic differentiation in the study area (Fst = 0.014). The highest Fst was between R2 and R4, and the lowest Fst was between R1 and R2, indicating relatively strong effective gene flow between R1 and R2 and relatively low effective gene flow between R2 and R4. We found a positive correlation between genetic and geographical distance (p < 0.05). The longer geographical distance inhibited the dispersal of red deer, reduced gene flow between different red deer groups, and led to increased genetic differentiation [48,67,68].
However, the landscape and environmental variables might be important factors affecting the dispersal of red deer, which must be considered when studying gene flow among red deer groups [69,70]. This research found a significant correlation between genetic distance and cumulative dispersal resistance of landscape environmental variables (p < 0.05). Roads (40.9%), altitude (38.6%), and settlements (14.1%) were the main factors affecting the gene flow between red deer groups. The habitat types, NDVI, and slope had little influence on the gene flow of red deer, with an importance index of 4.0%, 2.2%, and 0.2%, respectively. According to the distribution of red deer, there were roads and settlements between R2 and R4. According to the relationship between dispersal resistance and distance to roads and settlements, the closer the distance to roads and settlements, the greater the diffusion resistance (Figure S1). So the red deer close to roads and settlements have higher dispersal costs. These environmental variables reduced effective gene flow, especially in linear landscapes, which affected the gene flow patterns at multiple spatial scales and further affected genetic differentiation [71,72,73]. Near the roads and settlements, frequent human activities and land use changes affected the dispersal pattern. Some other studies on red deer also confirmed that roads and settlements were the main limiting factors for the distribution and dispersal of red deer [74,75]. The results of STRUCTURE also demonstrated this, which suggested that all individuals of red deer could be divided into two clusters, and the R1, R2, and R3 groups of red deer on the southern side of roads belonged to one cluster, and R4 and R5 on the northern side of roads belonged to another one.
Previous studies have demonstrated that red deer in the northeast of China tend to choose habitats with lower altitudes (800–1200 m) and slopes (<15°) [76]. The study area has a gentle slope, and the altitude ranges from 700 m to 1600 m. The large elevation fluctuation might increase the dispersal cost of red deer. During the sampling, it was found that the vegetation near the sampling sites did not change obviously, and Quercus mongolica, Betula platyphylla, Ostryopsis davidiana, and Poaceae could always be found around the sampling sites. Therefore, the habitat types and NDVI index did not show an apparent influence on the distribution and dispersal of red deer. The number of microsatellite loci, sample size, and analysis methods might limit the results of this study. More microsatellite loci and diversified analysis could provide more accurate and stable results on the genetic diversity of red deer. In future studies, we will apply more technical means to the genetic analysis of red deer while, at the same time, selecting more loci and larger sample sizes.
5. Conclusions
Understanding the current genetic structure and gene flow between the subpopulations is important to protect red deer in China. In this context, we investigated the genetic status of red deer living in the southern part of the Greater Khingan Mountains, China, to understand the effects of landscape environmental factors on gene flow. In this region, human activities have interfered with the movement and dispersal of red deer to some extent. In the long run, the red deer might have genetic risks. Human activities and traffic intensity should be supervised and controlled strictly, especially during the heat season (September to October). To strengthen the genetic diversity level and gene flow between different red deer subpopulations, it is necessary to establish ecological corridors to reduce dispersal resistance and promote gene exchange. In further research, a larger sample size, different molecular makers, and more complex analyses are necessary. This study helps us understand the genetic status and gives references for protecting and managing red deer resources in China.
Supplementary Materials
The following supporting information can be downloaded at: https://www.mdpi.com/article/10.3390/biology12040576/s1, Table S1: PCR amplification system of red deer for mtDNA and microsatellite; Table S2: Details of eight microsatellite loci used for the study; Figure S1: The relationship between dispersal resistance of red deer groups and environmental variables.
Author Contributions
Z.L. and J.G. contributed equally to this paper. Conceptualization, M.Z., Z.L., J.G., Y.H. and N.Z.; methodology, M.Z., Z.L., J.G. and Y.H.; validation, M.Z., Z.L., J.G., Y.H. and N.Z.; formal analysis, Z.L. and J.G.; investigation, Z.L. and J.G.; resources, M.Z.; data curation, Z.L. and J.G.; writing—original draft preparation, Z.L. and J.G.; writing—review and editing, M.Z., Y.H. and N.Z.; visualization, Z.L. and J.G.; supervision, Z.L. and J.G.; project administration, M.Z.; funding acquisition, M.Z. All authors have read and agreed to the published version of the manuscript.
Funding
This research was funded by National Natural Science Foundation of China, NSFC, grant number 32071521; the National Forestry and Glassland Administration Project, China: Investigation, monitoring and patrol of Amur tiger in Greater Khingan Mountains; Fundamental Research Funds for the Central Universities, grant number 2572020BE02.
Institutional Review Board Statement
Not applicable.
Informed Consent Statement
Not applicable.
Data Availability Statement
The raw sequences of the mitochondrial cytochrome b gene for this study can be found in GenBank from NCBI (submission ID: 2619872 OP373204-OP373385).
Acknowledgments
We acknowledged the administrators, professional staff, and guides of the Gaogesitai region. Special thanks are given to W.Z. for the fund support.
Conflicts of Interest
The authors declare no conflict of interest.
References
- Benton, T.G.; Bowler, D.E. Linking dispersal to spatial dynamics. In Dispersal Ecology and Evolution; Clobert, J., Baguette, M., Benton, T.G., Bullock, J.M., Eds.; Oxford University Press: Oxford, UK, 2012; pp. 251–265. [Google Scholar] [CrossRef]
- Hanski, I.; Gilpin, M. Metapopulation dynamics: Brief history and conceptual domain. Biol. J. Linn. Soc. 1991, 42, 3–16. [Google Scholar] [CrossRef]
- Hansson, L. Dispersal and connectivity in metapopulations. Biol. J. Linn. Soc. 1991, 42, 89–103. [Google Scholar] [CrossRef]
- Clobert, J.; Dhont, A.A.; Nichols, J.D. Dispersal; Oxford University Press: Oxford, UK, 2001. [Google Scholar]
- Slatkin, M. Gene flow and the geographic structure of natural populations. Science 1987, 236, 787–792. [Google Scholar] [CrossRef] [PubMed]
- Lowe, A.; Harris, S.; Ashton, P. Ecological Genetics. Design, Analysis, and Application, 1st ed.; Blackwell Science: Oxford, UK, 2004; pp. 106–145. [Google Scholar]
- Fisher, R.A.; Ford, E.B. The spread of a gene in natural conditions in a colony of the moth Panaxia Dominula L. Heredity 1947, 1, 143–174. [Google Scholar] [CrossRef]
- Ćosić, N.; Říčanová, Š.; Bryja, J.; Penezić, A.; Ćirović, D. Do rivers and human-induced habitat fragmentation affect genetic diversity and population structure of the European ground squirrel at the edge of its Pannonian range? Conserv. Genet. 2013, 14, 345–354. [Google Scholar] [CrossRef]
- Marin, J.C.; González, B.A.; Poulin, E.; Casey, C.S.; Johnson, W.E. The influence of the arid Andean high plateau on the phylogeography and population genetics of guanaco (Lama guanicoe) in South America. Mol. Ecol. 2013, 22, 463–482. [Google Scholar] [CrossRef]
- Smissen, P.J.; Melville, J.; Sumner, J.; Jessop, T.S. Mountain barriers and river conduits: Phylogeographical structure in a large, mobile lizard (Varanidae: Varanus varius) from eastern Australia. J. Biogeogr. 2013, 40, 1729–1740. [Google Scholar] [CrossRef]
- Frantz, A.C.; Bertouille, S.; Eloy, M.C.; Licoppe, A.; Chaumont, F.; Flamand, M.C. Comparative landscape genetic analyses show a Belgian motorway to be a gene flow barrier for red deer (Cervus elaphus), but not wild boars (Sus scrofa). Mol. Ecol. 2012, 22, 3445–3457. [Google Scholar] [CrossRef]
- Hepenstrick, D.; Thiel, D.; Holderegger, R.; Gugerli, F. Genetic discontinuities in roe deer (Capreolus capreolus) coincide with fenced transportation infrastructure. Basic Appl. Ecol. 2012, 13, 631–638. [Google Scholar] [CrossRef]
- Crispo, E.; Moore, J.; Lee-Yaw, J.A.; Gray, S.M.; Haller, B.C. Broken barriers: Human-induced changes to gene flow and introgression in animals. BioEssays 2011, 33, 508–518. [Google Scholar] [CrossRef]
- Holderegger, R.; Giulio, M.D. The genetic effects of roads: A review of empirical evidence. Basic Appl. Ecol. 2010, 11, 522–531. [Google Scholar] [CrossRef]
- Wang, S.; Xie, Y. China Species Red List; Higher Education Press: Beijing, China, 2004. (In Chinese) [Google Scholar]
- Yang, M.; Sun, Y.; Zhang, W.Q.; Yuan, H.Y.; Zhang, M.H. Variation in winter daily range area of red deer (Cervus elaphus xanthopygus) based on DNA extracted from fecal samples. Journey For. Res. 2019, 30, 1951–1958. [Google Scholar] [CrossRef]
- Jiang, G.S.; Zhang, M.H.; Ma, J.Z. The fragmentation and impact factors of red deer habitat in Wandashan region, Heilongjiang Province, China. Acta Ecol. Sin. 2005, 7, 1691–1698. (In Chinese) [Google Scholar]
- Zhang, S.L.; Wang, Z.L.; Zhang, P.; Zhang, F.; Yang, Y.X.; He, W. Study on the status of wild red deer populations in Chifeng City, Inner Mongolia. Sichuan J. Zool. 2009, 28, 772–776. (In Chinese) [Google Scholar]
- Zhang, L.B. Winter Habitat Spatial Structure Analysis and Evaluation of Red Deer in Gaogesitai. Master’s Thesis, Northeast Forestry University, Harbin, China, 2016. (In Chinese). [Google Scholar]
- He, H. Comparison of Red Deer’s Food Components between Summer and Winter in the Gaogesitai National Nature Reserve, Inner Mongolia, China. Master’s Thesis, Northeast Forestry University, Harbin, China, 2015. (In Chinese). [Google Scholar]
- Pérez-Espona, S.; Pérez-Barbería, F.J.; McLeod, J.E.; Jiggins, C.D.; Gordon, I.J.; Pemberton, J.M. Landscape features affect gene flow of Scottish Highland red deer (Cervus elaphus). Mol. Ecol. 2008, 17, 981–996. [Google Scholar] [CrossRef]
- Latch, E.K.; Boarman, W.I.; Walde, A.; Fleischer, R.C. Fine-scale analysis reveals cryptic landscape genetic structure in desert tortoises. PLoS ONE 2011, 6, e27794. [Google Scholar] [CrossRef]
- Kocher, T.D.; Thomas, W.K.; Meyer, A.; Edwards, S.V.; Pääbo, S.; Villablanca, F.X.; Wilsion, A.C. Dynamics of mitochondrial DNA evolution in animals: Amplification and sequencing with conserved primers. Proc. Natl. Acad. Sci. USA 1989, 86, 6196–6200. [Google Scholar] [CrossRef]
- Irwin, D.M.; Kocher, T.D.; Wilson, A.C. Evolution of the cytochrome b gene of mammals. J. Mol. Evol. 1991, 32, 128–144. [Google Scholar] [CrossRef]
- Robasky, K.; Lewis, N.; Church, G. The role of replicates for error mitigation in next-generation sequencing. Nat. Rev. Genet. 2014, 15, 56–62. [Google Scholar] [CrossRef]
- Parson, W.; Pegoraro, K.; Niederstätter, H.; Föger, M.; Steinlechner, M. Species identification by means of the cytochrome b gene. Int. J. Leg. Med. 2000, 114, 23–28. [Google Scholar] [CrossRef]
- Hu, H.J.; Xing, B.; Yang, M.; Mpemba, H.; Lv, Z.H.; Zhang, M.H. Population and genetic diversity of Tibetan red deer based on fecal DNA. J. For. Res. 2018, 29, 227–232. [Google Scholar] [CrossRef]
- Tian, X.M.; Yang, M.; Zhang, M.H.; Wang, X.L. Assessing genetic diversity and demographic history of the Manchurian wapiti (Cervus canadensis xanthopygus) population in the Gaogesitai, Inner Mongolia, China. Appl. Ecol. Environ. Res. 2020, 18, 5561–5575. [Google Scholar] [CrossRef]
- Zhang, H. The Individual Identify, Parentage Analysis and Home Range Determination of Wapiti Based on Faces Molecular Biology. Master’s Thesis, Northeast Forestry University, Harbin, China, 2010. (In Chinese). [Google Scholar]
- Taberlet, P.; Griffin, S.; Goossens, B.; Questiau, S.; Manceau, V.; Escaravage, N.; Waits, L.P.; Bouvet, J. Reliable genotyping of samples with very low DNA quantities using PCR. Nucleic Acids Res. 1996, 24, 3189–3194. [Google Scholar] [CrossRef] [PubMed]
- Miller, C.R.; Joyce, P.; Waits, L.P. Assessing allelic dropout and genotype reliability using maximum likelihood. Genetics 2002, 160, 357–366. [Google Scholar] [CrossRef]
- Park, S.D.E. Trypanotolerance in West African Cattle and the Population Genetic Effects of Selection. Ph.D. Thesis, University of Dublin, Dublin, Ireland, 2001. [Google Scholar]
- Bellemain, E.; Swenson, J.E.; Tallmon, D.; Burnberg, S. Estimating population size of elusive animals with DNA from hunter-collected feces: Four methods for brown bears. Conserv. Biol. 2005, 19, 150–161. [Google Scholar] [CrossRef]
- Valière, N. Gimlet: A computer program for analysing genetic individual identification data. Mol. Ecol. Notes 2002, 2, 377–379. [Google Scholar] [CrossRef]
- Peakall, R.; Smouse, P.E. GENALEX 6: Genetic analysis in Excel. Population genetic software for teaching and research. Mol. Ecol. Notes 2006, 6, 288–295. [Google Scholar] [CrossRef]
- van Oosterhout, C.; Hutchinson, W.F.; Wills, D.P.M.; Shipley, P. MICRO-CHECKER: Software for identifying and correcting genotyping errors in microsatellite data. Mol. Ecol. Notes 2004, 4, 535–538. [Google Scholar] [CrossRef]
- Raymond, M.; Rousset, F. GENEPOP (version 1.2): Population genetics software for exact tests and ecumenicism. J. Hered. 1995, 86, 248–249. [Google Scholar] [CrossRef]
- Carvajal-Rodriguez, A. Myriads: P-value-based multiple testing correction. Bioinformatics 2018, 34, 1043–1045. [Google Scholar] [CrossRef]
- Weir, B.S.; Cockerham, C.C. Estimating F-statistics for the analysis of population structure. Evolution 1984, 38, 1358–1370. [Google Scholar] [CrossRef]
- Ryman, N.; Jorde, P.E. Statistical power when testing for genetic differentiation. Mol. Ecol. 2001, 10, 2361–2373. [Google Scholar] [CrossRef]
- Guo, S.W.; Thompson, E.A. Performing the exact test of Hardy-Weinberg proportion for multiple alleles. Biometrics 1992, 48, 361–372. [Google Scholar] [CrossRef]
- Balloux, F.; Lugon-Moulin, N. The estimation of population differentiation with microsatellite markers. Mol. Ecol. 2002, 11, 155–165. [Google Scholar] [CrossRef]
- Pritchard, J.K.; Stephens, M.; Donnelly, P. Inference of population structure using multilocus genotype data. Genetics 2000, 155, 945–959. [Google Scholar] [CrossRef]
- Earl, D.A.; vonHoldt, B.M. Structure Harvester: A website and program for visualizing STRUCTURE output and implementing the Evanno method. Conserv. Genet. Resour. 2012, 4, 359–361. [Google Scholar] [CrossRef]
- Jakobsson, M.; Rosenberg, N.A. Clumpp: A cluster matching and permutation program for dealing with label switching and multimodality in analysis of population structure. Bioinformatics 2007, 23, 1801–1806. [Google Scholar] [CrossRef]
- Rosenberg, N.A. DISTRUCT: A program for the graphical display of population structure. Mol. Ecol. Notes 2004, 4, 137–138. [Google Scholar] [CrossRef]
- Jombart, T. adegenet: A R package for the multivariate analysis of genetic markers. Bioinformatics 2008, 24, 1403–1405. [Google Scholar] [CrossRef]
- Wright, S. Isolation by distance. Genetics 1943, 28, 139–156. [Google Scholar] [CrossRef]
- Slatkin, M. Isolation by distance in equilibrium and non-equilibrium populations. Evolution 1993, 47, 264–279. [Google Scholar] [CrossRef] [PubMed]
- Mantel, N. The detection of disease clustering and a generalized regression approach. Cancer Res. 1967, 27, 209–220. [Google Scholar] [PubMed]
- Rousset, F. Genetic differentiation and estimation of gene flow from F-statistics under isolation by distance. Genetics 1997, 145, 1219–1228. [Google Scholar] [CrossRef] [PubMed]
- Phillips, S.J.; Anderson, R.P.; Schapire, R.E. Maximum entropy modeling of species geographic distributions. Ecol. Model. 2006, 190, 231–259. [Google Scholar] [CrossRef]
- Hanley, J.A.; McNeil, B.J. The meaning and use of the area under a receiver operating characteristic (ROC) curve. Radiology 1982, 143, 29–36. [Google Scholar] [CrossRef]
- Spear, S.F.; Balkenhol, N.; Fortin, M.J.; McRae, B.H.; Scribner, K. Use of resistance surfaces for landscape genetic studies: Considerations for parameterization and analysis. Mol. Ecol. 2010, 19, 3576–3591. [Google Scholar] [CrossRef]
- Dong, X.; Zhang, J.D.; Gu, X.D.; Wang, Y.J.; Bai, W.K.; Huang, Q.Y. Evaluating habitat suitability and potential dispersal corridors across the distribution landscape of the Chinese red panda (Ailurus styani) in Sichuan, China. Glob. Ecol. Conserv. 2021, 28, e01705. [Google Scholar] [CrossRef]
- Wang, Y.H.; Yang, K.C.; Bridgman, C.L.; Lin, L.K. Habitat suitability modelling to correlate gene flow with landscape connectivity. Landsc. Ecol. 2008, 23, 989–1000. [Google Scholar] [CrossRef]
- McRae, B.H.; Shah, V.B.; Mohapatra, T.K. Circuitscape User Guide. Available online: http://www.circuitscape.org (accessed on 20 December 2022).
- Beier, P.; Majka, D.R.; Spencer, W.D. Forks in the road: Choices in procedures for designing wildland linkages. Conserv. Biol. 2008, 22, 836–851. [Google Scholar] [CrossRef]
- Tian, X.M. Studies on Population Genetics and Factors Driving Differentiation of Cervus Canadensis Xanthopygus. Ph.D. Thesis, Northeast Forestry University, Harbin, China, 2021. (In Chinese). [Google Scholar]
- Gao, H. Studies on Population Genetics and Factors Driving Differentiation of Alashan Red Deer. Ph.D. Thesis, Northeast Forestry University, Harbin, China, 2020. (In Chinese). [Google Scholar]
- Zhou, C.L. The Study on Population Size, Genetic Structure, Home Range and Phylogeny of Tianshan Red Deer (Cervus elaphus songaricus). Ph.D. Thesis, Xinjiang University, Urumqi, China, 2015. (In Chinese). [Google Scholar]
- Liu, Y.H.; Zhang, M.H. Population genetic diversity in Tibet red deer (Cervus elaphus wallichi) revealed by mitochondrial Cty b gene analysis. Acta Ecol. Sin. 2011, 31, 1976–1981. (In Chinese) [Google Scholar]
- Harik, M.; Tumur, A.; Ohtaishi, N. Tarim Red Deer of Xinjiang in China; Xinjiang University Press: Xinjiang, China, 2012; pp. 18–19. [Google Scholar]
- Maimaiti, T.; Turefu, T.; Ababaikeri, B.; Aili, S.; Halike, M. Influence of environment factors on genetic diversity of Tarim red deer. Chin. J. Wildl. 2018, 39, 754–760. (In Chinese) [Google Scholar]
- Hmwe, S.S.; Zachos, F.E.; Sale, J.B.; Rose, H.R.; Hartl, G.B. Genetic variability and differentiation in red deer (Cervus elaphus) from Scotland and England. J. Zool. 2006, 270, 479–487. [Google Scholar] [CrossRef]
- Honnay, O.; Coart, E.; Butaye, J.; Adriaens, D.; Glabeke, S.V.; Roldán-Ruiz, I. Low impact of present and historical landscape configuration on the genetics of fragmented Anthyllis vulneraria populations. Biol. Conserv. 2006, 127, 411–419. [Google Scholar] [CrossRef]
- Keyghobadi, N.; Roland, J.; Strobeck, C. Influence of landscape on the population genetic structure of the alpine butterfly Par-nassius smintheus (Papilionidae). Mol. Ecol. 1999, 8, 1481–1495. [Google Scholar] [CrossRef]
- Lugon-Moulin, N.; Hausser, J. Phylogeographical structure, postglacial recolonization and barriers to gene flow in the distinctive Valais chromosome race of the common shrew (Sorex araneus). Mol. Ecol. 2002, 11, 785–794. [Google Scholar] [CrossRef]
- Storfer, A.; Murphy, M.; Evans, J.; Goldberg, C.S.; Robinson, S.; Spear, S.F.; Dezzani, R.; Delmelle, E.; Vierling, L.; Waits, L.P. Putting the ‘landscape’ in landscape genetics. Heredity 2007, 98, 128–142. [Google Scholar] [CrossRef]
- Coulon, A.; Cosson, J.F.; Angibault, J.M.; Cargnelutti, B.; Galan, M.; Morellet, N.; Petit, E.; Aulagnier, S.; Hewison, A.J.M. Landscape connectivity influences gene flow in a roe deer population inhabiting a fragmented landscape: An individual-based approach. Mol. Ecol. 2004, 13, 2841–2850. [Google Scholar] [CrossRef]
- Zhou, L.; Yin, B.F.; Yang, S.M.; Huai, H.Y.; Li, S.P.; Zhang, Y.L.; Wei, W.H. Effects of Qinghai-Tiber Highway on genetic differentiation of planteau pilka (Ochotona curzoniae). Acta Ecol. Sin. 2006, 26, 3572–3577. (In Chinese) [Google Scholar]
- Laurence, S.; Smith, M.J.; Schulte-Hostedde, A.I. Effects of structural connectivity on fine scale population genetic structure of muskrat, Ondatra zibethicus. Ecol. Evol. 2013, 3, 3524–3535. [Google Scholar] [CrossRef]
- Miller, W.; Diefenbach, D.; Miller-Butterworth, C.; Brown, J.; Walter, W.D. Landscape barriers influence genetic connectivity among white-tailed deer in an area affected by chronic wasting disease. In Proceedings of the 65th Annual International Conference of the Wildlife Disease Association, New York, NY, USA, 31 July–5 August 2016. [Google Scholar]
- Zhou, S.C.; Zhang, M.H. An integrated analysis into the causes of ungulate mortality in the Wanda Mountains (Heilongjiang Province, China) and an evaluation of habitat quality. Biol. Conserv. 2011, 144, 2517–2523. [Google Scholar] [CrossRef]
- Baltensperger, A.P.; Joly, K. Using seasonal landscape models to predict space use and migratory patterns of an arctic ungulate. Mov. Ecol. 2019, 7, 18. [Google Scholar] [CrossRef] [PubMed]
- Teng, Y.; Zhang, Z.; Zhang, S.L.; Yang, Y.X.; He, W.; Wang, N.; Zhang, Z.Y.; Bao, W.D. Habitat suitability analysis and ecological corridor designs for red deer (Cervus elaphus) in the southern Greater Khingan Mountains. Acta Ecol. Sin. 2022, 41, 5990–6000. (In Chinese) [Google Scholar]
Disclaimer/Publisher’s Note: The statements, opinions and data contained in all publications are solely those of the individual author(s) and contributor(s) and not of MDPI and/or the editor(s). MDPI and/or the editor(s) disclaim responsibility for any injury to people or property resulting from any ideas, methods, instructions or products referred to in the content. |
© 2023 by the authors. Licensee MDPI, Basel, Switzerland. This article is an open access article distributed under the terms and conditions of the Creative Commons Attribution (CC BY) license (https://creativecommons.org/licenses/by/4.0/).