Review

On the Advent of Super-Resolution Microscopy in the Realm of Polycomb Proteins

1
Nanoscopy, Istituto Italiano di Tecnologia, Via E. Melen 83, 16152 Genova, Italy
2
Molecular Microscopy and Spectroscopy, Istituto Italiano di Tecnologia, Via E. Melen 83, 16152 Genova, Italy
3
R&D Department, Genoa Instruments s.r.l., Via E. Melen 83, 16152 Genova, Italy
4
Department of Surgical, Medical and Molecular Pathology, and Critical Care Medicine, University of Pisa, Via Roma 65, 56126 Pisa, Italy
5
DIFILAB, Dipartimento di Fisica, Università degli Studi di Genova, Via Dodecaneso 33, 16146 Genova, Italy
6
Unit of Cell and Developmental Biology, Department of Biology, University of Pisa, Strada Statale dell’Abetone Brennero 4, 56123 Pisa, Italy
7
NEST, Scuola Normale Superiore and Istituto Nanoscienze-CNR, Piazza San Silvestro 12, 56127 Pisa, Italy
*
Authors to whom correspondence should be addressed.
These authors contributed equally to this work.
Biology 2023, 12(3), 374; https://doi.org/10.3390/biology12030374
Submission received: 31 December 2022 / Revised: 23 February 2023 / Accepted: 24 February 2023 / Published: 26 February 2023

Abstract

:

Simple Summary

The genomes of metazoans are organized at multiple spatial scales, ranging from the double helix of DNA to whole chromosomes. The intermediate genomic scale of kilobases to megabases, which corresponds to the 50–300 nm spatial scale, is particularly interesting because the tridimensional arrangement of chromatin is implicated in multiple regulatory mechanisms. Indeed, a crucial hallmark of cellular life is the widespread ordering of many biological processes in nano-/mesoscopic domains (10–200 nm), which now may be revealed by an imaging toolbox referred to as super-resolution microscopy. In this context, polycomb proteins stand as major epigenetic modulators of chromatin function, acting prevalently as repressors of gene transcription. This work reviews the current state-of-the-art super-resolution microscopy applied to polycomb proteins. Of note, super-resolution data have complemented cutting-edge molecular biology methods in providing a rational framework for understanding how polycomb proteins may shape 3D chromatin topologies and functions.

Abstract

The genomes of metazoans are organized at multiple spatial scales, ranging from the double helix of DNA to whole chromosomes. The intermediate genomic scale of kilobases to megabases, which corresponds to the 50–300 nm spatial scale, is particularly interesting, as the 3D arrangement of chromatin is implicated in multiple regulatory mechanisms. In this context, polycomb group (PcG) proteins stand as major epigenetic modulators of chromatin function, acting prevalently as repressors of gene transcription by combining chemical modifications of target histones with physical crosslinking of distal genomic regions and phase separation. The recent development of super-resolution microscopy (SRM) has strongly contributed to improving our comprehension of several aspects of nano-/mesoscale (10–200 nm) chromatin domains. Here, we review the current state-of-the-art SRM applied to PcG proteins, showing that the application of SRM to PcG activity and organization is still quite limited and mainly focused on the 3D assembly of PcG-controlled genomic loci. In this context, SRM approaches have mostly been applied to multilabel fluorescence in situ hybridization (FISH). However, SRM data have complemented the maps obtained from chromosome capture experiments and have opened a new window to observe how 3D chromatin topology is modulated by PcGs.

1. Introduction

The human genome has the potential to generate hundreds of cell types through a vast repertoire of gene expression patterns. This is shown by the low percentage (1.5%) of the genome allocated to encoding proteins [1], whilst the remaining 98.5% codes for regulatory elements, the functions of most of which are still largely unknown. The approximately 6 billion bases of DNA are wrapped around 30 million nucleosome octamers, forming a complex macromolecular environment named chromatin. Chromatin organization regulates the landscape in which the activity state of the genome is modulated and perpetuated. Two mechanisms serve to increase the information content of the genome, thereby constituting the epigenome: chemical modifications of DNA and histones and changes in the local compaction state and nuclear localization of chromatin. These mechanisms are deeply interleaved [2], and the result is the hierarchical organization of chromatin across multiple scales shaped by chromatin-acting proteins (Figure 1) [3]. Starting from the micron scale, individual chromosomes in interphase segregate into chromosome territories. Each chromosome is further subdivided into A and B compartments, which refer to gene-active and gene-inactive regions of a few megabases (Mb) and span several hundredths of nanometers [3]. Below the compartment scale, chromatin organizes into Topological Associated Domains (TADs), which represent dynamic regions of extended interactions between DNA chains [4]. These regions are often insulated from each other by loops pinched by CCCTC-binding factors (CTCFs) and cohesin [3]. TADs comprise DNA segments ranging in size from 100 kilobases (kb) up to several megabases and they are supposed to segregate genes and their distal regulatory elements into compartments crucial for tailored gene regulation [1]. Recently, it was shown that TADs can be further subdivided into smaller chromatin nanodomains (CNDs), the sizes of which are around 100 nm and which embed about 10–100 kb. CNDs are the domains where most enhancer–promoter (E–P) contacts take place [5]. At the lowest hierarchy level, nucleosomes are organized into clutches containing about 1–2 kb of DNA [5].
This complex landscape organization is governed by the intertwined epigenetic actions of several moieties, some of which operate at the lowest level of chromatin organization, i.e., by activating the chemical modifications of genomic loci and/or of histone tails. Post-translational modifications of histone tails can in turn generate docking sites or modulate the affinity of nuclear proteins for chromatin [6]. Crucially, many chromatin remodelers operate at the nano-/mesoscale, from a few nanometers up to 200–300 nm. In the context of high-order chromatin organization, a pivotal role is played by the polycomb group proteins (PcGs) [7]. PcGs constitute a large family of proteins which assemble into multiprotein complexes that are able to establish a transcriptionally repressive chromatin state which changes over time by a synergistic combination of chemical histone modifications with physical crosslinking of distal genomic regions [7]. The PcG machinery is present throughout most eukaryotic lineages and is known to play a key role in embryonic stem cell biology [7] and cell lineage commitment [8], as well as being involved in malignant transformation processes [9].
Knowledge of multiscale genome organization and multifaceted gene regulation is still in its infancy. However, techniques for mapping genomic regions with increasing spatial resolution have made considerable progress in the last two decades. The dawn of this new era was marked by the appearance of new techniques mapping genome organization by ligating linearly distal regions that come into 3D spatial proximity [5]. In addition, a remarkable contribution was allowed by the recent developments of fluorescence super-resolution microscopy (SRM), a toolbox of imaging techniques highly suited to address the meso-/nanoscale of TAD and CND organization since they are able to break the classical diffraction limit of conventional optical (fluorescence) microscopes [10]. SRM leverages detection modalities which combine the ability to recognize single emitters and the shaping of the illumination beam, enabling the visualization of structures only a few tens of nanometers apart by separating them in time and space, respectively [11]. Some SRM approaches have—in principle—no spatial resolution limit, and imaging at the molecular scale has been repeatedly demonstrated [12]. Practically, SRMs seldom achieve the routine <10 nm resolution of electron microscopy, which, since the seminal studies of Bernhard et al. sixty years ago [13], has strongly contributed to the understanding of chromatin structure in situ [14,15]. Compared to electron microscopy, however, SRMs enable the recognition of several molecular signatures at a time (multiplex functional imaging) and the dynamic changes occurring in living cells to be addressed.
The purpose of this paper is to provide an updated review of SRM studies aimed at PcG regulation of chromatin epigenetic states. Accordingly, we will briefly review the basic idea and the major features of SRM (Section 2). Then, we will describe the nature of polycomb proteins and their organization in multiprotein complexes (Section 3 and Section 4). Finally, we will review the SRM studies carried out to understand how PcGs modulate chromatin topology (Section 5) and X-chromosome inactivation (Section 6). A concluding paragraph will recapitulate the present knowledge on this topic.

2. Super-Resolution Microscopy (SRM)

In this section, we provide a short introduction to the basic idea of SRM and the four main families in which it is currently articulated. The reader is referred to more specialized reviews for comprehensive descriptions of this field of microscopy [10,11,12].
From a purely physical perspective, the light emitted by any point source—for instance, a fluorescent molecule in the focus of a microscope objective—undergoes diffraction, and the point will appear in the image as the so-called Airy diffraction pattern [16]. Owing to the reversibility of optical pathways, the same phenomenon occurs when light is focused at one point, for example, when a sample is illuminated to excite fluorescence. The 3D region individuated by the Airy diffraction pattern is called the point spread function (PSF). The finite size of the PSF limits the spatial resolution of the optical system, according to an equation developed by the physicist Ernst Abbe, which states that the minimal distance d at which two signals may be distinguished by a microscope (actually, the highest spatial frequency of the image) is given by [17]:
d = λ / 2 N A
where λ is the wavelength of the probing radiation and NA is the numerical aperture of the microscope objective. In practice, popular confocal microscopes are limited to approximately 200–300 nm of lateral resolution (in the xy-plane of the sample) and 600–1000 nm of axial resolution (along the z-axis of the sample). Nonetheless, this limit has been demonstrated to be apparent. Following the original idea of Toraldo di Francia, the resolving power of an optical instrument, such as a microscope, is not a well-defined physical quantity, as it depends critically on the amount of information about the object being observed [18]. For instance, the resolving power of a confocal microscope is limited by the fact that all fluorophores residing in the excitation PSF are quasi-simultaneously excited and emit light together. Therefore, their emissions diffract together and are detected together as the product of excitation and emission PSFs. In order to overcome this limitation, we must introduce additional information into the system. For example, we may alter in a controlled way the probability of the molecules emitting in the excitation region, separating their emissions in space and/or in time and preventing them from being detected together. This approach is the key to super-resolution microscopy.
The SRM family with the highest resolution improvements is called single molecule localization microscopy (SMLM; Figure 2a) [19]. SMLM includes stochastic optical reconstruction microscopy (STORM [20]), as well as its variant direct STORM (dSTORM [21]), and fluorescence photo-activated localization microscopy (F-PALM [22,23]). In SMLM, fluorophores belonging to the same excitation PSF are separated out in the temporal dimension by collecting their emissions one at a time. In practice, SMLM leverages fluorophores that can be converted from a fluorescent (or activated) state to a dark (or inactivated) state, either irreversibly or reversibly. The excitation mode ensures a stochastic emission of only a few fluorophores at a time, ensuring that individual emitters do not overlap their PSFs in a single imaging frame. The sample undergoes several activation/inactivation cycles, which result in thousands of acquisition frames, each characterized by a few, spatially sparse, emitting single molecules. The precise localization of the center of each single molecule is then retrieved by a post-acquisition algorithm, generating super-resolution images with a lateral resolution as low as 10–20 nm. Actually, in SMLM, resolution does not have its classical meaning, being replaced by the localization precision of the single molecules. Nonetheless, the astounding resolution of SMLM comes at the price of long acquisition times, since the localization precision is inversely correlated with the square root of the number of acquired photons [19]. This usually restricts STORM and F-PALM approaches to fixed samples, although living cells have been studied through the adoption of tailored strategies and/or fluorophores [24,25]. SMLM can also be performed in 3D mode [19]. Of note, STORM and dSTORM have been widely applied in super-resolution chromatin studies [4].
A second approach to SRM separates emitting molecules by means of excited state depletion by stimulated emission, which is triggered by strong laser illumination on the low-energy tail of the dye’s emission spectrum [26]. This approach, called stimulated emission depletion (STED; Figure 2b), leverages a confocal configuration supplied with a donut-shaped depletion laser beam superimposed upon the focused excitation spot, thereby keeping all fluorescent molecules dark except those at the center of the donut (Figure 2). Raster-scanning the sample allows the sequential registration of fluorescence from only those dyes that are effectively excited at each spatial location [26]. STED may reach a lateral resolution of 30–50 nm, albeit the strong laser intensity requires specific fluorophores [27]. Lower depletion intensities can be obtained by exploiting fluorophore lifetime [28] or through a modified version called reversible saturable optical fluorescence transitions (RESOLFT), which requires reversibly photoswitching fluorophores [29]. Like SMLM, STED has been repeatedly applied to investigate chromatin organization [30].
Both SMLM and STED do not have in principle theoretical resolution limits [12], because there is no theoretical (information) limit in separating out single emitters in the excitation PSF with infinite spatial precision. In practice, resolution limits are mostly related to the fluorescent labels and the technical implementation of SRM. Recently, a new approach called MINFLUX, which relies on the localization of individually switchable fluorophores with a probing donut-shaped excitation beam has been demonstrated to reach <10 nm resolution with minimum photon fluxes [31]. In MINFLUX, about two orders of magnitude fewer photons are required to achieve equivalent resolutions to the best-performing SMLM techniques [32]. However, MINFLUX instruments first appeared on the market only in late 2019, and the technique is not widely available.
While STED has been utilized to image live samples [33,34,35], it is usually applied to image fixed samples. This is mostly due to the complex genetic encoding of fluorophores which comply with the strong depletion intensities of STED (particularly in conventional continuous-wave STED) [27]. The need for specific fluorophores also reduces the spectral multiplexing of STED. Some of these issues are addressed, albeit at the cost of lower resolution gains (about twofold over diffraction-limited microscopy), by less challenging SRM techniques which leverage the structuring of the excitation pattern or of the detection device and offer an effective strategy to image living samples.
Structured illumination microscopy (SIM; Figure 2c) leverages a non-uniform illumination pattern whose interference with the spatial frequencies of the sample (the “Moirè effect”) generates an emission pattern that can be analyzed in the Fourier mathematical space to improve the resolution (Figure 2) [36]. A major advantage of SIM is its full compatibility with standard fluorophores and labelling procedures; it also enables multicolor imaging of living cells. SIM was applied early in chromatin studies [37] and has allowed the visualization of CNDs contained in TADs, demonstrating that ~100–120 nm resolution may be sufficient to visualize chromatin subdomains [38,39].
A more flexible alternative to SIM is represented by image scanning microscopy (ISM; Figure 2d) [40,41]. The optical sectioning ability of a confocal microscope is mainly due to the pinhole spatial filter placed in a conjugate image plane in front of the detector along the fluorescence detection path. Ideally, by closing the pinhole below 0.2 AU, dxy would be improved by a factor 2 compared to 1 AU, at the price of a dramatic decrease in the signal reaching the detector (95%) and severe degradation of the signal-to-noise ratio (SNR) of the final image. ISM overcomes this limitation by replacing the single point detector of a confocal microscope with a detector array [42,43]. Each element of the array generates a “confocal” image of the sample, the images differing in terms of information content, as they map different spatial regions of the point spread function generated by the light coming from the objective focus. By the “pixel-reassignment method”, i.e., the sum of all the scanned images after a spatial shift and intensity normalization, an ISM image (PR-ISM) is generated with an effective radial resolution improvement ≥ 2 , with an SNR equivalent or larger than that obtained at 1 AU (Figure 2) [44]. To extend the resolution further down to 100–120 nm, ISM usually makes use of an adaptive multi-image deconvolution algorithm. Despite these advantages, ISM has only been minimally applied to investigate the organization of chromatin at sub-diffraction resolution [4], despite its robust and versatile technical implementation, which affords high spectral multiplexing and may also be compatible with lifetime detection, affording further layers of imaging contrast [40], although a recent paper by the present authors applied ISM to investigate the functional colocalization of PRC1 and PRC2 in differentiated lung cells [45].

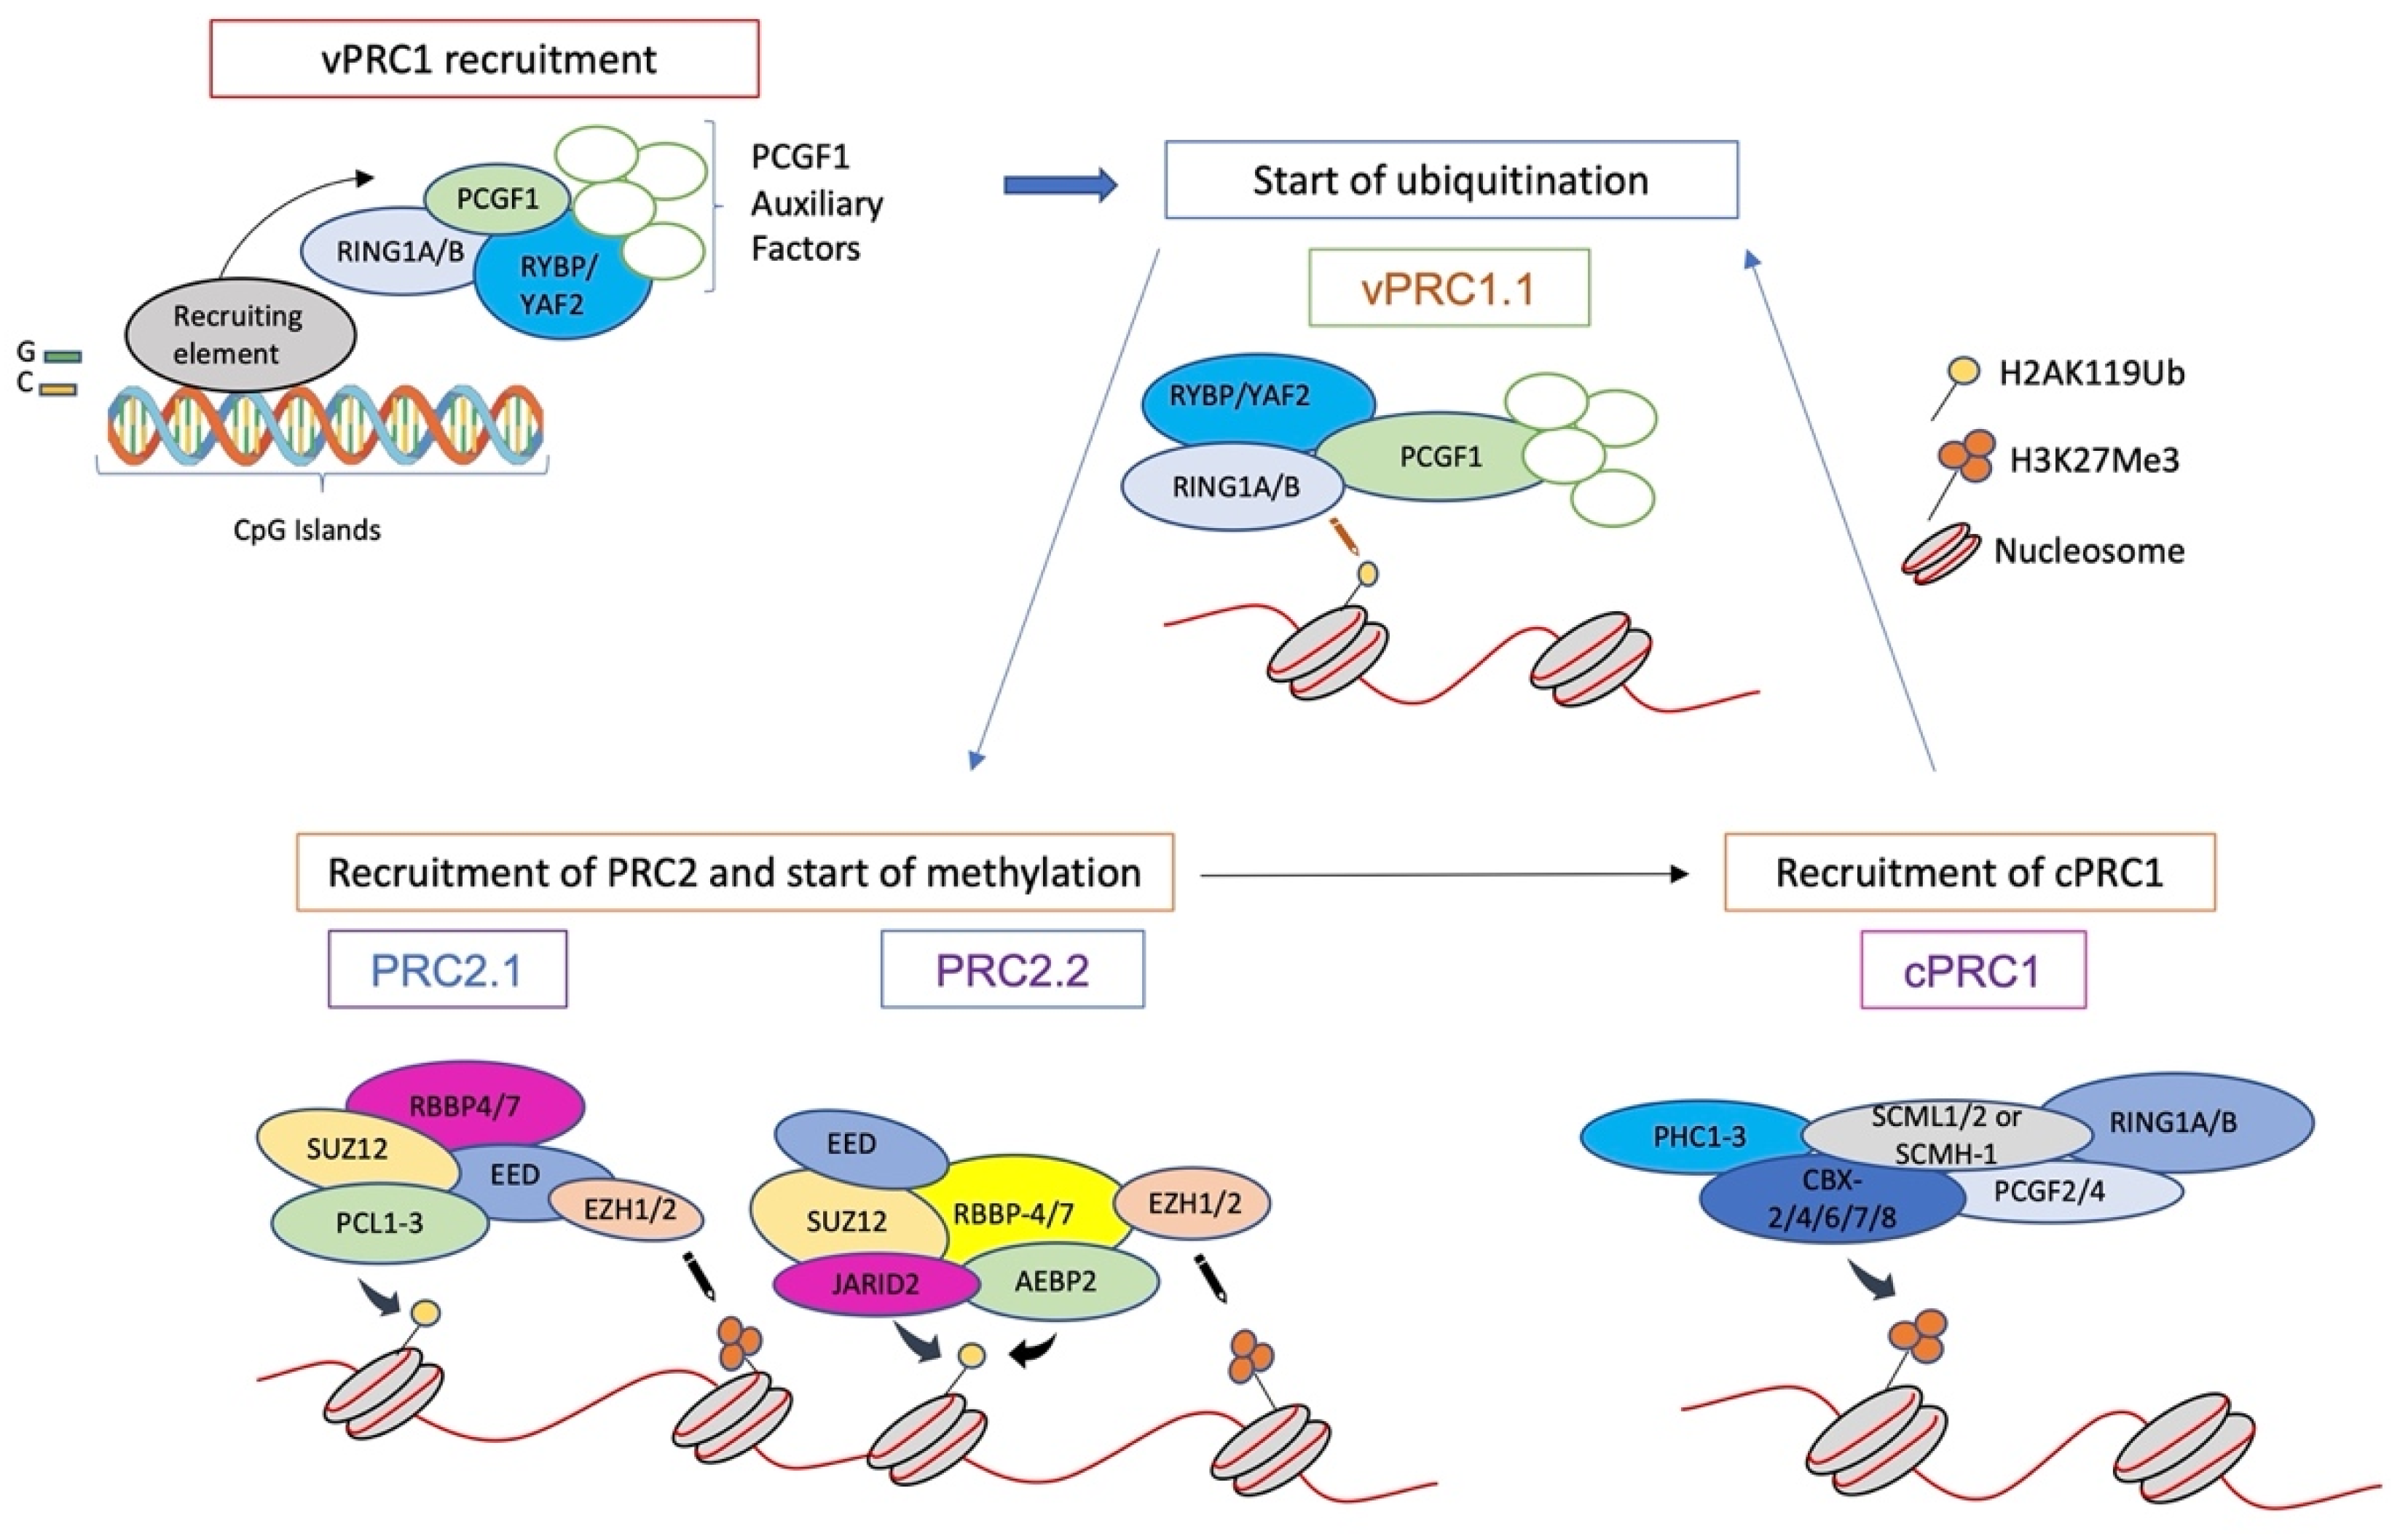
3. Structure of Polycomb Repressor Complexes PRC1 and PRC2

Originally, the name “polycomb” was used for a Drosophila mutant showing improper body segmentation on account of misregulation of the Hox genes [46]. Polycomb Group proteins (PcG) have since been identified as a group of negative transcription factors sustaining the formation of facultative heterochromatin and thereby dynamically defining key aspects of cell identity and activity [7,47]. PcG proteins assemble into protein complexes that are highly conserved from flies to mammals [48] and work through the post-transcriptional modification of histones at two marks: trimethylation at lysine 27 (H3K27Me3) of Histone H3 and ubiquitination at lysine 119 of histone H2A (H2AK119Ub) [49]. Most PcG proteins assemble into two main protein complex groups, Polycomb-repressive complexes 1 (PRC1; Figure 3) and Polycomb-repressive complexes 2 (PRC2; Figure 4). PRC1 and PRC2 are responsible for the deposition of H2AK119Ub and H3K27me3, respectively [47].
In mammals, PRC1 is characterized by six different forms (PRC1.1-PRC1.6) [50], whereas PRC2 exists in two different main forms (PRC2.1 and PRC2.2) [7]. The core component of PRC1 is a heterodimer of one of the two E3-ubiquitin ligases RING1A/B (Really Interesting New Gene 1 A or its alternative isoform B) and one of the six PCGF1-6 (Polycomb Group Ring Finger) paralogs (Figure 3). In “variant” PRC1s (vPRC1), RING1A/B associates with either PCGF1, 3, 5, or 6 (Figure 3). vPRC1s also include YY1-binding protein (RYBP) or its paralogue YAF2, along with various additional subunits depending on the PCGF component. Of note, vPRC1s are responsible for most H2AK119Ub deposition, given their enhanced E3-ligase activity due to RYBP or YAF2 [51]. The core of “canonical” PRC1 (cPRC1) is the heterodimer of RING1A/B with either PCGF2 or 4 (Figure 3). cPRC1s also includes one of the CBX2/4/6/7/8 (Chromobox Homologs) proteins, one of the PHC1-3 (Polyhomeotic Homolog) proteins, and SCMH1/L2 (Sex Combs on Midleg Homolog 1/Like 2). CBX proteins are characterized by chromodomains that can bind to H3K27me3 and/or H3K9me3 repressive marks and are thought to play a key role in recruiting PRC1 at PcG-repressed sites [52]. PHC1-3 proteins contain a Sterile Alpha Motif (SAM) domain that allows the formation of long-range interactions among PRC1 complexes [53]. cPRC1s displays much lower ubiquitination activity compared to vPRC1 [54], but it is tailored to alter chromatin structure and topology [53,55].
PRC2 complexes assemble around a tetrameric core composed of EZH2/1 (Enhancer of Zeste Homolog 2 or its paralog 1), EED (Embryonic Ectoderm Development), SUZ12 (Supressor Of Zeste 12 Homolog Protein), and RBBP4/7 (Retinoblastoma Binding Protein 4 or 7) (Figure 4) [7]. The histone methyltransferase (HMTase) activity of PRC2 is conferred by EZH2/1, and it is enhanced by a positive feedback loop relying on the specific recognition of the H3K27me3 by EED, followed by allosteric activation of PRC2 by the same protein [56]. PRC2 splits further into two sub-complexes, PRC2.1 and PRC2.2 (Figure 4), whose different protein components aggregated to the tetrameric core modulate HMTase activity and/or its targeting to DNA (Figure 4) [57,58].

4. Formation and Spread of Polycomb Domains onto Chromatin

The first model of PcG recruitment onto chromatin was inferred from Drosophila studies and describes a hierarchical interplay between the polycomb complexes, where PRC2 is recruited first at Polycomb Response Elements (PREs) by sequence-specific DNA-binding factors, methylation of H3 occurs, and this further recruits PRC1 [59]. This very simple model has been more recently questioned by a study that showed no unique hierarchy for coordinated recruitment of PRC1 and PRC2 at polycomb response elements [60]. In mammals, PcGs mainly identify target gene promoters and other regulatory elements through their association with unmethylated CpG islands (CGIs) [61]. CGIs are short (1–2 kb) regions of CpG-rich DNA that are associated with approximately 70% of mammalian gene promoters [62]. The lysine-specific demethylase 2B (KDM2B), which participates in vPRC1.1, contains a zinc-finger-CXXC domain that specifically binds to unmethylated CpGs, thereby docking vPRC1.1 to CGIs in embryonic stem cells (ESCs) [63,64]. Thus, a “reverse hierarchical” mechanism of PcG action has been proposed in recent times [47]. In this model (Figure 5), the first step is the recruitment of vPRC1.1 onto chromatin through KDM2B and the subsequent deposition of the H2AK119Ub mark [63,65]. Then, histone modification is recognized by the AEBP2 and JARID2 modules of PRC2.2 [65,66]. PRC2 recruitment at unmethylated CGIs is further supported by PCL proteins in PRC2.1 [67,68]. Recruitment of PRC2 activates the deposition of H3K27Me3 [69], to which cPRC1 eventually docks through its CBX modules [52,70]. Interestingly, from their initial recruitment foci, PcG proteins seem to be able to spread their repressive marks bidirectionally, generating a repressive landscape for a target genomic region [7,71]. This can be ascribed to the two positive recognition/histone modification feedback mechanisms prompted by EED [72] and RYBP [73] in PRC2 and PRC1, respectively. These mechanisms also should account for the propagation and replenishment of these histone marks during DNA replication, thereby sustaining memory of polycomb repression upon cell cycle and division [73,74].
Although the actual mechanism of transcription repression by chromatin-bound PRC1/PRC2 is still partially obscure, at least two main processes have been identified [53,75]. At the nanoscale (~10 nm, 1–10 kb), CBX2 can locally force adjacent nucleosomes into compact clutches through liquid–liquid phase separation (LLPS) driven by its charged structure and the presence of an intrinsically disordered region (IDR) [76,77,78]. At the mesoscale (~100 nm, 10–100 kb), the SAM domain of the PHC module of cPRC1 enables the compaction of distal chromatin regions, generating long-range repressive chromatin multi-looped structures [79,80,81]. In both cases, chromatin compaction is believed to make the underlying genomic region inaccessible to the transcription machinery, although PcG features distinct from cPRC1 should contribute to the transcription repression [7]. Of note, the mesoscale compaction of chromatin by polyhomeotic proteins has been the only topic addressed by SRM in the context of PcG-mediated transcription repression and will be reviewed in the next section.

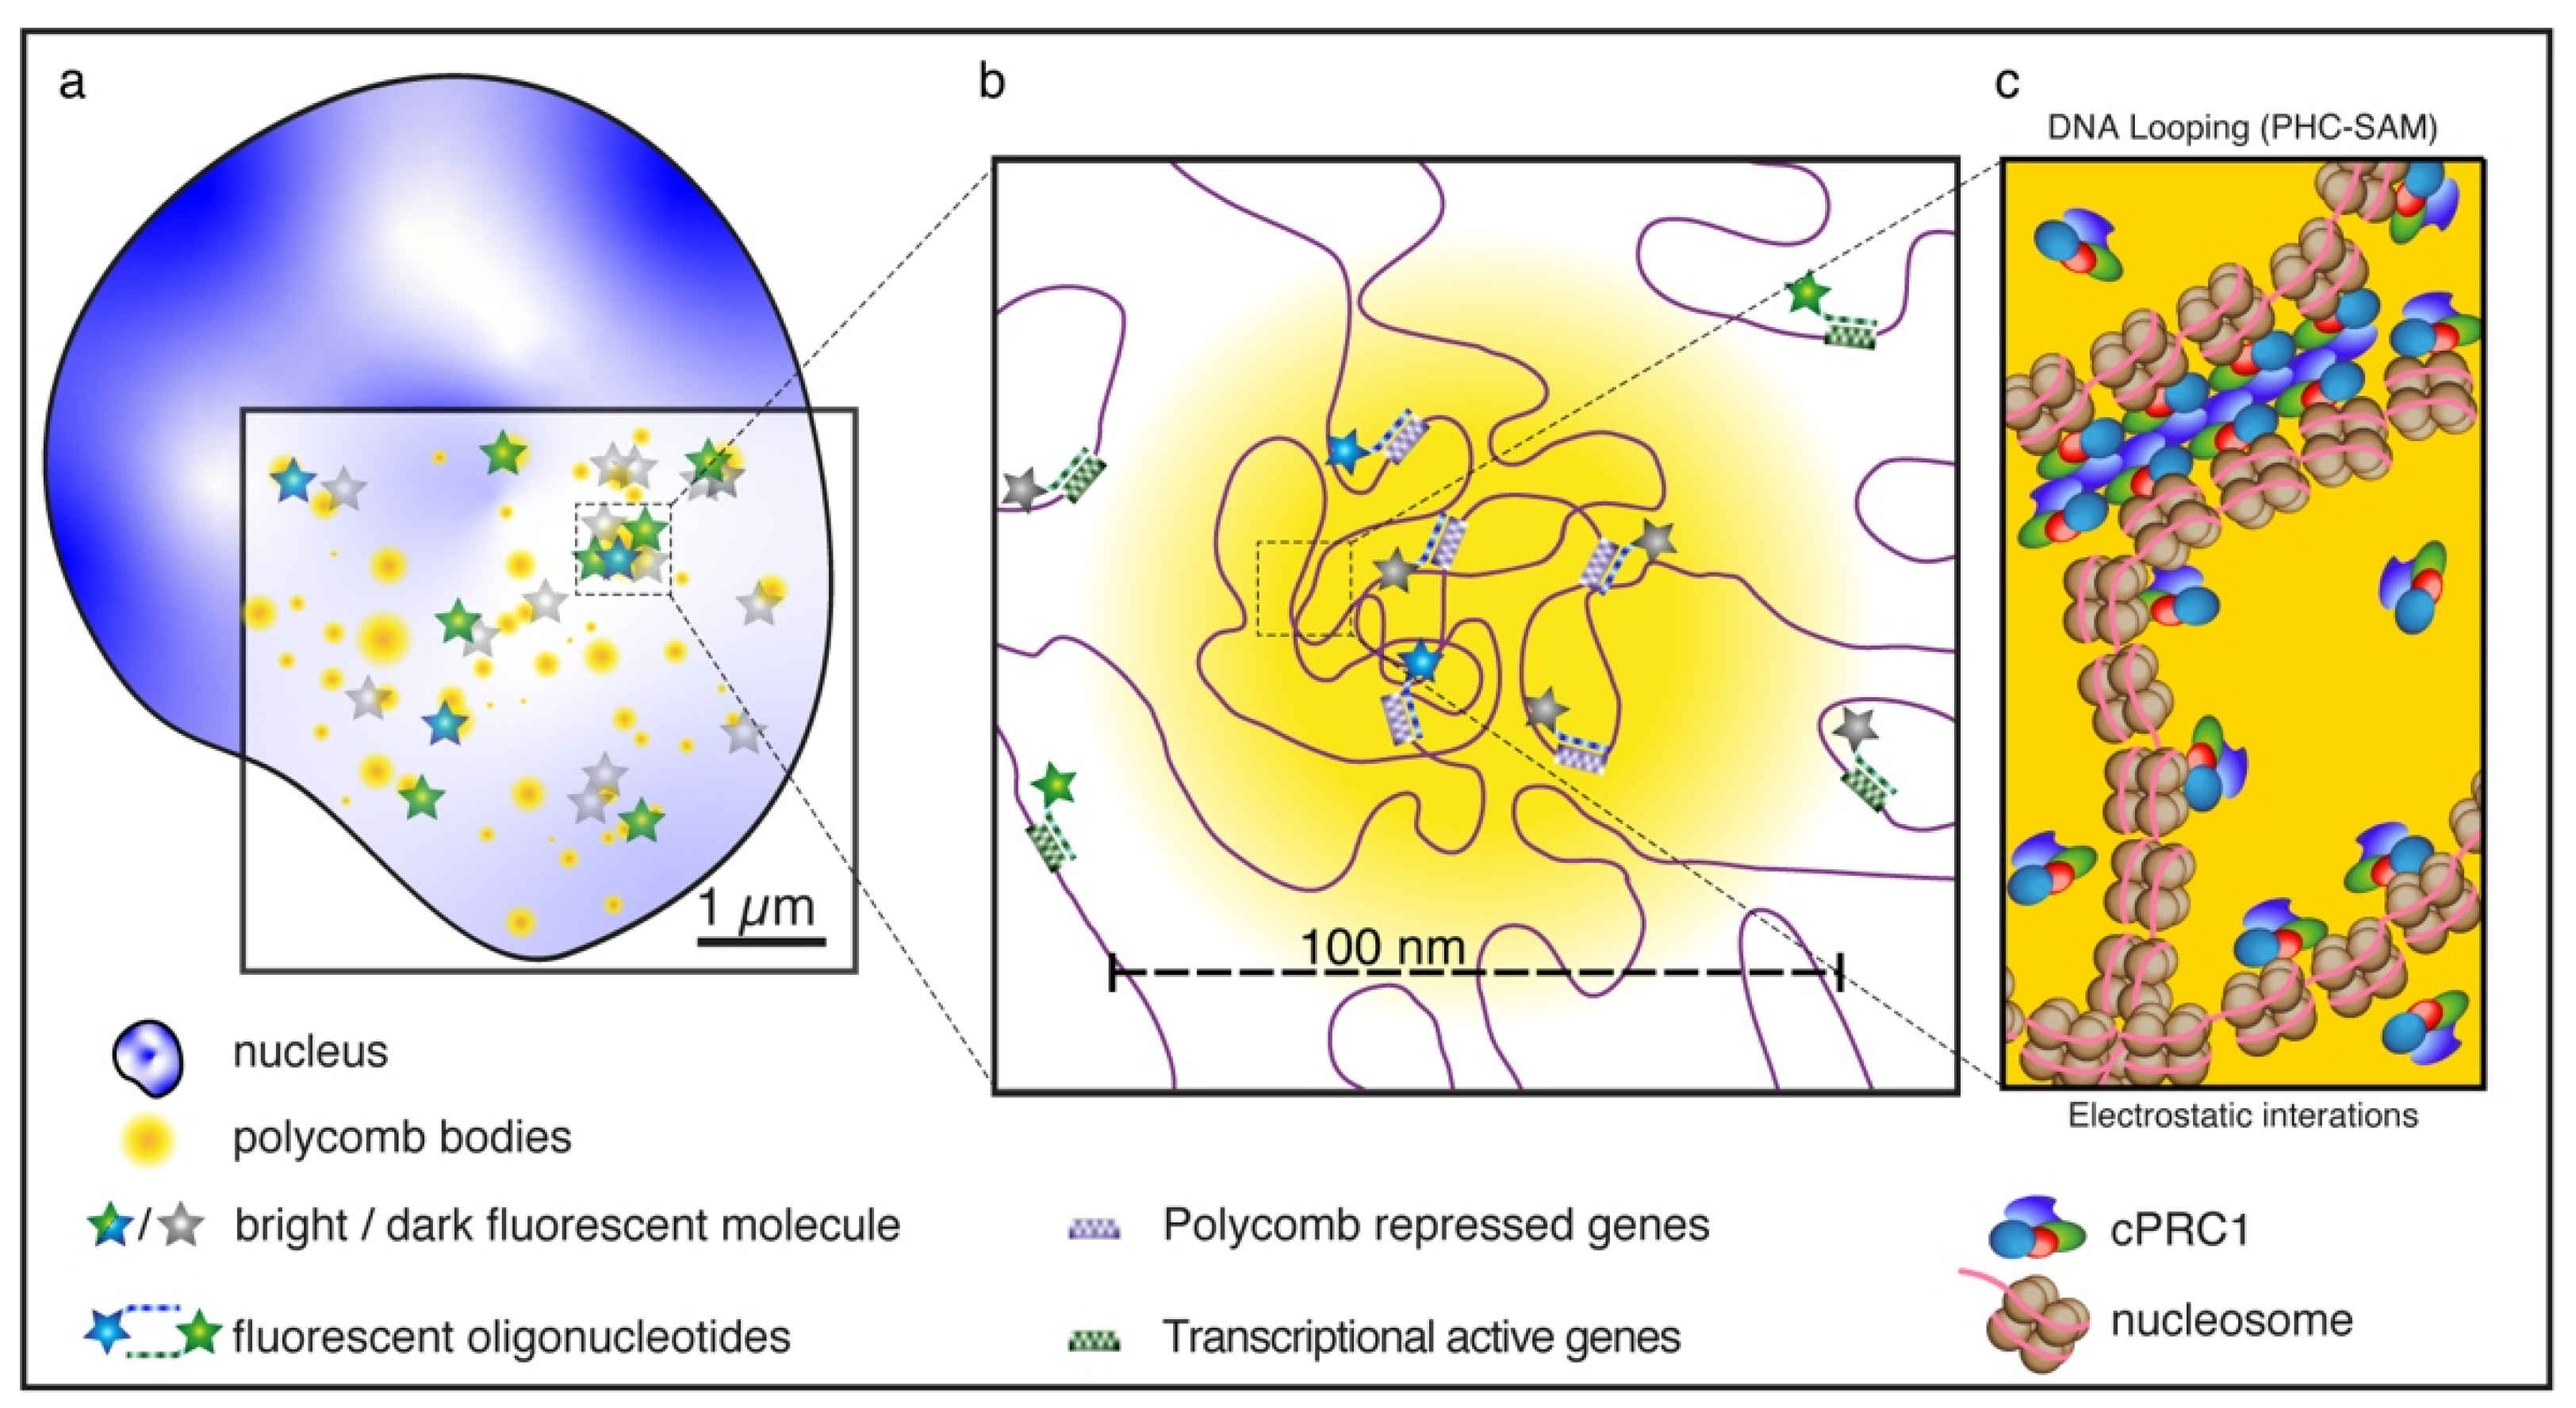
5. The Role of PRC1 in Shaping Chromatin Topology

The assembly of polycomb proteins into nuclear foci in the cells of flies and mammals, supposedly to bring PcG-regulated genes together, has been revealed by diffraction-limited fluorescence microscopy in the nineties [82,83,84]. However, only in 2016 were the first two papers reporting on the use of SRM to investigate the role of PcG in chromatin topology published [85,86]. Both these seminal studies leveraged 3D STORM [87] to examine the PcG-driven chromatin assembly in Drosophila cells. Figure 6 provides a graphical description of the main aspects of these studies.
In the first study, Boettiger et al. [85] addressed a compelling question: how to reconcile the hierarchical organization of chromatin inferred from chromatin conformation capture measurements [88] with the functional demarcation of chromatin in domains of distinct epigenetic states characterized by biochemical modifications and DNA-binding proteins [89]? In simpler terms: how does chromatin organize in 3D in different epigenetic domains? For this challenge, Boettiger combined 3D STORM with the novel “oligopaint” fluorescence in situ hybridization (FISH) approach [90] to reveal the chromatin ultrastructures (20 nm xy- and 50 nm z-resolution) of three epigenetically distinguishable sub-Mb domains of the Drosophila genome: (1) transcriptionally active, (2) polycomb-repressed, and (3) transcriptionally inactive domains [85]. Of note, these three domains had been previously stratified from ChIP-seq (chromatin immunoprecipitation followed by sequencing) and DamID (DNA adenine methyltransferase identification) data on the basis of the enrichment of histone modifications and regulatory proteins, such as PcGs. Three-dimensional STORM highlighted the volumes of hybridization regions and showed a power-law scaling dependence on genomic length, albeit with different exponents. Active regions showed the lowest chromatin packing densities and a superlinear dependence (scaling exponent > 1) on genome length. Conversely, the highest compaction was observed for the polycomb domains, for which a scaling exponent <1 indicated that the packaging density increases with domain length. These data could be easily reconciled with previous FISH studies using conventional imaging in mammalian cells [91,92]. However, 3D STORM, also in two-color mode, revealed intriguing additional features of polycomb-repressed domains, namely, their high degree of chromatin intermixing across the domain and their ability to spatially exclude neighboring active regions. This contrasted with active and inactive domains, which were found to be partially intermixed with each other and for which small subdivisions were found to possess similar scaling behaviors to their host domains. Boettiger et al. [85] elegantly demonstrated by knockdown experiments that the observed features of the compact chromatin states of polycomb-repressed domains could be directly linked to the polyhomeotic (Ph—the Drosophila analog of PHC1-3 in mammals) multimerization ability and not to the catalytic activity of Drosophila PRC1. Of note, modeling experiments suggested that the self-interacting properties of the SAM domain of Ph could be the basis of the observed biophysical differences between PcG-repressed and active/inactive regions.
The latter hypothesis was fully demonstrated in the second seminal paper of 2016 [86]. By single molecule localization (STORM mode) of target proteins immunolabeled with fluorescent antibodies, Wani et al. [86] showed that Pc and Ph components of Drosophila PRC1 assemble into numerous (600–800) aggregates of 110–140 nm in the cell nucleus, hinting at the pervasive nuclear clustering of PRC1. Strikingly, the mutation of one of the two polymerization interfaces of the SAM motif (Ph-ML) fully disassembled the PRC1 clusters, demonstrating that multi-scale clustering of Ph depends on the oligomerization capacity of its SAM domain. Monitoring chromatin topology by 4C-seq in tandem with cluster manipulation revealed that SAM-driven aggregation of PRC1 facilitates long-range chromatin interactions, particularly for distal sequences separated by >2 Mb. Removal of these interactions by abolishing SAM-driven clusterization resulted in observable changes in gene expression, including the de-repression of some well-known PcG target genes and changes in the 3D organization of chromatin fibers [47]. The comparison of molecular simulations with cluster size vs. Ph localization inferred by STORM hinted at a “bridging model”, where hundreds of molecules or primary clusters bound at a cPRC1 node polymerize with those bound at other, non-adjacent nodes on the chromatin polymer, forming a long-range network of chromatin contacts. The introduction of SAM-defective Ph molecules “caps” primary clusters at nodes, thereby avoiding their spreading to distal chromatin regions [86].
Just one year later, the crucial role of SAM-driven PRC1 clusterization in the topological organization of mammalian chromatin was visually demonstrated by an elegant study of Kundu et al. leveraging 3D STORM spatial resolution [80]. These authors investigated the extended network of cPRC1-driven chromatin interactions framing the repressed Hox genes in mouse embryonic stem cells [93], which had been previously studied by diffraction-limited FISH imaging [94]. Consistently with 5C chromosome conformation capture data, FISH by 3D STORM identified discrete and compact 20 to 140 kb PRC1 domains at Hox and other developmental loci in mouse ESCs and neural progenitors (NPCs) which were disrupted upon knockdown of the Phc1 gene [80]. Besides being much shorter than TADs, these PRC1 domains were found to span across TAD borders, suggesting that chromatin folding allows for different hierarchies through the action of different factors. Kundu et al. [80] also showed that Variant PRC1 complexes and H2A ubiquitylation are neither necessary nor sufficient for the formation of these domains. Of note, Isono et al., via biochemical and diffraction-limited FISH/immunofluorescence imaging, had previously demonstrated the essential role of the SAM domain of mouse polyhomeotic PHC2 for cPRC1 clustering to sustain the stable target binding of PRC1/PRC2 and the robust gene silencing activity of the PcG machinery [79]. Taken together, these data support a model conserved from Drosophila to mammals: the SAM motif of polyhomeotic isoforms enables PRC1 (cPRC1 in mammals) to reorganize the chromatin such that the bound loci become isolated from the surrounding non-PRC1-bound chromatin and interact primarily with other bound loci by looping out the intervening non-PcG-bound chromatin.
A more recent work [95] questioned the apparent consistency of the chromosome capture and STORM data collected by Boettiger et al. [85] to provide a realistic picture of PRC1-driven chromatin compaction in Drosophila. Indeed, Liu et al. applied a polymer-based chromosome modeling approach, termed the heterogeneous loop model (HLM) [96], to chromosome capture and STORM data, and found them to be poorly consistent with each other [95]. Of note, the same authors highlighted that previous works addressing Drosophila chromatin organization by FISH in STORM mode, albeit not directly focused on PcGs, clearly showed that PcG-repressed domains framed compaction states of chromatin similar to inactive domains [39,97]. These studies paralleled measurements by King et al. [51] that revealed reduced chromatin accessibility even by knocking out RING1b or EED. Liu et al. pointed out that this discrepancy cannot be explained solely by the so-called “FISH-HiC paradox” [98], i.e., the significant differences between the cell ensembles considered by the two techniques (i.e., millions of cells in Hi-C and a few tens in FISH). However, in their opinion, the cell model and the fixation procedure (much harsher in FISH) could have effectively biased Boettiger’s measurements [85]. A further source of bias in the assessment of chromatin compaction could be linked to the extensive pairing of homologous chromosomes that occurs in Drosophila, which leads to juxtaposed, albeit physically distinct, TADs, as revealed by SIM [39]. The “FISH-HiC paradox” itself has been questioned by studies that have revealed a very nice correlation between HiC and FISH imaging in SIM mode [39,88], supporting the idea that SRMs are able to recapitulate chromatin topology at the nanoscale in both Drosophila and mammals. Overall, this debate hints at the complex issues that must be carefully addressed in all cutting-edge studies targeting biological spatial scales unexplored by SRMs.

6. Polycomb Complexes and Xist Regulation

PRC1 and PRC2 play crucial roles in the context of X-chromosome inactivation (XCI), i.e., the lifelong silencing of one X chromosome (Xi) in mammalian females to balance gene dosage between sexes [99]. The current model of XCI involves the repressive “coating” of the cis region of Xi by the long noncoding RNA Xist, which is transcribed from Xi. XCI starts early in embryogenesis and is initiated by Xist-assisted recruitment of repressive complexes, such as SPEN, vPRC1/PRC2, and other repressive or structural proteins, to nucleation sites located all along the Xi [100,101]. At the end of the process, about 1000 genes spanning over 167 Mb are silenced [102]. Noticeably, silenced Xi regions are enriched in H3K27Me3 [103] and H2AK119ub marks [101], supporting the crucial role of PcG complexes in this process [101,104]. Epigenomic methods based on ensembles of millions of cells have led to a model in which Xist and its interactors form ribonucleoprotein complexes broadly distributed along Xi [103]. This model was supported by conventional diffraction-limited fluorescence microscopy studies [105]. However, the situation has radically changed with the advent of super-resolution microscopy [102,106,107,108].
Most notably, in 2014, Smeets et al. revealed in a 3D SIM FISH/immunofluorescence study that only 50–100 Xist molecules decorated mammalian Xi, creating distinct foci, and this number was paralleled by EZH2 foci [107]. These results were then confirmed by a subsequent paper using a 3D-STORM approach by Sanwoo et al. [108]. Overall, these data suggested that the number of Xist molecules on the Xi was much lower than previously thought [109]. Very consistently, ~100 Xist-containing complexes at the docking site of Xi, each embedding about two Xist molecules, have been recently quantified by an elegant SIM multicolor approach by Markaki et al. [102]. However, Markaki et al. [102] and Sanwoo et al. [108] differed—significantly—over the proposed mechanisms of large-scale Xi silencing. From the stoichiometry of Xist complexes and the large number of silenced genes on the X chromosome, Sunwoo et al. [108] hypothesized a “hit-and-run” model of Xist complexes shutting off genes while moving along Xi. This model was, however, eventually ruled out by the single particle tracking measurements of Markaki et al., which showed the sharp confinement of Xist complexes in well-defined genomic loci proximal to the Xist locus and enriched for repressive complexes [102]. Additionally, 3D SIM imaging revealed that Xist nucleates nanoscale supramolecular complexes (SMACs), which include hundreds of silencing proteins that accumulate into discrete Xist foci [102,110,111,112]. SMACs are dynamic entities which generate local protein gradients that are able to regulate proximal chromatin regions. The recruitment of vPRC1 (containing PCGF3/5) to Xist foci, mediated by the hnRNP K protein, activates the usual cascade of events leading to histone decorations and PRC2/cPRC1 multiscale assembly (Figure 5) [113]. From this evidence and the recently stratified knowledge about the topological modulation of chromatin by PcGs, Markaki et al. hypothesized that PcG deposition via SMACs may also induce chromatin compaction and the increase in SMAC densities around distal genes, which would explain how silencing propagates across the X chromosome. Genes in close proximity to the Xist phase-separated domains are silenced early, while more distal genes are silenced once the Xi becomes compacted through the action of PRC1 [102,112]. This mechanism is consistent with the non-dispensable role of PRC1/PRC2 in Xist-mediated gene silencing [101,113], in line with the suggested role for PcGs as “silencing stabilizers” of already silenced genes rather than active abrogators of gene transcription [114]. This model also coheres well with the poor colocalization of Xist RNA with PRC1/2 complexes and H3K27me3 that was revealed early on by the 3D SIM study of Cerase et al. [106]. It is possible that the recruitment of PRC2 into SMACs leads to a larger and time-dependent spacing of EZH2 from Xist by means of phase separation [115], as PRC2 does not seem to be directly recruited by Xist RNA [101,106].
In the context of STORM studies applied to PcGs, it is worth noting that both the effect of multiple blinking of fluorophores on stoichiometry and the nanoscale fluorophore spacing due to sequence localization plus the presence of antibody–antibody complexes were carefully evaluated by means of ingenious engineered cellular models in the study of Sunwoo et al., resulting in a resolution of >30 nm (localization precision: 20 nm) [108]. The effect of antibody–antibody spacing had been previously investigated also in the 3D SIM study of Smeets et al., resulting in a resolution of about 100 nm [107], in line with the lower resolution of 3D SIM as compared to STORM.

7. Conclusions

Super-resolution fluorescence microscopy approaches (SRMs) have revolutionized the field of biological imaging. The possibility of inferring the functional properties of biomolecules below the classical diffraction limit (200–250 nm) enables the understanding of a crucial hallmark of cellular life, the widespread ordering of many biological processes in meso-/nanoscopic domains. Recently, this approach has been applied to visualize chromatin topology. Indeed, the idea of the nucleus as a highly organized organelle has existed for over a century. Still, only the almost concomitant application of chromosome conformation capture methods and super-resolution microscopy has started to unveil the intricate networks of interchromatin interactions that modulate the flow of information from the genome and ultimately the phenotype of the cell. Polycomb group proteins (PcGs) are among the most-studied transcription factors, as their assembly in multifaceted complexes allows the dynamic local repression of gene transcription. In this paper, we reviewed the current knowledge of polycomb activity as inferred by super-resolution studies. Notably, the attention of researchers has mostly been focused on polycomb-dependent intrinsic chromatin properties (e.g., local compaction of polycomb-regulated domains), as revealed by fluorescence in situ hybridization (FISH) of target genomic loci carried out by single molecule localization in STORM/dSTORM mode. Super-resolution has contributed much less to present knowledge of how PcG assembly directs its activity, which nonetheless has been inferred in several genomic ensemble studies and a few cases of conventional diffraction-limited imaging research. This knowledge has been condensed into a complex working model which hints at the superbly coordinated activity of this family of proteins at the mesoscale. Overall, SRM provides a new window to observe 3D chromatin topology modulated by PcGs.

Author Contributions

Conceptualization: A.C., B.S. and R.B.; manuscript draft preparation: all authors; manuscript review and editing, supervision of research: B.S and R.B. All authors have read and agreed to the published version of the manuscript.

Funding

R.B. acknowledges support from the University of Pisa under the framework of project PRA_2020_77. A.C. is supported by University of Pisa under the framework of RSRT and Cdkl5 Program of Excellence grants.

Institutional Review Board Statement

Not applicable.

Informed Consent Statement

Not applicable.

Data Availability Statement

Data contained within the article are available on request from the authors.

Acknowledgments

The authors gratefully acknowledge Vittoria Carnicelli and Michele Oneto for precious technical assistance.

Conflicts of Interest

The authors declare no conflict of interest. The funders had no role in the design of the study; in the collection, analyses, or interpretation of data; in the writing of the manuscript; or in the decision to publish the results.

References

  1. Park, E.G.; Ha, H.; Lee, D.H.; Kim, W.R.; Lee, Y.J.; Bae, W.H.; Kim, H.S. Genomic Analyses of Non-Coding RNAs Overlapping Transposable Elements and Its Implication to Human Diseases. Int. J. Mol. Sci. 2022, 23, 8950. [Google Scholar] [CrossRef] [PubMed]
  2. Atlasi, Y.; Stunnenberg, H.G. The interplay of epigenetic marks during stem cell differentiation and development. Nat. Rev. Genet. 2017, 18, 643–658. [Google Scholar] [CrossRef]
  3. Bonev, B.; Cavalli, G. Organization and function of the 3D genome. Nat. Rev. Genet. 2016, 17, 661–678. [Google Scholar] [CrossRef] [PubMed]
  4. Xie, L.Q.; Liu, Z. Single-cell imaging of genome organization and dynamics. Mol. Syst. Biol. 2021, 17, e9653. [Google Scholar] [CrossRef] [PubMed]
  5. Jerkovic, I.; Cavalli, G. Understanding 3D genome organization by multidisciplinary methods. Nat. Rev. Mol. Cell Bio. 2021, 22, 511–528. [Google Scholar] [CrossRef] [PubMed]
  6. Di Croce, L.; Helin, K. Transcriptional regulation by Polycomb group proteins. Nat. Struct. Mol. Biol. 2013, 20, 1147–1155. [Google Scholar] [CrossRef]
  7. Blackledge, N.P.; Klose, R.J. The molecular principles of gene regulation by Polycomb repressive complexes. Nat. Rev. Mol. Cell Bio. 2021, 22, 815–833. [Google Scholar] [CrossRef]
  8. Elsherbiny, A.; Dobreva, G. Epigenetic memory of cell fate commitment. Curr. Opin. Cell Biol. 2021, 69, 80–87. [Google Scholar] [CrossRef]
  9. Koppens, M.; van Lohuizen, M. Context-dependent actions of Polycomb repressors in cancer. Oncogene 2016, 35, 1341–1352. [Google Scholar] [CrossRef]
  10. Diaspro, A.; Bianchini, P. Optical nanoscopy. Riv. Nuovo Cimento 2020, 43, 385–455. [Google Scholar] [CrossRef]
  11. Vangindertael, J.; Camacho, R.; Sempels, W.; Mizuno, H.; Dedecker, P.; Janssen, K.P.F. An introduction to optical super-resolution microscopy for the adventurous biologist. Methods Appl. Fluores 2018, 6, 022003. [Google Scholar] [CrossRef]
  12. Sahl, S.J.; Hell, S.W.; Jakobs, S. Fluorescence nanoscopy in cell biology. Nat. Rev. Mol. Cell Bio. 2017, 18, 685–701. [Google Scholar] [CrossRef] [PubMed]
  13. Bernhard, W.; Granboulan, N. The Fine Structure of the Cancer Cell Nucleus. Exp. Cell Res. 1963, 24 (Suppl. S9), 19–53. [Google Scholar] [CrossRef] [PubMed]
  14. Ou, H.D.; Phan, S.; Deerinck, T.J.; Thor, A.; Ellisman, M.H.; O’Shea, C.C. ChromEMT: Visualizing 3D chromatin structure and compaction in interphase and mitotic cells. Science 2017, 357, eaag0025. [Google Scholar] [CrossRef] [PubMed] [Green Version]
  15. Derenzini, M.; Olins, A.L.; Olins, D.E. Chromatin structure in situ: The contribution of DNA ultrastructural cytochemistry. Eur. J. Histochem. 2014, 58, 2307. [Google Scholar] [CrossRef] [Green Version]
  16. Vicidomini, G. Image Formation in Fluorescence Microscopy; Springer: Dordrecht, The Netherlands, 2005; pp. 371–393. [Google Scholar]
  17. Masters, B.R. Abbe’s Theory of Image Formation in the Microscope. In Superresolution Optical Microscopy; Rhodes, W.T., Ed.; Springer Series in Optical Sciences; Springer Nature Switzerland AG: Cham, Switzerland, 2020; pp. 65–108. [Google Scholar]
  18. Toraldo di Francia, G. Resolving Power and Information. J. Opt. Soc. Am. 1955, 45, 497–501. [Google Scholar] [CrossRef]
  19. Lelek, M.; Gyparaki, M.T.; Beliu, G.; Schueder, F.; Griffié, J.; Manley, S.; Jungmann, R.; Sauer, M.; Lakadamyali, M.; Zimmer, C. Single-molecule localization microscopy. Nat. Rev. Methods Prim. 2021, 1, 39. [Google Scholar] [CrossRef] [PubMed]
  20. Rust, M.J.; Bates, M.; Zhuang, X. Sub-diffraction-limit imaging by stochastic optical reconstruction microscopy (STORM). Nat. Methods 2006, 3, 793–795. [Google Scholar] [CrossRef] [PubMed] [Green Version]
  21. Sauer, M.; Heilemann, M. Single-Molecule Localization Microscopy in Eukaryotes. Chem. Rev. 2017, 117, 7478–7509. [Google Scholar] [CrossRef]
  22. Betzig, E.; Patterson, G.H.; Sougrat, R.; Lindwasser, O.W.; Olenych, S.; Bonifacino, J.S.; Davidson, M.W.; Lippincott-Schwartz, J.; Hess, H.F. Imaging intracellular fluorescent proteins at nanometer resolution. Science 2006, 313, 1642–1645. [Google Scholar] [CrossRef] [Green Version]
  23. Hess, S.T.; Girirajan, T.P.; Mason, M.D. Ultra-high resolution imaging by fluorescence photoactivation localization microscopy. Biophys. J. 2006, 91, 4258–4272. [Google Scholar] [CrossRef] [PubMed] [Green Version]
  24. Adhikari, S.; Moscatelli, J.; Smith, E.M.; Banerjee, C.; Puchner, E.M. Single-molecule localization microscopy and tracking with red-shifted states of conventional BODIPY conjugates in living cells. Nat. Comm. 2019, 10, 3400. [Google Scholar] [CrossRef] [Green Version]
  25. Klein, T.; Loschberger, A.; Proppert, S.; Wolter, S.; van de Linde, S.V.; Sauer, M. Live-cell dSTORM with SNAP-tag fusion proteins. Nat. Methods 2011, 8, 7–9. [Google Scholar] [CrossRef] [PubMed]
  26. Vicidomini, G.; Bianchini, P.; Diaspro, A. STED super-resolved microscopy. Nat. Methods 2018, 15, 173–182. [Google Scholar] [CrossRef]
  27. Storti, B.; Carlotti, B.; Chiellini, G.; Ruglioni, M.; Salvadori, T.; Scotto, M.; Elisei, F.; Diaspro, A.; Bianchini, P.; Bizzarri, R. An Efficient Aequorea victoria Green Fluorescent Protein for Stimulated Emission Depletion Super-Resolution Microscopy. Int. J. Mol. Sci. 2022, 23, 2482. [Google Scholar] [CrossRef] [PubMed]
  28. Lanzano, L.; Hernandez, I.C.; Castello, M.; Gratton, E.; Diaspro, A.; Vicidomini, G. Encoding and decoding spatio-temporal information for super-resolution microscopy. Nat. Comm. 2015, 6, 6701. [Google Scholar] [CrossRef] [PubMed] [Green Version]
  29. Grotjohann, T.; Testa, I.; Reuss, M.; Brakemann, T.; Eggeling, C.; Hell, S.W.; Jakobs, S. rsEGFP2 enables fast RESOLFT nanoscopy of living cells. Elife 2012, 1, e00248. [Google Scholar] [CrossRef] [PubMed]
  30. Kostiuk, G.; Bucevicius, J.; Gerasimaite, R.; Lukinavicius, G. Application of STED imaging for chromatin studies. J. Phys. D Appl. Phys. 2019, 52, 504003. [Google Scholar] [CrossRef] [Green Version]
  31. Balzarotti, F.; Eilers, Y.; Gwosch, K.C.; Gynna, A.H.; Westphal, V.; Stefani, F.D.; Elf, J.; Hell, S.W. Nanometer resolution imaging and tracking of fluorescent molecules with minimal photon fluxes. Science 2017, 355, 606–612. [Google Scholar] [CrossRef] [Green Version]
  32. Gwosch, K.C.; Pape, J.K.; Balzarotti, F.; Hoess, P.; Ellenberg, J.; Ries, J.; Hell, S.W. MINFLUX nanoscopy delivers 3D multicolor nanometer resolution in cells. Nat. Methods 2020, 17, 217–224. [Google Scholar] [CrossRef]
  33. Alvelid, J.; Damenti, M.; Sgattoni, C.; Testa, I. Event-triggered STED imaging. Nat. Methods 2022, 19, 1268–1275. [Google Scholar] [CrossRef] [PubMed]
  34. Wegner, W.; Ilgen, P.; Gregor, C.; van Dort, J.; Mott, A.C.; Steffens, H.; Willig, K.I. In vivo mouse and live cell STED microscopy of neuronal actin plasticity using far-red emitting fluorescent proteins. Sci. Rep. 2017, 7, 11781. [Google Scholar] [CrossRef] [PubMed] [Green Version]
  35. Bianchini, P.; Cardarelli, F.; Di Luca, M.; Diaspro, A.; Bizzarri, R. Nanoscale Protein Diffusion by STED-Based Pair Correlation Analysis. PLoS ONE 2014, 9, e99619. [Google Scholar] [CrossRef] [PubMed]
  36. Schermelleh, L.; Heintzmann, R.; Leonhardt, H. A guide to super-resolution fluorescence microscopy. J. Cell Biol. 2010, 190, 165–175. [Google Scholar] [CrossRef] [Green Version]
  37. Markaki, Y.; Smeets, D.; Fiedler, S.; Schmid, V.J.; Schermelleh, L.; Cremer, T.; Cremer, M. The potential of 3D-FISH and super-resolution structured illumination microscopy for studies of 3D nuclear architecture. BioEssays News Rev. Mol. Cell. Dev. Biol. 2012, 34, 412–426. [Google Scholar] [CrossRef]
  38. Miron, E.; Oldenkamp, R.; Brown, J.M.; Pinto, D.M.S.; Xu, C.S.; Faria, A.R.; Shaban, H.A.; Rhodes, J.D.P.; Innocent, C.; de Ornellas, S.; et al. Chromatin arranges in chains of mesoscale domains with nanoscale functional topography independent of cohesin. Sci. Adv. 2020, 6, eaba8811. [Google Scholar] [CrossRef]
  39. Szabo, Q.; Jost, D.; Chang, J.M.; Cattoni, D.I.; Papadopoulos, G.L.; Bonev, B.; Sexton, T.; Gurgo, J.; Jacquier, C.; Nollmann, M.; et al. TADs are 3D structural units of higher-order chromosome organization in Drosophila. Sci. Adv. 2018, 4, eaar8082. [Google Scholar] [CrossRef] [Green Version]
  40. Castello, M.; Tortarolo, G.; Buttafava, M.; Deguchi, T.; Villa, F.; Koho, S.; Pesce, L.; Oneto, M.; Pelicci, S.; Lanzano, L.; et al. A robust and versatile platform for image scanning microscopy enabling super-resolution FLIM. Nat. Methods 2019, 16, 175–178. [Google Scholar] [CrossRef]
  41. Sheppard, C.J.R. Super-Resolution in Confocal Imaging. Optik 1988, 80, 53–54. [Google Scholar]
  42. Tortarolo, G.; Castello, M.; Diaspro, A.; Koho, S.; Vicidomini, G. Evaluating image resolution in stimulated emission depletion microscopy. Optica 2018, 5, 32–35. [Google Scholar] [CrossRef]
  43. Huff, J. The Airyscan detector from ZEISS: Confocal imaging with improved signal-to-noise ratio and super-resolution. Nat. Methods 2015, 12, i–ii. [Google Scholar] [CrossRef]
  44. Sheppard, C.J.R.; Mehta, S.B.; Heintzmann, R. Superresolution by image scanning microscopy using pixel reassignment. Opt. Lett. 2013, 38, 2889–2892. [Google Scholar] [CrossRef] [PubMed]
  45. Nepita, I.; Piazza, S.; Ruglioni, M.; Cristiani, S.; Bosurgi, E.; Salvadori, T.; Vicidomini, G.; Diaspro, A.; Castello, M.; Bianchini, P.; et al. Image Scanning Microscopy to Investigate Polycomb Protein Colocalization onto Chromatin. Appl. Sci. 2023, 13, 1556. [Google Scholar] [CrossRef]
  46. Jurgens, G. A Group of Genes-Controlling the Spatial Expression of the Bithorax Complex in Drosophila. Nature 1985, 316, 153–155. [Google Scholar] [CrossRef]
  47. Loubiere, V.; Martinez, A.M.; Cavalli, G. Cell Fate and Developmental Regulation Dynamics by Polycomb Proteins and 3D Genome Architecture. BioEssays News Rev. Mol. Cell. Dev. Biol. 2019, 41, 15. [Google Scholar] [CrossRef] [PubMed] [Green Version]
  48. Schuettengruber, B.; Bourbon, H.M.; Di Croce, L.; Cavalli, G. Genome Regulation by Polycomb and Trithorax: 70 Years and Counting. Cell 2017, 171, 34–57. [Google Scholar] [CrossRef] [Green Version]
  49. Simon, J.A.; Kingston, R.E. Occupying Chromatin: Polycomb Mechanisms for Getting to Genomic Targets, Stopping Transcriptional Traffic, and Staying Put. Mol. Cell 2013, 49, 808–824. [Google Scholar] [CrossRef] [PubMed] [Green Version]
  50. Gao, Z.H.; Zhang, J.; Bonasio, R.; Strino, F.; Sawai, A.; Parisi, F.; Kluger, Y.; Reinberg, D. PCGF Homologs, CBX Proteins, and RYBP Define Functionally Distinct PRC1 Family Complexes. Mol. Cell 2012, 45, 344–356. [Google Scholar] [CrossRef] [Green Version]
  51. Rose, N.R.; King, H.W.; Blckledge, N.P.; Fursova, N.A.; Ember, K.J.I.; Fischer, R.; Kessler, B.M.; Klose, R.J. RYBP stimulates PRC1 to shape chromatin-based communication between Polycomb repressive complexes. Elife 2016, 5, e18591. [Google Scholar] [CrossRef] [PubMed]
  52. Kaustov, L.; Hui, O.Y.; Amaya, M.; Lemak, A.; Nady, N.; Duan, S.L.; Wasney, G.A.; Li, Z.H.; Vedadi, M.; Schapira, M.; et al. Recognition and Specificity Determinants of the Human Cbx Chromodomains. J. Biol. Chem. 2011, 286, 521–529. [Google Scholar] [CrossRef] [Green Version]
  53. Illingworth, R.S. Chromatin folding and nuclear architecture: PRC1 function in 3D. Curr. Opin. Genet. Dev. 2019, 55, 82–90. [Google Scholar] [CrossRef] [PubMed]
  54. Taherbhoy, A.M.; Huang, O.W.; Cochran, A.G. BMI1-RING1B is an autoinhibited RING E3 ubiquitin ligase. Nat. Comm. 2015, 6, 7621. [Google Scholar] [CrossRef] [PubMed] [Green Version]
  55. Boyle, S.; Flyamer, I.M.; Williamson, I.; Sengupta, D.; Bickmore, W.A.; Illingworth, R.S. A central role for canonical PRC1 in shaping the 3D nuclear landscape. Gen. Dev. 2020, 34, 931–949. [Google Scholar] [CrossRef] [PubMed]
  56. Margueron, R.; Justin, N.; Ohno, K.; Sharpe, M.L.; Son, J.; Drury, W.J.; Voigt, P.; Martin, S.R.; Taylor, W.R.; De Marco, V.; et al. Role of the polycomb protein EED in the propagation of repressive histone marks. Nature 2009, 461, 762–767. [Google Scholar] [CrossRef] [PubMed] [Green Version]
  57. Laugesen, A.; Hojfeldt, J.W.; Helin, K. Molecular Mechanisms Directing PRC2 Recruitment and H3K27 Methylation. Mol. Cell 2019, 74, 8–18. [Google Scholar] [CrossRef] [PubMed] [Green Version]
  58. van Mierlo, G.; Veenstra, G.J.C.; Vermeulen, M.; Marks, H. The Complexity of PRC2 Subcomplexes. Trends Cell Biol. 2019, 29, 660–671. [Google Scholar] [CrossRef] [PubMed] [Green Version]
  59. Wang, L.; Brown, J.L.; Cao, R.; Zhang, Y.; Kassis, J.A.; Jones, R.S. Hierarchical recruitment of Polycomb group silencing complexes. Mol. Cell 2004, 14, 637–646. [Google Scholar] [CrossRef]
  60. Kahn, T.G.; Dorafshan, E.; Schultheis, D.; Zare, A.; Stenberg, P.; Reim, I.; Pirrotta, V.; Schwartz, Y.B. Interdependence of PRC1 and PRC2 for recruitment to Polycomb Response Elements. Nucleic Acids Res. 2016, 44, 10132–10149. [Google Scholar] [CrossRef] [Green Version]
  61. Blackledge, N.P.; Rose, N.R.; Klose, R.J. Targeting Polycomb systems to regulate gene expression: Modifications to a complex story. Nat. Rev. Mol. Cell Bio. 2015, 16, 643–649. [Google Scholar] [CrossRef] [Green Version]
  62. Deaton, A.M.; Bird, A. CpG islands and the regulation of transcription. Gen. Dev. 2011, 25, 1010–1022. [Google Scholar] [CrossRef] [Green Version]
  63. Farcas, A.M.; Blackledge, N.P.; Sudbery, I.; Long, H.K.; McGouran, J.F.; Rose, N.R.; Lee, S.; Sims, D.; Cerase, A.; Sheahan, T.W.; et al. KDM2B links the Polycomb Repressive Complex 1 (PRC1) to recognition of CpG islands. Elife 2012, 1, e00205. [Google Scholar] [CrossRef]
  64. He, J.; Shen, L.; Wan, M.; Taranova, O.; Wu, H.; Zhang, Y. Kdm2b maintains murine embryonic stem cell status by recruiting PRC1 complex to CpG islands of developmental genes. Nat. Cell Biol. 2013, 15, 373–384. [Google Scholar] [CrossRef] [Green Version]
  65. Blackledge, N.P.; Farcas, A.M.; Kondo, T.; King, H.W.; McGouran, J.F.; Hanssen, L.L.P.; Ito, S.; Cooper, S.; Kondo, K.; Koseki, Y.; et al. Variant PRC1 Complex-Dependent H2A Ubiquitylation Drives PRC2 Recruitment and Polycomb Domain Formation. Cell 2014, 157, 1445–1459. [Google Scholar] [CrossRef] [PubMed] [Green Version]
  66. Cooper, S.; Grijzenhout, A.; Underwood, E.; Ancelin, K.; Zhang, T.Y.; Nesterova, T.B.; Anil-Kirmizitas, B.; Bassett, A.; Kooistra, S.M.; Agger, K.; et al. Jarid2 binds mono-ubiquitylated H2A lysine 119 to mediate crosstalk between Polycomb complexes PRC1 and PRC2. Nat. Comm. 2016, 7, 13661. [Google Scholar] [CrossRef] [Green Version]
  67. Perino, M.; van Mierlo, G.; Karemaker, I.D.; van Genesen, S.; Vermeulen, M.; Marks, H.; van Heeringen, S.J.; Veenstra, G.J.C. MTF2 recruits Polycomb Repressive Complex 2 by helical-shape-selective DNA binding. Nat. Genet. 2018, 50, 1002–1010. [Google Scholar] [CrossRef] [PubMed]
  68. Li, H.J.; Liefke, R.; Jiang, J.Y.; Kurland, J.V.; Tian, W.; Deng, P.J.; Zhang, W.D.; He, Q.; Patel, D.J.; Bulyk, M.L.; et al. Polycomb-like proteins link the PRC2 complex to CpG islands. Nature 2017, 549, 287–291. [Google Scholar] [CrossRef] [Green Version]
  69. Lavarone, E.; Barbieri, C.M.; Pasini, D. Dissecting the role of H3K27 acetylation and methylation in PRC2 mediated control of cellular identity. Nat. Comm. 2019, 10, 1679. [Google Scholar] [CrossRef] [PubMed] [Green Version]
  70. Zhen, C.Y.; Tatavosian, R.; Huynh, T.N.; Duc, H.N.; Das, R.; Kokotovic, M.; Grimm, J.B.; Lavis, L.D.; Lee, J.; Mejia, F.J.; et al. Live-cell single-molecule tracking reveals co-recognition of H3K27me3 and DNA targets polycomb Cbx7-PRC1 to chromatin. Elife 2016, 5, 36. [Google Scholar] [CrossRef]
  71. Tamburri, S.; Lavarone, E.; Fernandez-Perez, D.; Conway, E.; Zanotti, M.; Manganaro, D.; Pasini, D. Histone H2AK119 Mono-Ubiquitination Is Essential for Polycomb-Mediated Transcriptional Repression. Mol. Cell 2020, 77, 840–856. [Google Scholar] [CrossRef] [Green Version]
  72. Oksuz, O.; Narendra, V.; Lee, C.H.; Descostes, N.; Leroy, G.; Raviram, R.; Blumenberg, L.; Karch, K.; Rocha, P.P.; Garcia, B.A.; et al. Capturing the Onset of PRC2-Mediated Repressive Domain Formation. Mol. Cell 2018, 70, 1149–1162. [Google Scholar] [CrossRef]
  73. Zhao, J.C.; Wang, M.; Chang, L.Y.; Yu, J.; Song, A.Q.; Liu, C.F.; Huang, W.J.; Zhang, T.T.; Wu, X.D.; Shen, X.H.; et al. RYBP/YAF2-PRC1 complexes and histone H1-dependent chromatin compaction mediate propagation of H2AK119ub1 during cell division. Nat. Cell Biol. 2020, 22, 439–452. [Google Scholar] [CrossRef]
  74. Alabert, C.; Barth, T.K.; Reveron-Gomez, N.; Sidoli, S.; Schmidt, A.; Jensen, O.N.; Imhof, A.; Groth, A. Two distinct modes for propagation of histone PTMs across the cell cycle. Gen. Dev. 2015, 29, 585–590. [Google Scholar] [CrossRef] [Green Version]
  75. Guo, Y.R.; Wang, G.G. Modulation of the high-order chromatin structure by Polycomb complexes. Front. Cell Dev. Biol. 2022, 10, 1021658. [Google Scholar] [CrossRef]
  76. Grau, D.J.; Chapman, B.A.; Garlick, J.D.; Borowsky, M.; Francis, N.J.; Kingston, R.E. Compaction of chromatin by diverse Polycomb group proteins requires localized regions of high charge. Gen. Dev. 2011, 25, 2210–2221. [Google Scholar] [CrossRef] [Green Version]
  77. Plys, A.J.; Davis, C.P.; Kim, J.; Rizki, G.; Keenen, M.M.; Marr, S.K.; Kingston, R.E. Phase separation of Polycomb-repressive complex 1 is governed by a charged disordered region of CBX2. Gen. Dev. 2019, 33, 799–813. [Google Scholar] [CrossRef] [Green Version]
  78. Tatavosian, R.; Kent, S.; Brown, K.; Yao, T.T.; Huy, N.D.; Huynh, T.N.; Zhen, C.Y.; Ma, B.; Wang, H.B.; Ren, X.J. Nuclear condensates of the Polycomb protein chromobox 2 (CBX2) assemble through phase separation. J. Biol. Chem. 2019, 294, 1451–1463. [Google Scholar] [CrossRef] [PubMed] [Green Version]
  79. Isono, K.; Endo, T.A.; Ku, M.C.; Yamada, D.; Suzuki, R.; Sharif, J.; Ishikura, T.; Toyoda, T.; Bernstein, B.E.; Koseki, H. SAM Domain Polymerization Links Subnuclear Clustering of PRC1 to Gene Silencing. Dev. Cell 2013, 26, 565–577. [Google Scholar] [CrossRef] [PubMed] [Green Version]
  80. Kundu, S.; Ji, F.; Sunwoo, H.; Jain, G.; Lee, J.T.; Sadreyev, R.I.; Dekker, J.; Kingston, R.E. Polycomb Repressive Complex 1 Generates Discrete Compacted Domains that Change during Differentiation. Mol. Cell 2017, 65, 432–446. [Google Scholar] [CrossRef] [PubMed] [Green Version]
  81. Seif, E.; Kang, J.J.; Sasseville, C.; Senkovich, O.; Kaltashov, A.; Boulier, E.L.; Kapur, I.; Kim, C.A.; Francis, N.J. Phase separation by the polyhomeotic sterile alpha motif compartmentalizes Polycomb Group proteins and enhances their activity. Nat. Comm. 2020, 11, 5609. [Google Scholar] [CrossRef] [PubMed]
  82. Buchenau, P.; Hodgson, J.; Strutt, H.; Arndt-Jovin, D.J. The distribution of polycomb-group proteins during cell division and development in Drosophila embryos: Impact on models for silencing. J. Cell Biol. 1998, 141, 469–481. [Google Scholar] [CrossRef] [PubMed] [Green Version]
  83. Pirrotta, V.; Li, H.B. A view of nuclear Polycomb bodies. Curr. Opin. Genet. Dev. 2012, 22, 101–109. [Google Scholar] [CrossRef] [PubMed] [Green Version]
  84. Saurin, A.J.; Shiels, C.; Williamson, J.; Satijn, D.P.E.; Otte, A.P.; Sheer, D.; Freemont, P.S. The human polycomb group complex associates with pericentromeric heterochromatin to form a novel nuclear domain. J. Cell Biol. 1998, 142, 887–898. [Google Scholar] [CrossRef] [Green Version]
  85. Boettiger, A.N.; Bintu, B.; Moffitt, J.R.; Wang, S.Y.; Beliveau, B.J.; Fudenberg, G.; Imakaev, M.; Mirny, L.A.; Wu, C.T.; Zhuang, X.W. Super-resolution imaging reveals distinct chromatin folding for different epigenetic states. Nature 2016, 529, 418–422. [Google Scholar] [CrossRef] [PubMed] [Green Version]
  86. Wani, A.H.; Boettiger, A.N.; Schorderet, P.; Ergun, A.; Munger, C.; Sadreyev, R.I.; Zhuang, X.; Kingston, R.E.; Francis, N.J. Chromatin topology is coupled to Polycomb group protein subnuclear organization. Nat. Comm. 2016, 7, 10291. [Google Scholar] [CrossRef] [Green Version]
  87. Huang, B.; Wang, W.Q.; Bates, M.; Zhuang, X.W. Three-dimensional super-resolution imaging by stochastic optical reconstruction microscopy. Science 2008, 319, 810–813. [Google Scholar] [CrossRef] [Green Version]
  88. Szabo, Q.; Donjon, A.; Jerkovic, I.; Papadopoulos, G.L.; Cheutin, T.; Bonev, B.; Nora, E.P.; Bruneau, B.G.; Bantignies, F.; Cavalli, G. Regulation of single-cell genome organization into TADs and chromatin nanodomains. Nat. Genet. 2020, 52, 1151–1157. [Google Scholar] [CrossRef]
  89. Rivera, C.M.; Ren, B. Mapping Human Epigenomes. Cell 2013, 155, 39–55. [Google Scholar] [CrossRef] [PubMed] [Green Version]
  90. Beliveau, B.J.; Joyce, E.F.; Apostolopoulos, N.; Yilmaz, F.; Fonseka, C.Y.; McCole, R.B.; Chang, Y.M.; Li, J.B.; Senaratne, T.N.; Williams, B.R.; et al. Versatile design and synthesis platform for visualizing genomes with Oligopaint FISH probes. Proc. Natl. Acad. Sci. USA 2012, 109, 21301–21306. [Google Scholar] [CrossRef] [PubMed] [Green Version]
  91. Williamson, I.; Berlivet, S.; Eskeland, R.; Boyle, S.; Illingworth, R.S.; Paquette, D.; Dostie, J.; Bickmore, W.A. Spatial genome organization: Contrasting views from chromosome conformation capture and fluorescence in situ hybridization. Gen. Dev. 2014, 28, 2778–2791. [Google Scholar] [CrossRef] [Green Version]
  92. Williamson, I.; Bickmore, W.A.; Illingworth, R.S. Polycomb-mediated chromatin compaction weathers the STORM. Genome Biol. 2016, 17, 35. [Google Scholar] [CrossRef] [Green Version]
  93. Schoenfelder, S.; Sugar, R.; Dimond, A.; Javierre, B.M.; Armstrong, H.; Mifsud, B.; Dimitrova, E.; Matheson, L.; Tavares-Cadete, F.; Furlan-Magaril, M.; et al. Polycomb repressive complex PRC1 spatially constrains the mouse embryonic stem cell genome. Nat. Genet. 2015, 47, 1179–1186. [Google Scholar] [CrossRef]
  94. Eskeland, R.; Leeb, M.; Grimes, G.R.; Kress, C.; Boyle, S.; Sproul, D.; Gilbert, N.; Fan, Y.H.; Skoultchi, A.I.; Wutz, A.; et al. Ring1B Compacts Chromatin Structure and Represses Gene Expression Independent of Histone Ubiquitination. Mol. Cell 2010, 38, 452–464. [Google Scholar] [CrossRef] [PubMed] [Green Version]
  95. Liu, L.; Hyeon, C.B. Revisiting the organization of Polycomb-repressed domains: 3D chromatin models from Hi-C compared with super-resolution imaging. Nucleic Acids Res. 2020, 48, 11486–11494. [Google Scholar] [CrossRef]
  96. Liu, L.; Kim, M.H.; Hyeon, C. Heterogeneous Loop Model to Infer 3D Chromosome Structures from Hi-C. Biophys. J. 2019, 117, 613–625. [Google Scholar] [CrossRef]
  97. Cattoni, D.I.; Gizzi, A.M.C.; Georgieva, M.; Di Stefano, M.; Valeri, A.; Chamousset, D.; Houbron, C.; Dejardin, S.; Fiche, J.B.; Gonzalez, I.; et al. Single-cell absolute contact probability detection reveals chromosomes are organized by multiple low-frequency yet specific interactions. Nat. Comm. 2017, 8, 1753. [Google Scholar] [CrossRef] [PubMed] [Green Version]
  98. Shi, G.; Thirumalai, D. Conformational heterogeneity in human interphase chromosome organization reconciles the FISH and Hi-C paradox. Nat. Comm. 2019, 10, 3894. [Google Scholar] [CrossRef] [PubMed] [Green Version]
  99. Brockdorff, N.; Bowness, J.S.; Wei, G.F. Progress toward understanding chromosome silencing by Xist RNA. Gen. Dev. 2020, 34, 733–744. [Google Scholar] [CrossRef]
  100. Loda, A.; Heard, E. Xist RNA in action: Past, present, and future. PLoS Genet. 2019, 15, e1008333. [Google Scholar] [CrossRef] [Green Version]
  101. Almeida, M.; Pintacuda, G.; Masui, O.; Koseki, Y.; Gdula, M.; Cerase, A.; Brown, D.; Mould, A.; Innocent, C.; Nakayama, M.; et al. PCGF3/5-PRC1 initiates Polycomb recruitment in X chromosome inactivation. Science 2017, 356, 1081–1084. [Google Scholar] [CrossRef]
  102. Markaki, Y.; Chong, J.G.; Wang, Y.Y.; Jacobson, E.C.; Luong, C.; Tan, S.Y.X.; Jachowicz, J.W.; Strehle, M.; Maestrini, D.; Banerjee, A.K.; et al. Xist nucleates local protein gradients to propagate silencing across the X chromosome (vol 184, pg 6174, 2021). Cell 2021, 184, 6212. [Google Scholar] [CrossRef]
  103. Simon, M.D.; Pinter, S.F.; Fang, R.; Sarma, K.; Rutenberg-Schoenberg, M.; Bowman, S.K.; Kesner, B.A.; Maier, V.K.; Kingston, R.E.; Lee, J.T. High-resolution Xist binding maps reveal two-step spreading during X-chromosome inactivation. Nature 2013, 504, 465–469. [Google Scholar] [CrossRef] [PubMed] [Green Version]
  104. Masui, O.; Corbel, C.; Nagao, K.; Endo, T.A.; Kezuka, F.; Diabangouaya, P.; Nakayama, M.; Kumon, M.; Koseki, Y.; Obuse, C.; et al. Polycomb repressive complexes 1 and 2 are each essential for maintenance of X inactivation in extra-embryonic lineages. Nat. Cell Biol. 2023, 25, 134–144. [Google Scholar] [CrossRef] [PubMed]
  105. Plath, K.; Fang, J.; Mlynarczyk-Evans, S.K.; Cao, R.; Worringer, K.A.; Wang, H.B.; de la Cruz, C.C.; Otte, A.P.; Panning, B.; Zhang, Y. Role of histone H3 lysine 27 methylation in X inactivation. Science 2003, 300, 131–135. [Google Scholar] [CrossRef] [Green Version]
  106. Cerase, A.; Smeets, D.; Tang, Y.A.; Gdula, M.; Kraus, F.; Spivakov, M.; Moindrot, B.; Leleu, M.; Tattermusch, A.; Demmerie, J.; et al. Spatial separation of Xist RNA and polycomb proteins revealed by superresolution microscopy. Proc. Natl. Acad. Sci. USA 2014, 111, 2235–2240. [Google Scholar] [CrossRef] [PubMed] [Green Version]
  107. Smeets, D.; Markaki, Y.; Schmid, V.J.; Kraus, F.; Tattermusch, A.; Cerase, A.; Sterr, M.; Fiedler, S.; Demmerle, J.; Popken, J.; et al. Three-dimensional super-resolution microscopy of the inactive X chromosome territory reveals a collapse of its active nuclear compartment harboring distinct Xist RNA foci. Epigenet Chromatin 2014, 7, 8. [Google Scholar] [CrossRef] [PubMed] [Green Version]
  108. Sunwoo, H.; Wu, J.Y.; Lee, J.T. The Xist RNA-PRC2 complex at 20-nm resolution reveals a low Xist stoichiometry and suggests a hit-and-run mechanism in mouse cells. Proc. Natl. Acad. Sci. USA 2015, 112, E4216–E4225. [Google Scholar] [CrossRef] [PubMed] [Green Version]
  109. Sun, B.K.; Deaton, A.M.; Lee, J.T. A transient heterochromatic state in Xist preempts X inactivation choice without RNA stabilization. Mol. Cell 2006, 21, 617–628. [Google Scholar] [CrossRef] [PubMed]
  110. Pandya-Jones, A.; Markaki, Y.; Serizay, J.; Chitiashvili, T.; Leon, W.R.M.; Damianov, A.; Chronis, C.; Papp, B.; Chen, C.K.; McKee, R.; et al. A protein assembly mediates Xist localization and gene silencing. Nature 2020, 587, 145–151. [Google Scholar] [CrossRef] [PubMed]
  111. Jachowicz, J.W.; Strehle, M.; Banerjee, A.K.; Blanco, M.R.; Thai, J.; Guttman, M. Xist spatially amplifies SHARP/SPEN recruitment to balance chromosome-wide silencing and specificity to the X chromosome. Nat. Struct. Mol. Biol. 2022, 29, 239–249. [Google Scholar] [CrossRef]
  112. Cerase, A.; Calabrese, J.M.; Tartaglia, G.G. Phase separation drives X-chromosome inactivation. Nat. Struct. Mol. Biol. 2022, 29, 183–185. [Google Scholar] [CrossRef] [PubMed]
  113. Pintacuda, G.; Wei, G.F.; Roustan, C.; Kirmizitas, B.A.; Solcan, N.; Cerase, A.; Castello, A.; Mohammed, S.; Moindrot, B.; Nesterova, T.B.; et al. hnRNPK Recruits PCGF3/5-PRC1 to the Xist RNA B-Repeat to Establish Polycomb-Mediated Chromosomal Silencing. Mol. Cell 2017, 68, 955–969.e10. [Google Scholar] [CrossRef] [PubMed] [Green Version]
  114. Bousard, A.; Raposo, A.C.; Zylicz, J.J.; Picard, C.; Pires, V.B.; Qi, Y.Y.; Gil, C.; Syx, L.; Chang, H.Y.; Heard, E.; et al. The role of Xist-mediated Polycomb recruitment in the initiation of X-chromosome inactivation. Embo Rep. 2019, 20, e48019. [Google Scholar] [CrossRef] [PubMed]
  115. Cerase, A.; Tartaglia, G.G. Long non-coding RNA-polycomb intimate rendezvous. Open Biol. 2020, 10, 200126. [Google Scholar] [CrossRef] [PubMed]
Figure 1. The different scales of chromatin organization, from DNA up to chromosome regions, in the nucleus.
Biology 12 00374 g001
Figure 2. Super-resolution microscopy techniques. (a) Structured illumination microscopy (SIM). (b) Single molecule localization microscopy (SMLM). (c) Image scanning microscopy (ISM). (d) Stimulated emission depletion microscopy (STED).
Biology 12 00374 g002
Figure 3. Structure of the polycomb repressor complex 1 (PRC1). PRC1 subdivides into “variant” (vPRC1) and “canonical” (cPRC1) complexes. Really Interesting New Gene 1 A/B (RING1A/B) is common to both. vPRC1 assembles around one of six Polycomb Group RING Finger (PGCF) proteins (PCGF1–PCGF6), whereas cPRC1 contains only PCGF2/4. Further components, such as YY1-Binding Protein (RYBP) and ChromoBoX proteins CBX2/4/6/7/8, are contained only in vPRC1 and cPRC1, respectively. For further description, see text.
Biology 12 00374 g003
Figure 4. Structure of the polycomb repressor complex 2 (PRC2). The core of PRC2 is composed of EZH1/2, Embryonic Ectoderm Development (EED), Supressor Of Zeste 12 Homolog Protein (SUZ12), and Retinoblastoma Binding Protein 4 or 7 (RBB4/7). Further subdivision in PRC2.1 and PRC2.2 is given by additional proteins, among which Jumonji And (A+T)-RIch Interaction Domain-containing protein 2 (JARID2) and Adipocyte Enhancer-Binding Protein 2 (AEBP2) play crucial roles in the initiation of PRC1/2 repressing activity (see text).
Biology 12 00374 g004
Figure 5. The “reverse hierarchical” model of PRC1 and PRC2 activity. For description, see text and ref. [7].
Biology 12 00374 g005
Figure 6. Scheme of 3D STORM studies on polycomb nanodomains in Drosophila, after ref. [85,86]. Polycomb-controlled genes, such as the Hox genes, are labelled by oligonucleotides bearing blinking fluorophores for STORM imaging (a), thereby revealing compacted chromatin regions ~100 nm in size (b). The compact chromatin state of polycomb-repressed domains could be directly linked to the multimerization ability of the polyhomeotic component of PRC1 through the Sterile Alpha Motifs (SAMs) they embed (c).
Biology 12 00374 g006
Disclaimer/Publisher’s Note: The statements, opinions and data contained in all publications are solely those of the individual author(s) and contributor(s) and not of MDPI and/or the editor(s). MDPI and/or the editor(s) disclaim responsibility for any injury to people or property resulting from any ideas, methods, instructions or products referred to in the content.

