Article

Seed Germination and Seedling Growth in Suaeda salsa (Linn.) Pall. (Amaranthaceae) Demonstrate Varying Salinity Tolerance among Different Provenances

1
Northeast Institute of Geography and Agroecology, Chinese Academy of Sciences, Changchun 130102, China
2
University of Chinese Academy of Sciences, Beijing 100049, China
3
Shandong Key Laboratory of Eco-Environmental Science for Yellow River Delta, Binzhou University, Binzhou 256603, China
*
Author to whom correspondence should be addressed.
Biology 2023, 12(10), 1343; https://doi.org/10.3390/biology12101343
Submission received: 1 July 2023 / Revised: 11 October 2023 / Accepted: 13 October 2023 / Published: 18 October 2023
(This article belongs to the Special Issue Seed Germination and Dormancy)

Abstract

:

Simple Summary

Soil salinization is a widespread problem, causing soil degradation and limiting agricultural productivity worldwide. However, the protection and restoration of halophyte species communities can effectively help improve and reconstruct saline–alkali land. We collected seeds of Suaeda salsa (Linn.) Pall., a highly salt-tolerant and widely distributed halophytic species, from seven different saline–alkali habitats, numbered S1–S7, of Songnen Plain, China, and tested their germination and seedling growth responses to saline–alkali stress. Results showed a strong saline–alkali tolerance in S. salsa seeds, but the germination characteristics and saline–alkali tolerance varied across provenances, highlighting the geographical variations in germination responses. The saline–alkali tolerance of S1 and S7 locations was significantly higher than that of others. Suaeda salsa has important applications in the restoration of saline–alkali soil. However, the seeds from appropriate provenances must be screened to ensure the best saline-alkaline tolerant variety. The germplasm materials from the selected varieties can also be used as high-quality sources to study the mechanism of saline–alkali tolerance in halophytes. These seeds can also serve as excellent germplasm resources for the restoration of saline–alkali soil.

Abstract

Salinity is a pressing and widespread abiotic stress, adversely affecting agriculture productivity and plant growth worldwide. Seed germination is the most critical stage to seedling growth and establishing plant species in harsh environments, including saline stress. However, seed germination characteristics and stress tolerance may vary among geographical locations, such as various provenances. Suaeda salsa (Linn.) Pall. (S. salsa) is a halophytic plant that exhibits high salt tolerance and is often considered a pioneer species for the restoration of grasslands. Understanding the germination characteristics and stress tolerance of the species could be helpful in the vegetation restoration of saline–alkali land. In this study, we collected S. salsa seeds from seven different saline–alkali habitats (S1–S7) in the Songnen Plain region to assess the germination and seedling growth responses to NaCl, Na2CO3, and NaHCO3, and to observe the recovery of seed germination after relieving the salt stress. We observed significant differences in germination and seedling growth under three salt stresses and among seven provenances. Resistance to Na2CO3 and NaHCO3 stress was considerably higher during seedling growth than seed germination, while the opposite responses were observed for NaCl resistance. Seeds from S1 and S7 showed the highest tolerance to all three salt stress treatments, while S6 exhibited the lowest tolerance. Seeds from S2 exhibited low germination under control conditions, while low NaCl concentration and pretreatment improved germination. Ungerminated seeds under high salt concentrations germinated after relieving the salt stress. Germination of ungerminated seeds after the abatement of salt stress is an important adaptation strategy for black S. salsa seeds. While seeds from most provenances regerminated under NaCl, under Na2CO3 and NaHCO3, only seeds from S4 and S7 regerminated. These findings highlight the importance of soil salinity in the maternal environment for successful seed germination and seedling growth under various salinity-alkali stresses. Therefore, seed sources and provenance should be considered for vegetation restoration.

1. Introduction

Soil salinization is a widespread environmental issue limiting agricultural production worldwide [1]. According to FAO/UNESCO, globally, saline soil occupies approximately 1 billion hm2 of land, accounting for 7.2% of the world’s total land area [2,3]. Recently, the interactive effects of climate change and anthropogenic activities have led to a decline in plant biodiversity and productivity, posing significant challenges to the management and restoration of saline–alkali land [4,5]. However, many methods have been implemented to improve this land, including irrigation and drainage [6], application of soil amendment [7], and planting salt-tolerant plants [5]. Particularly, planting saline–alkaline tolerant plants effectively reduces soil salt content and improves soil structure. These plants save water, require low input, and provide environmental sustainability and economic benefits, making them a popular research object for studying saline–alkali land [8]. Therefore, halophytic plants have received considerable attention in vegetation restoration on saline–alkaline lands, as most other plants struggle to grow in these soil types. Indeed, several studies have examined the saline–alkali tolerance of halophytes [9,10,11]. Therefore, protecting and rebuilding halophyte plant communities is an effective method to improve and restore saline–alkali land [12,13].
Saline–alkali stress can have a negative impact on plant growth, development, and reproduction through osmotic stress and ion toxicity. However, halophytes are characterized by their ability to reject, accumulate, and absorb salt, allowing them to thrive and grow in saline–alkali environments [14]. In addition, some saline–alkali tolerant plants can complete their life cycle in soil with salinity levels above 200 mmol/L [15,16]. Previous studies have shown that seed germination and seedling growth are critical stages and particularly susceptible to salt stress, affecting plants’ ability to establish themselves in saline–alkali environments [17]. Hence, understanding the stress resistance of halophytes in the early stages of their life cycle and under saline–alkali stress will improve the application of halophytes for vegetation restoration in saline–alkali lands [18,19]. However, germination characteristics and stress tolerance of halophytic species vary among provenances, likely due to local adaptation or transgenerational induction through epigenetic effects of maternal environments [20,21,22]. For instance, Plantago lanceolata L. (Plantaginaceae) [23], Prosopis Juliflora (Sw.) DC. (Fabaceae) [9], Arthrocnemum macrostachyum (Moric.) C. Koch (Amaranthaceae), and Suaeda vermiculat Forssk. ex J.F. Gmel. [10] are common halophytes that differ significantly in their seed germination and ability to recover after saline–alkali stress amelioration across provenances. These differences are likely related to environmental factors within the particular provenance, including the heterogeneity of saline–alkali soils [24,25]. Therefore, understanding the germination behaviors of seeds from different populations can inform the selection of optimal best seed sources to improve and restore saline–alkali lands.
As a euhalophyte, Suaeda salsa (Linn.) Pall. (S. salsa) is highly salt-tolerant and widely distributed in coastal salt marshes and inland salt-bearing locations. This species is also used in animal feed, gourmet vegetables, and edible oil, with high ecological and economic values [26,27]. There are two main S. salsa ecotypes: the green ecotype, which typically grows at high elevations and on land far from the seashore, and the red-violet ecotype, which grows in the intertidal zone [28]. Suaeda salsa produces dimorphic (black and brown) seeds [29]. This species can accumulate a high amount of salt in its aboveground portions [30] and demonstrate salt tolerance characteristics, such as ion compartmentalization and succulent leaves [31,32]. Hence, S. salsa is considered a pioneer species for restoring saline–alkali lands [33]. Understanding the seed germination characteristics and stress tolerance of S. salsa will be particularly helpful for vegetation restoration in saline–alkali lands. However, most studies have focused on coastal saline–alkali land areas [34,35,36], where species salt tolerance capacity has been tested primarily using neutral salts, such as sodium chloride (NaCl) and sodium sulfate (Na2SO4). Meanwhile, few studies have considered alkaline salts [37,38,39], with minimal data regarding the stress tolerance capacity of S. salsa growing in inland soda saline–alkali soil.
The Songnen Plain, located in the northeast plain of China, is an ecotone with a high concentration of saline–alkaline soil [40]. The plain occupies approximately 5 × 10⁶ hm2 of land, with 64% of the grassland area in the western part of the Songnen Plain degraded, resulting in a saline–alkali wasteland [41]. Particularly, the saline–-alkali soil with sodium carbonate (Na2CO3) and sodium bicarbonate (NaHCO3) as the main salts [42] has high pH, salt, and exchangeable sodium content. However, the soil has low permeability and nutrient availability, which differs from the coastal saline soil that contains primarily NaCl or Na2SO4 [43]. Indeed, alkaline stress can be more damaging to plants than neutral salt stress [44,45,46,47].
Halophyte salinity tolerance is usually species-specific and varies with ecotype and the environmental factors of the provenances [10,48]. Therefore, to explore the potential differences in the salinity and alkali tolerance in S. salsa seeds across the provenances, we collected S. salsa seeds from seven different saline–alkali habitats of the Songnen Plain. Specifically, we (1) investigated variations among the different seed sources regarding seed germination and seedling growth and (2) tested the seed germination and seedling growth responses to NaCl, Na2CO3, and NaHCO3. Results from this study may help identify salt-tolerant germplasm materials, which can be utilized for vegetation restoration in the saline–alkali region of the Songnen Plain.

2. Materials and Methods

2.1. Seed Collection

Seeds from multiple S. salsa plants were collected from 7 different provenances of the Songnen Plain in northeastern China (Figure 1) in September 2018. In each provenance, seeds were collected from 30 randomly chosen green ecotype parent plants at least 5 m apart to reduce potential pseudoreplication. The populations were labeled as ‘S’ followed by a number identifying the specific site (Figure 1). Seeds were immediately stored in paper bags at 4 °C until the experiment began in November 2019. General features and environmental variables from each provenance are listed in Table 1.

2.2. Seed Germination, Seedling Growth, and Germination Recovery

Healthy and plumb black S. salsa seeds were selected and surface sterilized in an aqueous solution of 0.1% HgCl2 for 10 min, then rinsed with distilled water three times before running the germination experiments [49]. We constructed six NaCl (50, 100, 200, 300, 400, 500 mM), five Na2CO3 (5, 12.5, 25, 50, 100 mM), and four NaHCO3 (25, 50, 100, 150 mM) solutions. In each experiment, 25 seeds were placed in each 10-cm diameter Petri dish filled with 25 mL of germination medium containing 7% agar and different salt concentrations. A non-saline germination medium was used as the control. Each treatment was replicated four times. A total of 100 seeds (25 seeds × 4 replicates = 100) were used per treatment.
Petri dishes were incubated (Harbin, China) at 16/28 °C under a 12/12 h dark/light diurnal cycle [50,51]. Seed germination was considered when the radicle emerged. The experiment was stopped when no new germination was observed for three consecutive days. The germinated seeds were counted once per day, and the germination rate was calculated using the following formula [52]:
G e r m i n a t i o n = n / N × 100 % ,
where n is the number of final germinated seeds under each treatment, and N is the total number of seeds.
Once the germinated seeds formed seedlings, 4 seedlings were collected from each Petri dish to measure the roots and shoot lengths and determine the root and shoot stress tolerance index using the following formulas [52]:
R o o t   t o l e r a n c e   i n d e x   ( % ) = r l / c r l × 100 %
S h o o t   t o l e r a n c e   i n d e x   ( % ) = s l / c s l × 100 % ,
where rl and sl are the root and shoot lengths in different salt treatments, respectively, and crl and csl are the root and shoot lengths under 0 mM salt stress treatment, respectively.
After the initial germination experiment, we established the germination recovery experiment. Ungerminated seeds from each treatment were rinsed three times with distilled water and incubated in new Petri dishes with the same germination medium and thermo period regimes. The germinated seeds were counted after 7 days to determine the percentage of germination recovery. We also calculated total and relative germination percentages using the following formulas [52]:
R e c o v e r y   p e r c e n t a g e   % = R n / U n × 100 %
T o t a l   g e r m i n a t i o n   p e r c e n t a g e   ( % ) = T n / N × 100 %
R e l a t i v e   g e r m i n a t i o n   p e r c e n t a g e   ( % ) = ( T n / C n ) × 100 % ,
where Rn represents the number of germinated seeds in the recovery experiment, Un is the number of ungerminated seeds, Tn is the sum of n and Rn, N is the total number of seeds, and Cn is the number of germinated seeds under 0 mM salt stress.

2.3. Statistical Analysis

Generalized linear models (GLMs) with binomial error and the log link function were used to evaluate the effects of the different treatments on percent germination, germination recovery, and total germination [52]. Linear regression models were used to analyze the effects of different treatments on root and shoot length and relative percent germination. Post-hoc multiple mean comparisons were performed with Tukey’s tests. A cluster analysis was performed to visualize the patterns of salt tolerance in S. salsa seeds across 7 provenances and salt levels [50]. Results were considered statistically significant at p = 0.05. All statistical analyses were performed in R version 4.0.3, and the graphs were created using ggplot.

3. Results

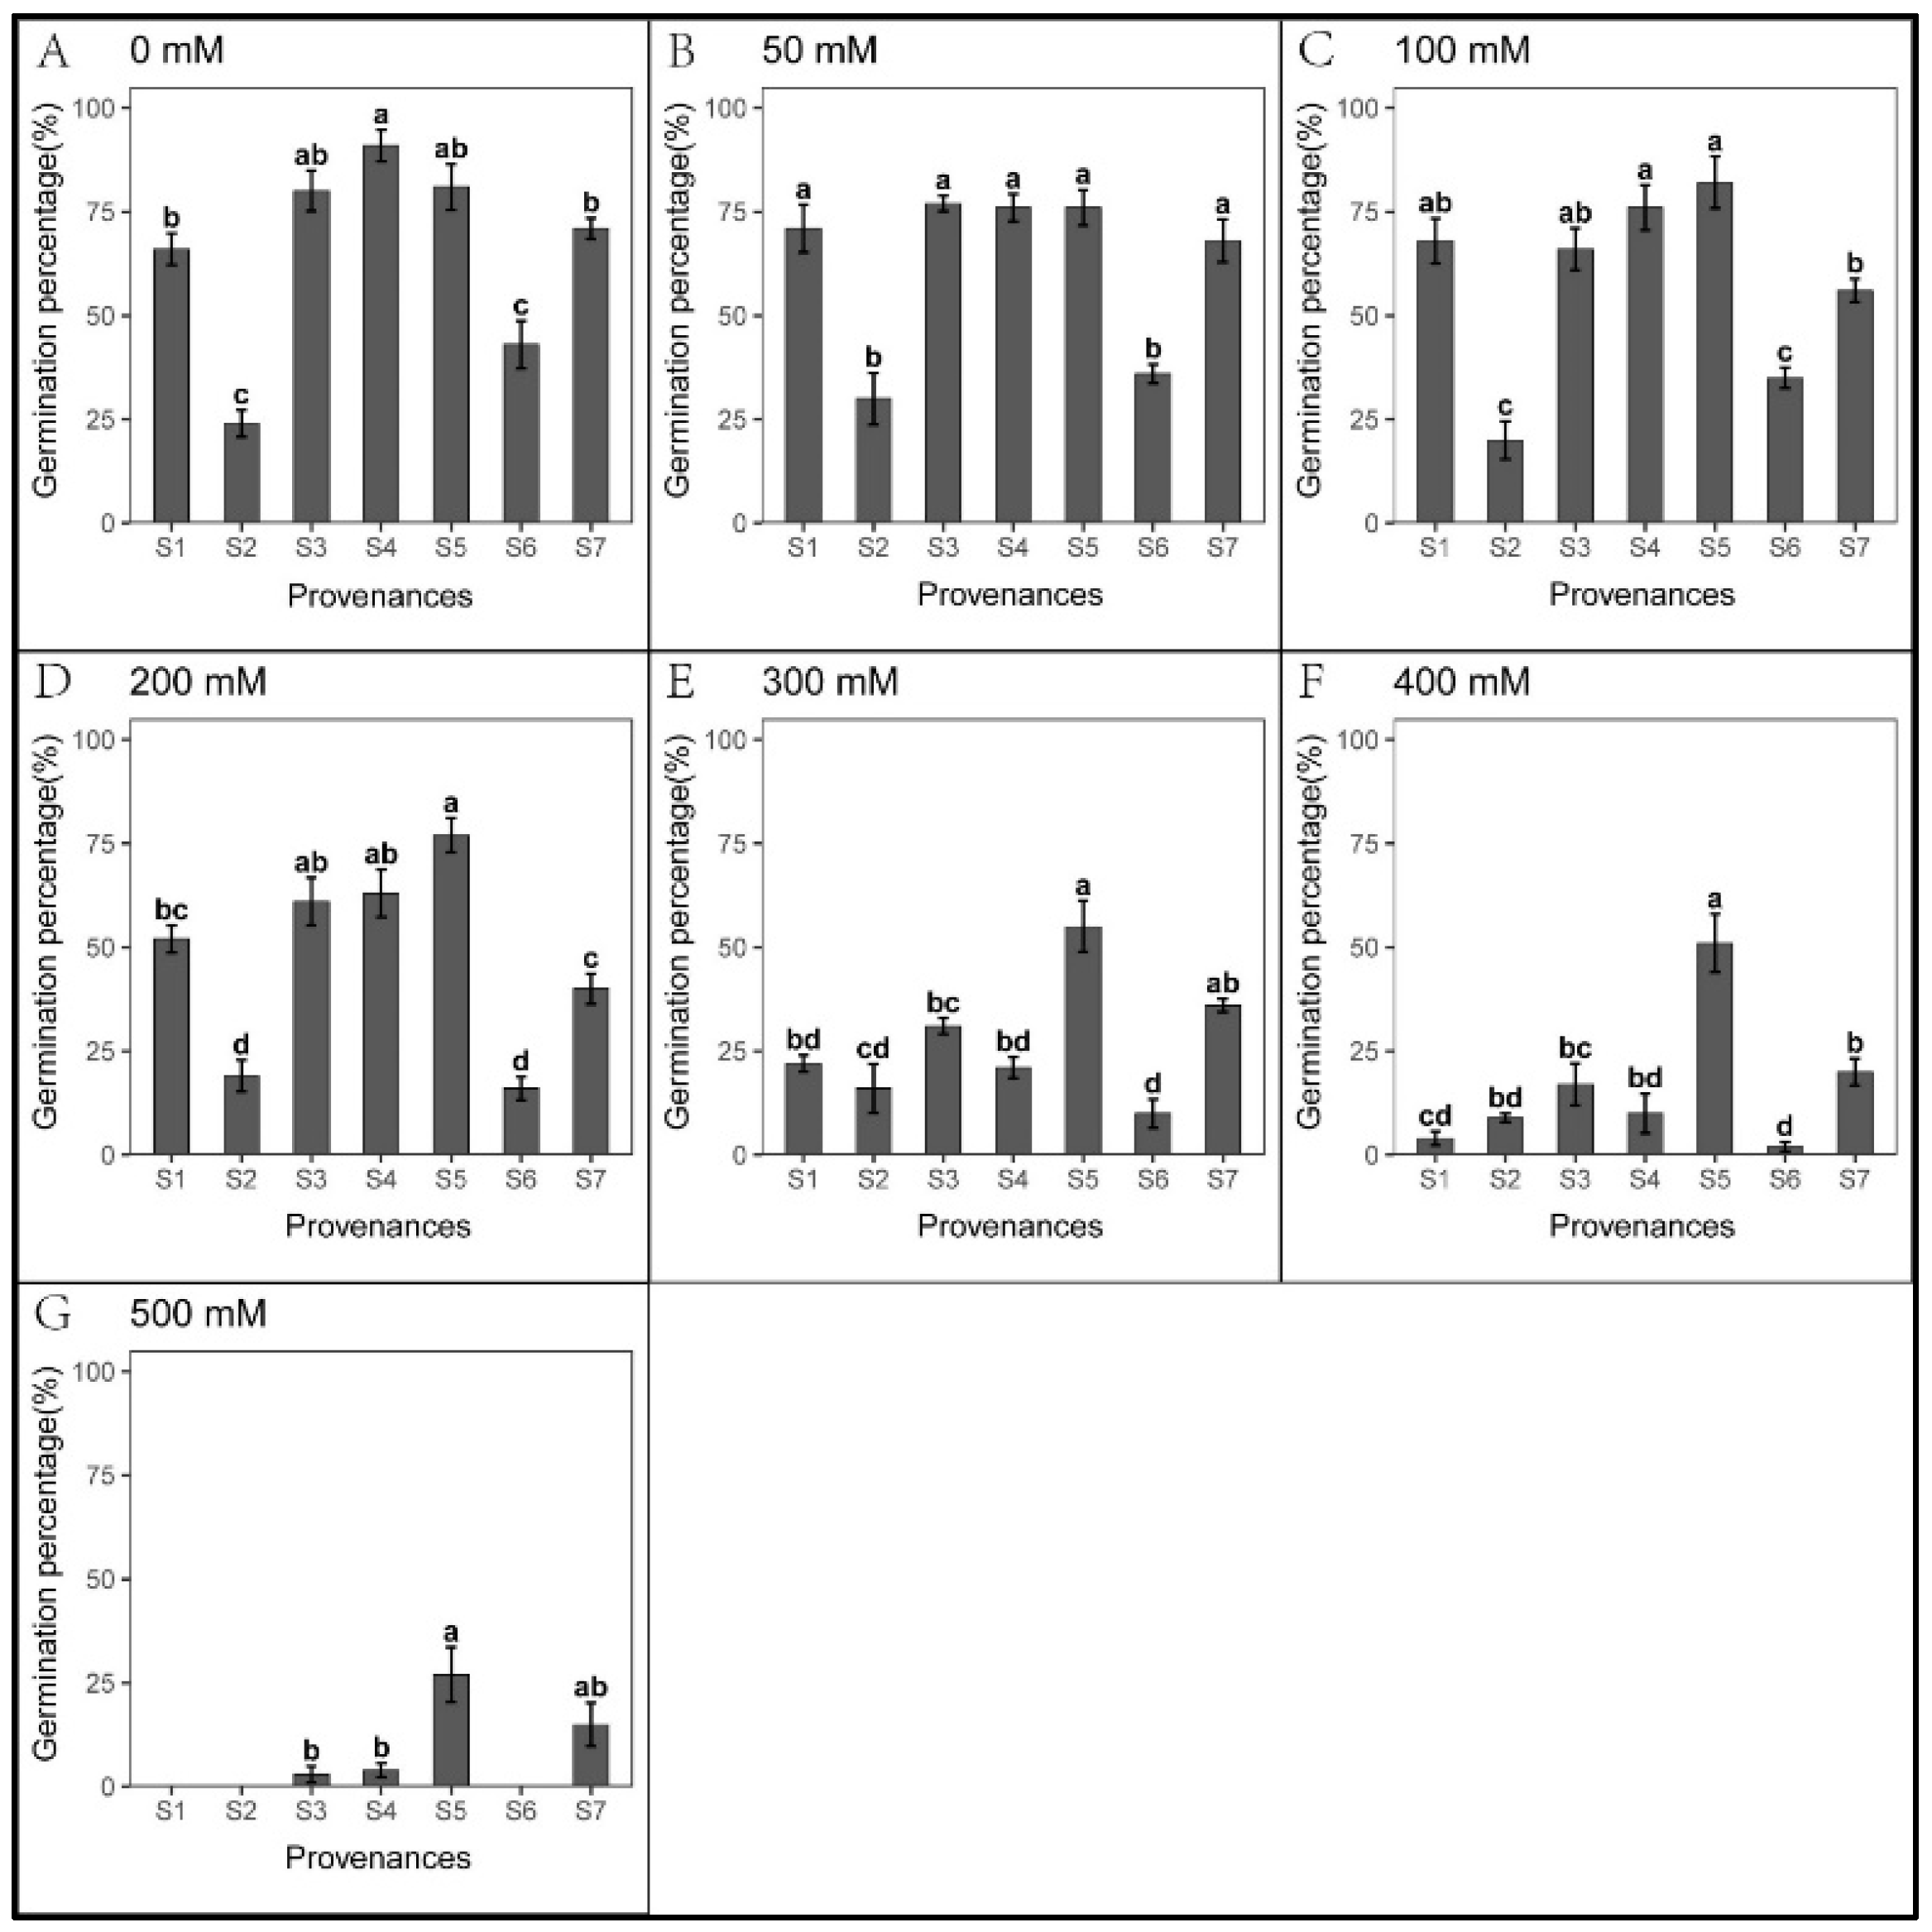
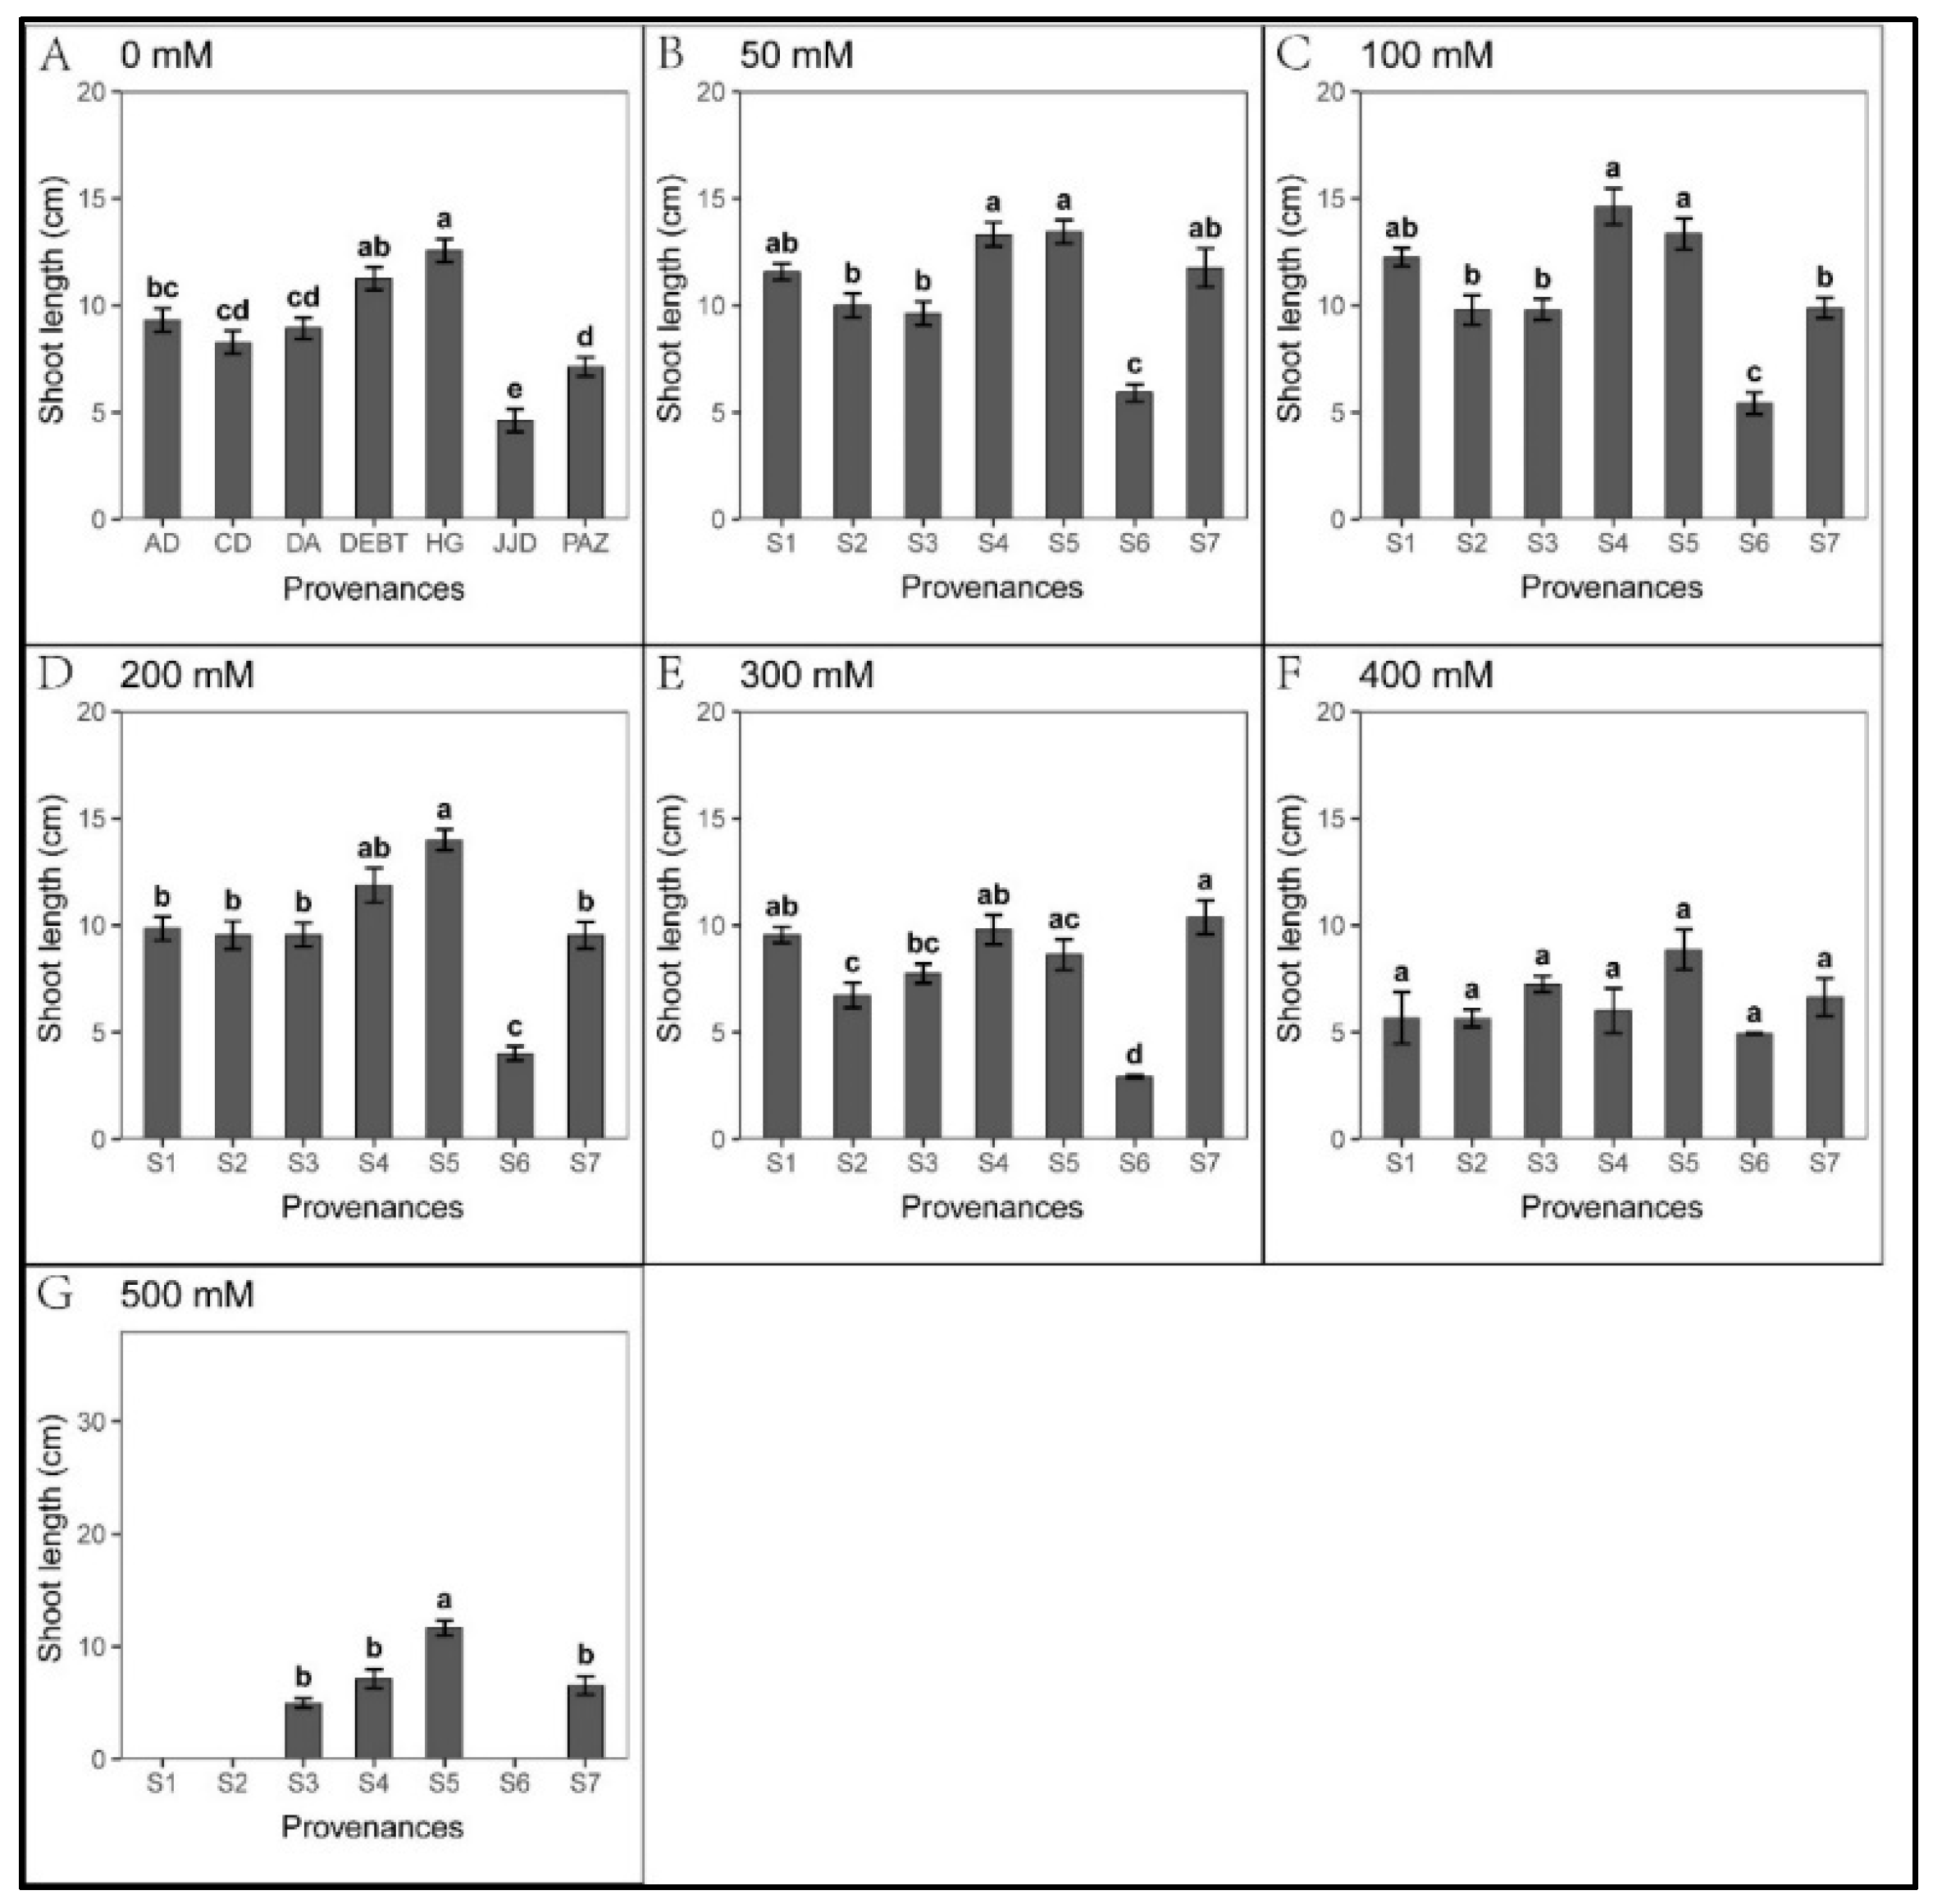
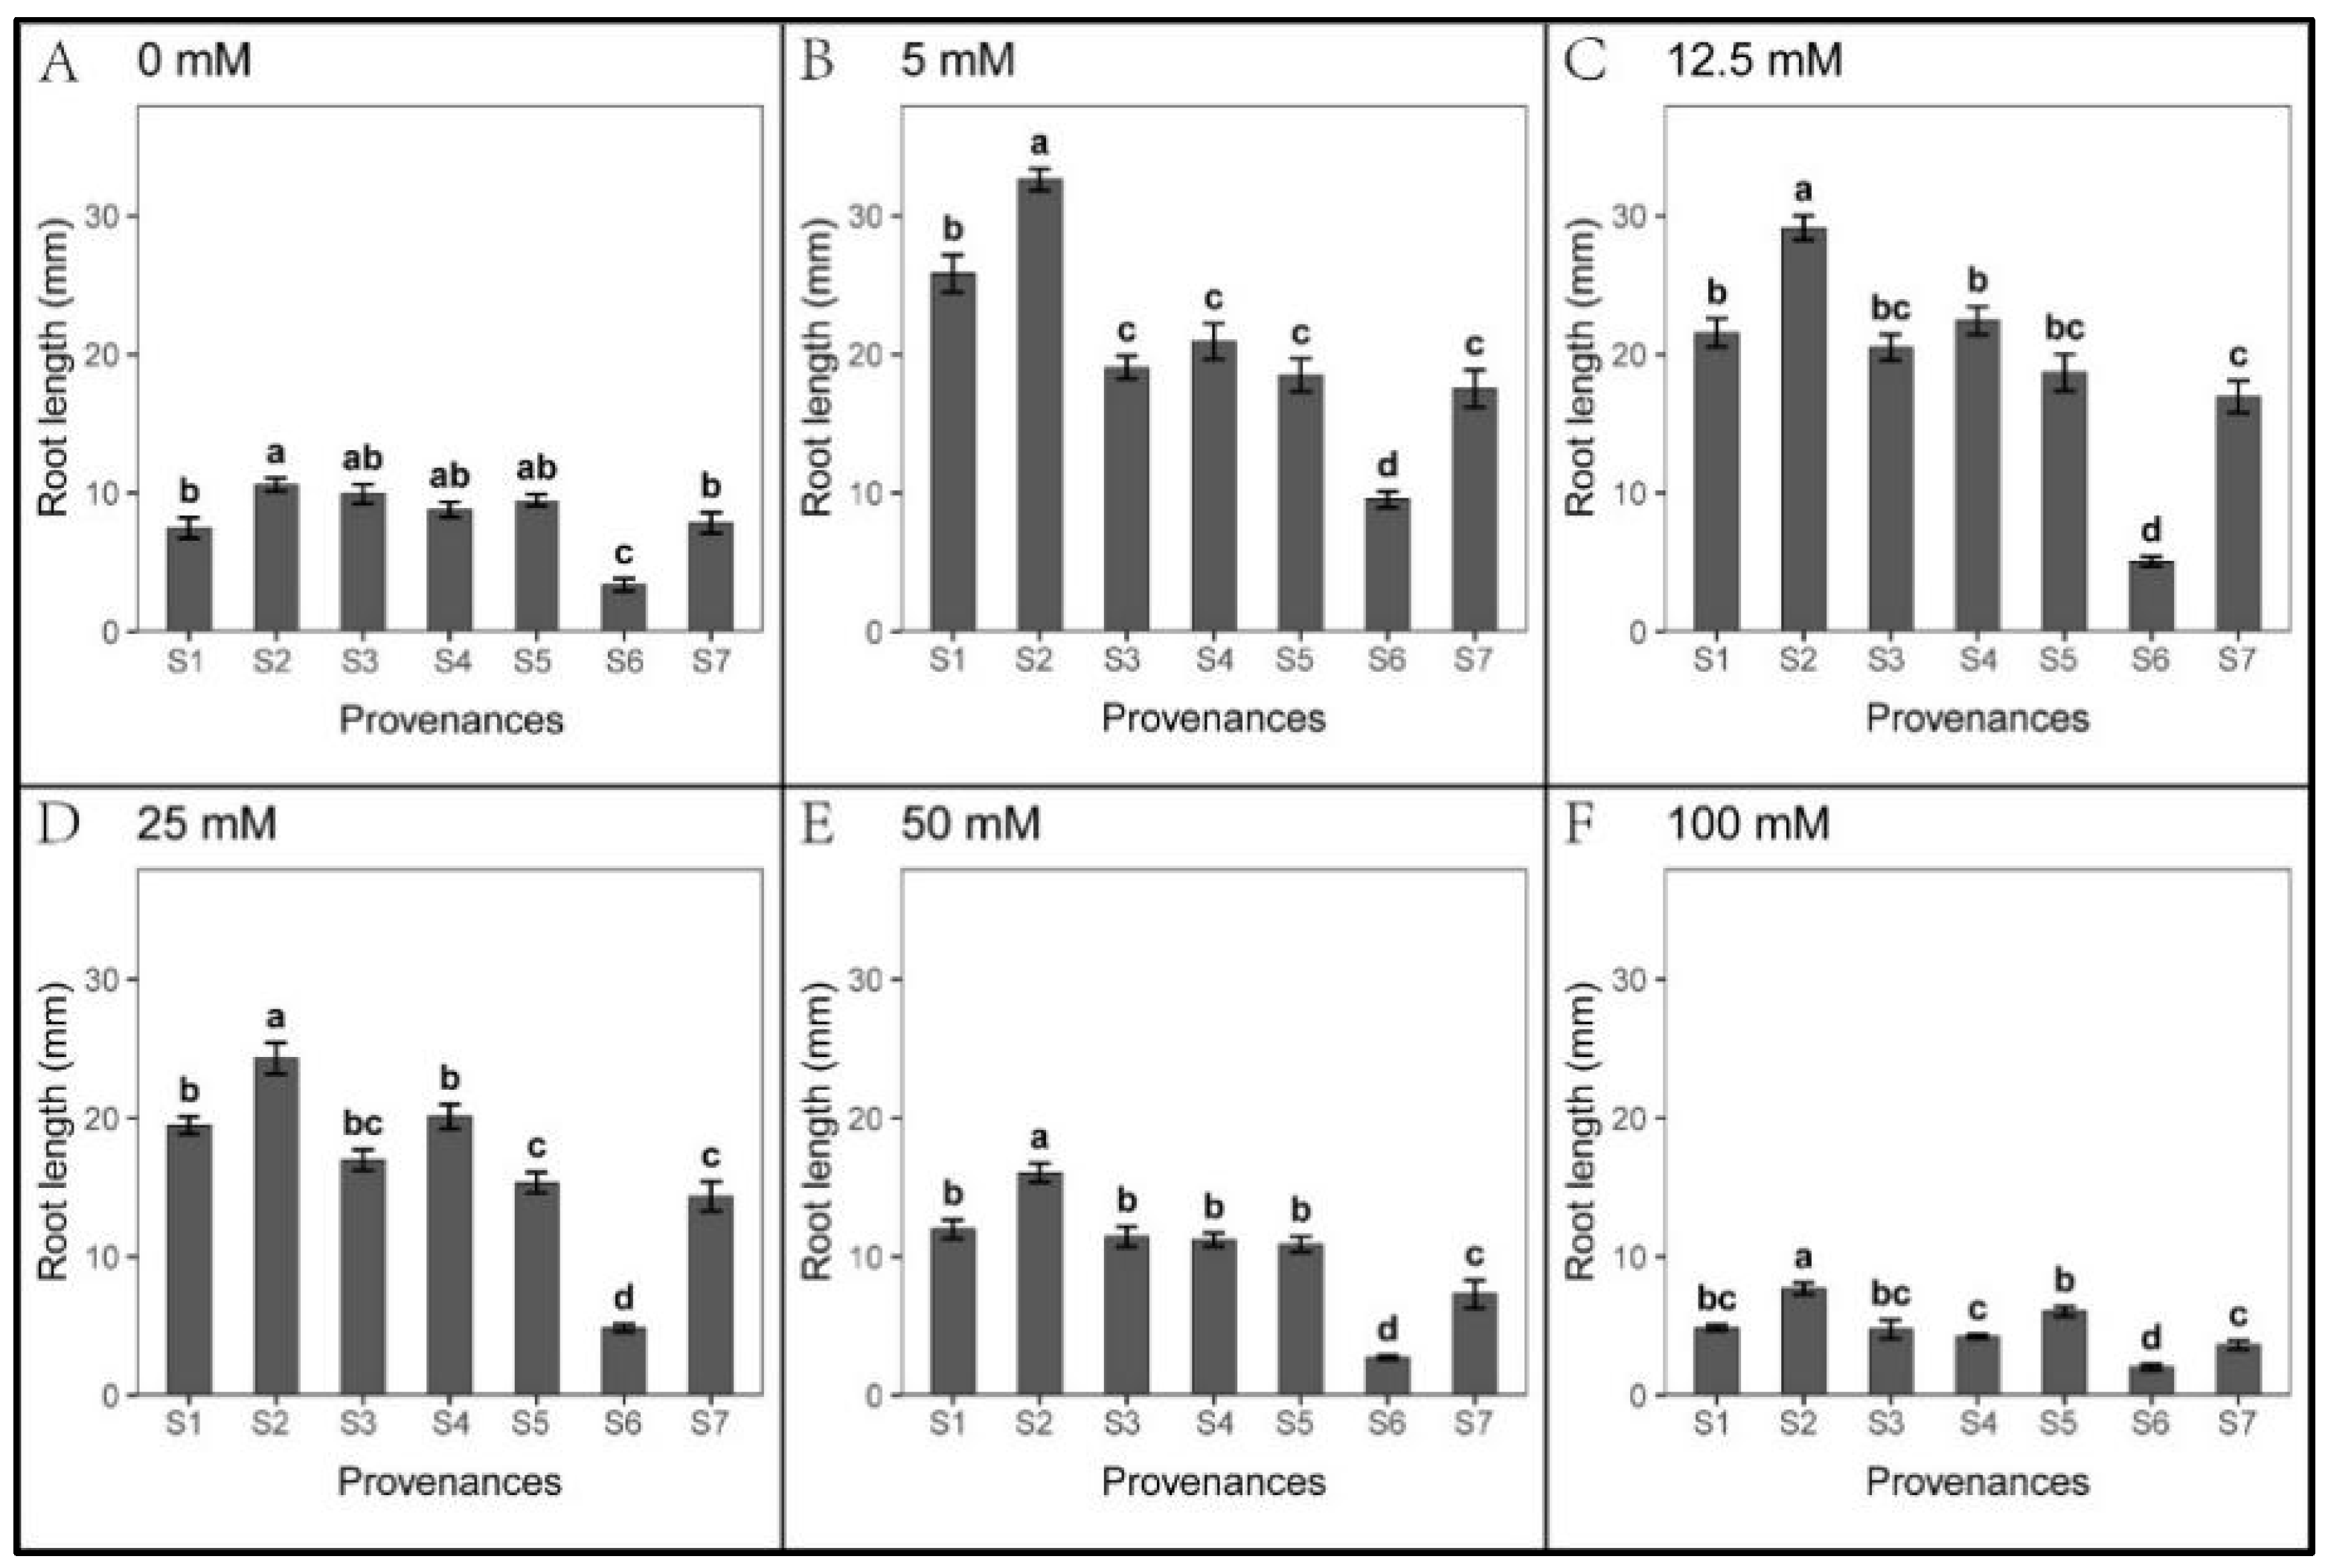
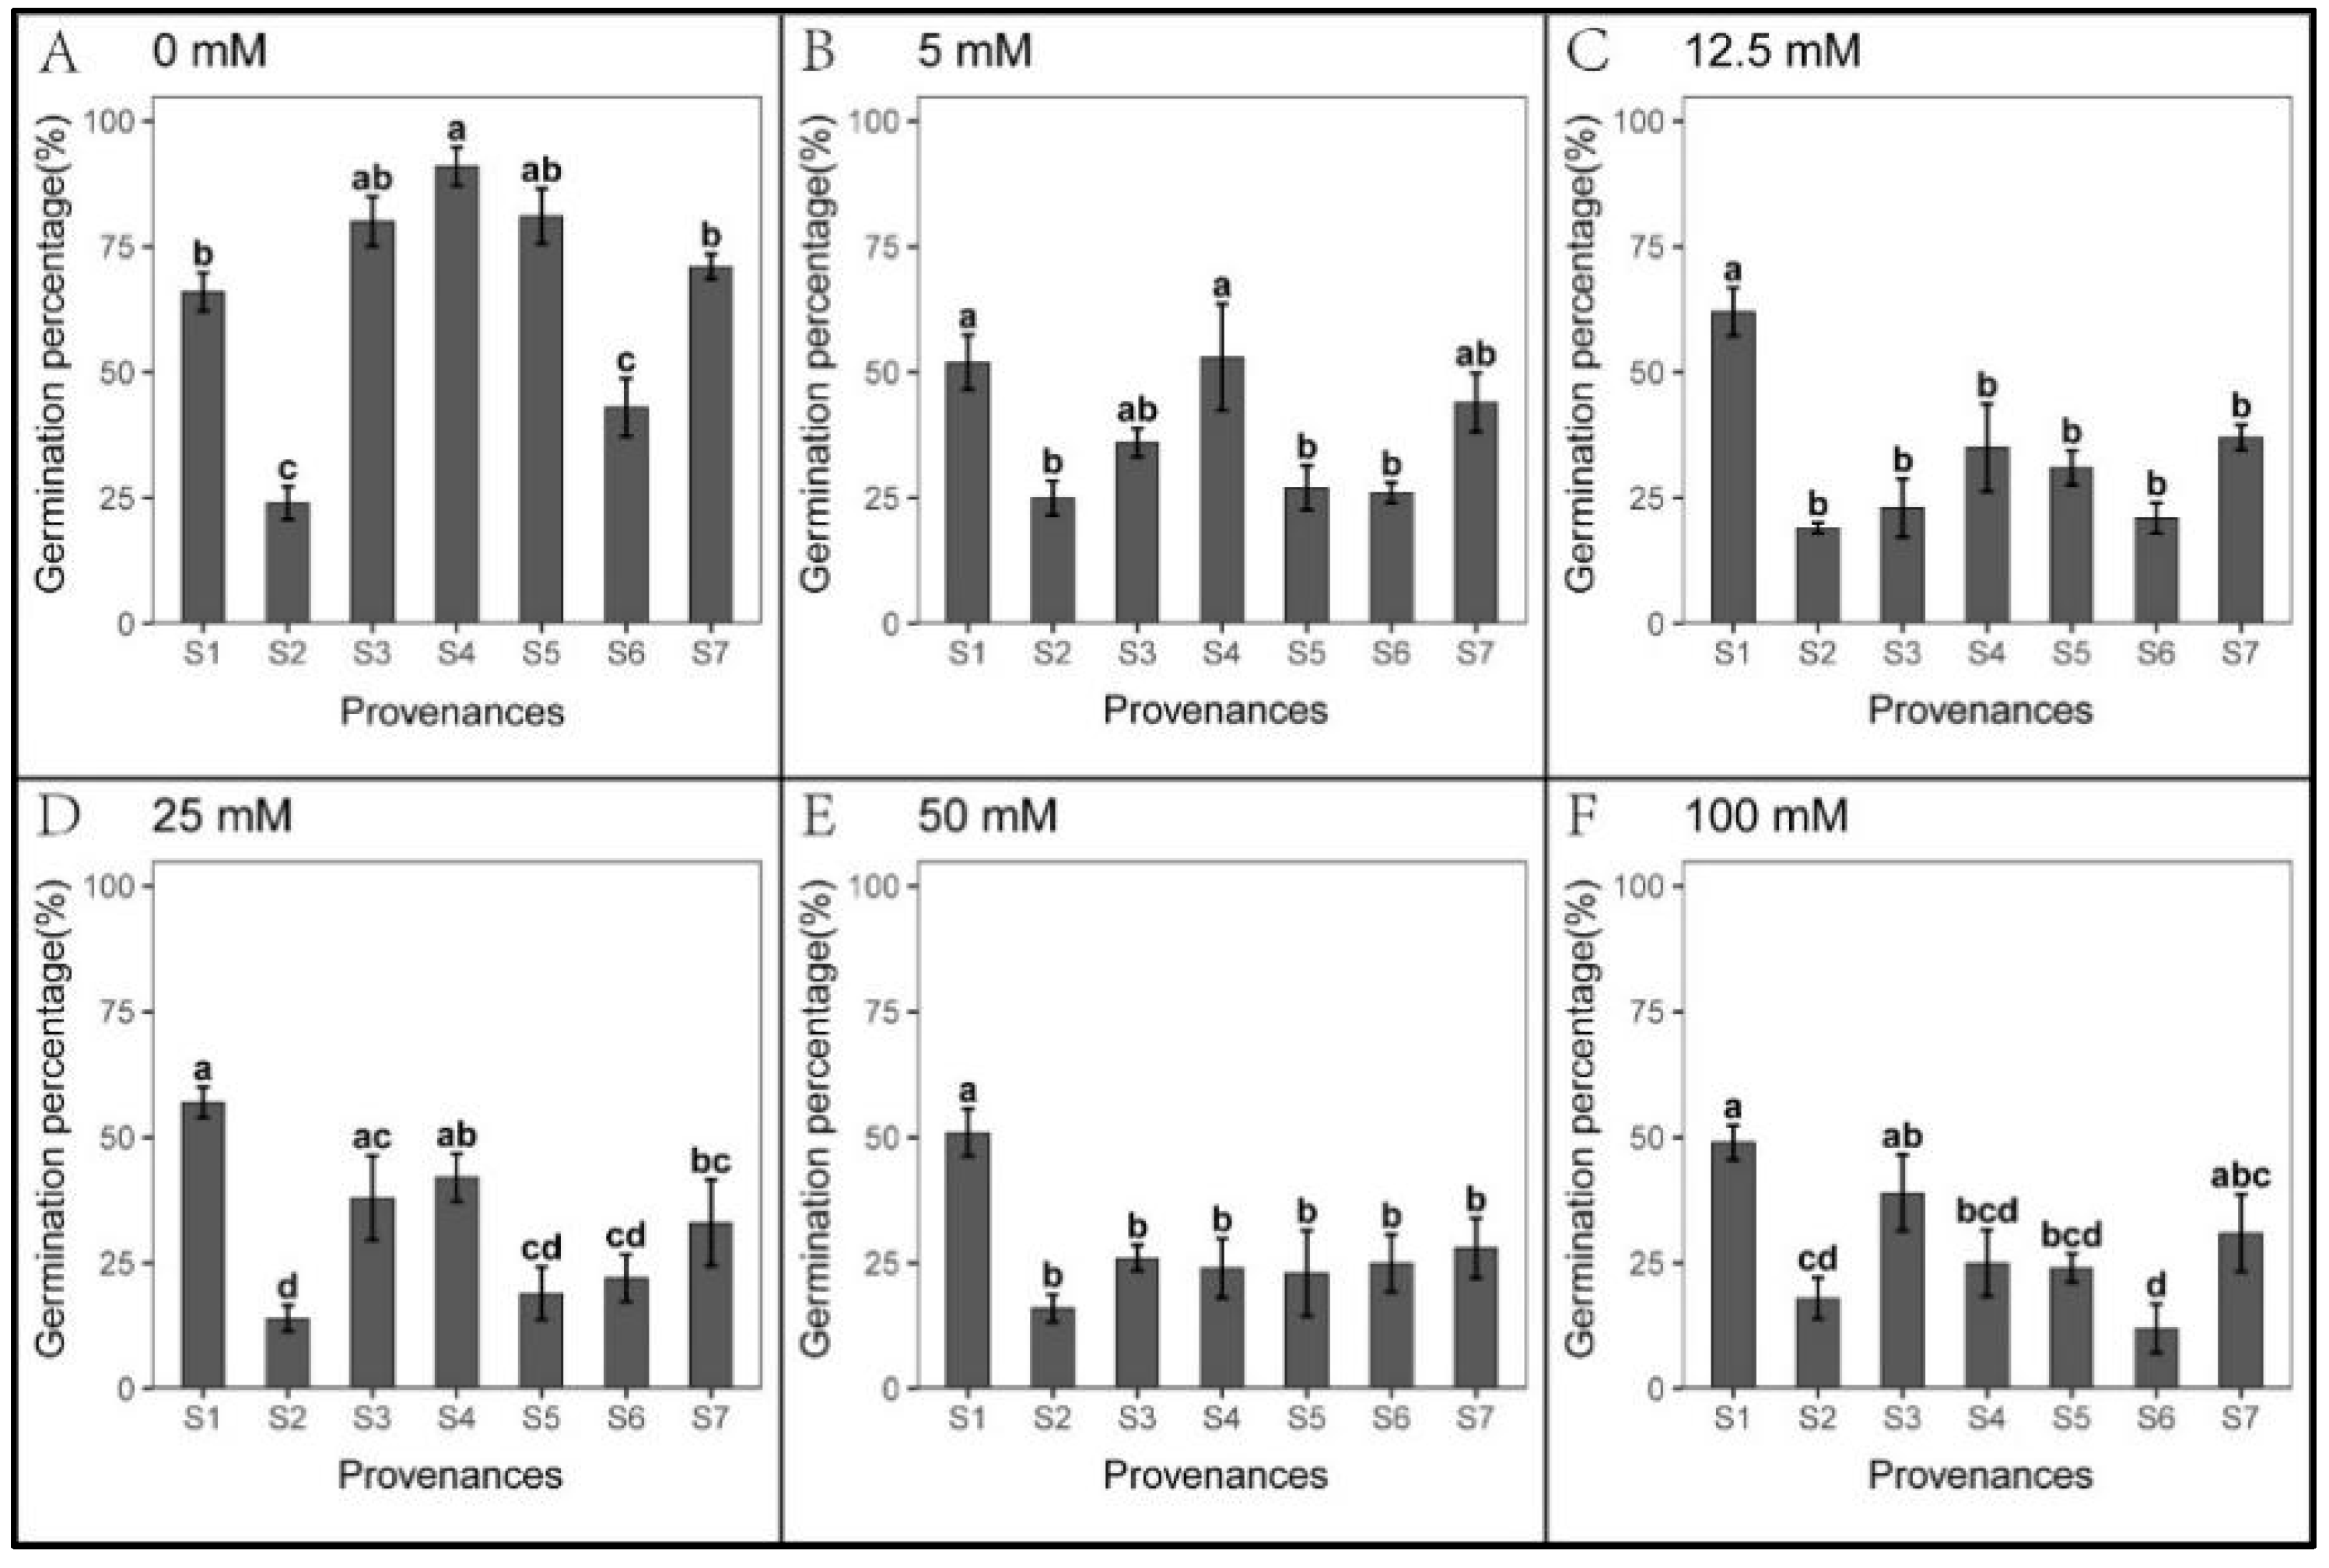
3.1. Effect of Provenance on Seed Germination under NaCl Stress

There was no significant difference in seed germination when the salt concentration was below 300 mM (Figure 2). In contrast, low salt concentration promoted the elongation of roots and shoots (Figure 3 and Figure 4). When the salt concentration was ≥300 mM, the germination rates and seedling growth were significantly inhibited (Figure 2, Figure 3 and Figure 4); compared to shoots, the salt tolerance index of the roots was lower, suggesting roots were more sensitive to high salt stress (Table 2 and Table 3). However, after the high salt stress was relieved, most ungerminated seeds germinated (Figure 5, Table 4).
A significant relationship was observed between the provenances and NaCl concentrations in S. salsa seed germination (Table 5). Under high NaCl stress, the salt tolerance of seeds from S5 and S7 was significantly higher than that of other provenances, with 27% and 15% germination rates under 500 mM NaCl, respectively. However, the seeds from S1, S2, and S6 did not germinate, while only one seed germinated from S3 and S4 (Figure 2G). When the salt concentration reached ≥ 300 mM, germination in S1, S3, and S4 decreased significantly, with rates that were > 50% lower than the control (Figure 2E–G). Hence, 300 mM may represent the salt-tolerance threshold for S. salsa during germination in these three provenances.
For each recovery treatment, germination, total germination, and the relative germination rates of S2 and S6 were lower than those of other provenances (Figure 2 and Figure 5, Table 6). These results suggest that the seeds from S2 and S6 may be in a dormant period. In 50–200 mM NaCl, total germination and the relative germination rates in S2 were higher than in the control (Figure 5, Table 6). Meanwhile, under 200–500 mM NaCl, total S2 germination was significantly higher than S6 (Figure 5), indicating that seeds from S6 were most sensitive to high salt stress.
Moreover, seedling growth was significantly different across provenances. In each treatment, seedling growth in S4 and S5 was markedly faster than in other provenances; the slowest growth was observed in S6. Under 50–300 mM NaCl in S7, the shoot length was significantly higher than that of the control. In addition, the shoot tolerance index of S7 was significantly higher than in other provenances (Table 4).

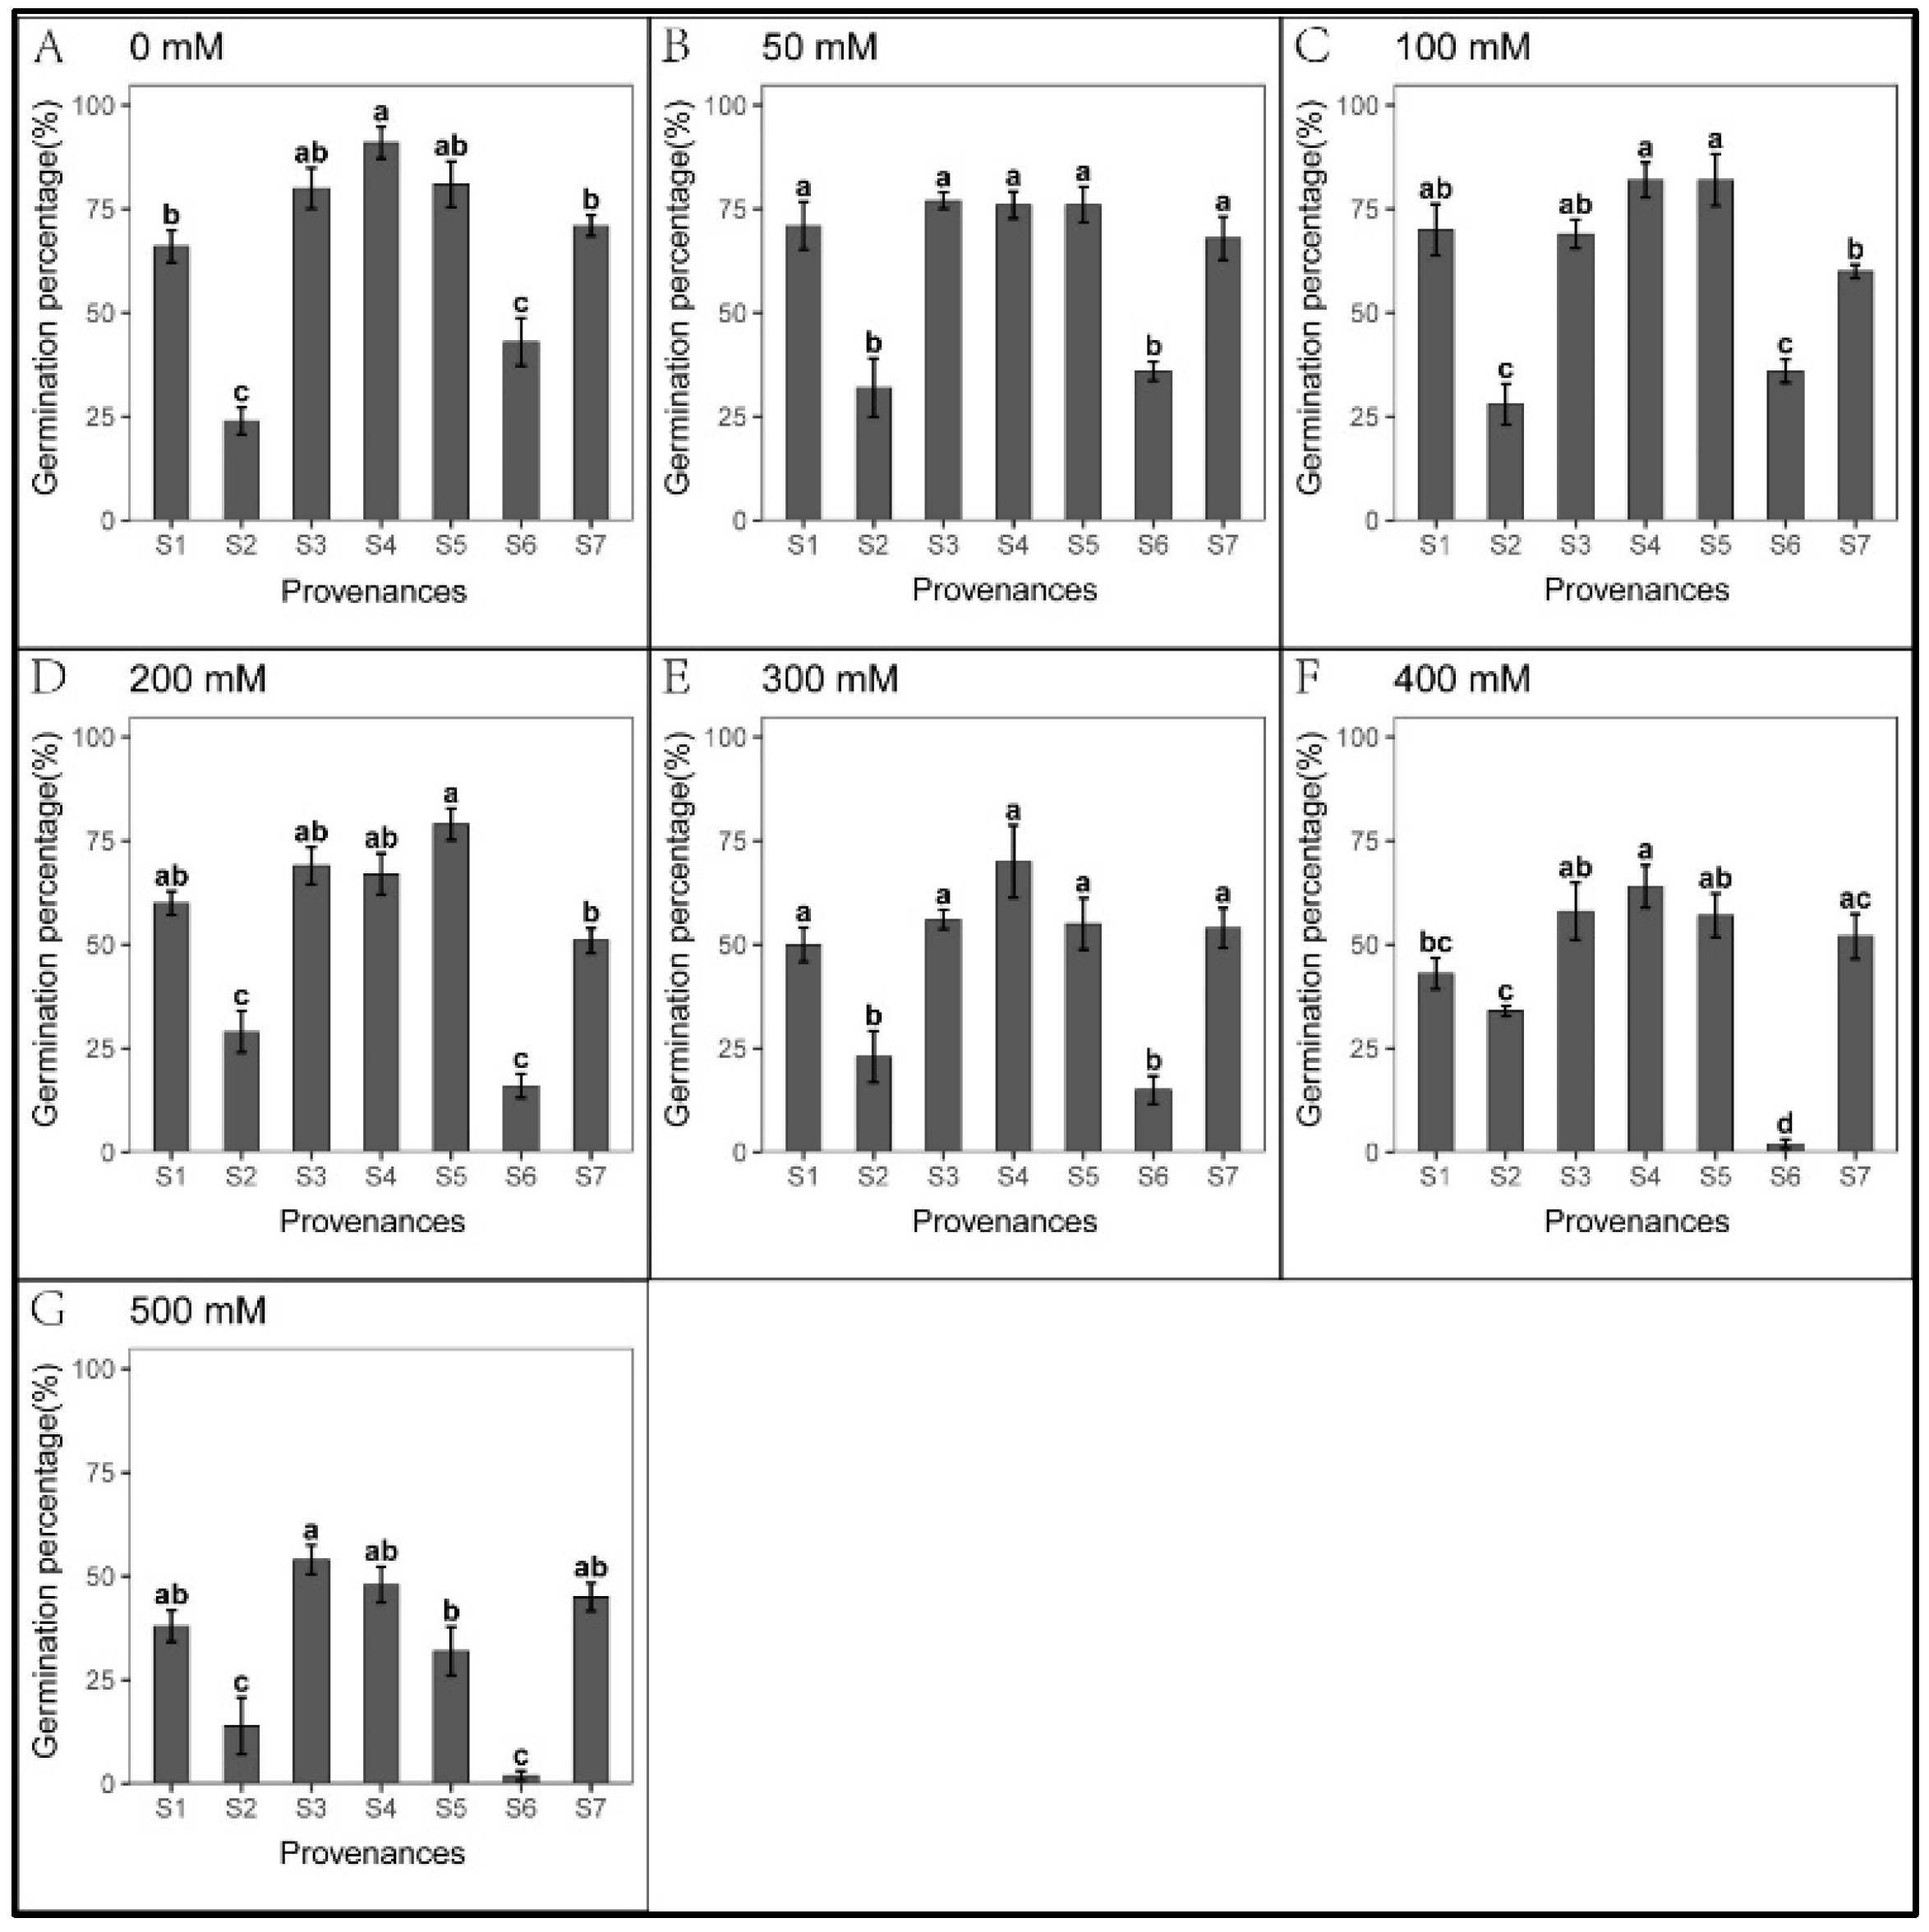
3.2. Effect of Provenances on Seed Germination under Na2CO3 Stress

S. salsa seeds showed weak germination response to Na2CO3 treatments in all seven provenances (Figure 6). However, seedling growth was not hindered by Na2CO3 stress (Figure 7 and Figure 8). At 5 mM Na2CO3, the S. salsa germination rate decreased by more than 50% compared to the control (Figure 6), and seed germination progressively decreased with increasing Na2CO3 concentration. In addition, the total germination percentage in the recovery experiment was significantly lower than in the control (Figure 9 and Table 7). However, the root length under 5–25 mM Na2CO3 and the shoot length across all Na2CO3 treatments was significantly higher than the control (Figure 7 and Figure 8). The shoot stress tolerance index under 5–25 mM exceeded the root stress tolerance index. In contrast, the shoot stress tolerance index under 50–100 mM was higher than the root stress tolerance index, suggesting that roots are more sensitive to Na2CO3 stress (Table 8 and Table 9).
Significant relationships were observed between the provenances and Na2CO3 concentrations in S. salsa germination and seedling growth (Table 10). The germination rate of S1 was higher than other provenances across all Na2CO3 concentrations, with S2 showing the lowest germination (Figure 6). However, the root length of S2 and shoot length of S2, S4, and S5 were significantly higher than other provenances, and the root and shoot lengths of S6 were the lowest (Figure 7 and Figure 8). Germination recovery showed no significant difference across the provenances or Na2CO3 concentrations, except S7, where percent germination was higher than the control across all Na2CO3 treatments (Figure 9 and Table 11).

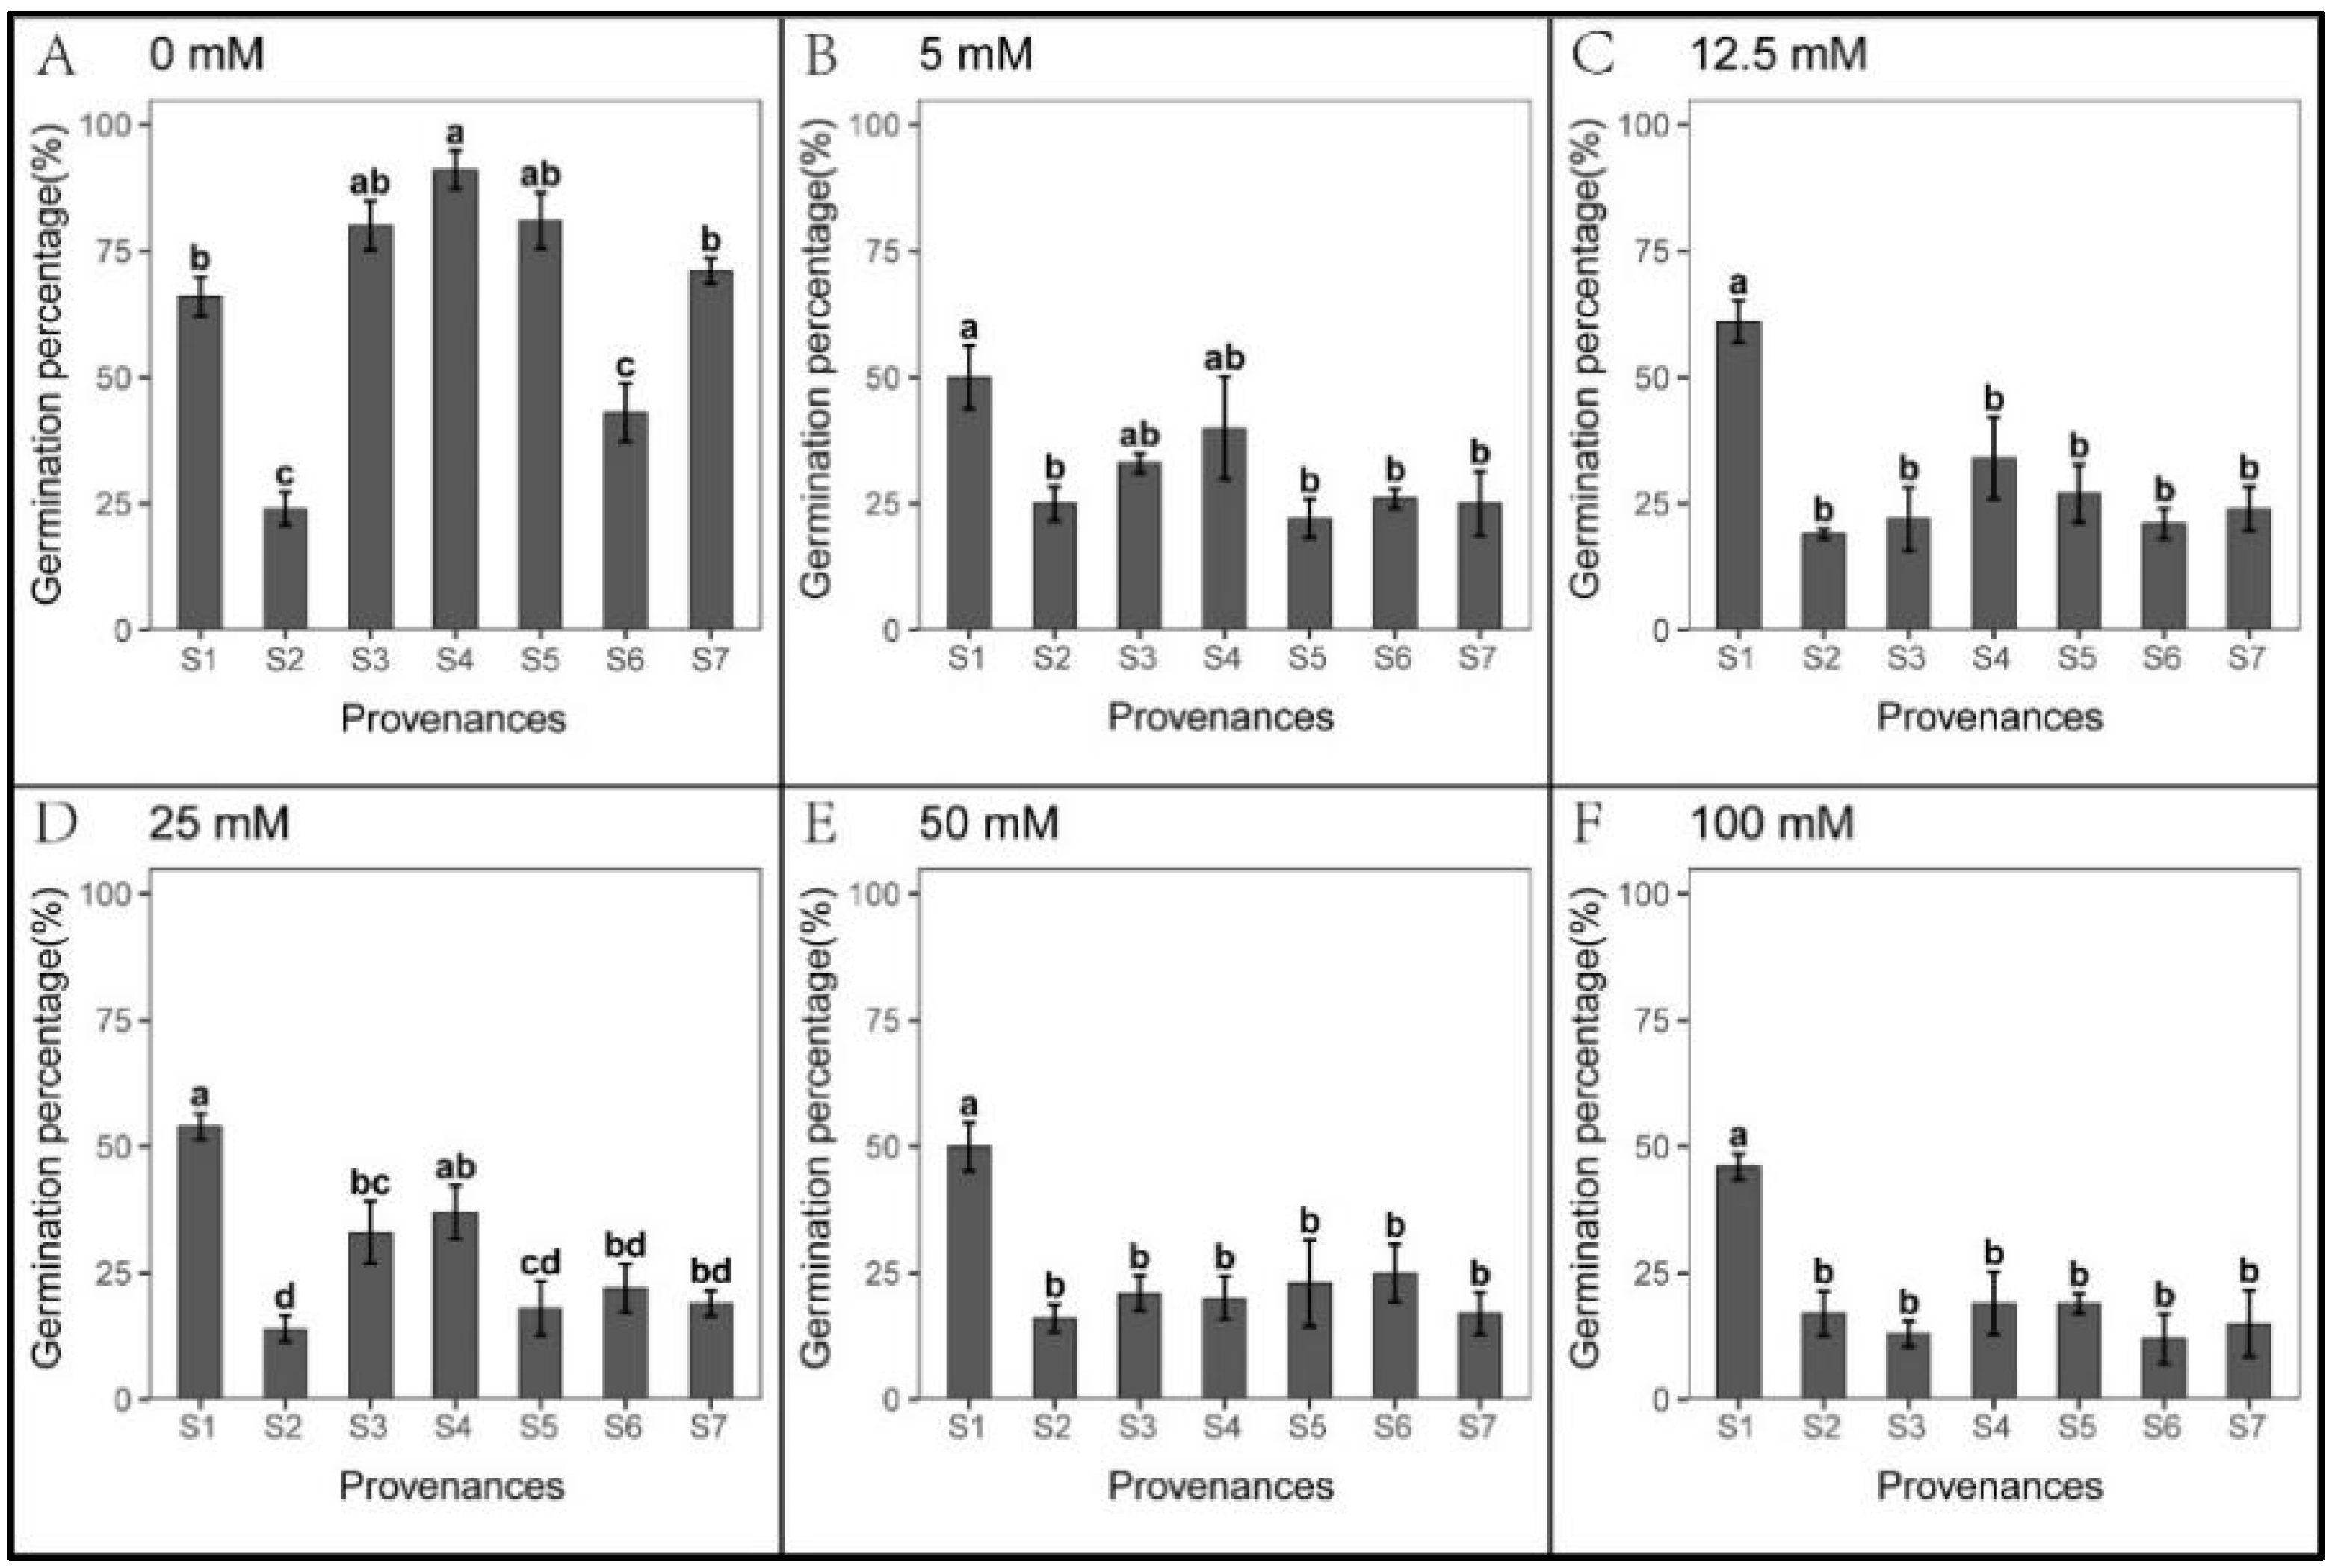
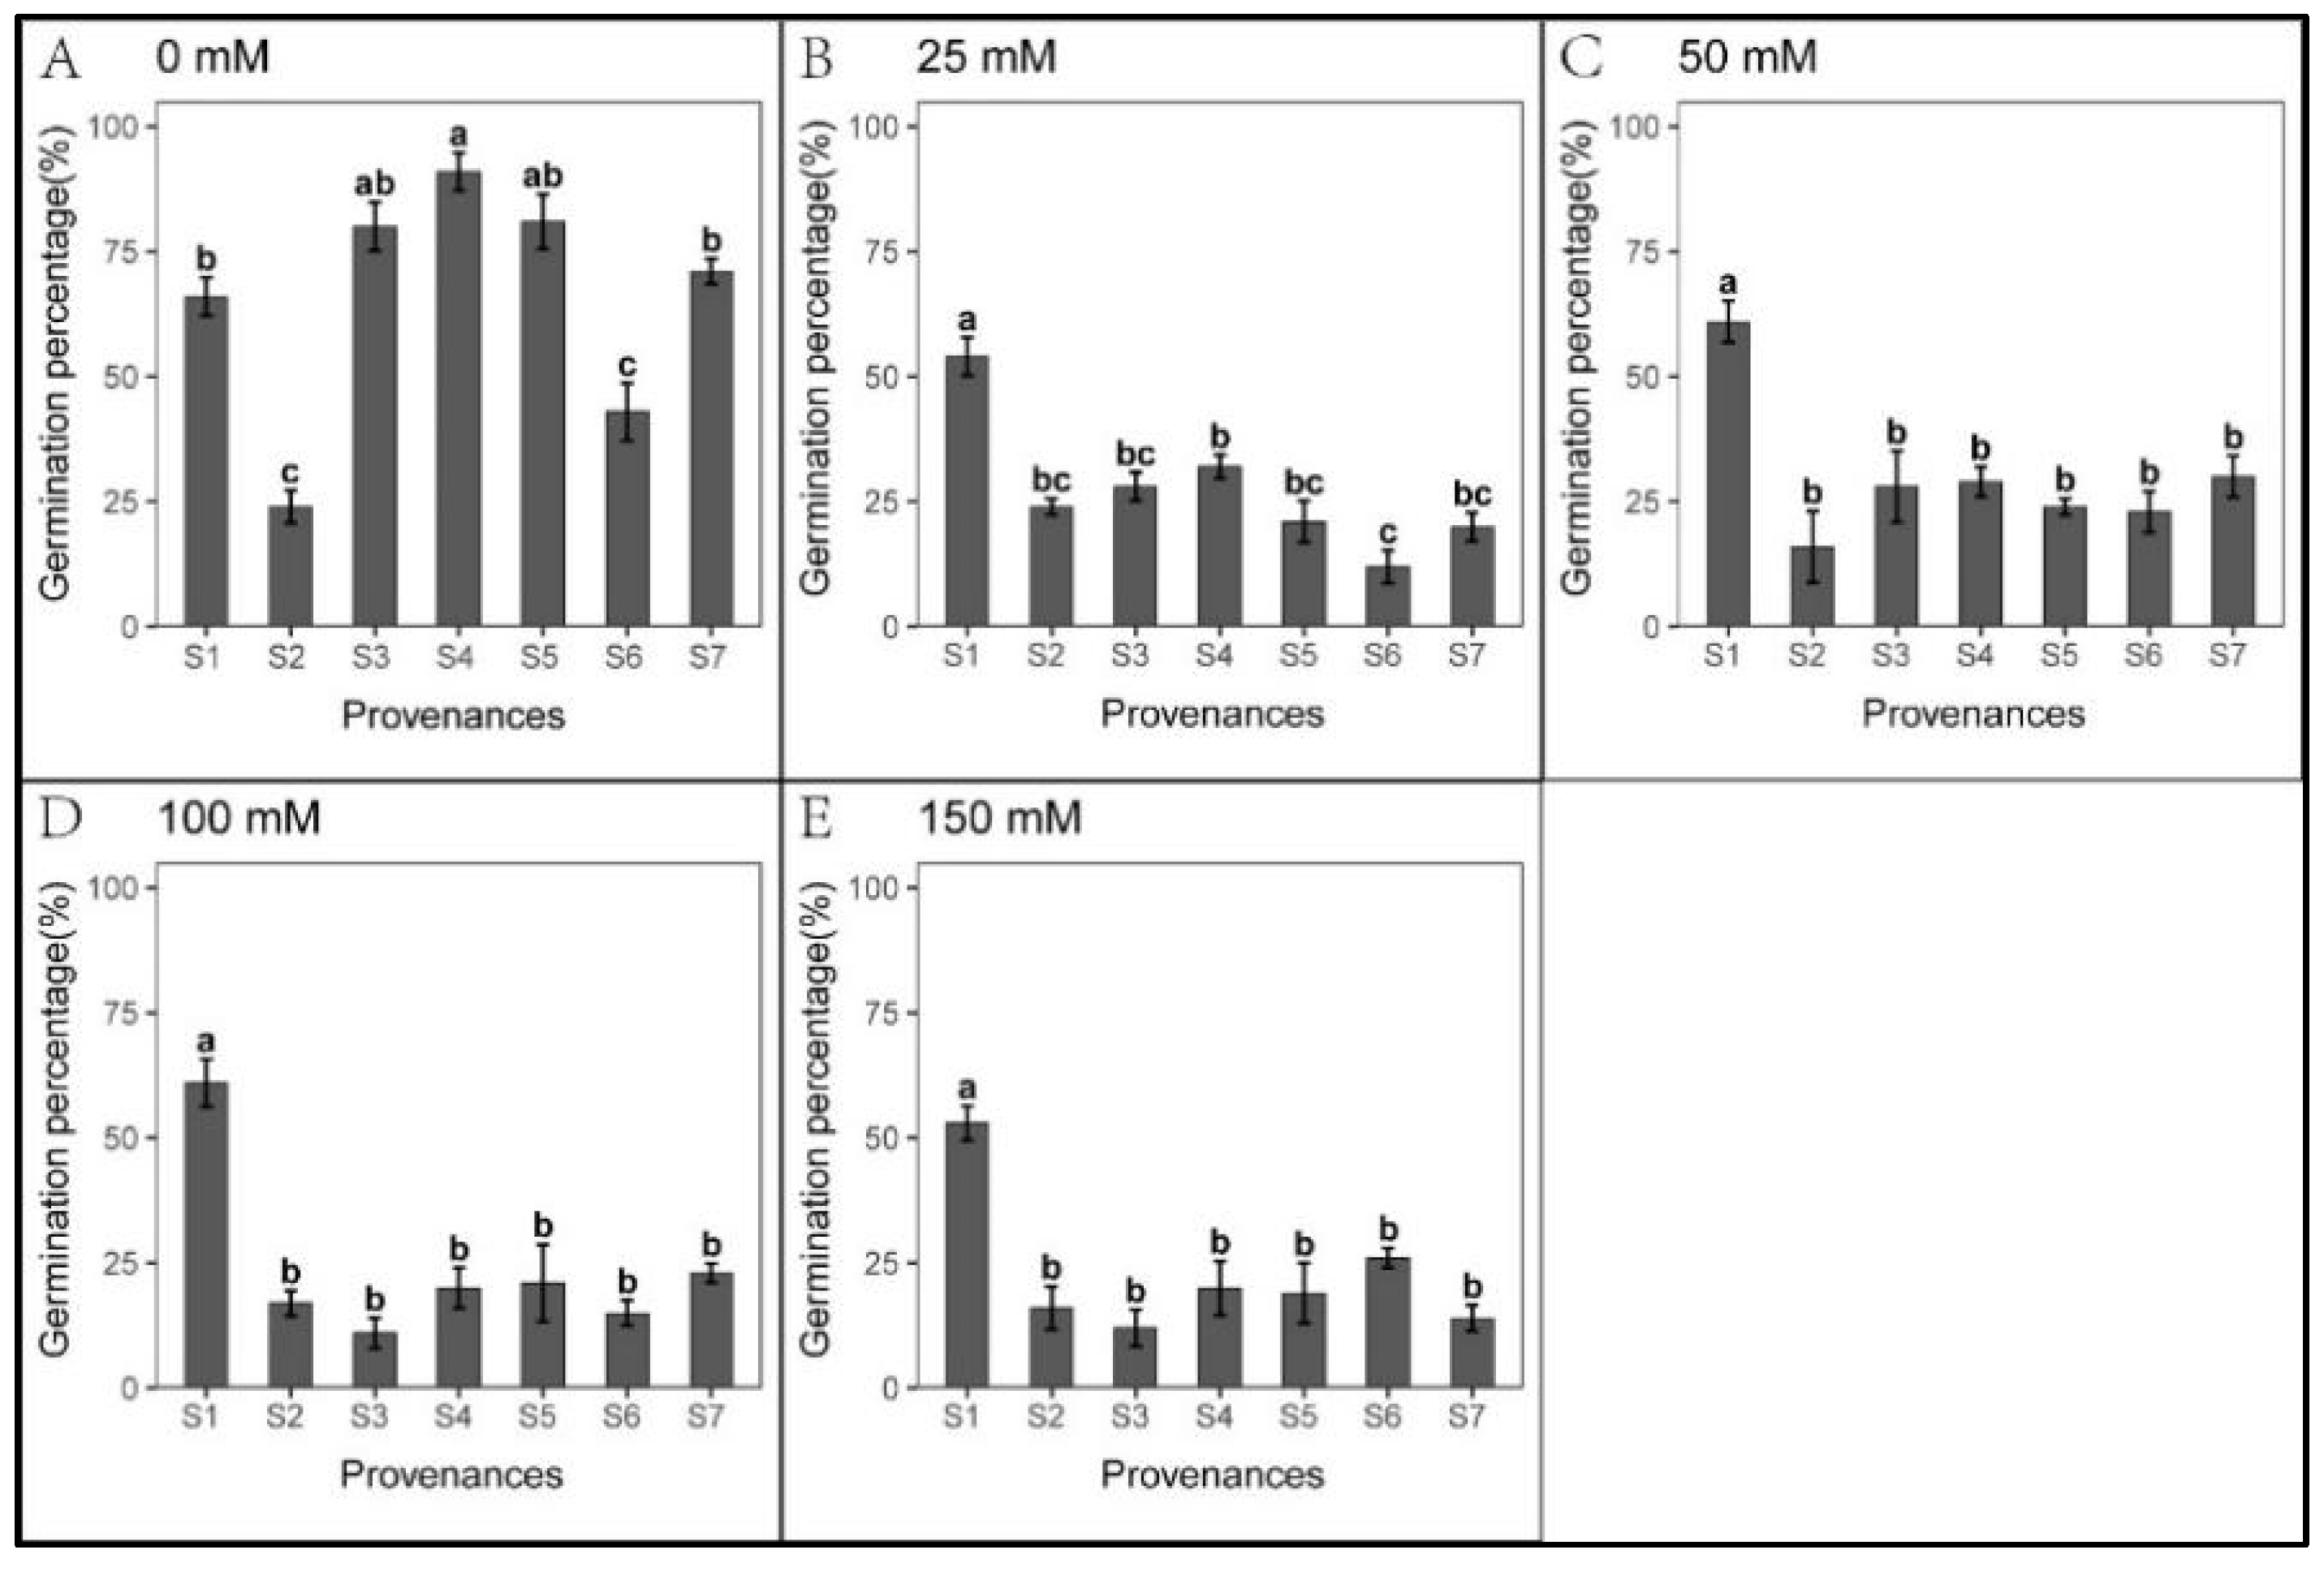
3.3. Effect of Provenance on Seed Germination under NaHCO3 Stress

Seed germination was significantly inhibited cross all NaHCO3 treatments, excluding S1 (Figure 10). We found significant relationships between provenance and NaHCO3 concentration regarding S. salsa germination and seedling growth (Table 12). However, seedling growth was less inhibited under NaHCO3 than under Na2CO3 treatments (Figure 7, Figure 8, Figure 11 and Figure 12, Table 10, Table 11, Table 13 and Table 14). Root length was not inhibited under any NaHCO3 treatment, except for S6; root length was longest in S2, while those in S2 and S5 were significantly longer than other provenances under each NaHCO3 treatment. The shoot stress tolerance indices under all NaHCO3 treatments were significantly higher than under the Na2CO3 treatments, except for S4.
Regarding germination recovery, all provenances, excluding S2 and S6, exhibited a relapse phenomenon. The germination recovery for S7 was the highest (Table 15), although total germination was significantly lower than that of control (Figure 13 and Table 16). No significant difference was observed in seed germination between S7 and S1 (Figure 13). Thus, NaHCO3 also promoted seedling growth. Across the provenances, S1 showed the highest stress resistance, followed by S7; meanwhile, NaHCO3 significantly inhibited germination in all other provenances.

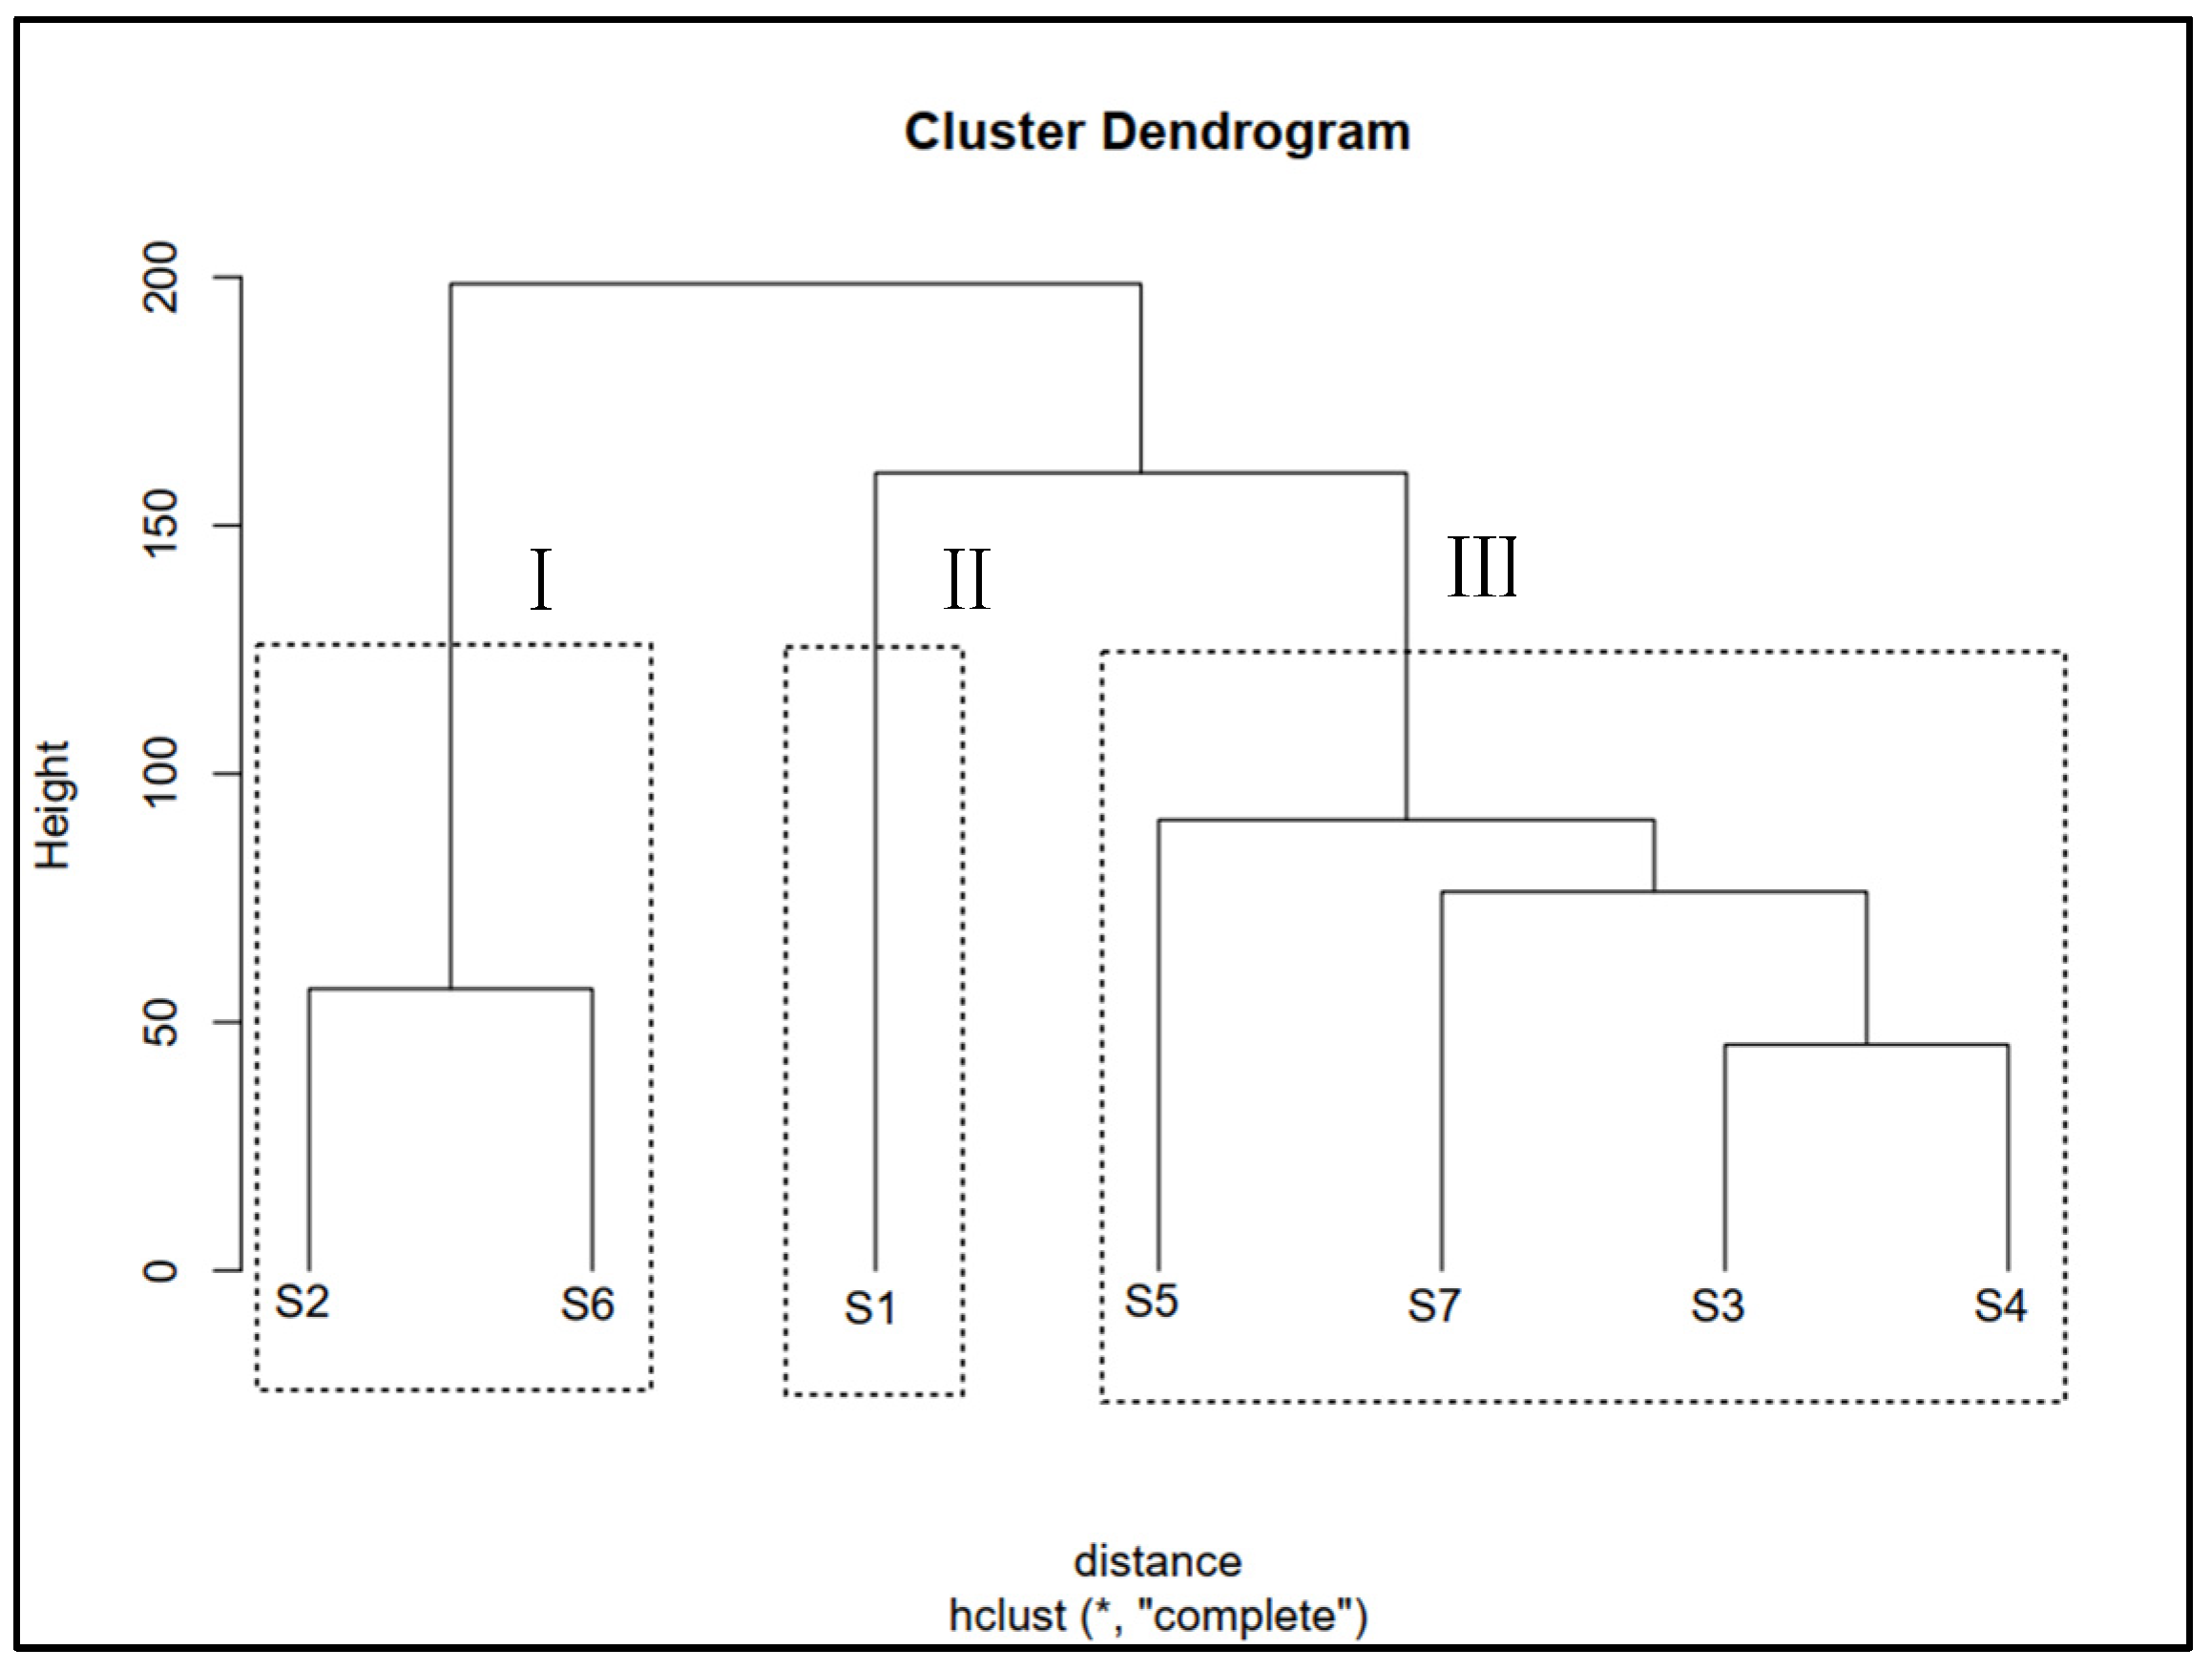
3.4. Cluster Analysis of Seed Germination Data

Cluster analysis was performed using germination data to comprehensively understand differences in saline–alkali tolerance among seeds from different provenances. The seven provenances were classified into three groups (Figure 14): Group I included S3, S4, S5, and S7; Group II included S1; Group III included S2 and S6. Cluster analysis and regression analyses suggested that seeds from S3, S4, S5, and S7 showed the highest NaCl tolerance. Moreover, seeds from S1 had moderate NaCl tolerance and the highest NaHCO3 tolerance. In contrast, seeds from S2 and S6 had the lowest NaCl, Na2CO3, and NaHCO3 tolerance.
Based on the sampling sites’ geographical distribution and environmental conditions, S3, S6, and S7 were close to each other, with similar climatic conditions. Meanwhile, S1, S2, S4, and S5 were distant. However, S4 and S5 had similar climatic conditions despite being far apart. In contrast, the differences in soil conditions based on geographical distance and climatic conditions were inconsistent. For instance, the soil pH at the S1, S2, and S4 sampling sites was higher, while the soil ion content was lower in S2. In contrast, soil pH, EC, and ion content at sampling site S6 were the lowest. Additionally, soil from S3, S4, S5, and S7 had the highest EC and Cl content, while that from S4 and S7 had the highest HCO3 content. Overall, our results suggest that the differences in seed germination among different provenances may be attributed to local edaphic factors rather than geographical locations and climatic conditions.

4. Discussion

Previous studies indicate alkali stress is more destructive to plants than neutral salt stress. Under alkaline stress, seed germination is affected primarily by osmotic imbalance with high pH [53,54]. Consistent with this, in the current study, Na2CO3 and NaHCO3 had stronger inhibitory effects on S. salsa germination than NaCl, regardless of provenance, excluding S1. After the saline–alkali stress was relieved, ungerminated seeds from all provenances except S6 and under 200–500 mM NaCl showed comparable responses to other halophytes [55,56,57]. However, seeds from S7 and under 25–150 mM NaHCO3 regerminated. Regermination is an important strategy for S. salsa black seeds to adapt to salinity stress, in which seeds remain viable at high salinity and germinate when environmental conditions become favorable [29,58]. Previous studies involving regermination have shown that germination inhibition is likely due to osmotic restriction rather than ionic toxicity [11,29]. In this study, the stronger inhibition of seed germination by Na2CO3 and NaHCO3 than NaCl is likely due to S. salsa seeds being inactive or dormant under the combined stress of high pH, osmotic pressure, and ionic toxicity.
Contrary to the seed germination responses, 5–50 mM Na2CO3 and 25–150 mM NaHCO3 promoted root and shoot growth in S. salsa. Indeed, plants have different levels of abiotic stress resistance at different growth stages [19,59]. Suaeda salsa, as a halophyte, can tolerate salt stress at the early stages of growth, and low salinity levels can promote seedling growth [27,34,60]. We found greater Na2CO3 and NaHCO3 tolerance in S. salsa during the seedling growth stage than in the seed germination stage. In contrast to our findings, Li et al. [19] found enhanced seedling growth under 200 mM NaCl, while Na2CO3 and NaHCO3 significantly inhibited germination and seedling growth.
In our study, root growth in S6 was significantly inhibited under NaCl, Na2CO3, and NaHCO3 stress, which differed from what was observed for other provenances. In addition, germination percentages in S2 and S6 were significantly lower than those of other provenances under control treatment, while seedling growth in S2 was significantly higher than in S6. These results show that besides halophyte characteristics, other factors impact their tolerance to saline–alkali conditions. Germination, seedling growth, and abiotic stress tolerance in many plant species vary spatially (i.e., provenances), likely due to local adaptations or transgenerational induction through epigenetic effects of maternal environments, such as precipitation, temperature, and soil nutrients [20,61,62]. However, our cluster analysis results showed no apparent changes in seed germination or seedling growth along temperature and precipitation gradients; rather, they exhibited a strong correlation with the soil properties of the provenances. Therefore, different germination and seedling growth strategies in S. salsa from different provenances and under different saline–alkali stresses may be explained by a long-term adaptation of the parent plant (i.e., seed source) to the local soil environment. Since the maternal environment of seed sources plays an important role in determining the germination characteristics of seeds, it is vital to consider provenances to collect seeds for vegetation restoration in Songnen Plain.
Under high salt stress, the germination rates were high, while seedling growth was significantly inhibited, increasing the risk of plant establishment in saline–alkali land [30,63]. In our study, S5 and S6 were not suitable for heavy saline–alkali soil dominated by NaCl, S7 was suitable for Na2CO3, and S1 and S7 were suitable for NaHCO3. Previous studies suggest significant differences in seed germination in two ecotypes and dimorphic seeds of S. salsa when exposed to saline–alkali stress. Black seeds have a more extended dormancy period and lower germination rate than brown seeds. However, the germination rate of the black seeds from S. salsa plants growing at high elevations and farther inland is higher than those growing in the intertidal zone [28,29]. Meanwhile, in this study, we only selected black seeds collected from the same ecotype, with very few brown seeds. Therefore, the intraspecific variation in different ecotypes and dimorphic seeds of S. salsa growing in soda saline–alkali land in Songnen Plain needs further study.

5. Conclusions

Our study revealed significant differences in germination and seedling growth in S. salsa under various salt stresses and seven provenances. NaCl, Na2CO3, and NaHCO3 demonstrated varying degrees of inhibition on seed germination. However, salt resistance in S. salsa was significantly higher under Na2CO3 and NaHCO3 during seedling growth than during germination. The roots appeared to be more sensitive to salt stress than the shoots, suggesting roots can be used as an effective indicator to evaluate salt tolerance in S. salsa. Our study also provides evidence that the soil salinity of the maternal environment (i.e., provenances in this study) is an important environmental factor affecting salt tolerance in seeds. Under various concentrations of three salts stress, seeds from S1 and S7 were the most salt and alkali tolerant among all provenances, while those from S6 were the least stress tolerant. Seeds from S2 showed low germination under the control condition, while low NaCl concentrations and pretreatments enhanced their germination. This study provides basic information for cultivating and protecting high-quality saline–alkali resistant species, which can be utilized for saline–alkali land reconstruction and vegetation restoration in the Songnen Plain.

Author Contributions

Methodology, H.W.; writing—review and editing, H.M.; investigation, S.L.; writing—original draft preparation, W.Q.; resources, D.Z. All authors have read and agreed to the published version of the manuscript.

Funding

Supported by the Strategic Priority Research Program of the Chinese Academy of Sciences (No. XDA28110301), the National Key Research and Development Program (2022YFF1300601), the Key Research and Development Program of Jilin Province (20220203023SF), the National Natural Science Foundation of China (41977424; 42201066), and the Provincial Natural Science Foundation of Jilin (20220101280JC).

Institutional Review Board Statement

Not applicable.

Informed Consent Statement

Not applicable.

Data Availability Statement

The data presented in this study are available in the article.

Conflicts of Interest

The authors declare no conflict of interest.

References

  1. Morton, M.J.L.; Awlia, M.; Al-Tamimi, N.; Saade, S.; Pailles, Y.; Negrão, S.; Tester, M. Salt stress under the scalpel—Dissecting the genetics of salt tolerance. Plant J. 2018, 97, 148–163. [Google Scholar] [CrossRef] [PubMed]
  2. Pan, C.C.; Liu, C.A.; Zhao, H.L.; Wang, Y. Changes of soil physico-chemical properties and enzyme activities in relation to grassland salinization. Eur. J. Soil Biol. 2013, 55, 13–19. [Google Scholar] [CrossRef]
  3. Corwin, D.L.; Yemoto, K. Salinity: Electrical conductivity and total dissolved solids. Soil Sci. Soc. Am. J. 2020, 84, 1442–1461. [Google Scholar] [CrossRef]
  4. Ma, H.-Y.; Lü, B.-S.; Yang, H.-Y.; Yan, C.; Liang, Z.-W. Responses of seed germination of Leymus chinensis to environmental factors in degraded grassland on Songnen Plain in China. Chin. J. Plant Ecol. 2012, 36, 812–818. [Google Scholar] [CrossRef]
  5. Mann, A.; Lata, C.; Kumar, N.; Kumar, A.; Kumar, A.; Sheoran, P. Halophytes as new model plant species for salt tolerance strategies. Front. Plant Sci. 2023, 14, 1137211. [Google Scholar] [CrossRef]
  6. Li, X.; Zhang, C. Effect of natural and artificial afforestation reclamation on soil properties and vegetation in coastal saline silt soils. Catena 2020, 198, 105066. [Google Scholar] [CrossRef]
  7. Wang, Y.; Wang, Z.; Liang, F.; Jing, X.; Feng, W. Application of flue gas desulfurization gypsum improves multiple functions of saline-sodic soils across China. Chemosphere 2021, 277, 130345. [Google Scholar] [CrossRef]
  8. Wang, S.X.; Liu, W.; Li, P.J.; Wu, H.Y. Advances of Researches in Plant-improvement of Saline-alkaline Soil. Chin. Agric. Sci. Bull. 2011, 27, 1–7. [Google Scholar]
  9. Elnaggar, A.; Mosa, K.A.; El-Keblawy, A.; Tammam, A.; El-Naggar, M. Physiological and biochemical insights for salt stress tolerance in the habitat-indifferent halophyte Salsola drummondii during the vegetative stage. Botany 2020, 98, 673–689. [Google Scholar] [CrossRef]
  10. Skorupa, M.; Szczepanek, J.; Mazur, J.; Domagalski, K.; Tretyn, A.; Tyburski, J. Salt stress and salt shock differently affect DNA methylation in salt-responsive genes in sugar beet and its wild, halophytic ancestor. PLoS ONE 2021, 16, e0251675. [Google Scholar] [CrossRef]
  11. Navarro-Torre, S.; Garcia-Caparrós, P.; Nogales, A.; Abreu, M.M.; Santos, E.; Cortinhas, A.L.; Caperta, A.D. Sustainable agricultural management of saline soils in arid and semi-arid Mediterranean regions through halophytes, microbial and soil-based technologies. Environ. Exp. Bot. 2023, 212, 105397. [Google Scholar] [CrossRef]
  12. El-Keblawy, A.; Aljasmi, M.; Gairola, S.; Mosa, K.A.; Hameed, A. Provenance determines salinity tolerance and germination requirements of the multipurpose tree Prosopis juliflora seeds. Arid Land Res. Manag. 2021, 35, 446–462. [Google Scholar] [CrossRef]
  13. Bhatt, A.; Gallacher, D.J.J.; Jarma-Orozco, A.; Fernandes, D.; Pompelli, M.F.F. Seed provenance selection of wild halophyte seeds improves coastal rehabilitation efficiency. Estuar. Coast. Shelf Sci. 2022, 265, 107657. [Google Scholar] [CrossRef]
  14. Kesh, H.; Devi, S.; Kumar, N.; Kumar, A.; Kumar, A.; Dhansu, P.; Sheoran, P.; Mann, A. Insights into physiological, biochemical and molecular responses in wheat under salt stress. In Wheat; IntechOpen: London, UK, 2022. [Google Scholar]
  15. Flowers, T.J.; Colmer, T.D. Salinity tolerance in halophytes*. New Phytol. 2008, 179, 945–963. [Google Scholar] [CrossRef] [PubMed]
  16. Wang, J.; Tian, Y.L.; Mu, Z.J.; Bai, C.L. Hot topics and forntier evolution of plant improvement of saline-alkali land—Visual analysis based on VOSviewer. Acta Agrestia Sin. 2023, 31, 2598–2607. [Google Scholar]
  17. Hajihashemi, S.; Skalicky, M.; Brestic, M.; Pavla, V. Cross-talk between nitric oxide, hydrogen peroxide and calcium in salt-stressed Chenopodium quinoa Willd. At seed germination stage. Plant Physiol. Biochem. 2020, 154, 657–664. [Google Scholar] [CrossRef] [PubMed]
  18. Dodd, G.L.; Donovan, L.A. Water potential and ionic effects on germination and seedling growth of two cold desert shrubs. Am. J. Bot. 1999, 86, 1146–1153. [Google Scholar] [CrossRef]
  19. Li, J.; Guo, K.; Li, X.; Feng, X.; Liu, X. Effects of PEG, NaCl and Na2CO3 stresses on Suaeda glauca and Suaeda salsa seed germination. Chin. J. Eco-Agric. 2018, 26, 1011–1018. [Google Scholar] [CrossRef]
  20. Ma, H.Y.; Erickson, T.E.; Walck, J.L.; Merritt, D.J. Interpopulation variation in germination response to fire-related cues and after-ripening in seeds of the evergreen perennial Anigozanthos flavidus (Haemodoraceae). Int. J. Wildland Fire 2020, 29, 950–960. [Google Scholar] [CrossRef]
  21. Elnaggar, A.; El-Keblawy, A.; Mosa, K.A.; Navarro, T. Adaptive drought tolerance during germination of Salsola drummondii seeds from saline and nonsaline habitats of the arid Arabian deserts. Botany 2019, 97, 123–133. [Google Scholar] [CrossRef]
  22. Mohamed, E.; Kasem, A.; Gobouri, A.A.; Elkelish, A.; Azab, E. Influence of maternal habitat on salt tolerance during germination and growth in Zygophyllum coccineum. Plants 2020, 9, 1504. [Google Scholar] [CrossRef] [PubMed]
  23. Mira, S.; Veiga-Barbosa, L.; Gonzalez-Benito, M.E.; Perez-Garcia, F. Inter-population variation in germination characteristics of Plantago lanceolata seeds: Effects of temperature, osmotic stress and salinity. Mediterr. Bot. 2018, 39, 89–96. [Google Scholar] [CrossRef]
  24. Liu, J.B.; Yang, F.; Wang, Z.C.; Nie, Z.Y.; Zhang, L.; An, F.H.; Guo, L.L. Soil physical-chemical properties and plant biomass in relation tomicrotopography spatial variability in saline-sodic soil area. Soils Crops 2021, 10, 163–176. [Google Scholar]
  25. Joeckel, R.; Clement, B.A. Soils, surficial geology, and geomicrobiology of saline-sodic wetlands, North Platte River Valley, Nebraska, USA. Catena 2005, 61, 63–101. [Google Scholar] [CrossRef]
  26. Shang, C.; Wang, L.; Tian, C.; Song, J. Heavy metal tolerance and potential for remediation of heavy metal-contaminated saline soils for the euhalophyte Suaeda salsa. Plant Signal. Behav. 2020, 15, 1805902. [Google Scholar] [CrossRef]
  27. Liang, J.; Zhao, Z.; Liu, C.; Zuo, Z.; Jiang, L. Research progress on characteristics, utilization and development ofeuhalophyte suaeda salsa resources. Chin. Wild Plant Resour. 2022, 41, 30–37. [Google Scholar] [CrossRef]
  28. Li, H.; Wang, H.; Wen, W.; Yang, G. The antioxidant system in Suaeda salsa under salt stress. Plant Signal. Behav. 2020, 15, 1771939. [Google Scholar] [CrossRef]
  29. Zhang, H.; Hu, M.; Ma, H.; Jiang, L.; Zhao, Z.; Ma, J.; Wang, L. Differential responses of dimorphic seeds and seedlings to abiotic stresses in the halophyte Suaeda salsa. Front Plant Sci. 2021, 12, 630338. [Google Scholar] [CrossRef]
  30. Wang, L.; Wang, X.; Jiang, L.; Zhang, K.; Tanveer, M.; Tian, C.Y.; Zhao, Z.Y. Reclamation of saline soil by planting annual euhalophyte Suaeda salsa with drip irrigation: A three-year field experiment in arid northwestern China. Ecol. Eng. 2021, 159, 106090. [Google Scholar] [CrossRef]
  31. Wang, B.; Luttge, U.; Ratajczak, R. Effects of salt treatment and osmotic stress on V-ATPase and V-PPase in leaves of the halophyte Suaeda salsa. J. Exp. Bot. 2001, 52, 2355–2365. [Google Scholar] [CrossRef]
  32. Yang, M.F.; Song, J.; Wang, B.S. Organ-specific responses of vacuolar H-ATPase in the shoots and roots of C halophyte Suaeda salsa to NaCl. J. Integr. Plant Biol. 2010, 52, 308–314. [Google Scholar] [CrossRef] [PubMed]
  33. Song, J.; Wang, B. Using euhalophytes to understand salt tolerance and to develop saline agriculture: Suaeda salsa as a promising model. Ann. Bot. 2014, 115, 541–553. [Google Scholar] [CrossRef] [PubMed]
  34. Wang, Q.; Xiao, L.; Tang, X.Y.; Xu, Q.; Yi, H.P.; Tian, H.F. Effects of saline alkali stress and nitrogen supply on germination and seedling growth of Suaeda salsa. Acta Prataculturae Sin. 2015, 24, 216–222. [Google Scholar] [CrossRef]
  35. Wang, Q.; Luo, M.; Qiu, D.; Xie, T.; Shi, W.; Cui, B. Effect of hydrological characteristics on the recruitmentof Suaeda salsa in coastal salt marshes. J. Nat. Resour. 2019, 34, 2569–2579. [Google Scholar]
  36. Liu, X.H.; Li, M.; Xu, F. Effects of hydrological interference on Suaeda salsain different saline habitats. Shandong Agric. Sci. 2015, 47, 34–38. [Google Scholar] [CrossRef]
  37. Zhang, Y.S.; Yu, W.Y.; Ji, R.P.; Zhao, Y.J.; Feng, R.; Jia, Q.Y.; Wu, J.W. Dynamic response of phragmites australis and Suaeda salsa to climate change in the Liaohe Delta Wetland. J. Meteorol. Res. 2021, 35, 157–171. [Google Scholar] [CrossRef]
  38. Liu, Q.Q.; Yang, Y.; Zhang, X.X.; Liu, R.R.; Song, J. Chloride allocation in the euhalophyte Suaeda salsa from different habitats in field and controlled saline conditions. Aquat. Bot. 2020, 167, 103292. [Google Scholar] [CrossRef]
  39. Gao, R.R.; Wei, X.Y.; He, Z.; Zhao, R.H.; Wang, K.; Yang, X.J.; Walck, J.L. Soil salt and NaCl have different effects on seed germination of the halophyte Suaeda salsa. J. Plant Nutr. Soil Sci. 2018, 181, 488–497. [Google Scholar] [CrossRef]
  40. Yang, F.; Wang, Z.; Ma, H.; Yang, F.; Tian, C.; An, F. Research and integrated demonstration of ecological amelioration techniques ofsaline-sodic land in northeast China. Acta Ecol. Sin. 2016, 36, 7054–7058. [Google Scholar]
  41. Wang, Z.M.; Song, K.S.; Zhang, B.; Liu, D.W.; Ren, C.Y.; Luo, L.; Yang, T.; Huang, N.; Hu, L.; Yang, H.J.; et al. Shrinkage and fragmentation of grasslands in the West Songnen Plain, China. Agric. Ecosyst. Environ. 2009, 129, 315–324. [Google Scholar] [CrossRef]
  42. Yu, R.-P.; Chen, D.-M. Saline soil resources and their development and utilization in China. Chin. J. Soil Sci. 1999, 30, 3. [Google Scholar] [CrossRef]
  43. Zhang, L. Mechanism of Saline-Sodic Soil Reclamation by Saline Ice Irrigation and Meltwater Leaching in Songnen Plain. Ph.D. Thesis, University of Chinese Academy of Sciences (Northeast Institute of Geography and Agroecology, Chinese Academy of Sciences), Beijing, China, 2021. [Google Scholar]
  44. Yang, C.W.; Shi, D.C.; Wang, D.L. Comparative effects of salt and alkali stresses on growth, osmotic adjustment and ionic balance of an alkali-resistant halophyte Suaeda glauca (Bge.). Plant Growth Regul. 2008, 56, 179–190. [Google Scholar] [CrossRef]
  45. Yang, C.W.; Chong, J.N.; Li, C.Y.; Kim, C.M.; Shi, D.C.; Wang, D.L. Osmotic adjustment and ion balance traits of an alkali resistant halophyte Kochia sieversiana during adaptation to salt and alkali conditions. Plant Soil 2007, 294, 263–276. [Google Scholar] [CrossRef]
  46. Munns, R. Comparative physiology of salt and water stress. Plant Cell Env. 2002, 25, 239–250. [Google Scholar] [CrossRef]
  47. Hartung, W.; Leport, L.; Ratcliffe, R.G.; Sauter, A.; Duda, R.; Turner, N.C. Abscisic acid concentration, root pH and anatomy do not explain growth differences of chickpea (Cicer arietinum L.) and lupin (Lupinus angustifolius L.) on acid and alkaline soils. Plant Soil 2002, 240, 191–199. [Google Scholar] [CrossRef]
  48. Bhatt, A.; Batista-Silva, W.; Gallacher, D.J.; Pompelli, M.F. Germination of cenchrus ciliaris, pennisetum divisum, and panicum turgidum is seasonally dependent. Botany 2020, 98, 449–458. [Google Scholar] [CrossRef]
  49. Huang, Z.X.; Qiu, C.; Zeng, Z.J.; Zhi, S.; Zhang, Y.; Li, F. Research progress of disinfectant application in plant tissue culture. J. Neijtang Norm. Univ. 2013, 28, 5. [Google Scholar]
  50. Ma, H.Y.; Lv, B.S.; Li, X.W.; Liang, Z.W. Germination response to differing salinity levels for 18 grass species from the saline-alkaline grasslands of the Songnen Plain, China. Pak. J. Bot. 2014, 46, 1147–1152. [Google Scholar]
  51. Zhao, D.D.; Ma, H.Y.; Wang, L.; Li, S.Y.; Qi, W.W.; Ma, M.Y.; Xia, J.B. Effects of water and nitrogen addition on the seed yield and germination characteristics of the perennial grass Leymus chinensis (Trin.) Tzvel. Front. Environ. Sci. 2021, 9, 404. [Google Scholar] [CrossRef]
  52. Li, S.; Ma, H.; Ooi, M.K.J. Fire-related cues significantly promote seed germination of some salt-tolerant species from non-fire-prone saline-alkaline grasslands in Northeast China. Plants 2021, 10, 2675. [Google Scholar] [CrossRef]
  53. Fang, S.; Hou, X.; Liang, X. Response mechanisms of plants under saline-alkali stress. Front Plant Sci. 2021, 12, 667458. [Google Scholar] [CrossRef] [PubMed]
  54. Guo, R.; Shi, L.; Yan, C.; Zhong, X.; Gu, F.; Liu, Q.; Xia, X.; Li, H. Ionomic and metabolic responses to neutral salt or alkaline salt stresses in maize (Zea mays L.) seedlings. BMC Plant Biol. 2017, 17, 41. [Google Scholar] [CrossRef] [PubMed]
  55. Jacob, P.T.; Siddiqui, S.A.; Rathore, M.S. Seed germination, seedling growth and seedling development associated physiochemical changes in Salicornia brachiata (Roxb.) under salinity and osmotic stress. Aquat. Bot. 2020, 166, 103272. [Google Scholar] [CrossRef]
  56. El-Keblawy, A.; Elnaggar, A.; Tammam, A.; Mosa, K.A. Seed provenance affects salt tolerance and germination response of the habitat-indifferent Salsola drummondii halophyte in the arid Arabian deserts. Flora 2020, 266, 151592. [Google Scholar] [CrossRef]
  57. Li, R.; Shi, F.; Fukuda, K. Interactive effects of salt and alkali stresses on seed germination, germination recovery, and seedling growth of a halophyte Spartina alterniflora (Poaceae). S. Afr. J. Bot. 2010, 76, 380–387. [Google Scholar] [CrossRef]
  58. Wang, Y.Y.; Wang, S.Q.; Zhao, Z.Y.; Zhang, K.; Tian, C.Y.; Mai, W.X. Progress of euhalophyte adaptation to arid areas to remediate salinized soil. Agriculture 2023, 13, 704. [Google Scholar] [CrossRef]
  59. Yu, A.; Zhao, J.; Wang, Z.; Cheng, K.; Zhang, P.; Tian, G.; Liu, X.; Guo, E.; Du, Y.; Wang, Y. Transcriptome and metabolite analysis reveal the drought tolerance of foxtail millet significantly correlated with phenylpropanoids-related pathways during germination process under PEG stress. BMC Plant Biol. 2020, 20, 274. [Google Scholar] [CrossRef]
  60. Peng, B.; Xu, W.; Shao, R.; Feng, G.-N.; Shi, W.-Y. Growth of Suaeda salsatin response to salt stress in different habitats. Acta Prataculturae Sin. 2016, 25, 81–90. [Google Scholar] [CrossRef]
  61. Gya, R.; Geange, S.R.; Lynn, J.S.; Topper, J.P.; Wallevik, O.; Zernichow, C.; Vandvik, V. A test of local adaptation to drought in germination and seedling traits in populations of two alpine forbs across a 2000 mm/year precipitation gradient. Ecol. Evol. 2023, 13, e9772. [Google Scholar] [CrossRef]
  62. Wang, S.; Wang, W.; Wang, S.; Yang, L.; Gu, J. Intraspecific variations of anatomical, morphological and chemical traits in leaves and absorptive roots along climate and soil gradients: A case study with Ginkgo biloba and Eucommia Ulmoides. Plant Soil 2021, 469, 73–88. [Google Scholar] [CrossRef]
  63. Liu, R.; Wang, L.; Tanveer, M.; Song, J. Seed heteromorphism: An important adaptation of halophytes for habitat heterogeneity. Front Plant Sci. 2018, 9, 1515. [Google Scholar] [CrossRef] [PubMed]
Figure 1. A location map of the study area showing S1–S7 provenances in the Songnen Plain. Note: Baicheng, Qiqihar, Daqing, Songyuan, and Suihua are the names of the cities where the sampling points were located.
Biology 12 01343 g001
Figure 2. Mean (±SE; n = 4) percent seed germination of seven provenances in response to different NaCl concentrations. S1–S7 represent the seven provenances; (AG) NaCl concentrations (0–500 mM). Bars with different letters represent significant differences in seed germination among the treatments and provenances (p < 0.05, Tukey’s test).
Biology 12 01343 g002
Figure 3. Mean (±SE; n = 16) root length of seven provenances in response to different NaCl concentrations. S1–S7 represent the seven provenances; (AG) NaCl concentrations (0–500 mM). Bars with different letters represent significant differences in root length among the provenances (p < 0.05, Tukey’s test).
Biology 12 01343 g003
Figure 4. Mean (±SE; n = 16) shoot length of seven provenances in response to different NaCl concentrations. S1–S7 represent the seven provenances; (AG) NaCl concentrations (0–500 mM). Bars with different letters represent significant differences in shoot length among the provenances (p < 0.05, Tukey’s test).
Biology 12 01343 g004
Figure 5. Mean (±SE; n = 4) percent total germination of seven provenances in response to different NaCl concentrations. S1–S7 represent the seven provenances; (AG) NaCl concentrations (0–500 mM). Bars with different letters represent significant differences in total germination percentage among the provenances (p < 0.05, Tukey’s test).
Biology 12 01343 g005
Figure 6. Mean percent (±SE; n = 4) seed germination across seven provenances in response to different Na2CO3 concentrations. (AF) Na2CO3 concentrations (0–100 mM). Bars with different letters represent significant differences among the provenances (p < 0.05, Tukey’s test).
Biology 12 01343 g006
Figure 7. Mean root length (±SE; n = 16) of seven provenances in response to different Na2CO3 concentrations. S1–S7 represent the seven provenances; (AF) Na2CO3 concentrations (0–100 mM). Bars with different letters represent significant differences among the provenances (p < 0.05, Tukey’s test).
Biology 12 01343 g007
Figure 8. Mean shoot length (±SE; n = 16) of seven provenances in response to different Na2CO3 concentrations. S1–S7 represent the seven provenances; (AF) Na2CO3 concentration (0–100 mM). Bars with different letters represent significant differences among the provenances (p < 0.05, Tukey’s test).
Biology 12 01343 g008
Figure 9. Mean (±SE; n = 4) total germination percentage of seven provenances in response to different Na2CO3 concentrations. S1–S7 represent the seven provenances; (AF) Na2CO3 concentrations (0–100 mM). Bars with different letters represent significant differences among the provenances (p < 0.05, Tukey’s test).
Biology 12 01343 g009
Figure 10. Mean (±SE; n = 4) percent seed germination across seven provenances in response to different NaHCO3 concentrations. S1–S7 represent the seven provenances; (AE) NaHCO3 concentrations (0–150 mM). Bars with different letters represent significant differences in percent germination among the provenances (p < 0.05, Tukey’s test).
Biology 12 01343 g010
Figure 11. Mean root length (±SE; n = 16) of seven provenances in response to different NaHCO3 concentrations. S1–S7 represent the seven provenances; (AE) NaHCO3 concentrations (0–150 mM). Bars with different letters represent significant differences in root length among the provenances (p < 0.05, Tukey’s test).
Biology 12 01343 g011
Figure 12. Mean shoot length (SE; n = 16) of seven provenances in response to different NaHCO3 concentrations. S1–S7 represent the seven provenances, (AE) NaHCO3 concentrations (0–150 mM). Bars with different letters indicate significant differences in shoot length among the provenances (p < 0.05, Tukey’s test).
Biology 12 01343 g012
Figure 13. Mean (SE; n = 4) total percent seed germination of seven provenances in response to different NaHCO3 concentrations. S1–S7 represent the seven provenances; (AE) NaHCO3 concentrations (0–150 mM). Bars with different letters indicate significant differences in total seed germination among the provenances (p < 0.05, Tukey’s test).
Biology 12 01343 g013
Figure 14. Cluster analysis of the S1–S7 sites based on seed germination rates at different salinity levels. I, II, and III represent the three salt tolerance classifications.
Biology 12 01343 g014
Table 1. General features and environmental variables for S1–S7 provenances. Climate data were acquired from https://www.tianqi24.com/historycity/ (accessed on 8 August 2022).
ProvenanceLatitudeLongitudeMAT
(°C/year)
MAP
(mm/year)
pHEC
(mS/cm)
Na+
mmolc/L
Cl mmolc/LCO32−
mmolc/L
HCO3 mmolc/L
S146.50125.445535.3210.390.83016.631.050.6013.20
S245.58124.764924.0910.161.06517.184.504.004.60
S345.60123.856559.79.502.32021.3023.103.8015.20
S446.91124.3210338.0610.452.80025.3117.250.2023.20
S546.32124.959354.339.432.50023.2524.562.3010.23
S645.32123.596559.78.740.0872.230.900.104.80
S745.40123.696559.79.522.26019.3013.222.5023.60
Note: MAT = mean annual temperature; MAP = mean annual precipitation; EC = soil electric conductivity. pH, EC, and soil ion content data were obtained by measuring and analyzing 0–20 cm topsoil.
Table 2. Root salt tolerance index of S. salsa seedlings grown from seeds treated with different NaCl concentrations across the provenances. Each treatment had 16 biological replicates. Different lower-case letters indicate significant differences (p < 0.05, Tukey’s test) between treatments within the same provenance, while different upper-case letters indicate significant differences (p < 0.05, Tukey’s test) between provenances under the same NaCl concentration.
Concentration
(mM)
S1S2S3S4S5S6S7
0100 ± 0 Aab100 ± 0 Aa100 ± 0 Aab100 ± 0 Ab100 ± 0 Aa100 ± 0 Aa100 ± 0 Aac
50112.3 ± 7.1 Aa89.3 ± 1.9 Aa93.3 ± 3.6 Ab107.8 ± 3.2 Aab87.3 ± 1.7 Aab42.2 ± 7.4 Bb103.5 ± 9.8 Aa
100113.7 ± 8.9 Aa83.3 ± 2.5 BCa106.7 ± 2.7 ABa126.5 ± 7.2 Aa102 ± 2.6 ABa58.9 ± 11 Cb100.7 ± 6.9 ABab
20087.6 ± 1.4 Aab58.2 ± 8.6 Bb74.7 ± 3.6 ABc65.9 ± 4.3 ABc70.1 ± 2.8 ABbc62.1 ± 4.2 Bb76.4 ± 4.8 ABbd
30076.3 ± 4.9 Abc43.6 ± 2.6 Cb51.1 ± 2.1 BCd49.7 ± 2.4 BCc79.5 ± 4.7 Ab49.2 ± 0.8 BCb62.7 ± 6.2 ABde
40050 ± 16.7 Ac41.1 ± 4 ABb39.1 ± 3.6 ABd22.3 ± 4.3 Bd43.1 ± 4.4 ABd33.4 ± 0.5 ABb40.9 ± 1.8 ABe
5000 ± 0 Cd0 ± 0 Cc36.6 ± 0.5 Bd46.7 ± 10.2 Bc57.5 ± 8.4 ABcd0 ± 0 Cc74.7 ± 2.3 Acd
Table 3. Shoot salt tolerance index of S. salsa seedlings grown from seeds treated with different NaCl concentrations. Each treatment had 16 biological replicates. Different lower-case letters indicate significant differences (p < 0.05, Tukey’s test) between treatments within the same provenance, while different upper-case letters indicate significant differences (p < 0.05, Tukey’s test) between provenances under the same NaCl concentration.
Concentration
(mM)
S1S2S3S4S5S6S7
0100 ± 0 Ab100 ± 0 Aab100 ± 0 Aa100 ± 0 Abc100 ± 0 Aa100 ± 0 Aab100 ± 0 Ac
50126.7 ± 9 Bab119.9 ± 1.4 Ba107.6 ± 2.1 Ba118.1 ± 3.2 Bab107.2 ± 2.8 Ba115.7 ± 12.7 Ba165.5 ± 6.7 Aa
100135.2 ± 12.4 Aa113.4 ± 7.5 Aa109.5 ± 2.8 Aa129 ± 6.7 Aa105.9 ± 3 Aa102.6 ± 19.9 Aab140.8 ± 7.9 Aab
200107.2 ± 5.5 Bab109.2 ± 6.2 Ba106.8 ± 2.4 Ba105.3 ± 2.2 Bbc111.6 ± 1.5 Ba73.4 ± 11.2 Cab136.8 ± 7.8 Ab
300105 ± 8.1 Bab82 ± 4.9 BCbc86.4 ± 3.5 BCb86.7 ± 1.7 BCcd68.6 ± 2.8 CDb50 ± 16.7 Dbc145.6 ± 4.8 Aab
40048.2 ± 10.9 ABc66.6 ± 4.5 ABc78.8 ± 1.6 ABb50.2 ± 7.3 Ae64.3 ± 12.3 ABb54.3 ± 0.5 ABbc86.9 ± 4 Bc
5000 ± 0 Cd0 ± 0 Cd49.5 ± 0.5 Bc66.2 ± 6.9 Bde92.7 ± 2.6 Aa0 ± 0 Cc99.6 ± 6.4 Ac
Table 4. Percent germination recovery of S. salsa seeds in non-saline germination medium after NaCl pretreatment. Each treatment had four biological replicates. Different lower-case letters indicate significant differences (p < 0.05, Tukey’s test) between treatments within the same provenance, while different upper-case letters indicate significant differences (p < 0.05, Tukey’s test) between provenances under the same NaCl concentration.
Concentration
(mM)
S1S2S3S4S5S6S7
00 ± 0 Abc0 ± 0 Aab0 ± 0 Aab0 ± 0 Abc0 ± 0 Aa0 ± 0 Aa0 ± 0 Aab
500 ± 0 Bbc3.3 ± 3.3 Ab0 ± 0 Bab0 ± 0 Bbc0 ± 0 Ba0 ± 0 Ba0 ± 0 Bab
1007.8 ± 4.5 Ab10.3 ± 2.4 Aab7.5 ± 4.4 Aa25 ± 10.4 Aab0 ± 0 Ba1.5 ± 1.5 Ba8.5 ± 3.5 Aa
20016.5 ± 3 Aab12.5 ± 4.3 Aab20 ± 4.3 Aa9.5 ± 5.5 Ab7.3 ± 7.3 Aa0 ± 0 Aa18.3 ± 1.3 Aab
30035.8 ± 5.8 Bbc8.5 ± 3.9 Cb35.8 ± 4.3 Bab61.3 ± 12.3 Ac0 ± 0 Ca5.5 ± 2.2 Ca28.8 ± 5.9 Bab
40040.5 ± 3.9 ACc27.3 ± 0.9 BCa50 ± 6.4 ABb59.8 ± 5.6 Ac10.5 ± 4.5 Ca0 ± 0 Da39.8 ± 7.1 ACb
50038 ± 3.8 Bac14 ± 6.8 Bab52.5 ± 4 Ab45.8 ± 4.3 Aac7 ± 2.7 Ba2 ± 1.2 Ba35.3 ± 1.7 Ab
Table 5. Effects of NaCl, provenance, and their interactions on S. salsa seed germination and seedling growth.
ProvenanceNaClProvenance × NaCl
Germination d.f6636
χ21496.38311.11158.97
p<0.001<0.001<0.001
Total germinationd.f.6636
χ2280.521020.26167.26
p<0.001<0.001<0.001
Root lengthd.f.6629
F33.3869.722.25
p<0.001<0.001<0.001
Shoot length d.f.6629
F58.3936.253.25
p<0.001<0.001<0.001
Recovery germination percentaged.f.6636
χ2473.92180.19117.76
p<0.001<0.0010.004
Table 6. Percent relative germination of S. salsa seeds after treatment with different NaCl concentrations. Each treatment had four biological replicates. Different lower-case letters indicate significant differences (p < 0.05, Tukey’s test) between treatments within the same provenance, while different upper-case letters indicate significant differences (p < 0.05, Tukey’s test) between provenances under the same NaCl concentration.
Concentration
(mM)
S1S2S3S4S5S6S7
0100 ± 0 Aab100 ± 0 Aab100 ± 0 Aa100 ± 0 Aa100 ± 0 Aa100 ± 0 Aa100 ± 0 Aa
50107.3 ± 4.3 ABa128.1 ± 19.2 Aa97 ± 4 ABab83.6 ± 1.8 Bbc94.1 ± 2.1 ABa86.1 ± 7 Ba95.4 ± 4.3 ABa
100105.5 ± 4.5 ABab116.7 ± 11.3 Aab86.5 ± 1.6 Bb90.1 ± 2 Bab101.1 ± 1.1 ABa86.1 ± 8.3 Ba84.6 ± 1 Bab
20091.3 ± 3.7 Bb118.8 ± 7.1 Aa86.3 ± 2.2 BCb73.4 ± 3.3 Cc98 ± 3 Ba36.7 ± 1.9 Db71.7 ± 2.5 Cbc
30075.5 ± 2.7 c91.7 ± 13.2 Aab70.4 ± 3.1 Ac76.1 ± 6.8 Abc67.4 ± 3.6 Ab33.9 ± 4.2 Bb75.7 ± 4.7 Abc
40064.8 ± 2.6 Bcd149 ± 18.7 Aa71.8 ± 4.8 Bc70.1 ± 3.3 Bc70.2 ± 3 Bb4.2 ± 2.5 Cc72.7 ± 5.5 Bbc
50057.3 ± 3.5 Ad50 ± 21.5 Ab67.5 ± 1.5 Ac52.6 ± 3.3 Ad38.6 ± 5.2 ABc4.2 ± 2.5 Bc63.1 ± 2.8 Ac
Table 7. Relative percent germination of S. salsa after treatment with different concentrations of Na2CO3. Each treatment had four biological replicates. Different lower-case letters indicate significant differences (p < 0.05, Tukey’s test) between treatments within the same provenance, while different upper-case letters indicate significant differences (p < 0.05, Tukey’s test) between provenances under the same Na2CO3 concentration.
Concentration
(mM)
S1S2S3S4S5S6S7
0100 ± 0 Aa100 ± 0 Aa100 ± 0 Aa100 ± 0 Aa100 ± 0 Aa100 ± 0 Aa100 ± 0 Aa
578.7 ± 5.8 ABbc104.2 ± 4.2 Aa45 ± 1.8 CDb57.3 ± 9.9 BDb32.7 ± 3.4 Db62.5 ± 7 BCb61.3 ± 6.4 BCb
12.593.7 ± 2.6 Aab82.3 ± 7.7 Aab28 ± 5.3 Cb37.4 ± 8.5 BCbc38 ± 1.9 BCb48.9 ± 3.7 BCbc52 ± 2 Bb
2586.6 ± 2.6 Aac57.3 ± 4.3 Bb46.1 ± 8.2 BCb45.7 ± 3.6 BCbc22.5 ± 5.6 Cb49.7 ± 3.7 BCbc45.4 ± 10.7 BCb
5077.1 ± 4.4 Ac65.6 ± 6.9 ABb32.3 ± 1.5 CDb25.9 ± 5.7 Dc26.6 ± 8.8 Db56.7 ± 7.9 ACb38.8 ± 7 BDb
10074.1 ± 1.4 Ac71.9 ± 8.6 Ab47.6 ± 6.9 ABb26.7 ± 6.5 Bc29.3 ± 2 Bb26.4 ± 10.5 Bc42.9 ± 9.7 ABb
Table 8. Root stress tolerance index in S. salsa seedlings grown from seeds treated with different Na2CO3 concentrations. Each treatment had 16 biological replicates. Different lower-case letters indicate significant differences (p < 0.05, Tukey’s test) between treatments within the provenance, while different upper-case letters indicate significant differences (p < 0.05, Tukey’s test) between provenances within Na2CO3 concentration.
Concentration
(mM)
S1S2S3S4S5S6S7
0100 ± 0 Ad100 ± 0 Ad100 ± 0 Ac100 ± 0 Ab100 ± 0 Ad100 ± 0 Ab100 ± 0 Ab
5346 ± 15 Aa312.7 ± 13.4 ABa193.2 ± 9.2 Cab238.4 ± 7.3 BCa194.4 ± 4 Ca260.4 ± 41 BCa220.6 ± 10.3 Ca
12.5291 ± 16.4 Ab278.4 ± 8.4 ABa208.3 ± 8.3 BDa260.3 ± 21.7 ACa197.1 ± 3.3 CDa136.4 ± 23.3 Db223.7 ± 19.3 aC
25263.1 ± 15.4 Ab233.1 ± 8.6 ABb173.1 ± 8.4 CDb230.9 ± 9.8 ACa161.6 ± 3.5 Db133 ± 23.5 Db185.5 ± 11.6 BDa
50160 ± 3.3 Ac151.7 ± 5.6 ABc115.9 ± 2.3 BCc129.4 ± 8 ACb115.5 ± 3.3 BDc77.7 ± 14.8 Db99.4 ± 11.9 CDb
10065.3 ± 2.3 ABd73.3 ± 1.8 Ad45.1 ± 2.4 Cd48.9 ± 2.6 BCc64 ± 1.3 ACe54.9 ± 9.2 ACb47.1 ± 5.1 BCc
Table 9. Shoot stress tolerance index of S. salsa seedlings grown from seeds treated with different Na2CO3 concentrations. Each treatment had 16 biological replicates. Different lower-case letters indicate significant differences (p < 0.05, Tukey’s test) between treatments within the same provenance, while different upper-case letters indicate significant differences (p < 0.05, Tukey’s test) between provenances under the same Na2CO3 concentration.
Concentration
(mM)
S1S2S3S4S5S6S7
0100 ± 0 Ab100 ± 0 Ac100 ± 0 Ac100 ± 0 Ab100 ± 0 Ab100 ± 0 Aa100 ± 0 Ab
5104.9 ± 7.4 Cab147.5 ± 4.1 Ab114.3 ± 2.7 ACab106.3 ± 2.6 BCb107.7 ± 4 BCb138.6 ± 16 ABa141.2 ± 2.8 Aa
12.5115.5 ± 8.2 Bab173.7 ± 2.9 Aa120.6 ± 3 Ba120.4 ± 3 Ba115.4 ± 6.6 Bb136.6 ± 19 ABa146.8 ± 10.3 ABa
25114.9 ± 5.7 BCab175.8 ± 3.7 Aa105.3 ± 3.1 Cbc121.2 ± 3.8 BCa116.3 ± 3 BCb109.2 ± 10.5 Ca141.5 ± 7.5 Ba
50132.7 ± 6.8 BCa179.4 ± 0.9 Aa116 ± 0.7 BCa125.4 ± 2.9 BCa136.9 ± 3.4 BCa106.2 ± 14.8 Ca146.1 ± 10.9 ABa
100130.8 ± 9.3 Bab171.2 ± 4.6 Aa116.9 ± 2.7 BCa125.7 ± 1.5 Ba137.7 ± 3.8 Ba89.4 ± 12.8 Ca143.3 ± 7.3 ABa
Table 10. Effects of Na2CO3, provenance, and their interactions on S. salsa seed germination and seedling growth.
ProvenanceNa2CO3Provenance × Na2CO3
Germinationd.f6530
χ2736.86319.25176.57
p<0.001<0.001<0.001
Total germinationd.f.6530
χ2628.113416.47187.63
p<0.001<0.001<0.001
Root lengthd.f.6530
F192.18447.4211.31
p<0.001<0.001<0.001
Shoot lengthd.f.6530
F181.0432.363.66
p<0.001<0.001<0.001
Recovery germination percentage d.f.6530
χ2193.25142.393.36
p<0.001<0.0010.016
Table 11. Percent germination recovery in S. salsa seeds in non-saline germination medium after Na2CO3 pretreatment. Each treatment had four biological replicates. Different lower-case letters indicate significant differences (p < 0.05, Tukey’s test) between treatments within the same provenance, while different upper-case letters indicate significant differences (p < 0.05, Tukey’s test) between provenances under the same Na2CO3 concentration.
Concentration
(mM)
S1S2S3S4S5S6S7
00 ± 0 Aa0 ± 0 Aa0 ± 0 Aab0 ± 0 Ab0 ± 0 Aa0 ± 0 Aa0 ± 0 Ab
53.5 ± 2 Ba0 ± 0 Ba4.8 ± 3.1 Bb24.3 ± 6 Aa6.8 ± 1.4 Ba0 ± 0 Ba25.3 ± 3.9 Aa
12.53.3 ± 3.3 Aa0 ± 0 Aa1.3 ± 1.3 Ab2 ± 2 Ab5 ± 3.3 Aa0 ± 0 Aa17 ± 2.5 Aa
256.8 ± 2.3 Aa0 ± 0 Aa8.5 ± 4.4 Ab7.3 ± 5.2 Ab1.3 ± 1.3 Aa0 ± 0 Aa18 ± 8.2 Aa
502 ± 2 Aa0 ± 0 Aa6.3 ± 0.9 Ab5.5 ± 2.5 Ab0 ± 0 Aa0 ± 0 Aa13.8 ± 3 Aa
1005.8 ± 1.9 Ba1.3 ± 1.3 Ba30.3 ± 6.8 Aa7.5 ± 3 Bb6.3 ± 2.4 Ba0 ± 0 ABa19.5 ± 4.4 ABa
Table 12. Effects of NaHCO3, provenance, and their interactions on S. salsa seed germination and seedling growth.
ProvenanceNaHCO3Provenance × NaHCO3
Germinationd.f6424
χ2676.09273.27112.49
p<0.001<0.001<0.001
Total germinationd.f.6424
χ2534.47253.52111.55
p<0.001<0.001<0.001
Root lengthd.f.6424
F204.4262.897.76
p<0.001<0.001<0.001
Shoot lengthd.f.6424
F129.5546.225.1
p<0.001<0.001<0.001
Recovery germination percentaged.f.6424
χ2141.9990.5461.19
p<0.001<0.0010.207
Table 13. Root stress tolerance index in S. salsa seedlings grown from seeds treated with different NaHCO3 concentrations. Each treatment had 16 biological replicates. Different lower-case letters indicate significant differences (p < 0.05, Tukey’s test) across treatments within the same provenance, while different upper-case letters indicate significant differences (p < 0.05, Tukey’s test) between provenances under the same NaHCO3 concentration.
Concentration
(mM)
S1S2S3S4S5S6S7
0100 ± 0 Ac100 ± 0 Ad100 ± 0 Ac100 ± 0 Ac100 ± 0 Ac100 ± 0 Aa100 ± 0 Ac
25296.6 ± 19.8 Aa285 ± 2.5 Aa226.9 ± 8.1 ABa244.2 ± 20.4 ABa195.3 ± 3.5 BCa124.6 ± 24 Ca240.3 ± 16 ABa
50287.5 ± 4.4 Aa237.7 ± 3.6 ABb202.3 ± 10.9 BCa218.3 ± 10.4 BCa181.1 ± 6.1 Ca115.2 ± 19.8 Da197.8 ± 11.9 BCab
100188.1 ± 7.2 Ab161 ± 5.7 ABc141.5 ± 6.5 Bb154.8 ± 9.2 ABb135.7 ± 2.1 Bb71.3 ± 9.3 Ca146.6 ± 12.6 Bbc
150188.1 ± 7.2 Ab161 ± 5.7 ABc141.5 ± 6.5 Bb154.8 ± 9.2 ABb135.7 ± 2.1 Bb71.3 ± 9.3 Ca146.6 ± 12.6 Bbc
Table 14. Shoot stress tolerance index in S. salsa seedlings grown from seeds treated with different NaHCO3 concentrations. Each treatment had 16 biological replicates. Different lower-case letters indicate significant differences (p < 0.05, Tukey’s test) among different NaHCO3 concentrations within the same provenance, while different upper-case letters indicate significant differences (p < 0.05, Tukey’s test) between provenances under the same NaHCO3 concentration.
Concentration
(mM)
S1S2S3S4S5S6S7
0100 ± 0 Ab100 ± 0 Ab100 ± 0 Ab100 ± 0 Ab100 ± 0 Ab100 ± 0 Aa100 ± 0 Ab
25117.6 ± 8.8 BCab179.3 ± 5.4 Aa121.1 ± 3.3 BCa104.1 ± 1.3 Cab106.1 ± 8.2 Cb116.8 ± 16.9 BCa153.5 ± 6.4 ABa
50127.6 ± 5.9 BCa177.3 ± 4.4 Aa122.4 ± 3.1 BCa102.7 ± 3.6 Cab120.1 ± 5.8 Cb139.1 ± 22.3 ACa166.3 ± 6.9 ABa
100134.6 ± 6.1 BCa182.6 ± 7.4 Aa123.7 ± 5.7 BCa116.6 ± 4.5 Ca153.8 ± 4.9 ABa126.7 ± 15.2 BCa148.4 ± 7.1 ACa
150134.6 ± 6.1 BCa182.6 ± 7.4 Aa123.7 ± 5.7 BCa116.6 ± 4.5 Aa153.8 ± 4.9 ABa126.7 ± 15.2 BCa148.4 ± 7.1 ACa
Table 15. Percent germination recovery of S. salsa in non-saline germination medium after NaHCO3 pretreatment. There were four biological replicates in each treatment. Different lower-case letters indicate significant differences (p < 0.05, Tukey’s test) in germination recovery among NaHCO3 treatments within the same provenance, while different upper-case letters indicate significant differences (p < 0.05, Tukey’s test) between provenances under the same NaHCO3 concentration.
Concentration
(mM)
S1S2S3S4S5S6S7
00 ± 0 Aa0 ± 0 Aa0 ± 0 Aa0 ± 0 Aa0 ± 0 Aa0 ± 0 Aa0 ± 0 Aab
255 ± 2.9 Aa0 ± 0 Aa7 ± 2.6 Aa2.8 ± 2.8 Aa5.3 ± 2.1 Aa0 ± 0 Aa14.3 ± 4 Aa
507.5 ± 4.8 Ba0 ± 0 ABa5.3 ± 2.1 Ba8.3 ± 2.6 Ba13.5 ± 1.8 Ba0 ± 0 ABa40.5 ± 4.3 Ab
1002.5 ± 2.5 Ba0 ± 0 Ba7.8 ± 3.7 Ba5.3 ± 2.1 Ba2.3 ± 1.3 Ba0 ± 0 Ba39.3 ± 3.6 Ab
1507.8 ± 2.9 Ba2.3 ± 1.3 Ba12.5 ± 1.7 Ba14.5 ± 3.7 ABa1.3 ± 1.3 Ba0 ± 0 Ba34.3 ± 6.9 Ab
Table 16. Relative percent germination of S. salsa seeds after treatment with different NaHCO3 concentrations. Each treatment had four biological replicates. Different lower-case letters indicate significant differences (p < 0.05, Tukey’s test) across treatments within the same provenance, while different upper-case letters indicate significant differences (p < 0.05, Tukey’s test) between provenances under the same NaHCO3 concentration.
Concentration
(mM)
S1S2S3S4S5S6S7
0100 ± 0 Aa100 ± 0 Aab100 ± 0 Aa100 ± 0 Aa100 ± 0 Aa100 ± 0 Aa100 ± 0 Aa
2584.6 ± 4 Ac103.1 ± 7.9 Aa41.2 ± 0.8 Bb37.3 ± 0.9 Bb30 ± 4.5 Bb26.9 ± 5.3 Bd43.1 ± 6.5 Bc
5096.8 ± 1.9 Aab59.4 ± 19.9 ACb39.1 ± 4.9 Cb38.3 ± 1.4 Cb41.9 ± 0.6 Cb53.3 ± 7.2 BCbc81.3 ± 4.5 ABab
10093.6 ± 3 Aac70.8 ± 2.4 Bab21.8 ± 4.9 Cc26.1 ± 4 Cc27.1 ± 6.5 Cb35 ± 4.8 Ccd74.5 ± 3.7 ABb
15086.8 ± 2.3 Abc74 ± 4.9 ABab28.5 ± 1.7 Cbc34.9 ± 2.8 Cbc23.4 ± 6.5 Cb62.5 ± 7 ABb59.9 ± 8.2 Bbc
Disclaimer/Publisher’s Note: The statements, opinions and data contained in all publications are solely those of the individual author(s) and contributor(s) and not of MDPI and/or the editor(s). MDPI and/or the editor(s) disclaim responsibility for any injury to people or property resulting from any ideas, methods, instructions or products referred to in the content.

