
Intelligent Epileptic Seizure Detection and Classification Model Using Optimal Deep Canonical Sparse Autoencoder

 ,
,
Abstract
:Simple Summary
Abstract
1. Introduction
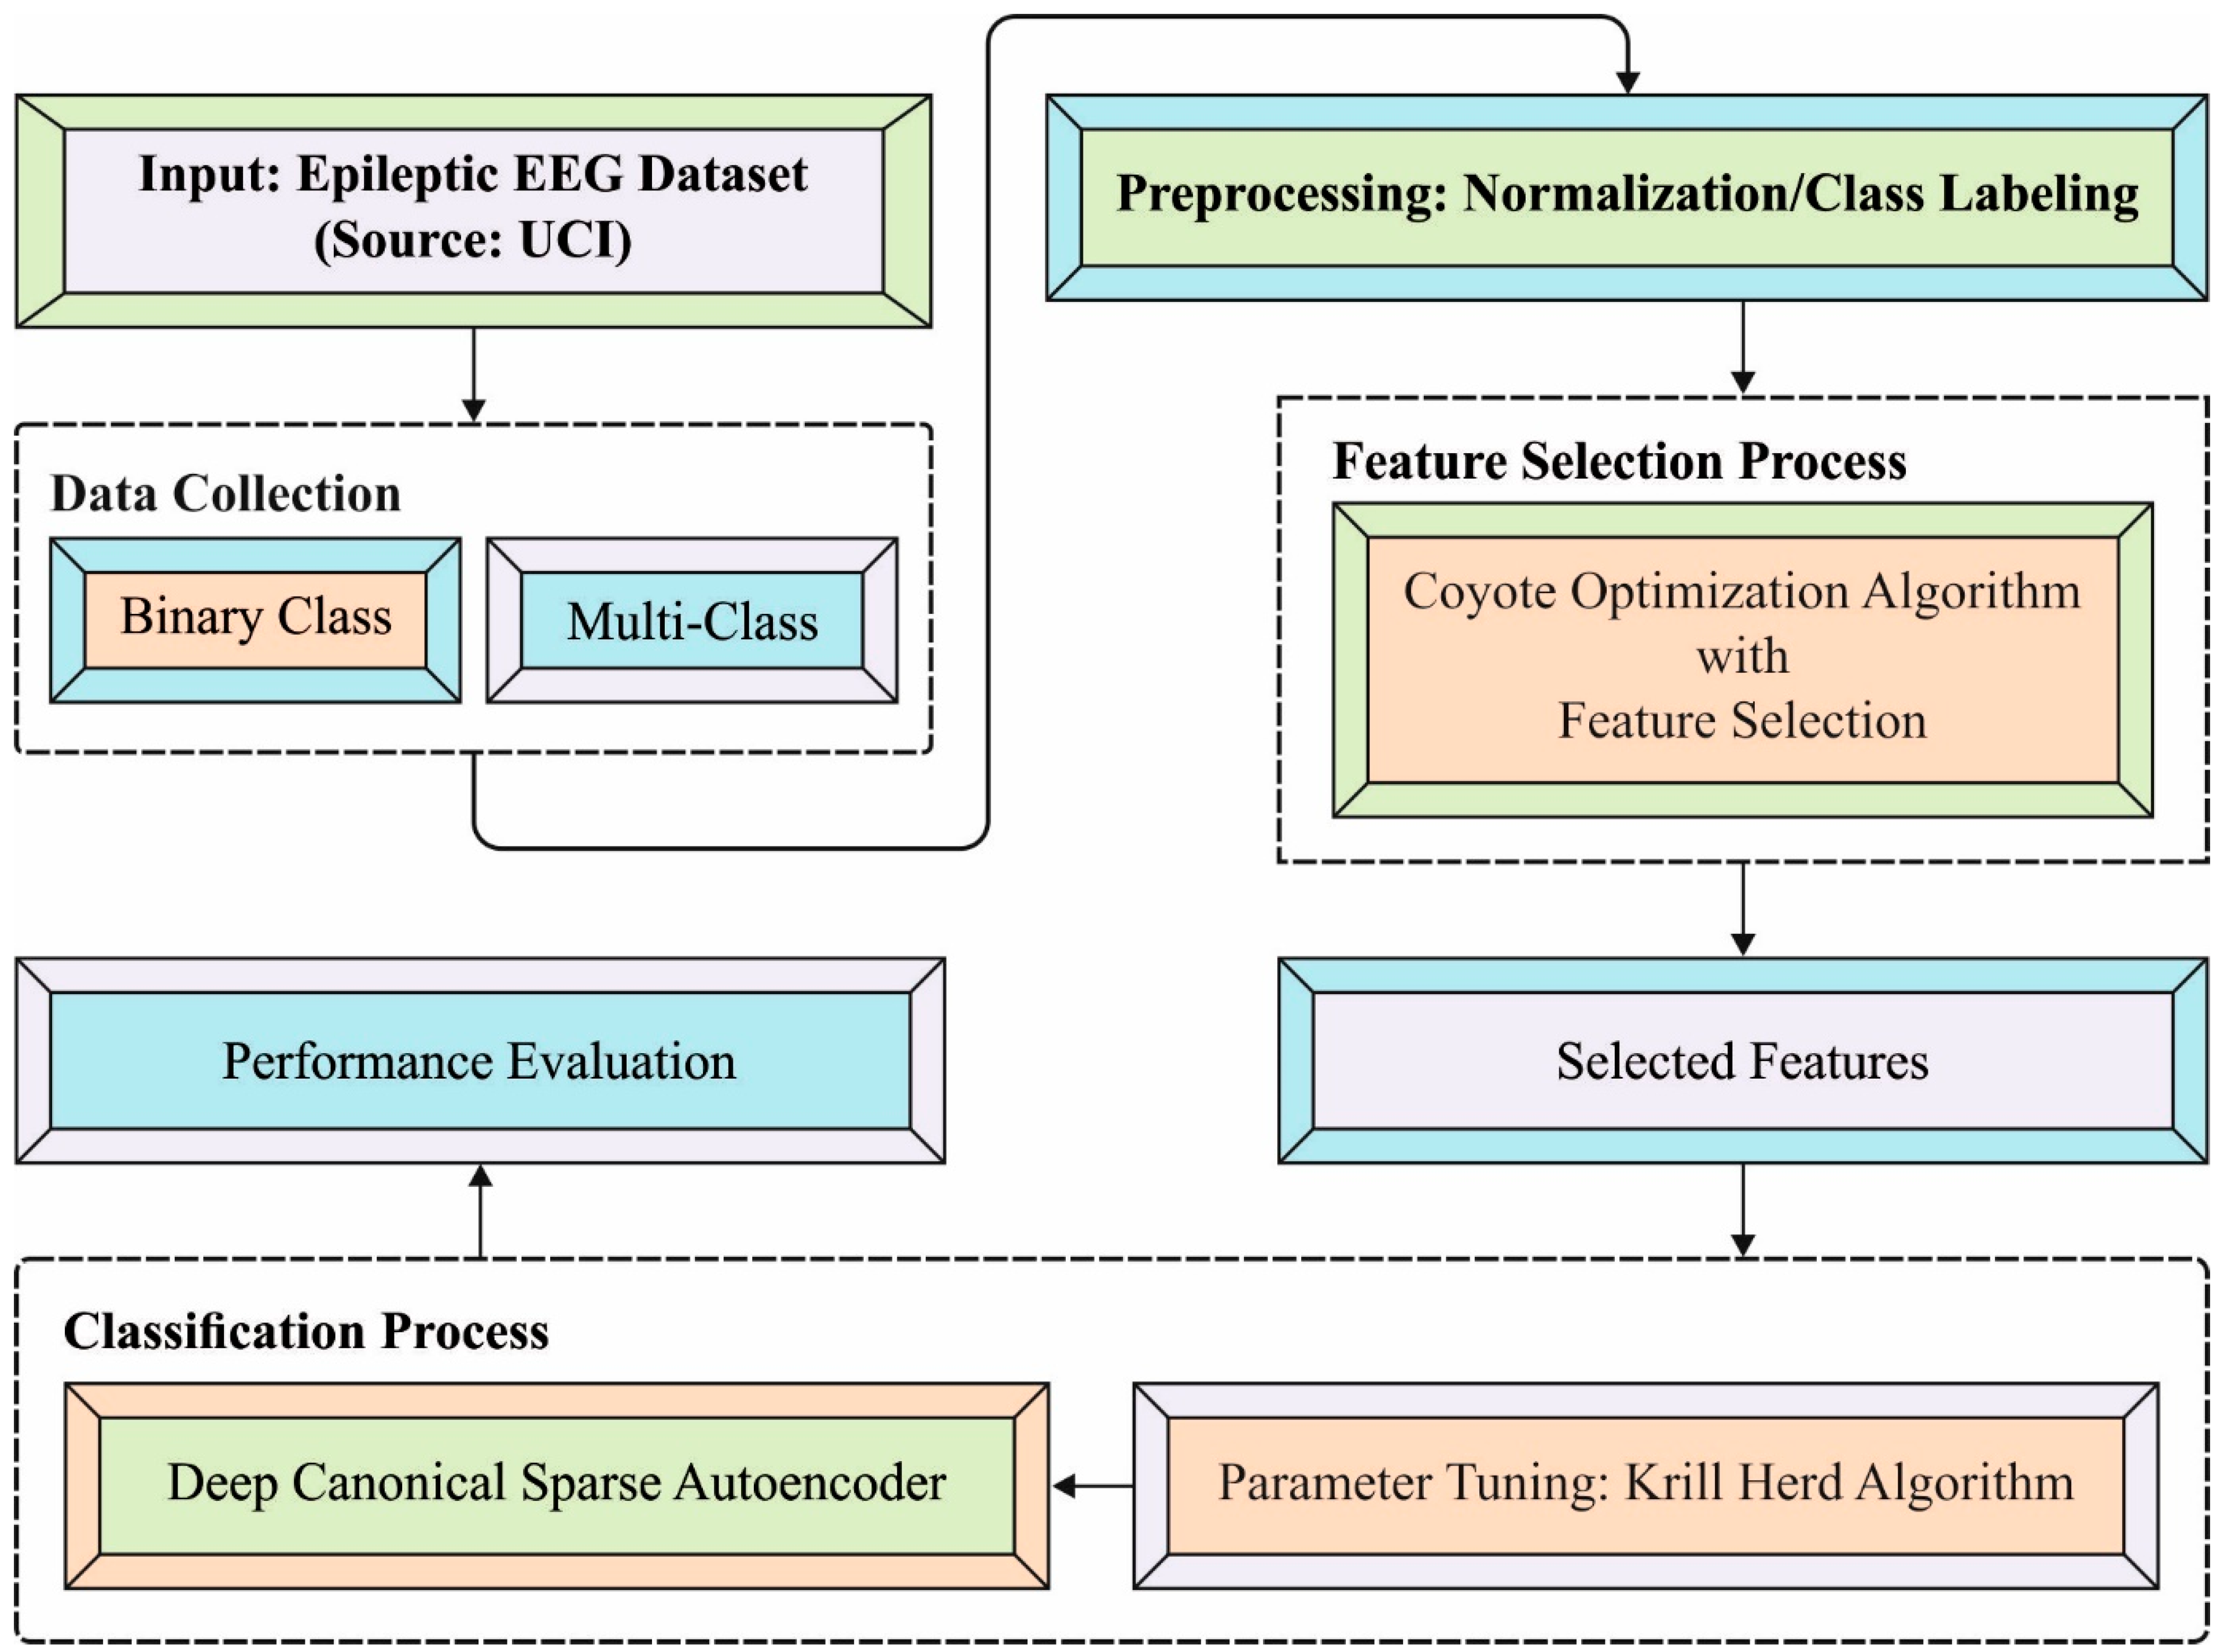
2. The Proposed Model
2.1. Data Pre-Processing
2.2. Process Involved in the COA-Based Feature Selection Technique
2.3. Process Involved in DCSAE-Based Classification
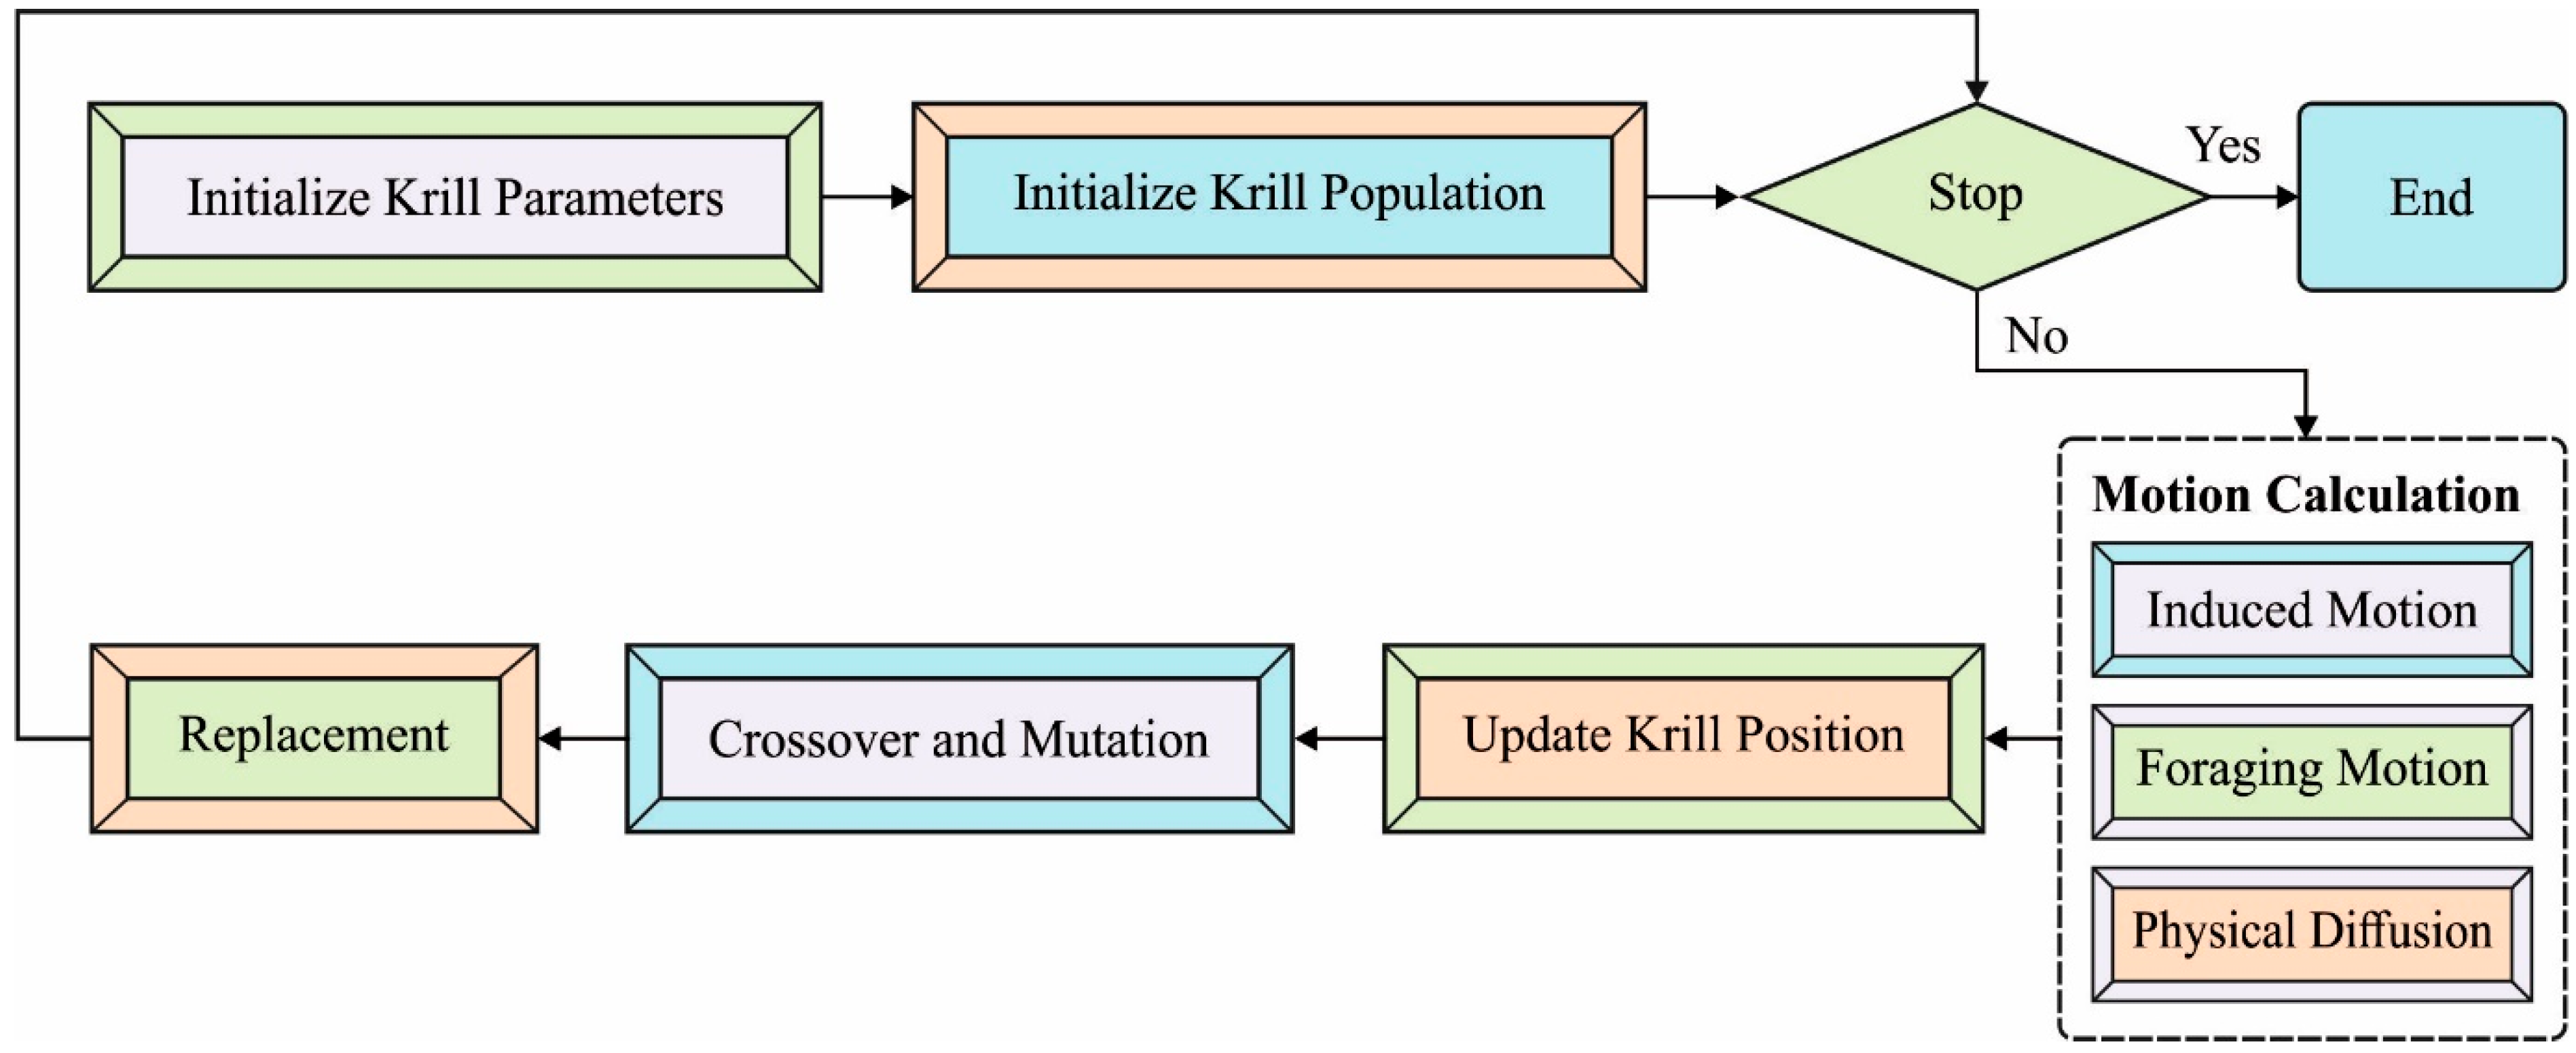
2.4. Parameter Tuning Using KHA
- i.
- An effort made by another krill individual;
- ii.
- Foraging motion;
- iii.
- Physical or random diffusion.
3. Results and Discussion
3.1. Implementation Data
3.2. Result Analysis
3.3. Discussion
4. Conclusions
Author Contributions
Funding
Institutional Review Board Statement
Informed Consent Statement
Data Availability Statement
Conflicts of Interest
References
- Zhou, M.; Tian, C.; Cao, R.; Wang, B.; Niu, Y.; Hu, T.; Guo, H.; Xiang, J. Epileptic seizure detection based on EEG signals and CNN. Front. Neuroinform. 2018, 12, 95. [Google Scholar] [CrossRef] [PubMed]
- Neamțu, B.M.; Visa, G.; Maniu, I.; Ognean, M.L.; Pérez-Elvira, R.; Dragomir, A.; Agudo, M.; Șofariu, C.R.; Gheonea, M.; Pitic, A.; et al. A decision-tree approach to assist in forecasting the outcomes of the neonatal brain injury. Int. J. Environ. Res. Public Health 2021, 18, 4807. [Google Scholar] [CrossRef] [PubMed]
- Abou-Abbas, L.; Jemal, I.; Henni, K.; Ouakrim, Y.; Mitiche, A.; Mezghani, N. EEG Oscillatory Power and Complexity for Epileptic Seizure Detection. Appl. Sci. 2022, 12, 4181. [Google Scholar] [CrossRef]
- Qureshi, S.A.; Raza, S.E.A.; Hussain, L.; Malibari, A.A.; Nour, M.K.; Rehman, A.U.; Al-Wesabi, F.N.; Hilal, A.M. Intelligent Ultra-Light Deep Learning Model for Multi-Class Brain Tumor Detection. Appl. Sci. 2022, 12, 3715. [Google Scholar] [CrossRef]
- Malibari, A.A.; Alshahrani, R.; Al-Wesabi, F.N.; Haj Hassine, S.B.; Alkhonaini, M.A.; Hilal, A.M. Artificial intelligence based prostate cancer classification model using biomedical images. Comput. Mater. Contin. 2022, 72, 3799–3813. [Google Scholar] [CrossRef]
- Poonia, R.C.; Gupta, M.K.; Abunadi, I.; Albraikan, A.A.; Al-Wesabi, F.N.; Hamza, M.A. Intelligent Diagnostic Prediction and Classification Models for Detection of Kidney Disease. Healthcare 2022, 10, 371. [Google Scholar] [CrossRef] [PubMed]
- Al Duhayyim, M.; Mesfer Alshahrani, H.; Al-Wesabi, F.N.; Abdullah, M.; Al-Hagery, M.A.; Hilal, A.M. Intelligent machine learning based EEG signal classification model. Comput. Mater. Contin. 2022, 71, 1821–1835. [Google Scholar]
- Areej, A.; Al-Wesabi, F.; Marwa, O.; Mimouna, A.; Manar, A.; Abdelwahed, M.; Ishfaq, Y.; Abu Sarwar, Z. Arithmetic Optimization with RetinaNet Model for Motor Imagery Classification on Brain Computer Interface. J. Healthc. Eng. 2022, 2022, 3987494. [Google Scholar]
- Borowska, M. Multiscale Permutation Lempel–Ziv Complexity Measure for Biomedical Signal Analysis: Interpretation and Application to Focal EEG Signals. Entropy 2021, 23, 832. [Google Scholar] [CrossRef]
- Ghosh-Dastidar, S.; Adeli, H.; Dadmehr, N. Mixed-band wavelet-chaos-neural network methodology for epilepsy and epileptic seizure detection. IEEE Trans. Biomed. Eng. 2007, 54, 1545–1551. [Google Scholar] [CrossRef]
- Parvez, M.Z.; Paul, M. Epileptic seizure detection by analyzing EEG signals using different transformation techniques. Neurocomputing 2014, 145, 190–200. [Google Scholar] [CrossRef]
- Niknazar, M.; Mousavi, S.R.; Vahdat, B.V.; Sayyah, M. A new framework based on recurrence quantification analysis for epileptic seizure detection. IEEE J. Biomed. Health Inform. 2013, 17, 572–578. [Google Scholar] [CrossRef]
- Boonyakitanont, P.; Lek-Uthai, A.; Chomtho, K.; Songsiri, J. A review of feature extraction and performance evaluation in epileptic seizure detection using EEG. Biomed. Signal Process. Control. 2020, 57, 101702. [Google Scholar] [CrossRef]
- Wang, L.; Xue, W.; Li, Y.; Luo, M.; Huang, J.; Cui, W.; Huang, C. Automatic epileptic seizure detection in EEG signals using multi-domain feature extraction and nonlinear analysis. Entropy 2017, 19, 222. [Google Scholar] [CrossRef]
- Mursalin, M.; Zhang, Y.; Chen, Y.; Chawla, N.V. Automated epileptic seizure detection using improved correlation-based feature selection with random forest classifier. Neurocomputing 2017, 241, 204–214. [Google Scholar] [CrossRef]
- Hamza, M.A.; Hassine, S.B.H.; Abunadi, I.; Al-Wesabi, F.N.; Alsolai, H.; Hilal, A.M.; Motwakel, A. Feature selection with optimal stacked sparse autoencoder for data mining. Comput. Mater. Contin. 2022, 72, 2581–2596. [Google Scholar]
- Usman, S.M.; Usman, M.; Fong, S. Epileptic seizures prediction using machine learning methods. Comput. Math. Methods Med. 2017, 2017, 9074759. [Google Scholar] [CrossRef]
- Janghel, R.R.; Rathore, Y.K.; Tatiparti, G. Epileptic Seizure Detection and Classification Using Machine Learning. In Early Detection of Neurological Disorders Using Machine Learning Systems; IGI Global: Hershey, PA, USA, 2019; pp. 152–164. [Google Scholar]
- Qureshi, M.B.; Afzaal, M.; Qureshi, M.S.; Fayaz, M. Machine learning-based EEG signals classification model for epileptic seizure detection. Multimed. Tools Appl. 2021, 80, 17849–17877. [Google Scholar]
- Aileni, R.M.; Paşca, S.; Florescu, A. March. Epileptic seizure classification based on supervised learning models. In 2019 11th International Symposium on Advanced Topics in Electrical Engineering (ATEE); IEEE: Manhattan, NY, USA, 2019; pp. 1–4. [Google Scholar]
- Abdelhameed, A.; Bayoumi, M. A deep learning approach for automatic seizure detection in children with epilepsy. Front. Comput. Neurosci. 2021, 15, 29. [Google Scholar] [CrossRef]
- Gao, Y.; Gao, B.; Chen, Q.; Liu, J.; Zhang, Y. Deep convolutional neural network-based epileptic electroencephalogram (EEG) signal classification. Front. Neurol. 2020, 11, 375. [Google Scholar] [CrossRef] [PubMed]
- Sarić, R.; Jokić, D.; Beganović, N.; Pokvić, L.G.; Badnjević, A. FPGA-based real-time epileptic seizure classification using Artificial Neural Network. Biomed. Signal Process. Control. 2020, 62, 102106. [Google Scholar] [CrossRef]
- Singh, K.; Malhotra, J. Smart neurocare approach for detection of epileptic seizures using deep learning based temporal analysis of EEG patterns. Multimed. Tools Appl. 2022, 81, 29555–29586. [Google Scholar] [CrossRef]
- Singh, K.; Malhotra, J. Prediction of epileptic seizures from spectral features of intracranial eeg recordings using deep learning approach. Multimed. Tools Appl. 2022, 81, 28875–28898. [Google Scholar] [CrossRef]
- Anter, A.M.; Abd Elaziz, M.; Zhang, Z. Real-time epileptic seizure recognition using Bayesian genetic whale optimizer and adaptive machine learning. Future Gener. Comput. Syst. 2022, 127, 426–434. [Google Scholar] [CrossRef]
- Beeraka, S.M.; Kumar, A.; Sameer, M.; Ghosh, S.; Gupta, B. Accuracy Enhancement of Epileptic Seizure Detection: A Deep Learning Approach with Hardware Realization of STFT. Circuits Syst. Signal Process. 2022, 41, 461–484. [Google Scholar] [CrossRef]
- Anuragi, A.; Sisodia, D.S.; Pachori, R.B. Epileptic-seizure classification using phase-space representation of FBSE-EWT based EEG sub-band signals and ensemble learners. Biomed. Signal Process. Control. 2022, 71, 103138. [Google Scholar] [CrossRef]
- Pierezan, J.; Coelho, L. Coyote optimization algorithm: A new metaheuristic for global optimization problems. In IEEE Congress on Evolutionary Computation (CEC); IEEE: Manhattan, NY, USA, 2018; pp. 1–8. [Google Scholar]
- Sayed, G.I.; Khoriba, G.; Haggag, M.H. The novel multi-swarm coyote optimization algorithm for automatic skin lesion segmentation. Evol. Intell. 2020, 1–33. [Google Scholar] [CrossRef]
- Andrew, G.; Arora, R.; Bilmes, J.; Livescu, K. Deep canonical correlation analysis. In Proceedings of the 30th International Conference on Machine Learning PMLR, Atlanta, GA, USA, 17–19 June 2013; pp. 1247–1255. [Google Scholar]
- Li, G.; Han, D.; Wang, C.; Hu, W.; Calhoun, V.D.; Wang, Y.P. Application of deep canonically correlated sparse autoencoder for the classification of schizophrenia. Comput. Methods Programs Biomed. 2020, 183, 105073. [Google Scholar] [CrossRef] [PubMed]
- Gandomi, A.H.; Alavi, A.H. Krill herd: A new bio-inspired optimization algorithm. Commun. Nonlinear Sci. Numer. Simul. 2012, 17, 4831–4845. [Google Scholar] [CrossRef]
- Bilal, H.; Öztürk, F. Rubber bushing optimization by using a novel chaotic krill herd optimization algorithm. Soft Comput. 2021, 25, 14333–14355. [Google Scholar] [CrossRef]
- Available online: https://archive.ics.uci.edu/ml/datasets/Epileptic+Seizure+Recognition (accessed on 16 April 2022).
- Almustafa, K.M. Classification of epileptic seizure dataset using different machine learning algorithms. Inform. Med. Unlocked 2020, 21, 100444. [Google Scholar] [CrossRef]


| Class Name | Class Label | No. of Instances |
|---|---|---|
| Binary Class Dataset | ||
| EEG signals having seizure activity | 0 | 2300 |
| EEG signals not having seizure activity | 1 | 9200 |
| Multi-Class Dataset | ||
| EEG signals having seizure activity | 0 | 2300 |
| EEG signals having tumor region | 1 | 2300 |
| EEG signals having healthy brain | 2 | 2300 |
| EEG signals having eyes closed | 3 | 2300 |
| EEG signals having eyes closed | 4 | 2300 |
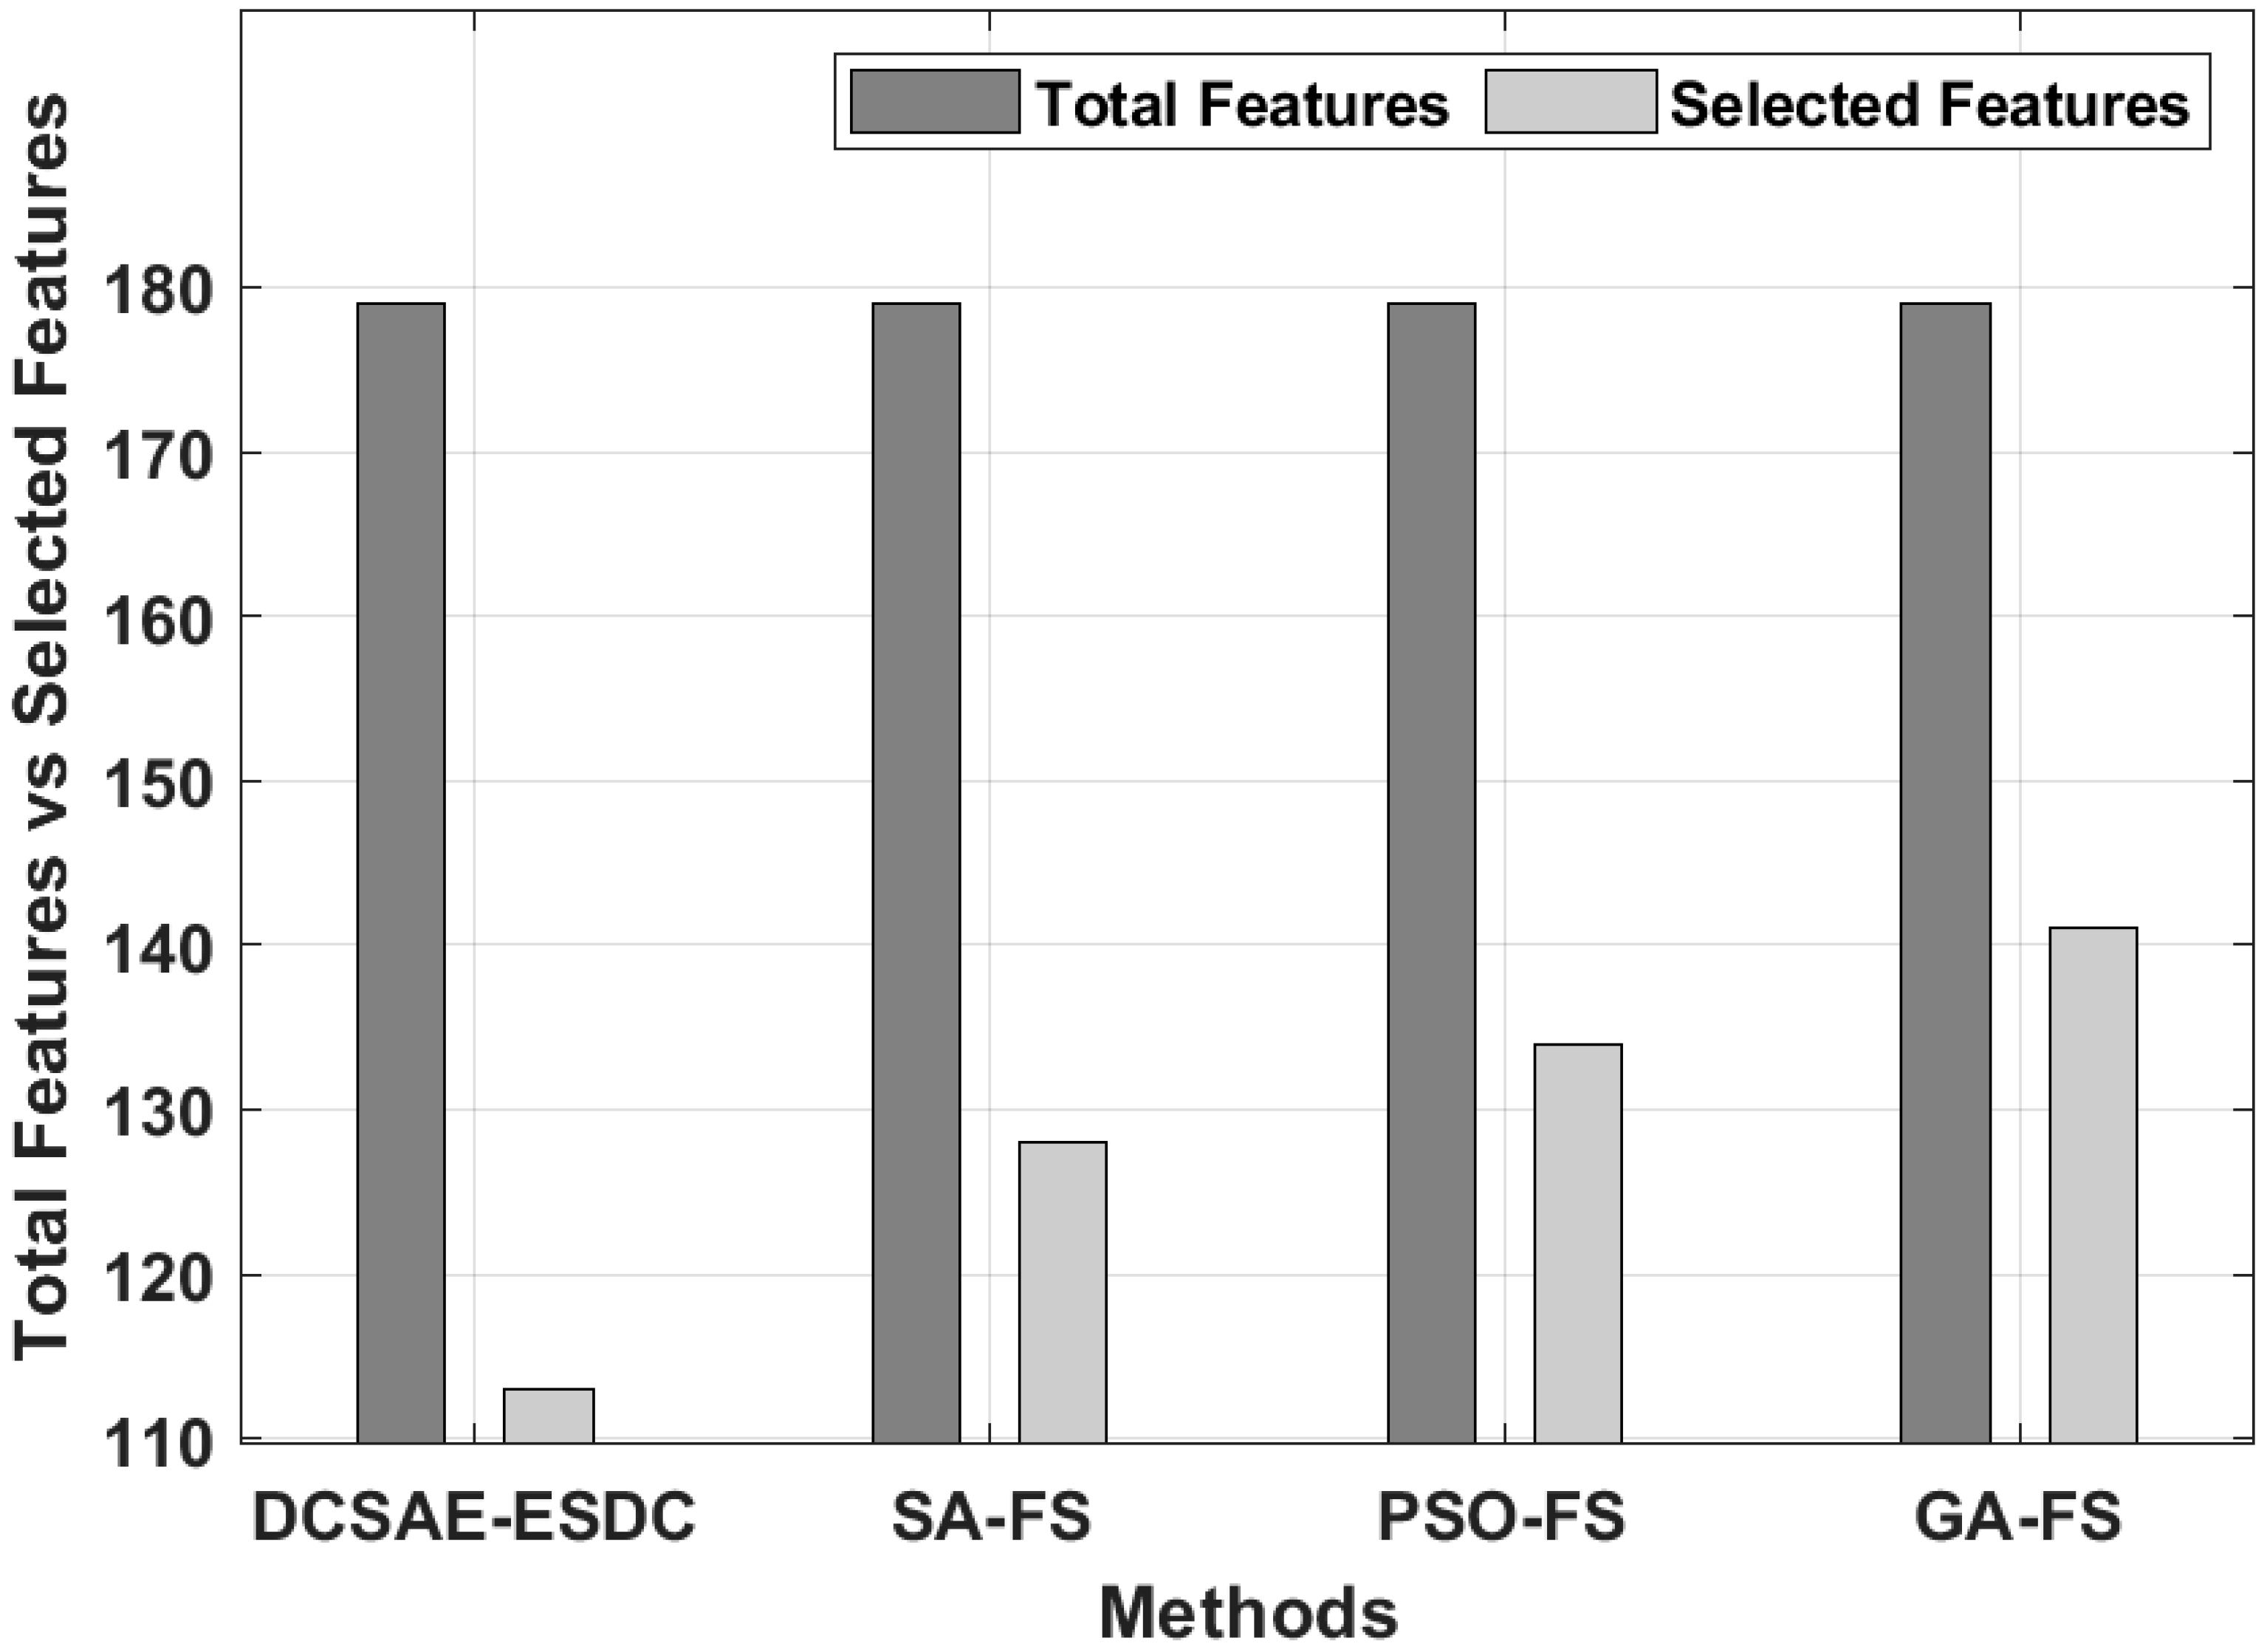
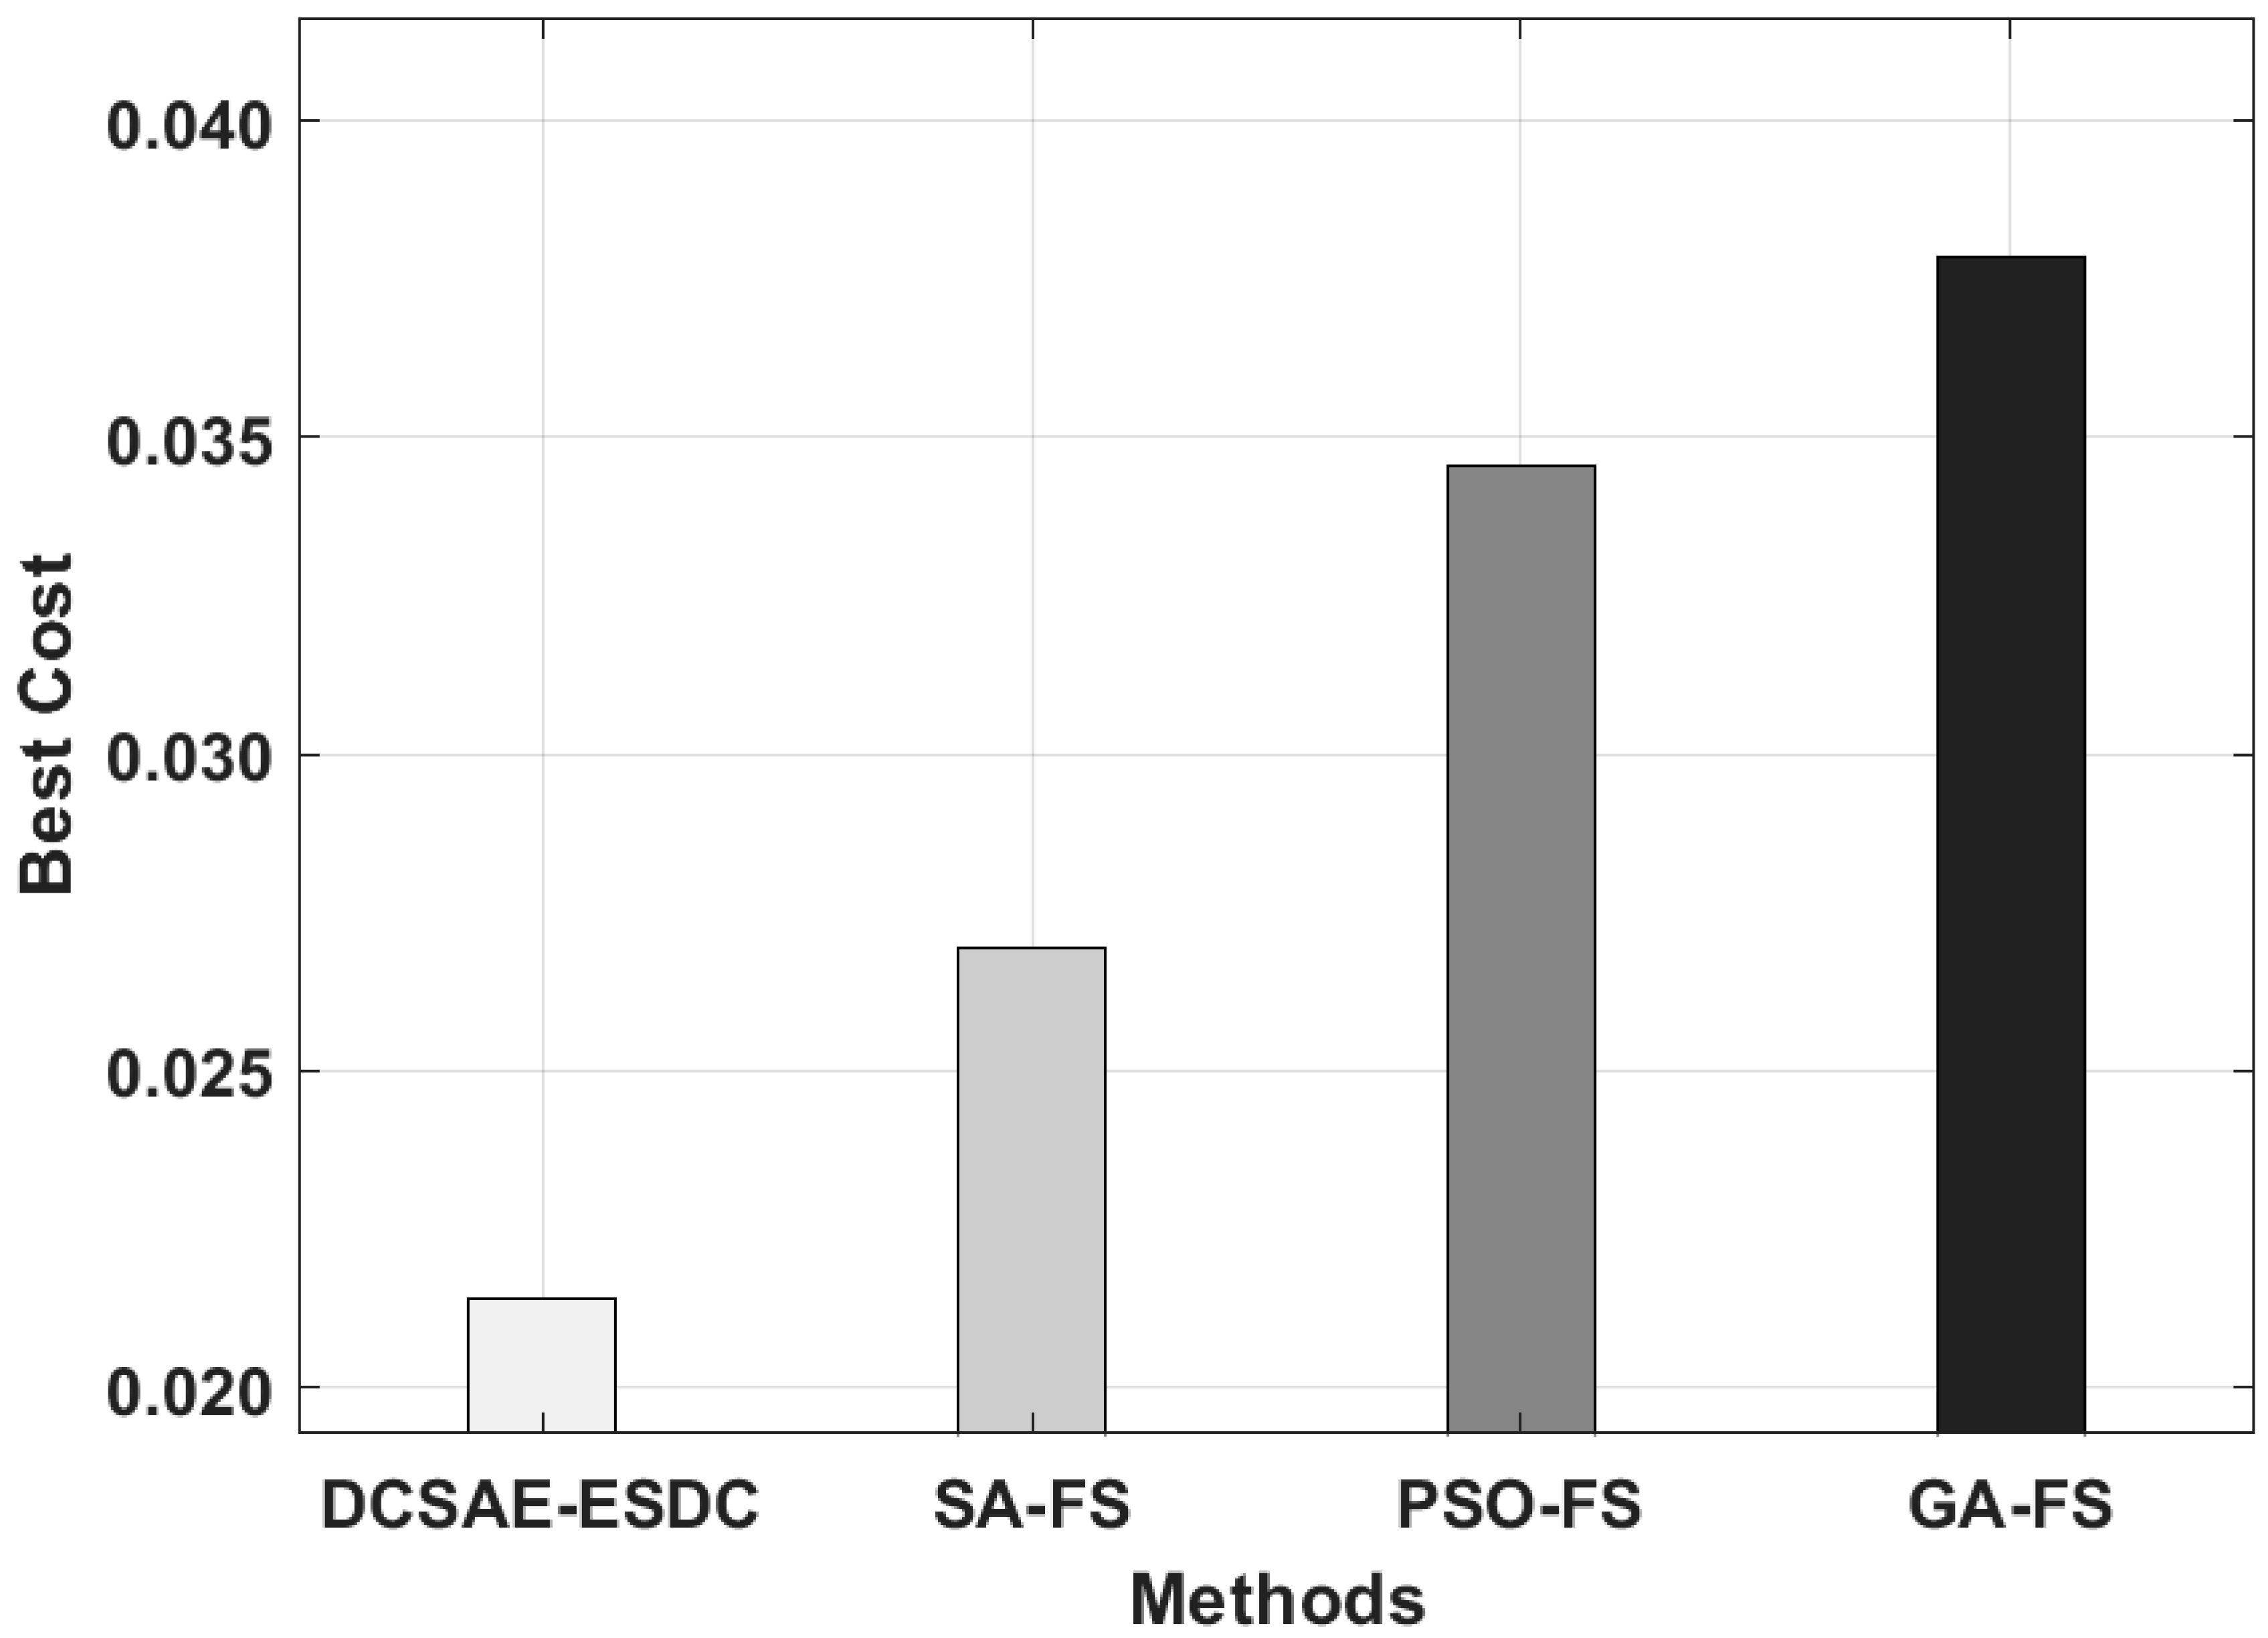
| Methods | Selected Features | Best Cost |
|---|---|---|
| DCSAE-ESDC | 113 | 0.0214 |
| SA-FS | 128 | 0.0269 |
| PSO-FS | 134 | 0.0345 |
| GA-FS | 141 | 0.0378 |
| Batch Size = 32 | ||||||
|---|---|---|---|---|---|---|
| No. of Epochs | Sensitivity (%) | Specificity (%) | Precision (%) | Accuracy (%) | F-Score (%) | MCC (%) |
| 100 | 99.28 | 99.27 | 99.17 | 98.81 | 99.04 | 99.13 |
| 200 | 99.23 | 98.96 | 99.15 | 98.47 | 98.60 | 99.11 |
| 300 | 98.92 | 99.42 | 99.25 | 98.37 | 99.21 | 99.13 |
| 400 | 99.29 | 99.20 | 99.29 | 98.83 | 99.03 | 99.04 |
| 500 | 99.22 | 99.14 | 99.39 | 98.89 | 98.55 | 99.04 |
| Average | 99.19 | 99.20 | 99.25 | 98.67 | 98.89 | 99.09 |
| Batch Size = 64 | ||||||
| 100 | 98.84 | 99.10 | 98.94 | 98.52 | 98.09 | 99.07 |
| 200 | 98.92 | 99.21 | 98.95 | 98.30 | 98.28 | 99.01 |
| 300 | 98.90 | 98.93 | 99.01 | 98.89 | 98.06 | 99.12 |
| 400 | 99.29 | 99.11 | 99.41 | 98.53 | 99.00 | 99.06 |
| 500 | 99.06 | 99.01 | 99.00 | 98.35 | 98.50 | 99.00 |
| Average | 99.00 | 99.07 | 99.06 | 98.52 | 98.39 | 99.05 |
| Batch Size = 128 | ||||||
| 100 | 99.00 | 99.44 | 99.08 | 98.52 | 98.07 | 99.18 |
| 200 | 98.82 | 99.42 | 99.40 | 98.31 | 98.73 | 99.03 |
| 300 | 98.87 | 99.15 | 99.40 | 98.39 | 98.05 | 99.04 |
| 400 | 98.92 | 99.42 | 99.07 | 98.47 | 98.17 | 99.19 |
| 500 | 99.05 | 99.05 | 99.39 | 98.68 | 99.16 | 99.16 |
| Average | 98.93 | 99.30 | 99.27 | 98.47 | 98.44 | 99.12 |
| Batch Size = 32 | ||||||
|---|---|---|---|---|---|---|
| No. of Epochs | Sensitivity (%) | Specificity (%) | Precision (%) | Accuracy (%) | F-Score (%) | MCC (%) |
| 100 | 98.81 | 99.32 | 99.38 | 98.70 | 99.23 | 99.00 |
| 200 | 99.28 | 99.22 | 99.33 | 98.59 | 98.10 | 99.14 |
| 300 | 99.21 | 99.25 | 99.35 | 98.56 | 98.49 | 99.19 |
| 400 | 99.22 | 99.40 | 98.98 | 98.67 | 98.41 | 99.14 |
| 500 | 98.91 | 99.24 | 98.96 | 98.33 | 98.00 | 99.14 |
| Average | 99.09 | 99.29 | 99.20 | 98.57 | 98.45 | 99.12 |
| Batch Size = 64 | ||||||
| 100 | 99.05 | 98.97 | 99.29 | 98.63 | 98.08 | 99.15 |
| 200 | 98.88 | 99.33 | 99.14 | 98.67 | 98.23 | 99.00 |
| 300 | 99.02 | 99.43 | 99.48 | 98.57 | 98.19 | 99.17 |
| 400 | 98.74 | 99.33 | 99.02 | 98.95 | 98.77 | 99.00 |
| 500 | 99.12 | 99.24 | 99.02 | 98.84 | 98.93 | 99.07 |
| Average | 98.96 | 99.26 | 99.19 | 98.73 | 98.44 | 99.08 |
| Batch Size = 128 | ||||||
| 100 | 98.73 | 98.97 | 99.23 | 98.60 | 99.30 | 99.05 |
| 200 | 99.28 | 98.91 | 99.21 | 98.83 | 99.05 | 99.11 |
| 300 | 99.28 | 99.17 | 99.20 | 98.86 | 98.33 | 99.03 |
| 400 | 99.00 | 99.40 | 99.48 | 98.61 | 98.56 | 99.16 |
| 500 | 98.79 | 99.12 | 99.15 | 98.37 | 98.84 | 99.14 |
| Average | 99.02 | 99.11 | 99.25 | 98.65 | 98.82 | 99.10 |
| Methods | Accuracy (%) | Sensitivity (%) | Specificity (%) |
|---|---|---|---|
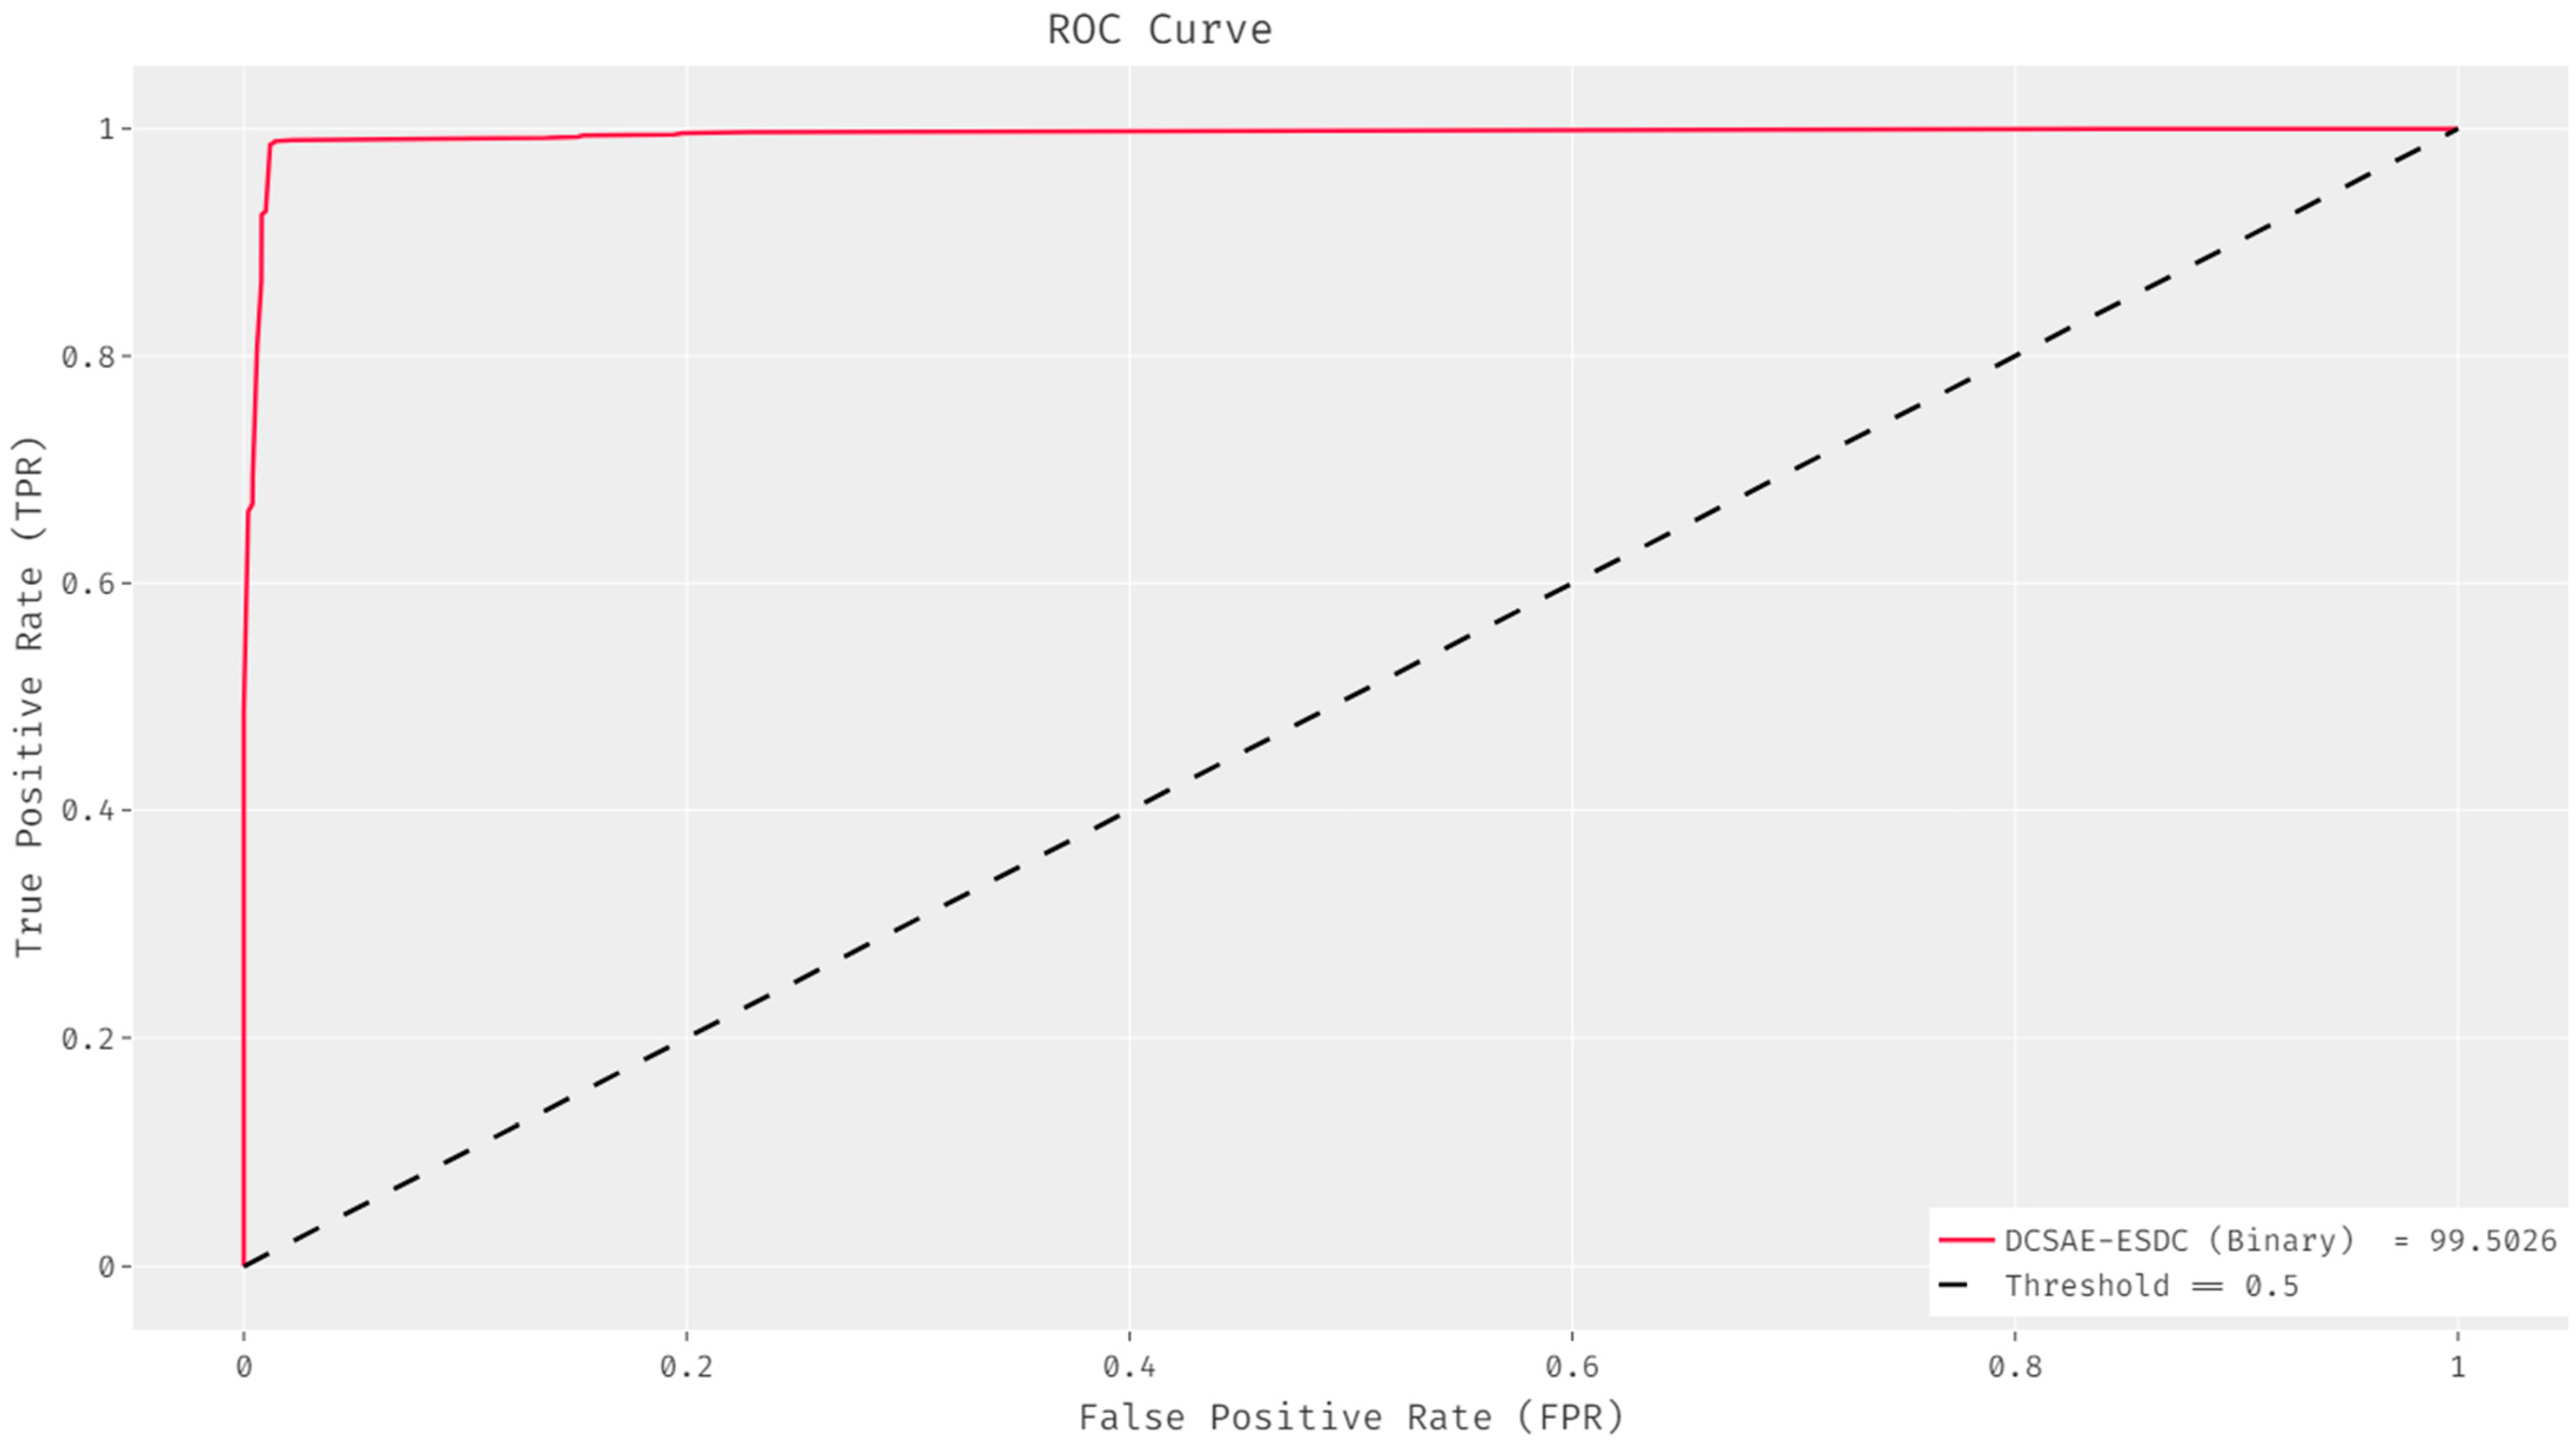
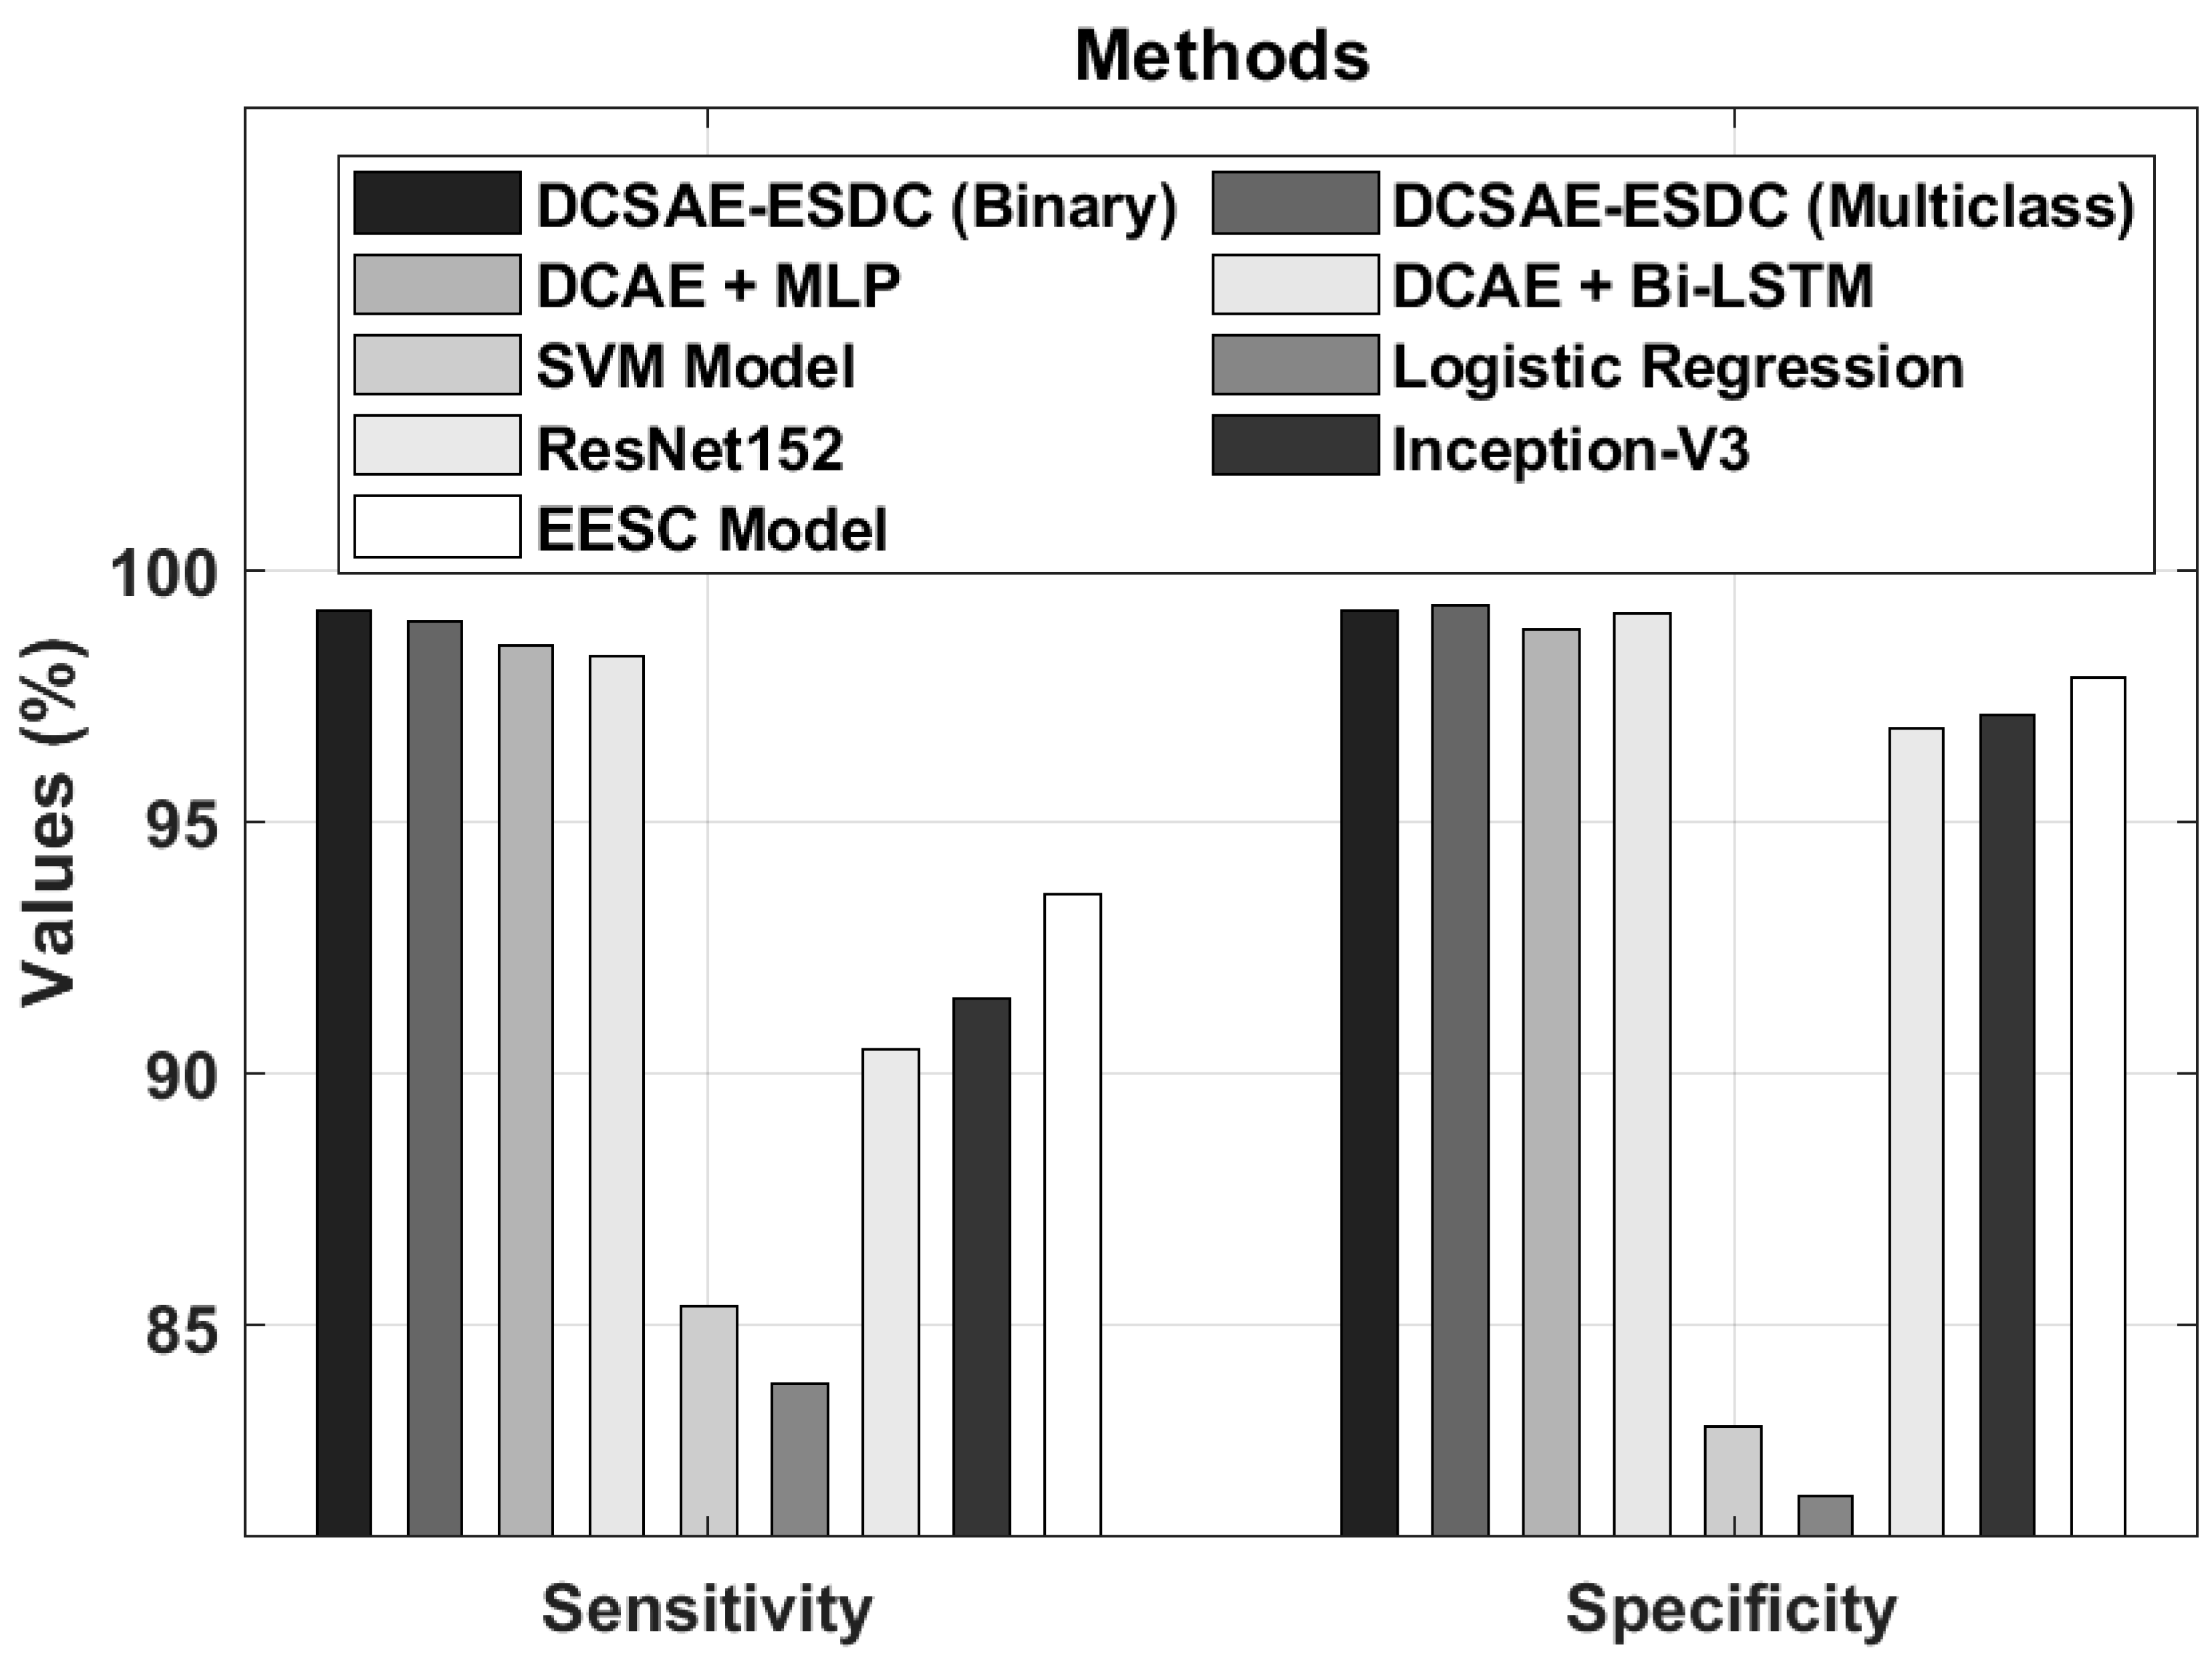
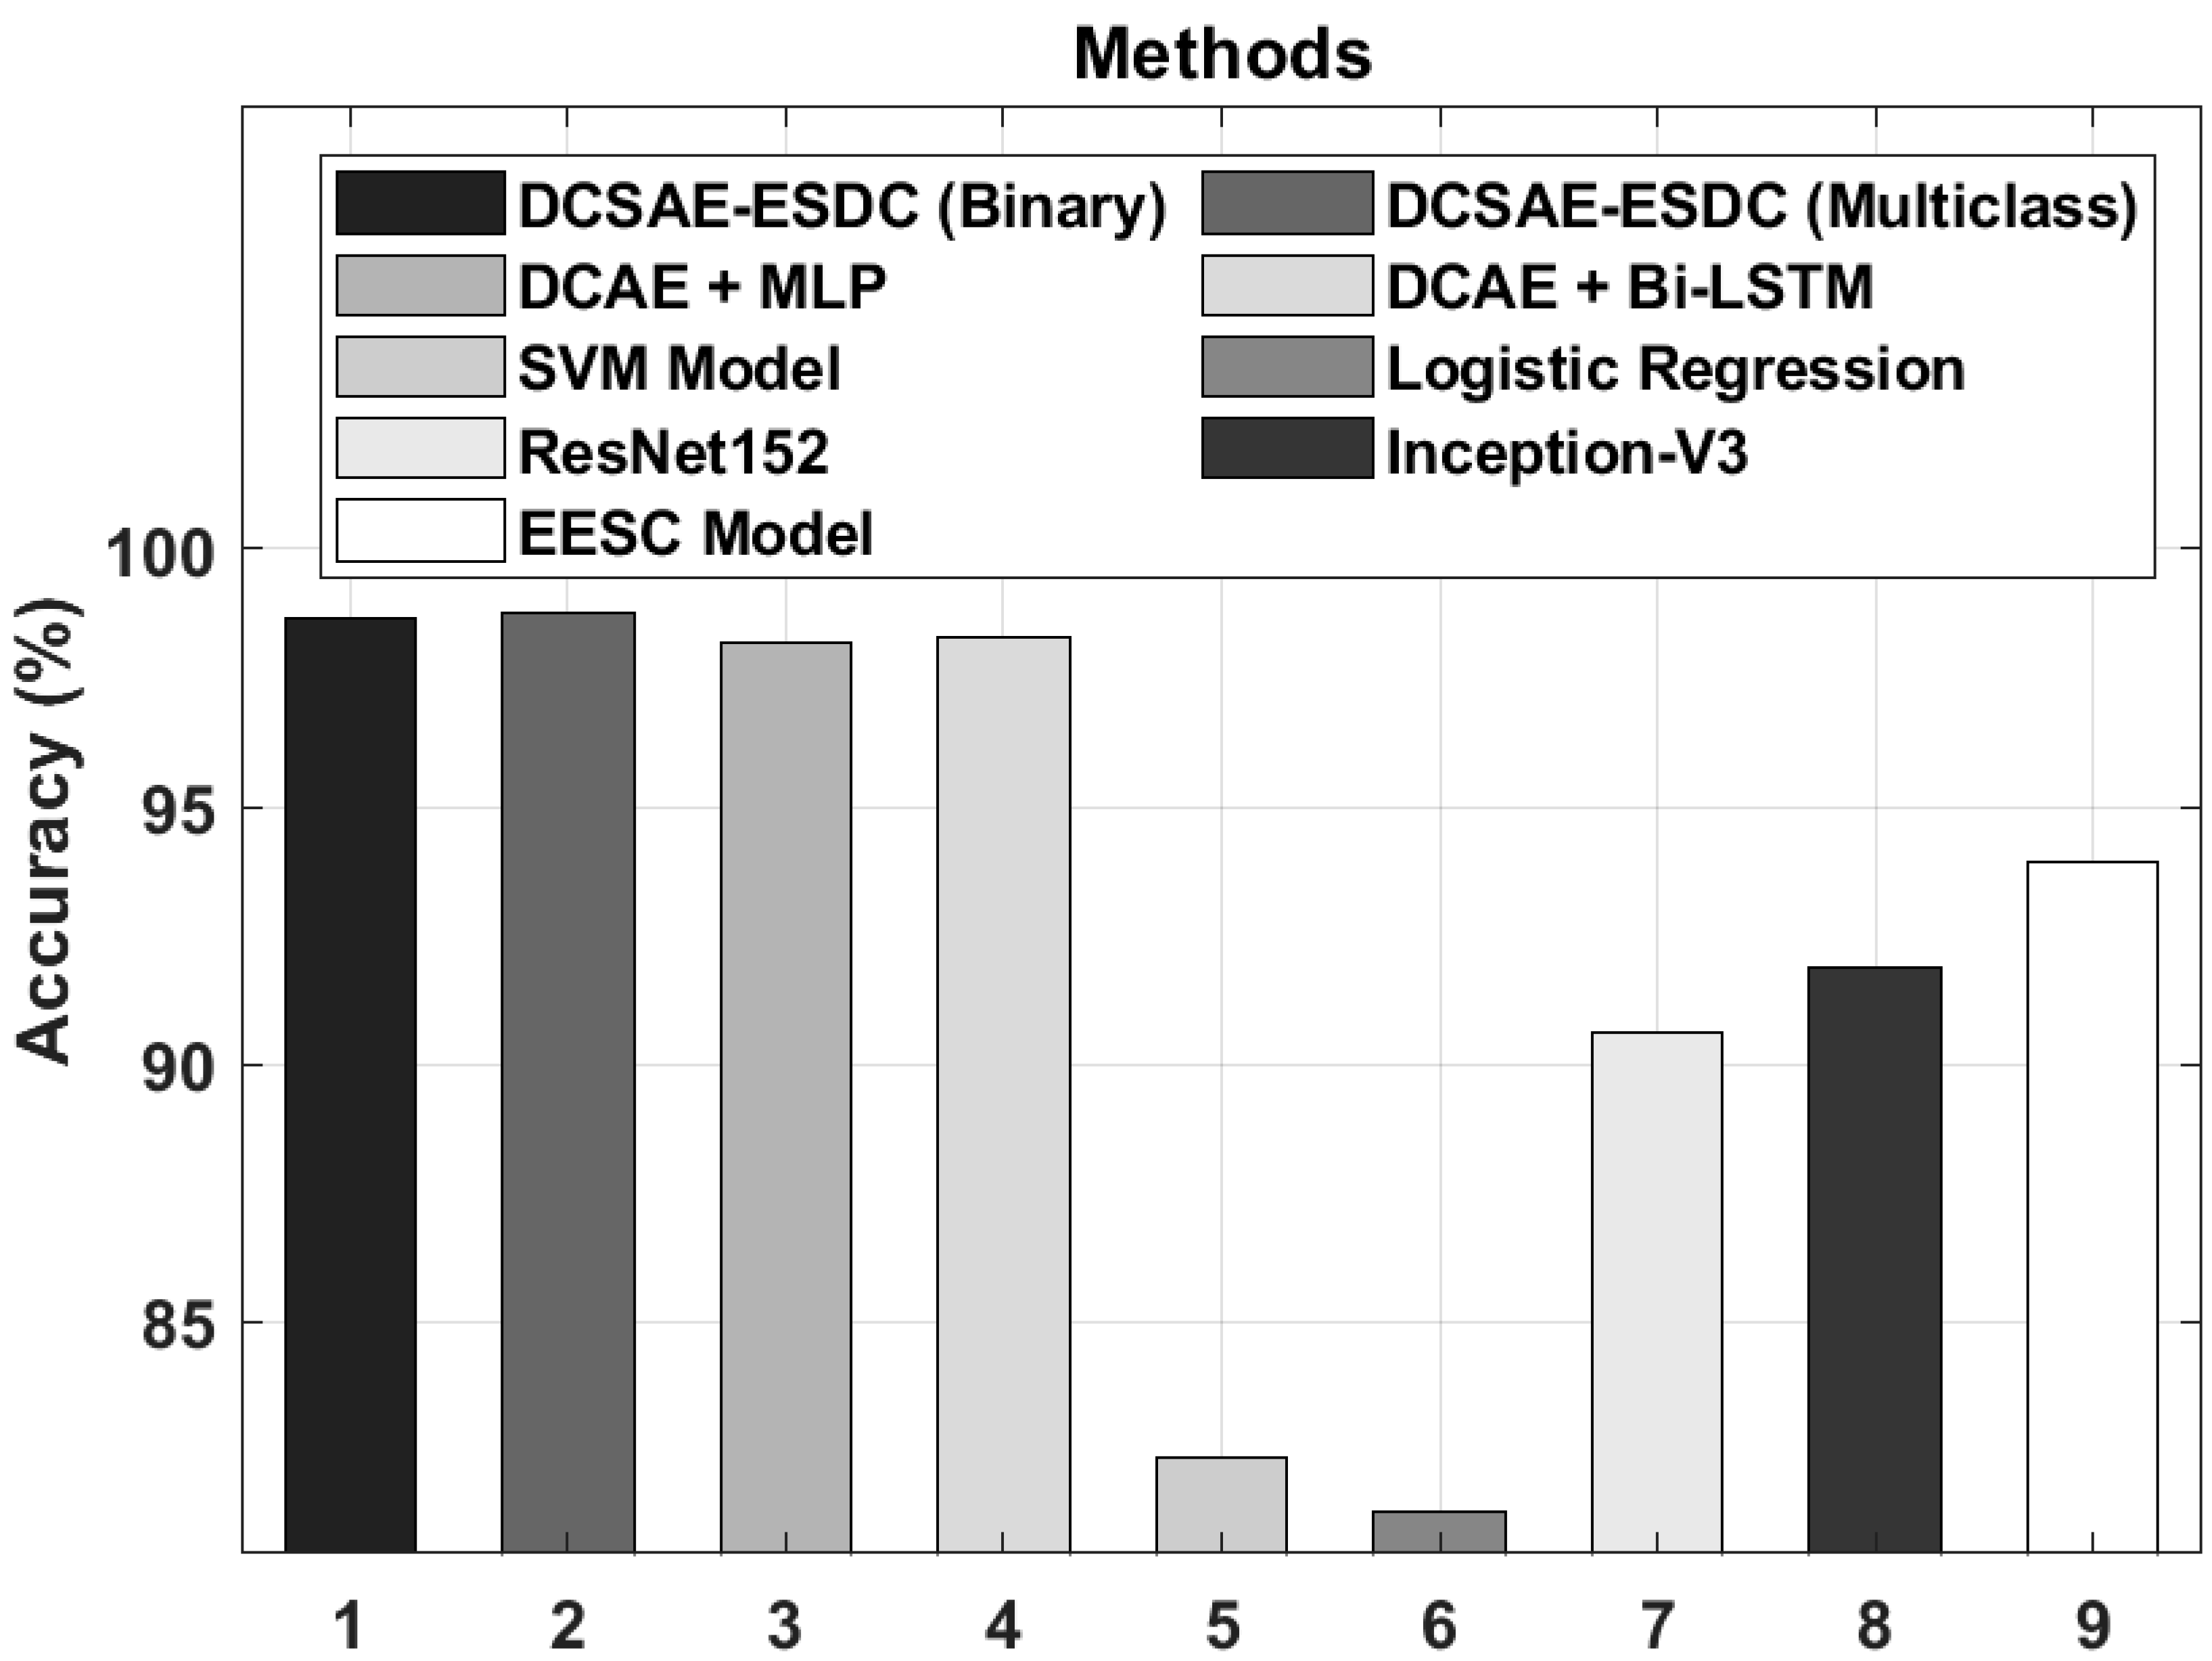
| DCSAE-ESDC (Binary) | 98.67 | 99.19 | 99.20 |
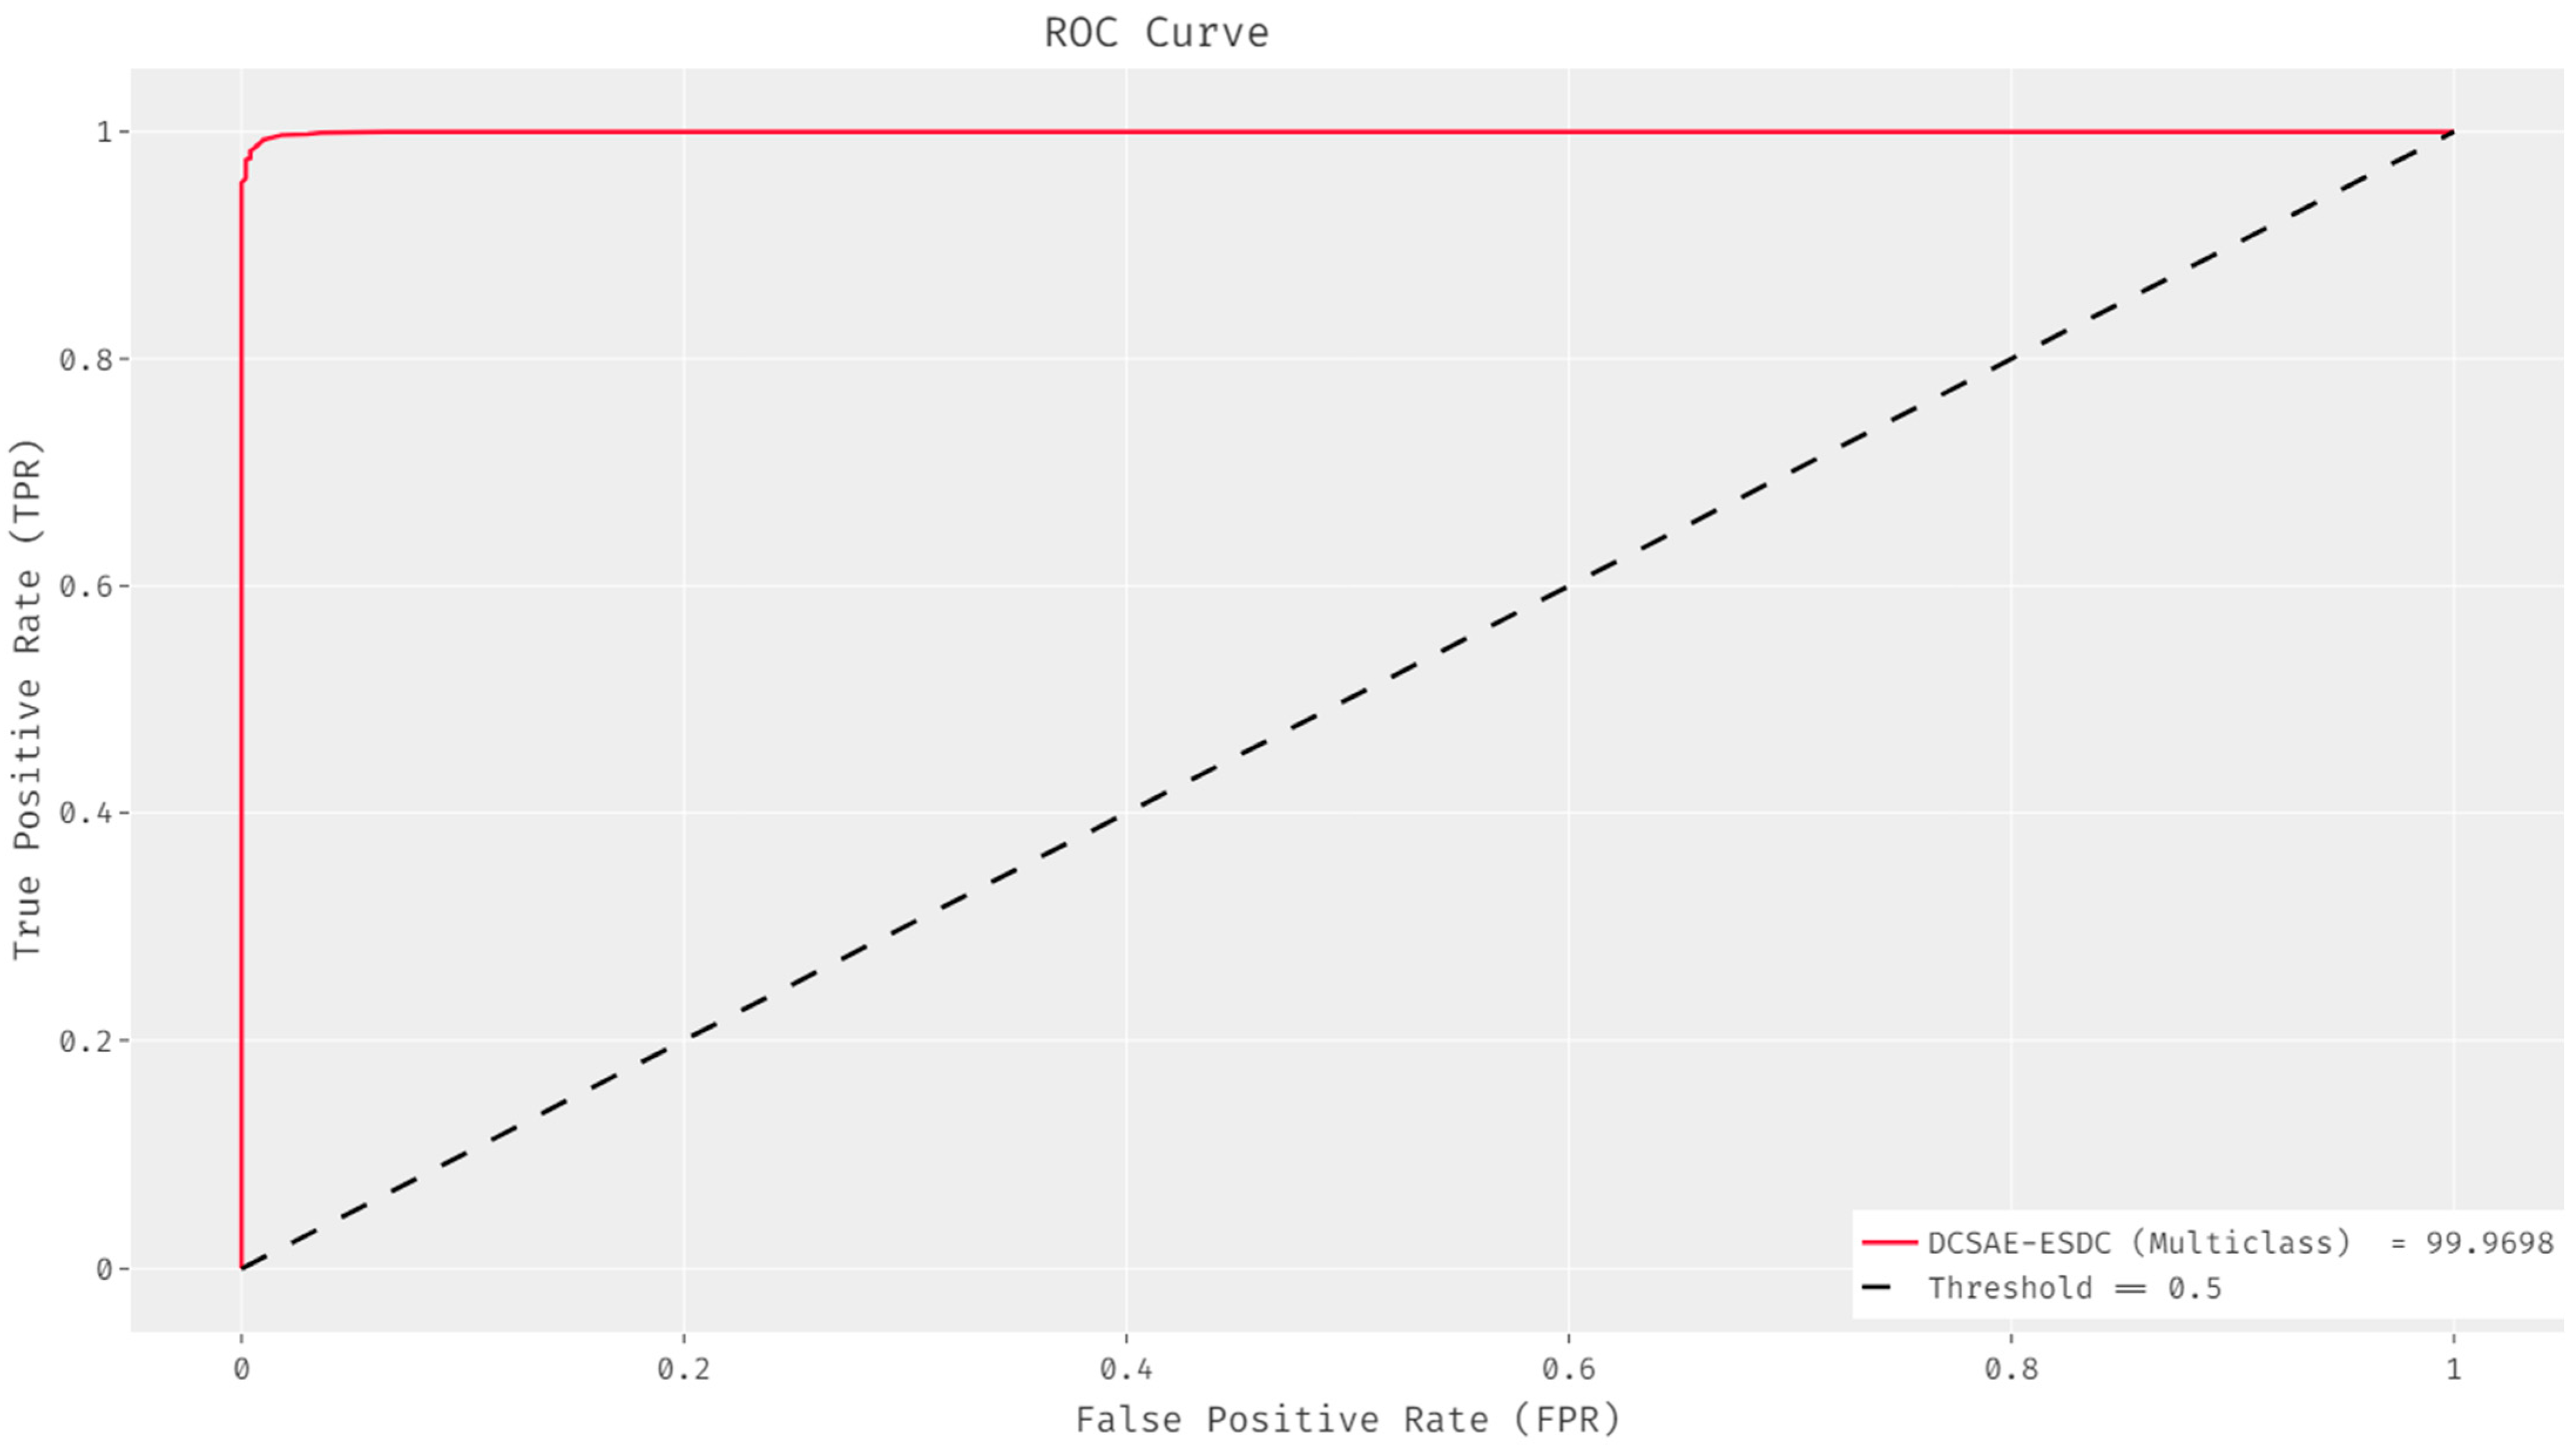
| DCSAE-ESDC (Multiclass) | 98.73 | 98.96 | 99.26 |
| DCAE + MLP | 98.17 | 98.49 | 98.83 |
| DCAE + Bi-LSTM | 98.26 | 98.26 | 99.11 |
| SVM Model | 82.39 | 85.38 | 83.00 |
| Logistic Regression | 81.32 | 83.85 | 81.60 |
| ResNet152 | 90.63 | 90.45 | 96.85 |
| Inception-V3 | 91.89 | 91.50 | 97.12 |
| EESC Model | 93.92 | 93.57 | 97.87 |
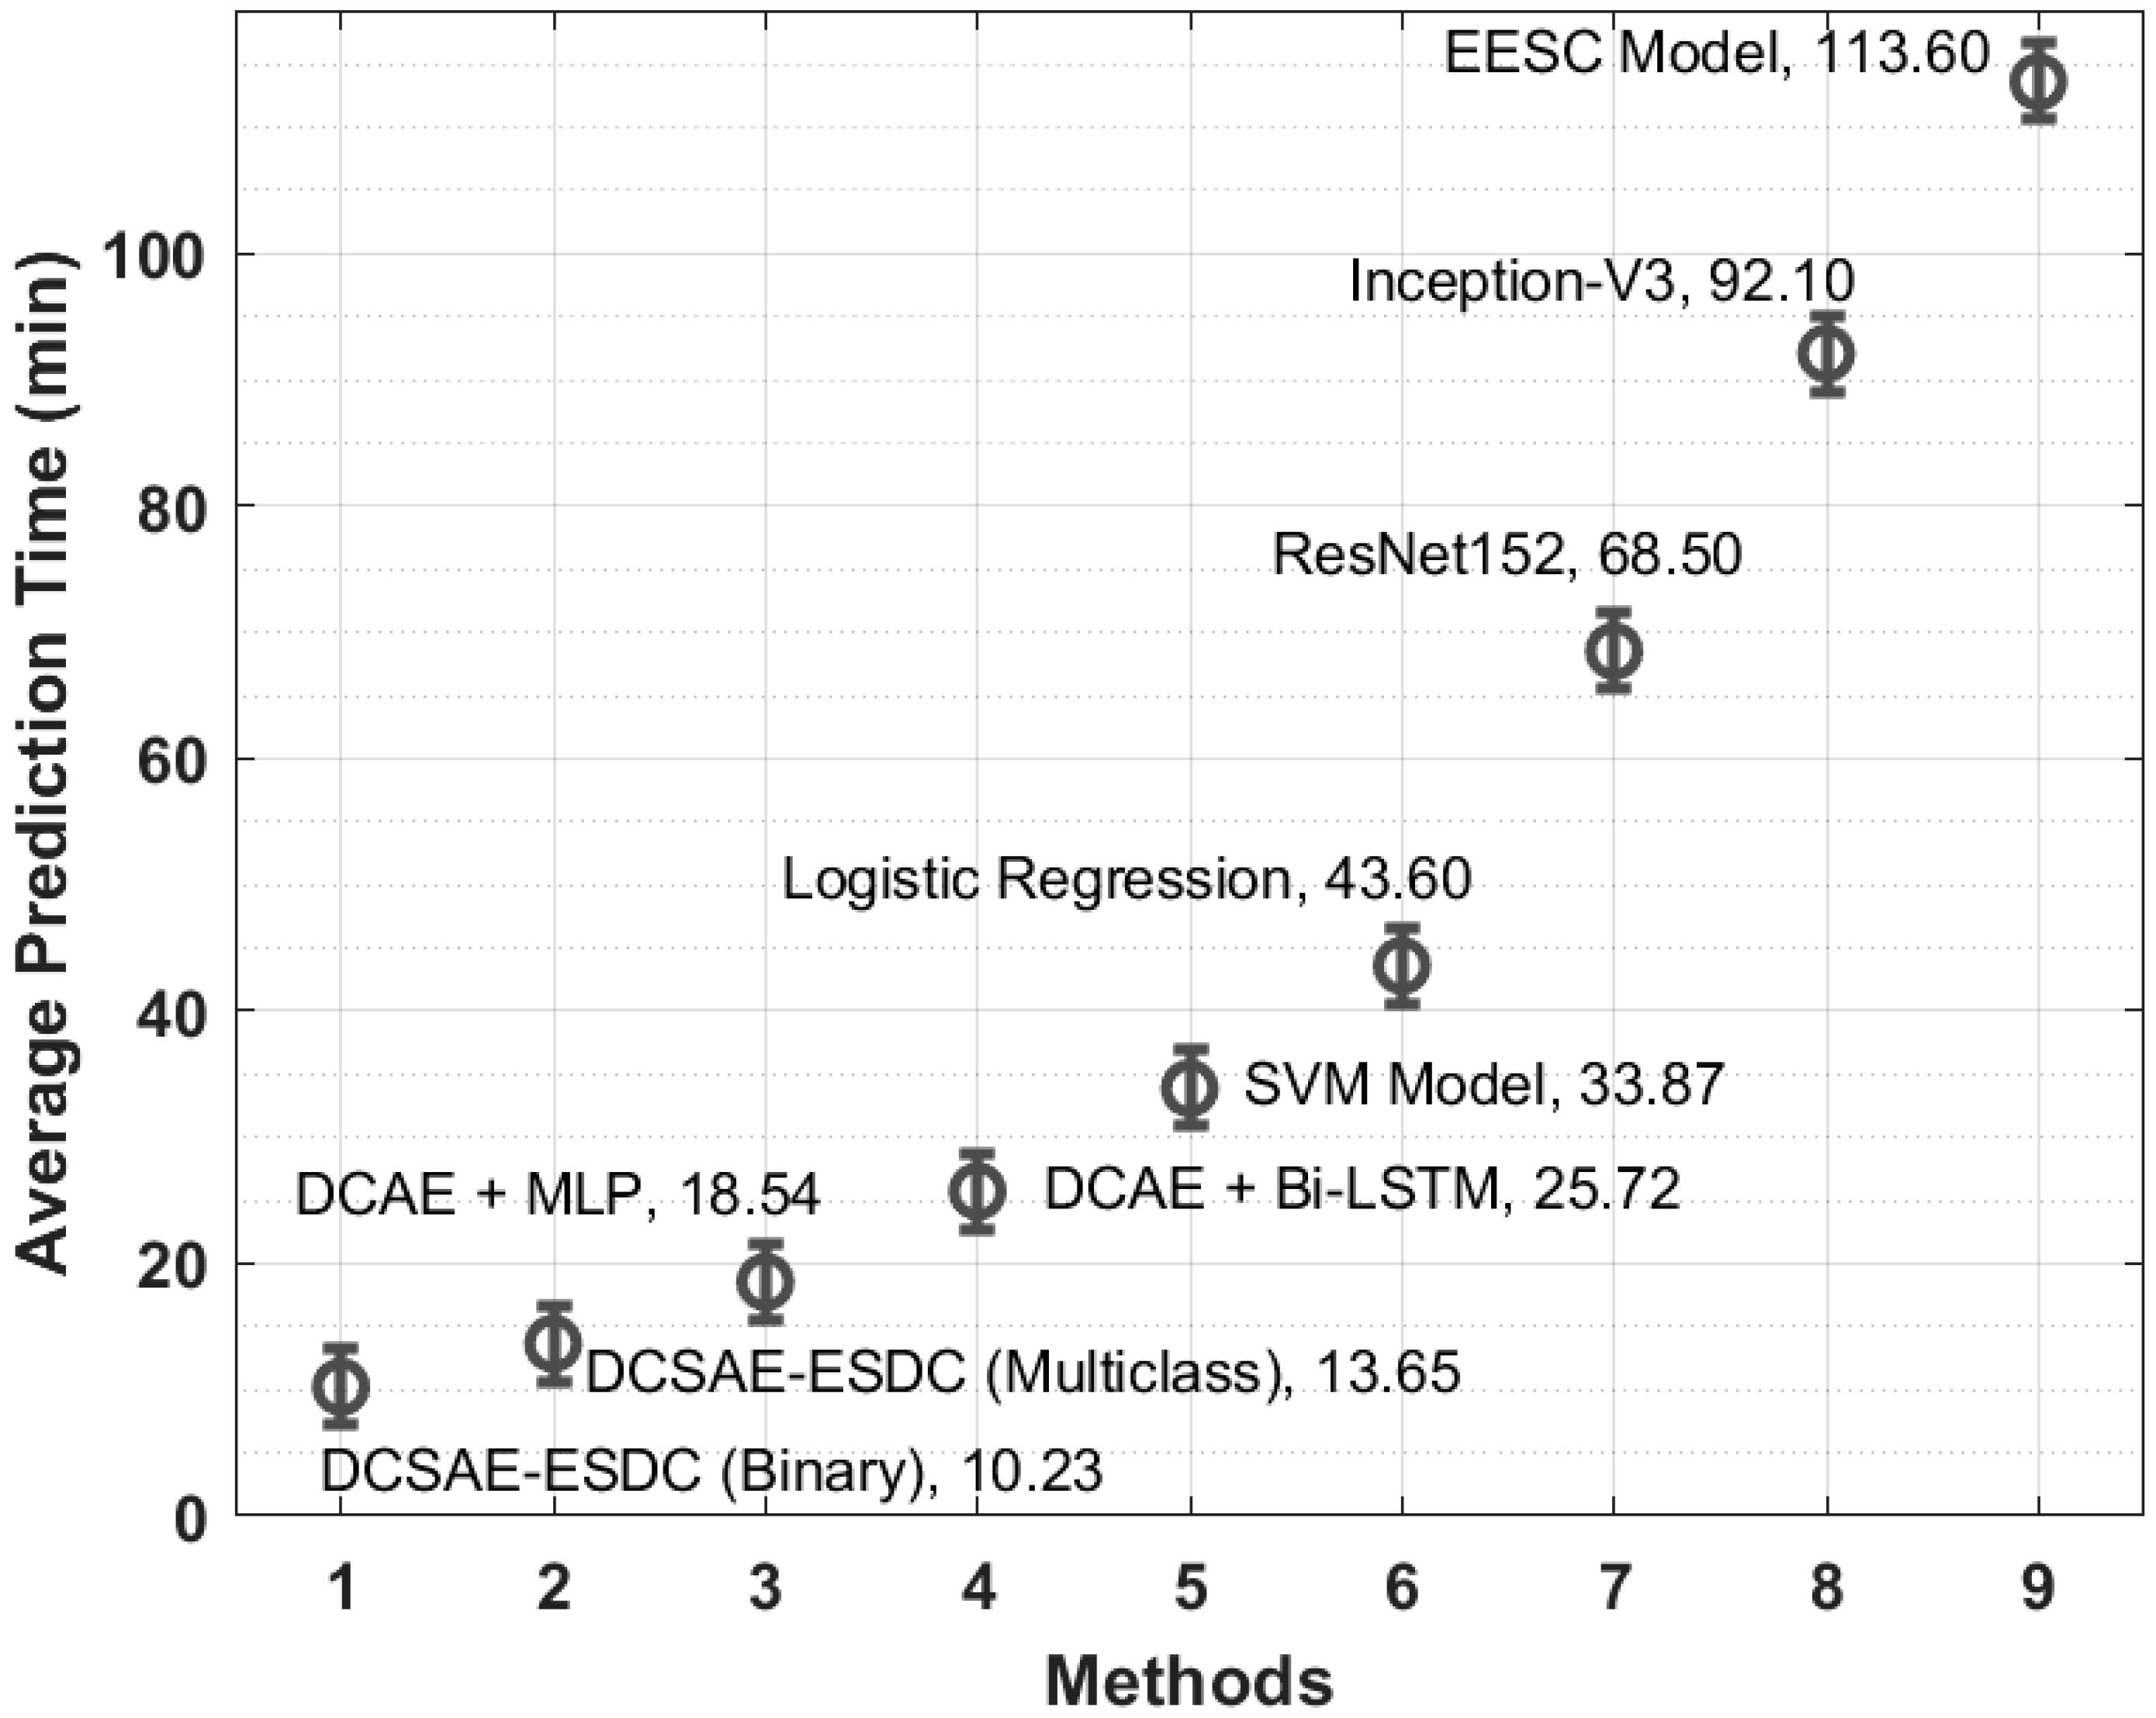
| Methods | Average Prediction Time (min) |
| DCSAE-ESDC (Binary) | 10.23 |
| DCSAE-ESDC (Multiclass) | 13.65 |
| DCAE + MLP | 18.54 |
| DCAE + Bi-LSTM | 25.72 |
| SVM Model | 33.87 |
| Logistic Regression | 43.60 |
| ResNet152 | 68.50 |
| Inception-V3 | 92.10 |
| EESC Model | 113.60 |
Publisher’s Note: MDPI stays neutral with regard to jurisdictional claims in published maps and institutional affiliations. |
© 2022 by the authors. Licensee MDPI, Basel, Switzerland. This article is an open access article distributed under the terms and conditions of the Creative Commons Attribution (CC BY) license (https://creativecommons.org/licenses/by/4.0/).
Share and Cite
Hilal, A.M.; Albraikan, A.A.; Dhahbi, S.; Nour, M.K.; Mohamed, A.; Motwakel, A.; Zamani, A.S.; Rizwanullah, M. Intelligent Epileptic Seizure Detection and Classification Model Using Optimal Deep Canonical Sparse Autoencoder. Biology 2022, 11, 1220. https://doi.org/10.3390/biology11081220
Hilal AM, Albraikan AA, Dhahbi S, Nour MK, Mohamed A, Motwakel A, Zamani AS, Rizwanullah M. Intelligent Epileptic Seizure Detection and Classification Model Using Optimal Deep Canonical Sparse Autoencoder. Biology. 2022; 11(8):1220. https://doi.org/10.3390/biology11081220
Chicago/Turabian StyleHilal, Anwer Mustafa, Amani Abdulrahman Albraikan, Sami Dhahbi, Mohamed K. Nour, Abdullah Mohamed, Abdelwahed Motwakel, Abu Sarwar Zamani, and Mohammed Rizwanullah. 2022. "Intelligent Epileptic Seizure Detection and Classification Model Using Optimal Deep Canonical Sparse Autoencoder" Biology 11, no. 8: 1220. https://doi.org/10.3390/biology11081220
APA StyleHilal, A. M., Albraikan, A. A., Dhahbi, S., Nour, M. K., Mohamed, A., Motwakel, A., Zamani, A. S., & Rizwanullah, M. (2022). Intelligent Epileptic Seizure Detection and Classification Model Using Optimal Deep Canonical Sparse Autoencoder. Biology, 11(8), 1220. https://doi.org/10.3390/biology11081220