
Hybrid Deep Learning Approach for Automatic Detection in Musculoskeletal Radiographs


Abstract
:Simple Summary
Abstract
1. Introduction
2. Related Work
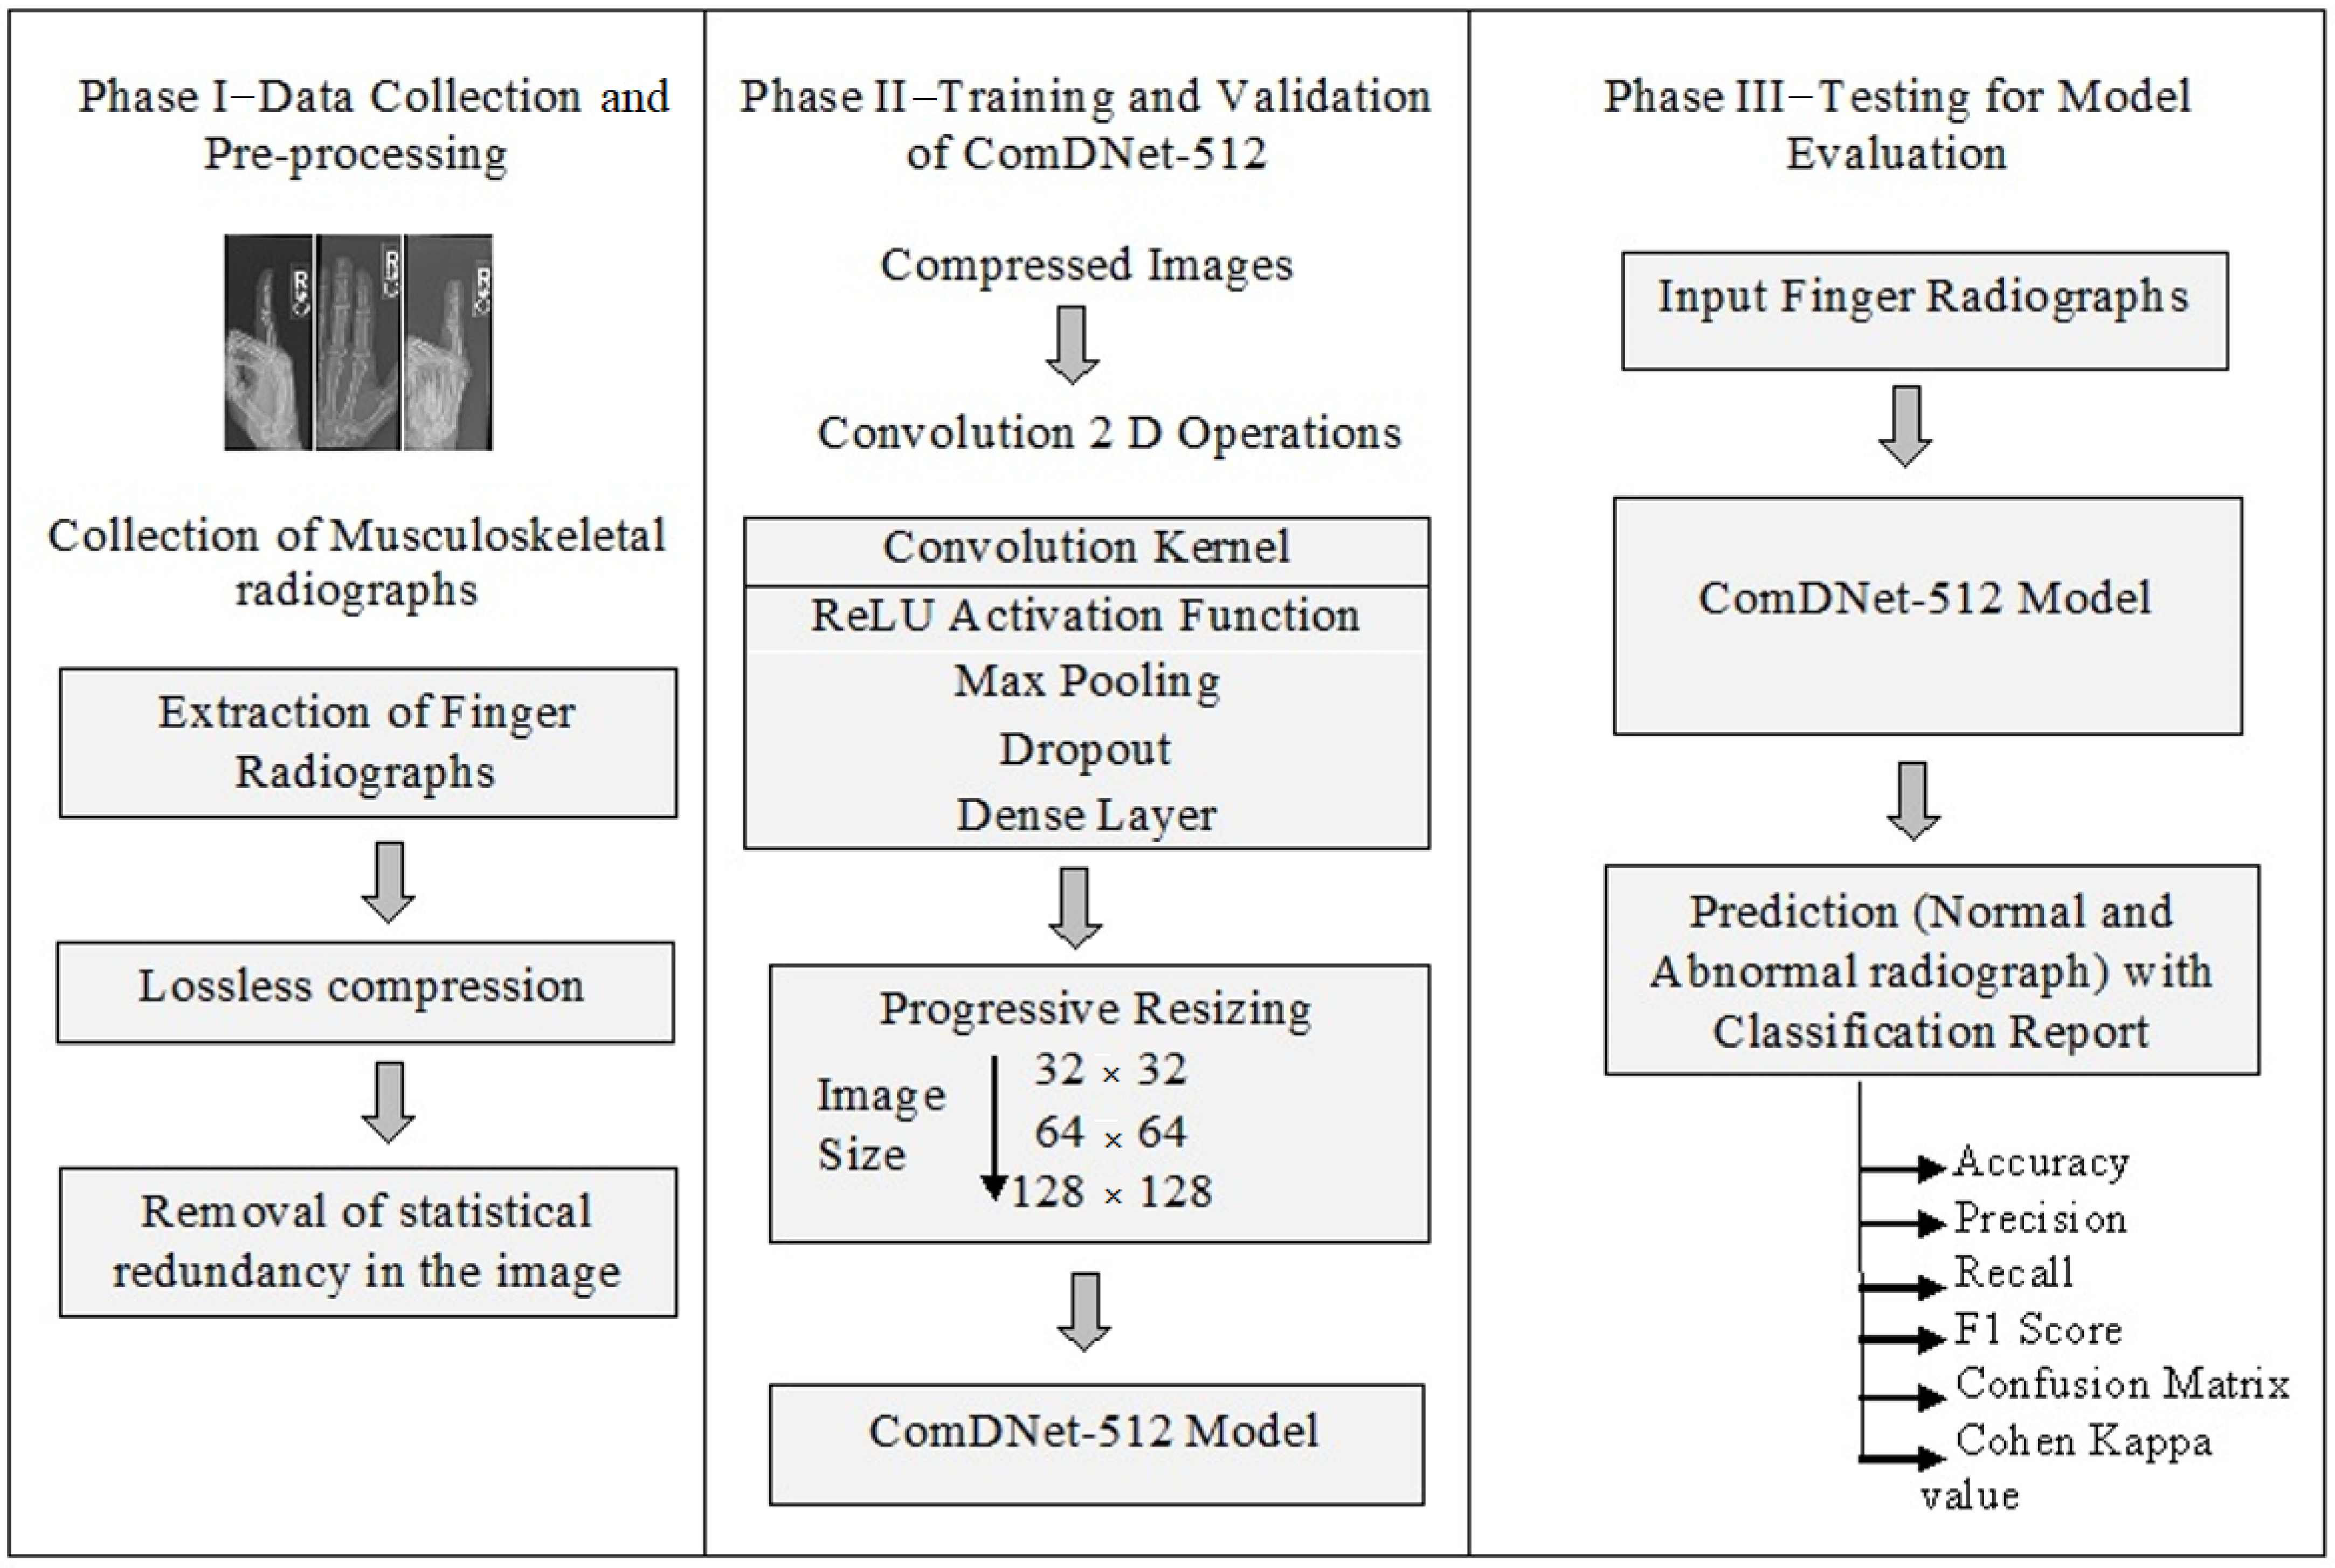
3. Materials and Methods
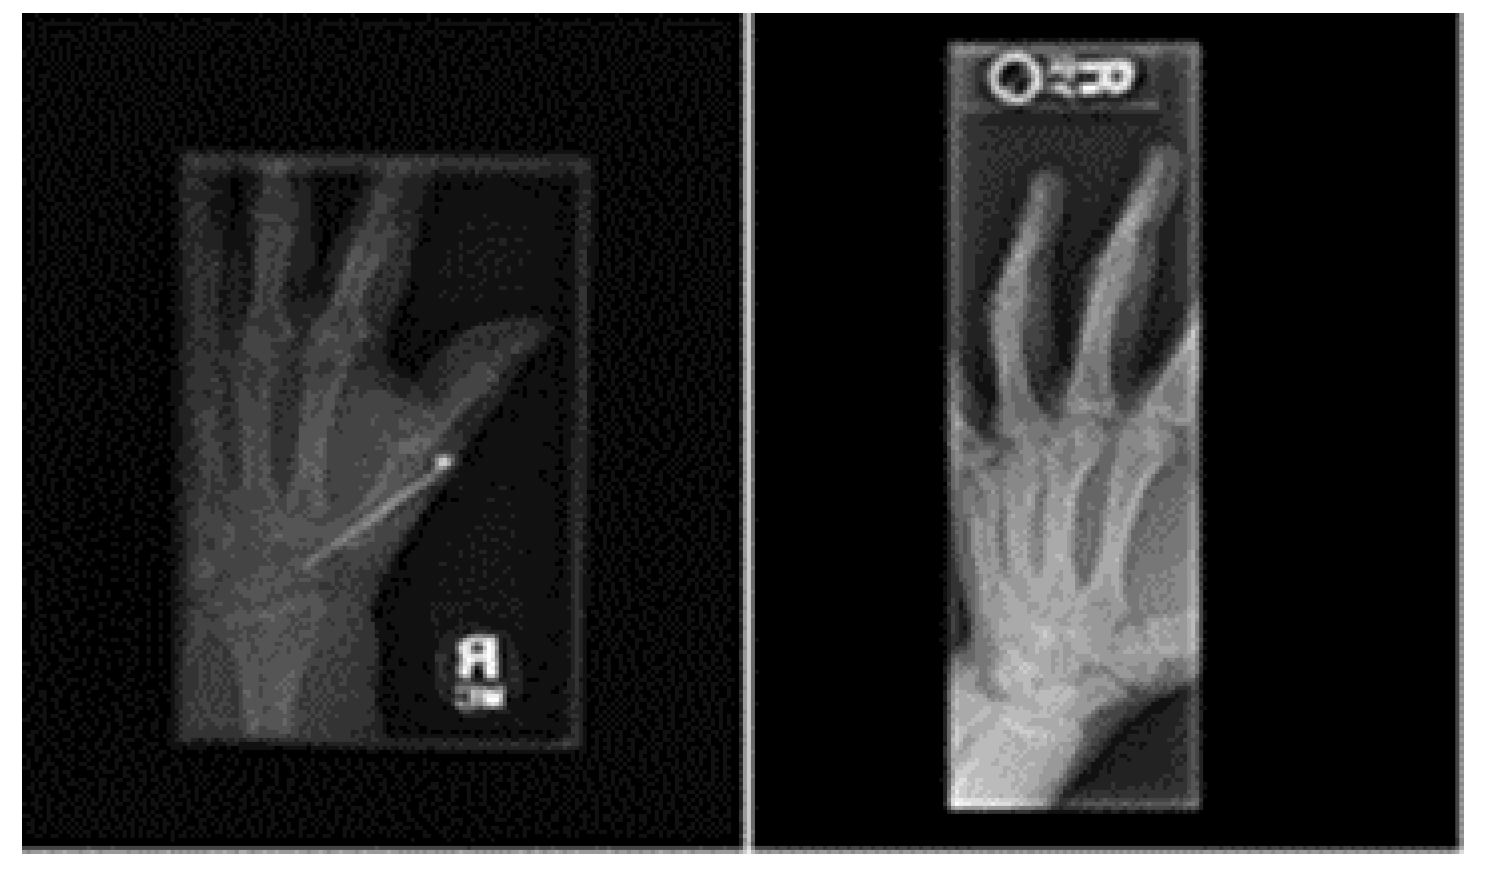
3.1. Dataset
3.2. Experimental Setup
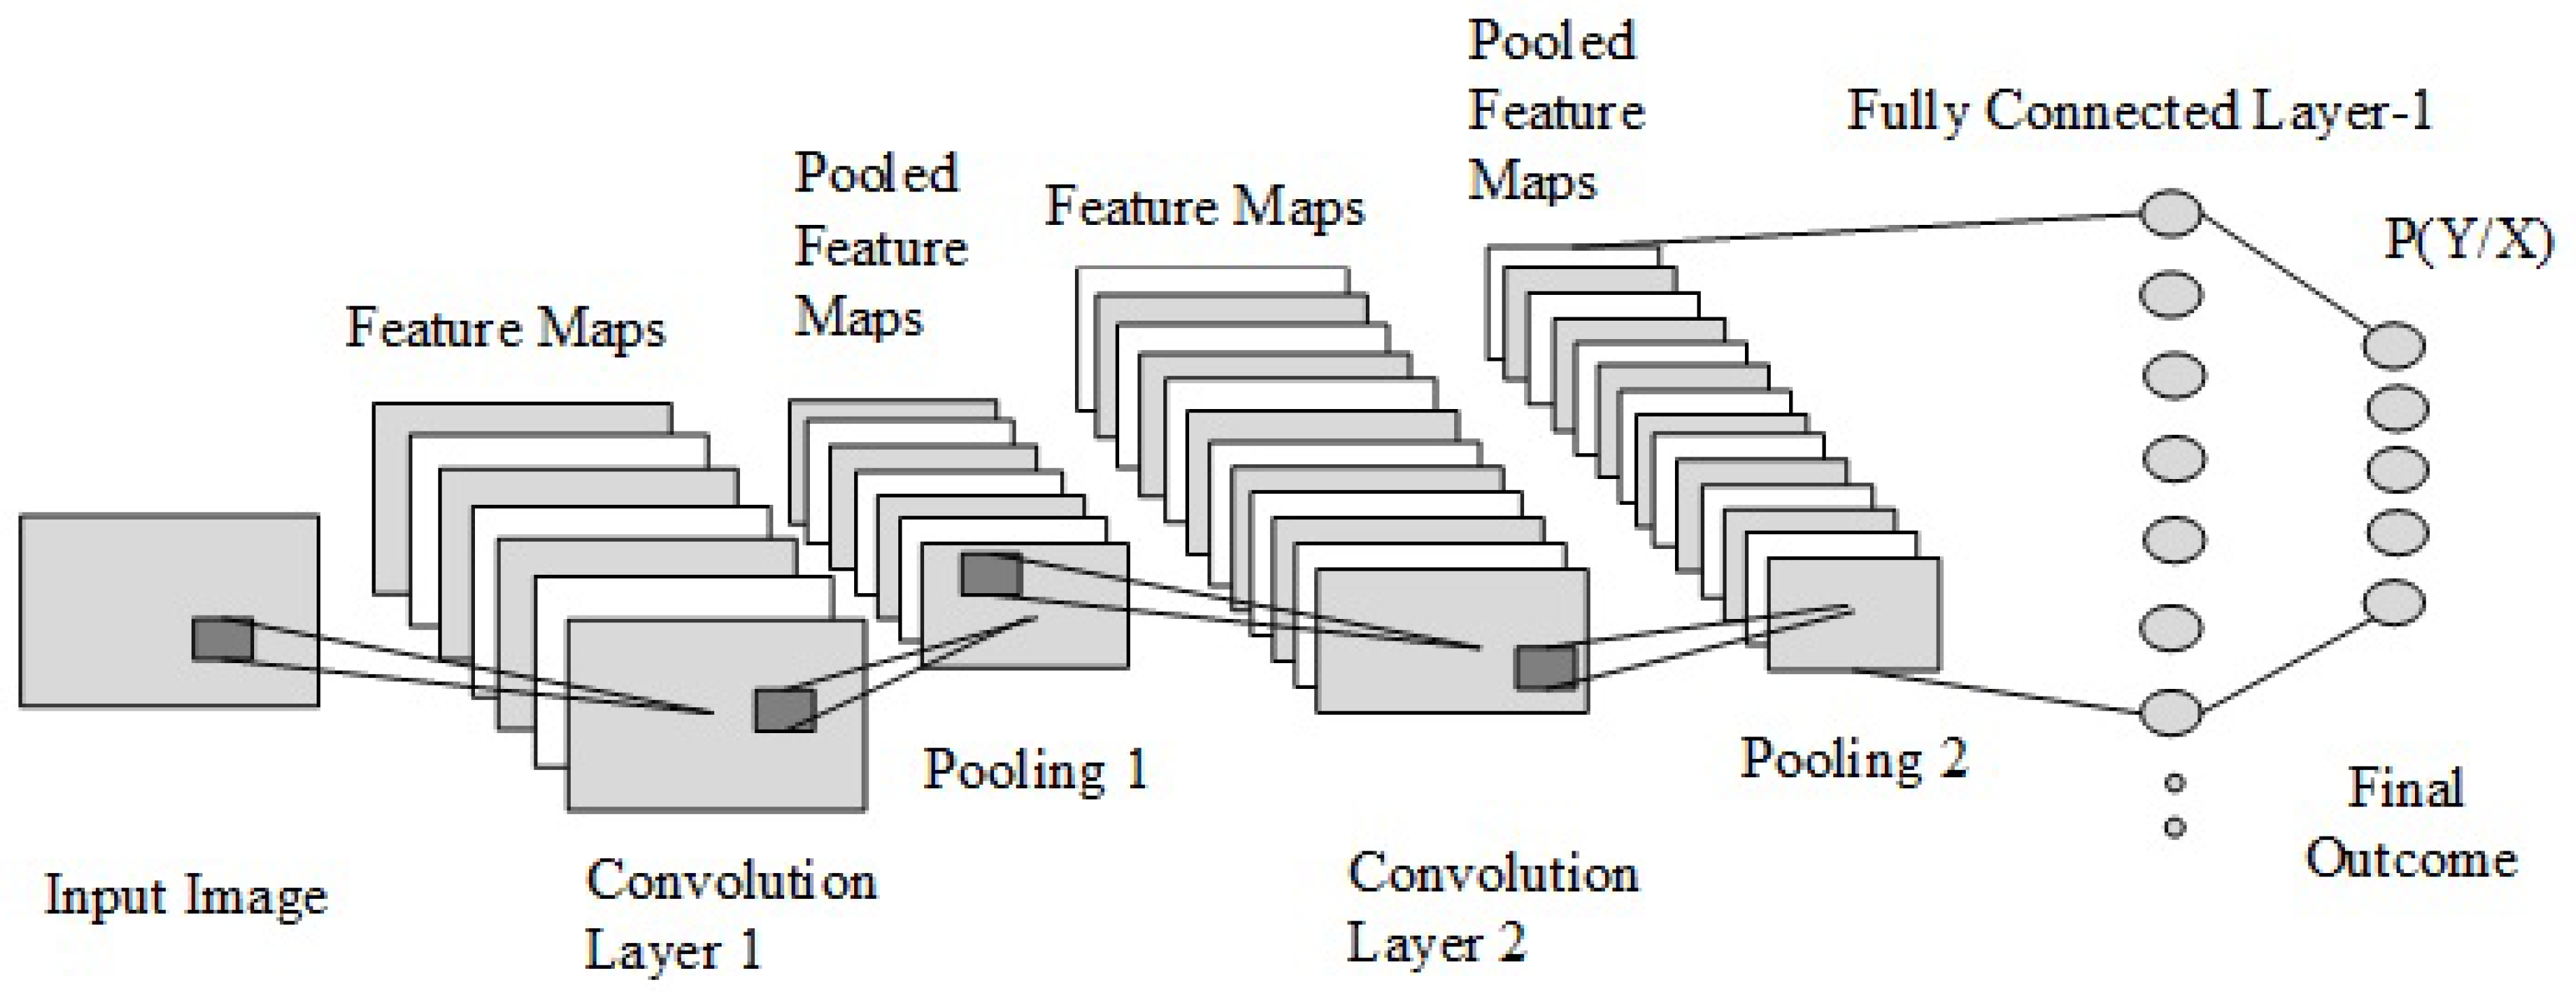
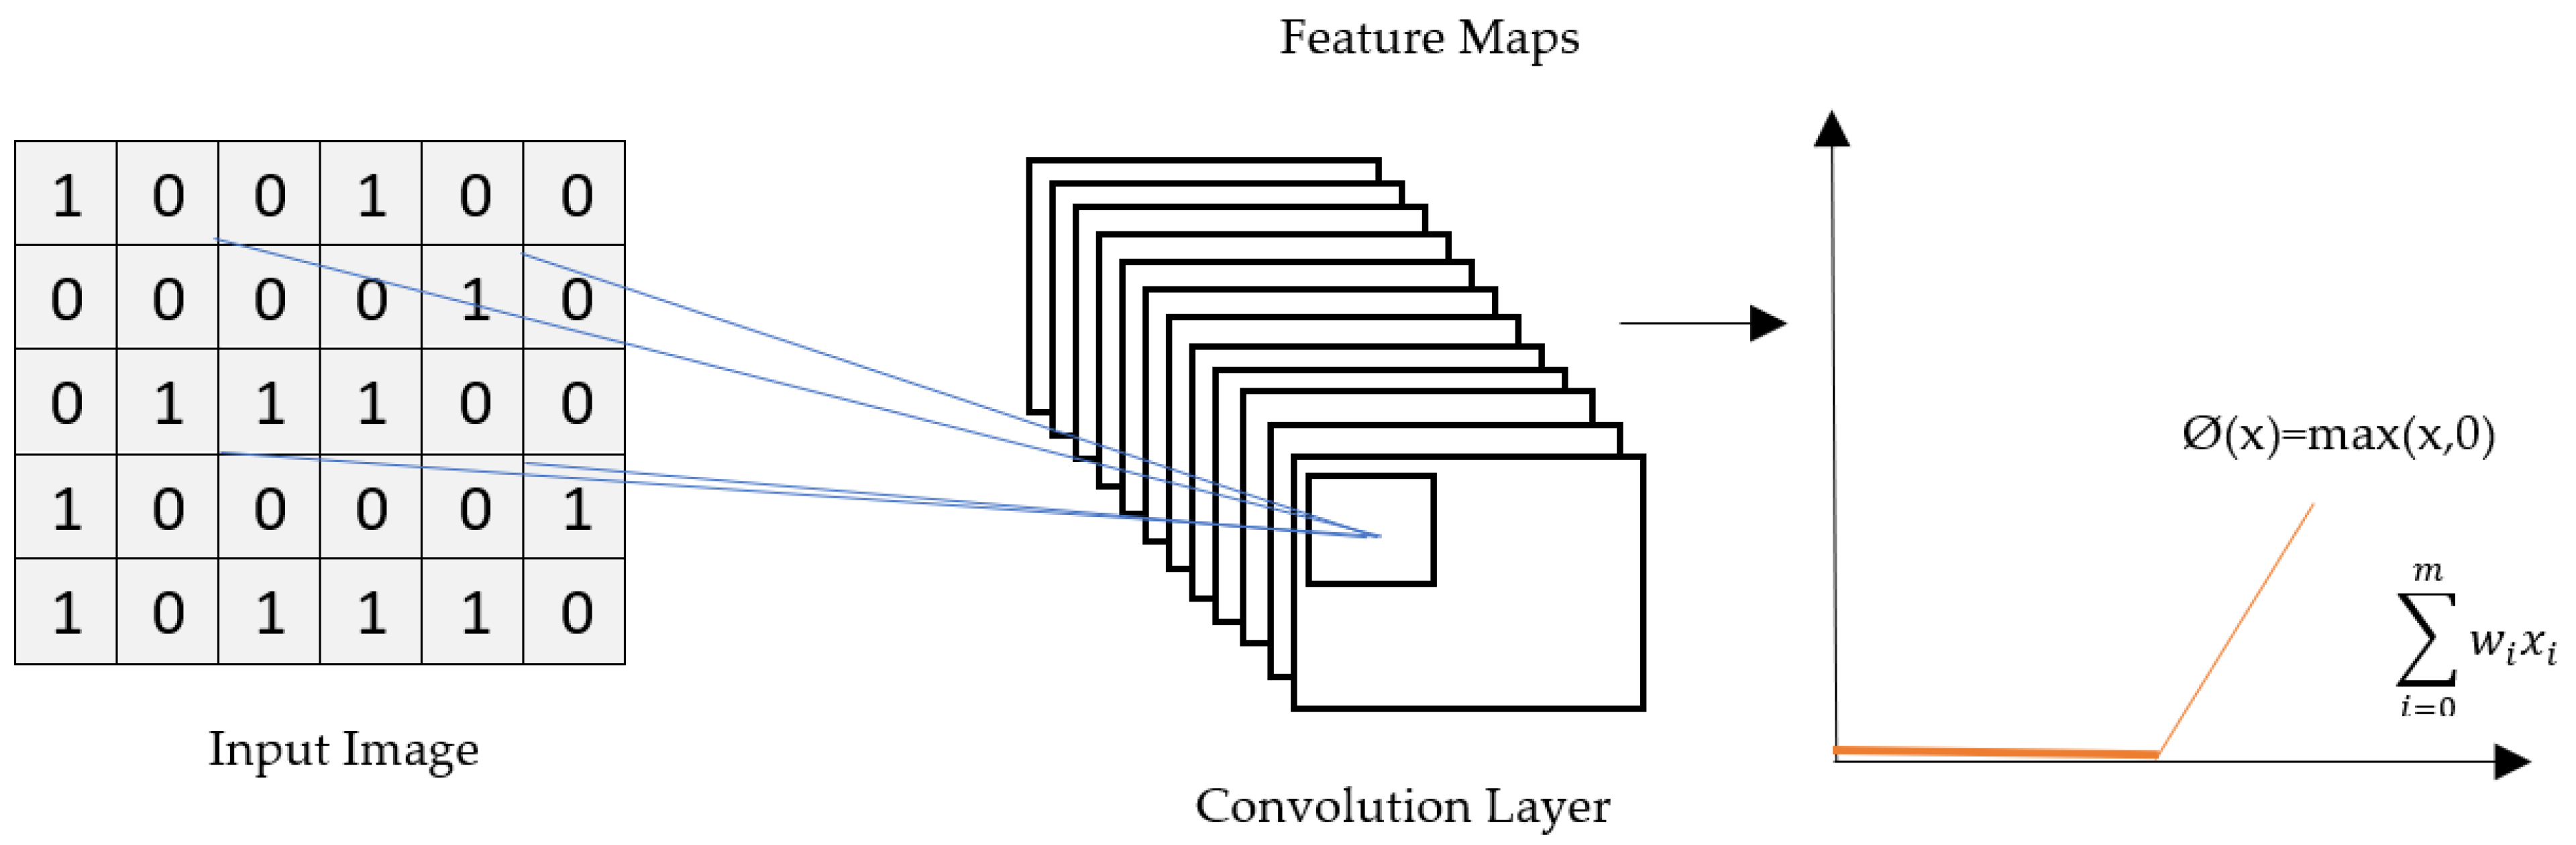
3.3. Convolutional Neural Network
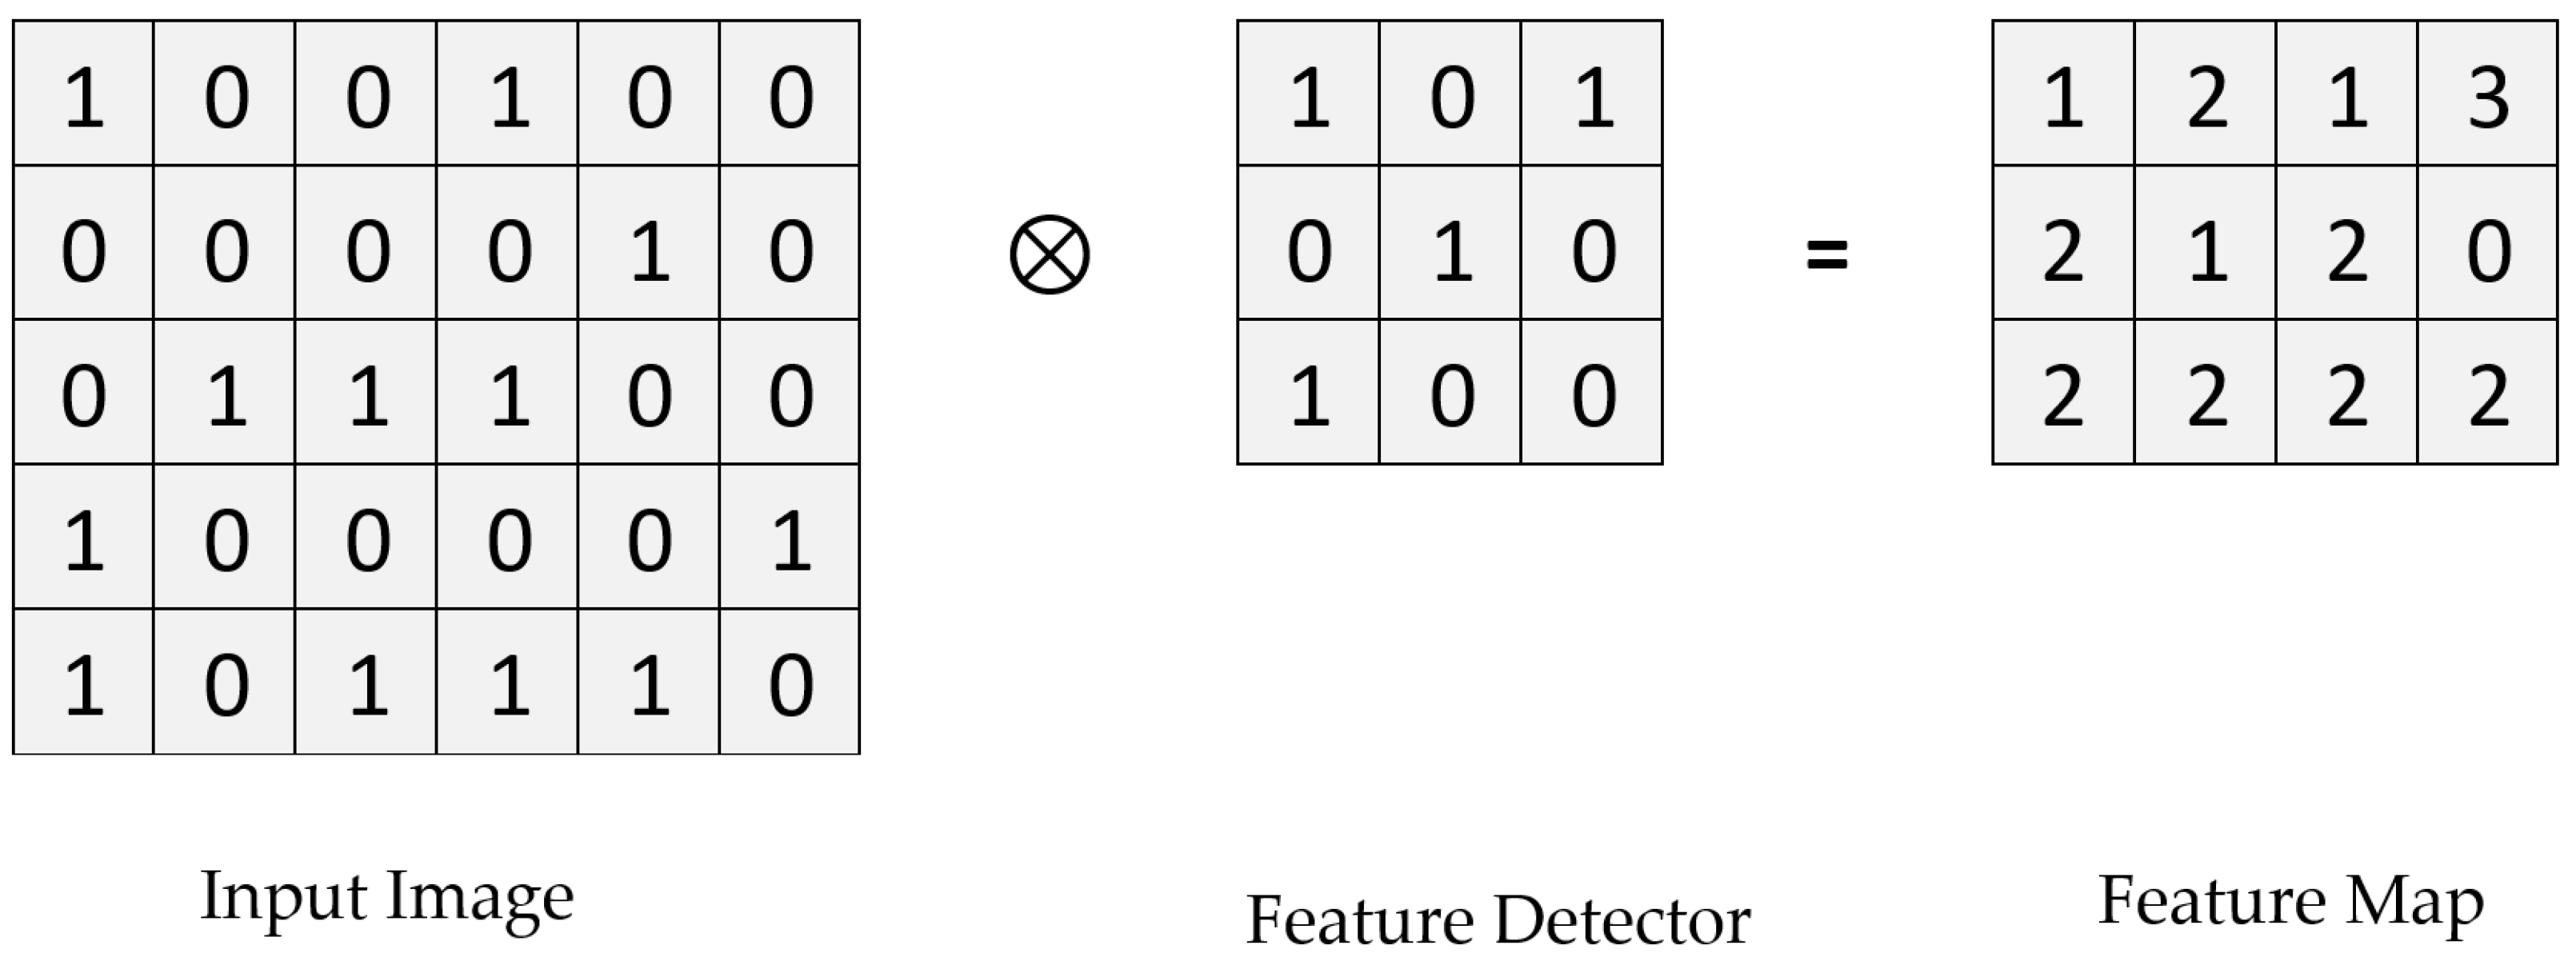
3.3.1. Convolution Layer
3.3.2. ReLU Layer
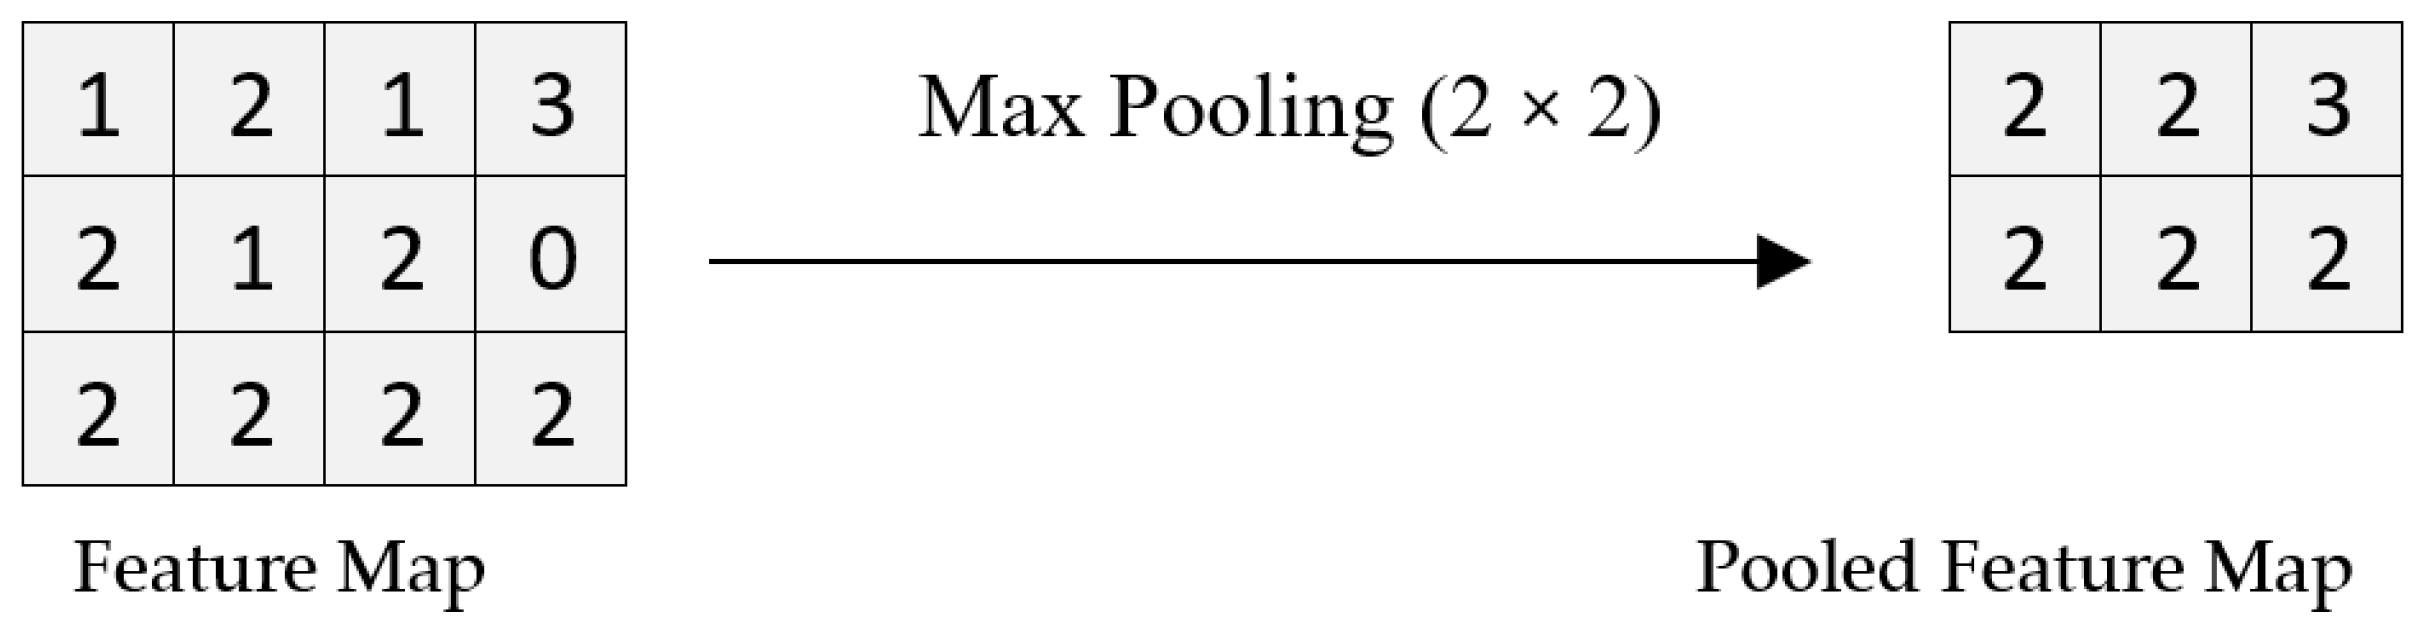
3.3.3. Pooling Layer
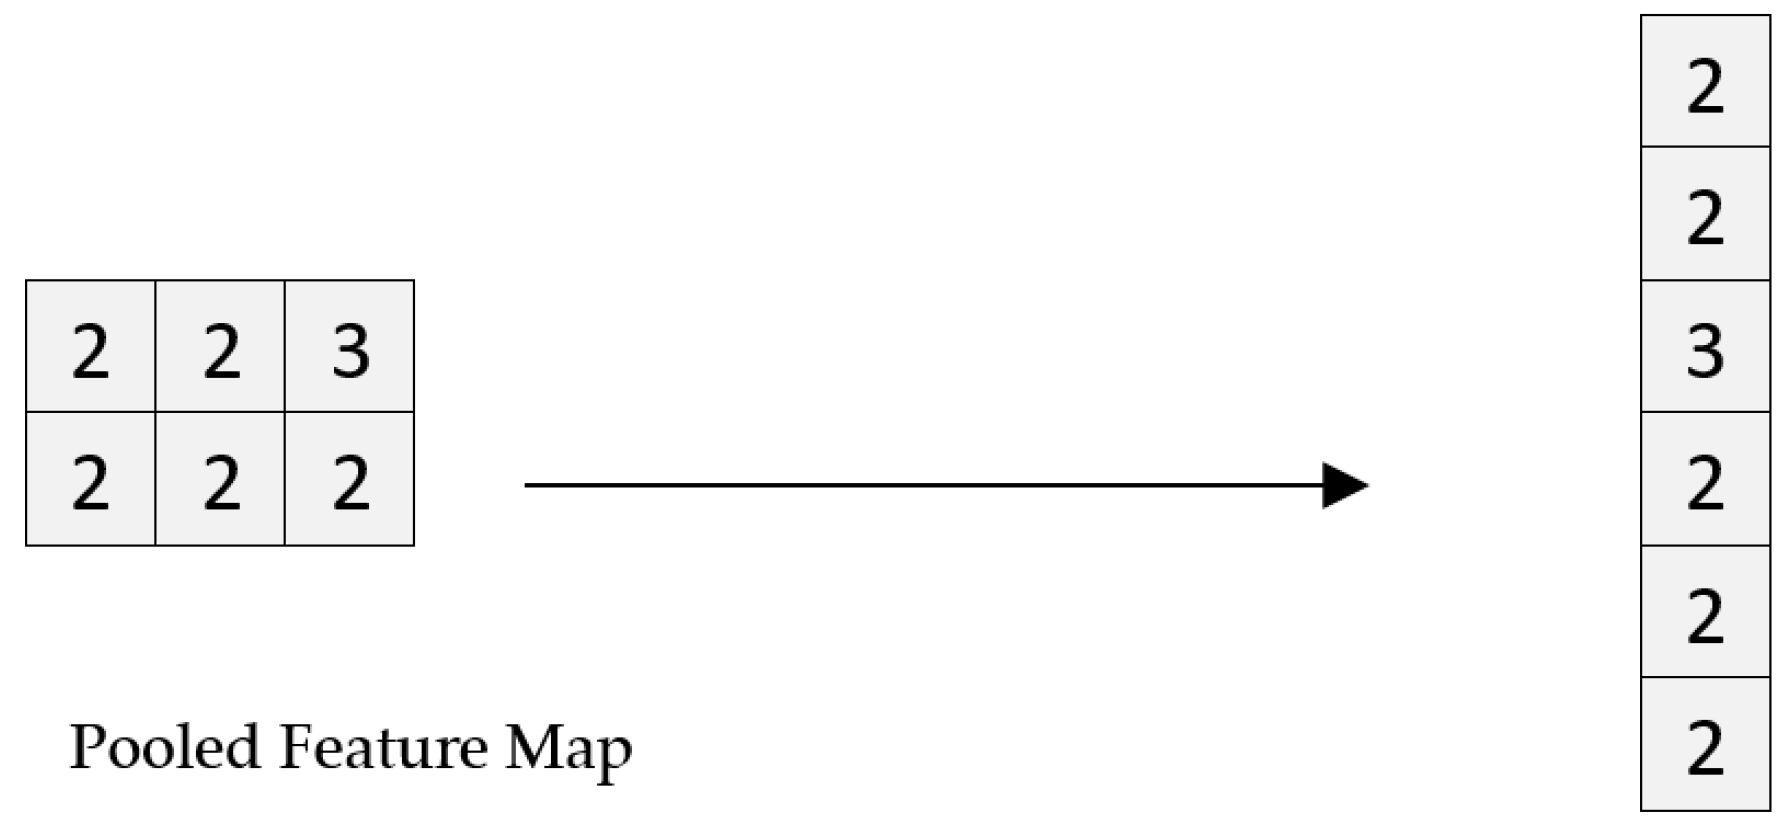
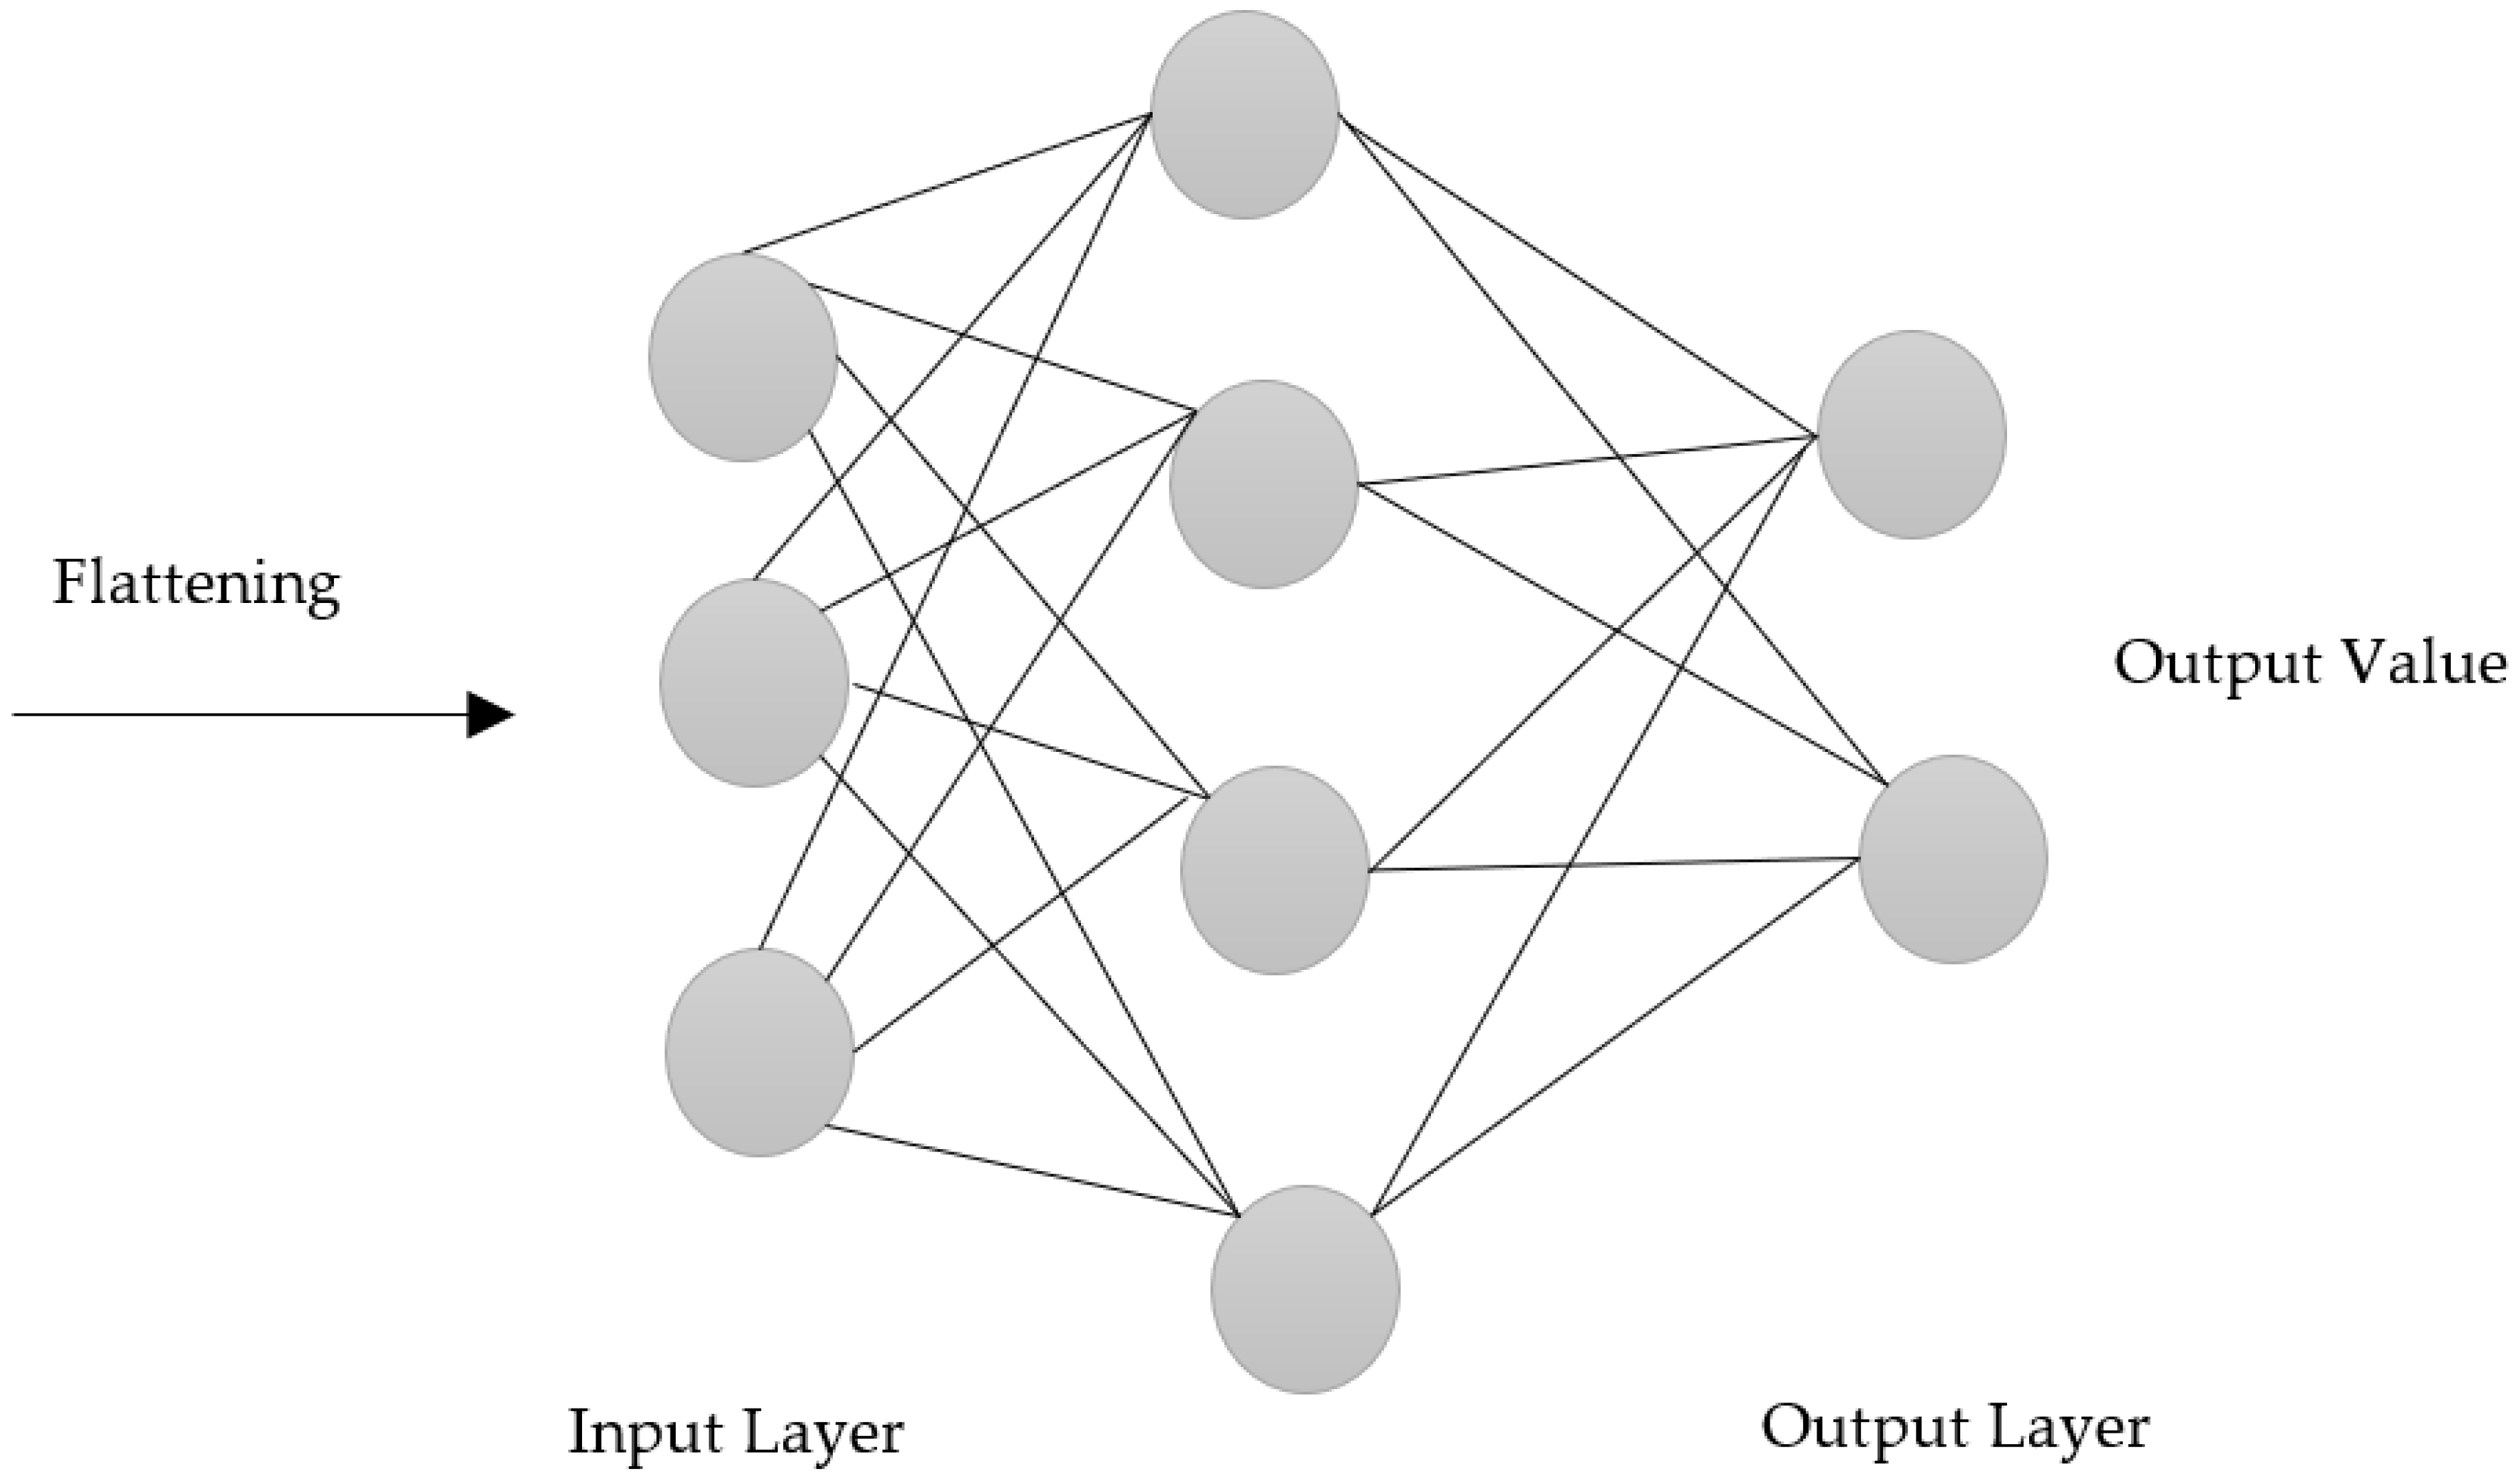
3.3.4. Flattening
3.3.5. Fully Connected Layer
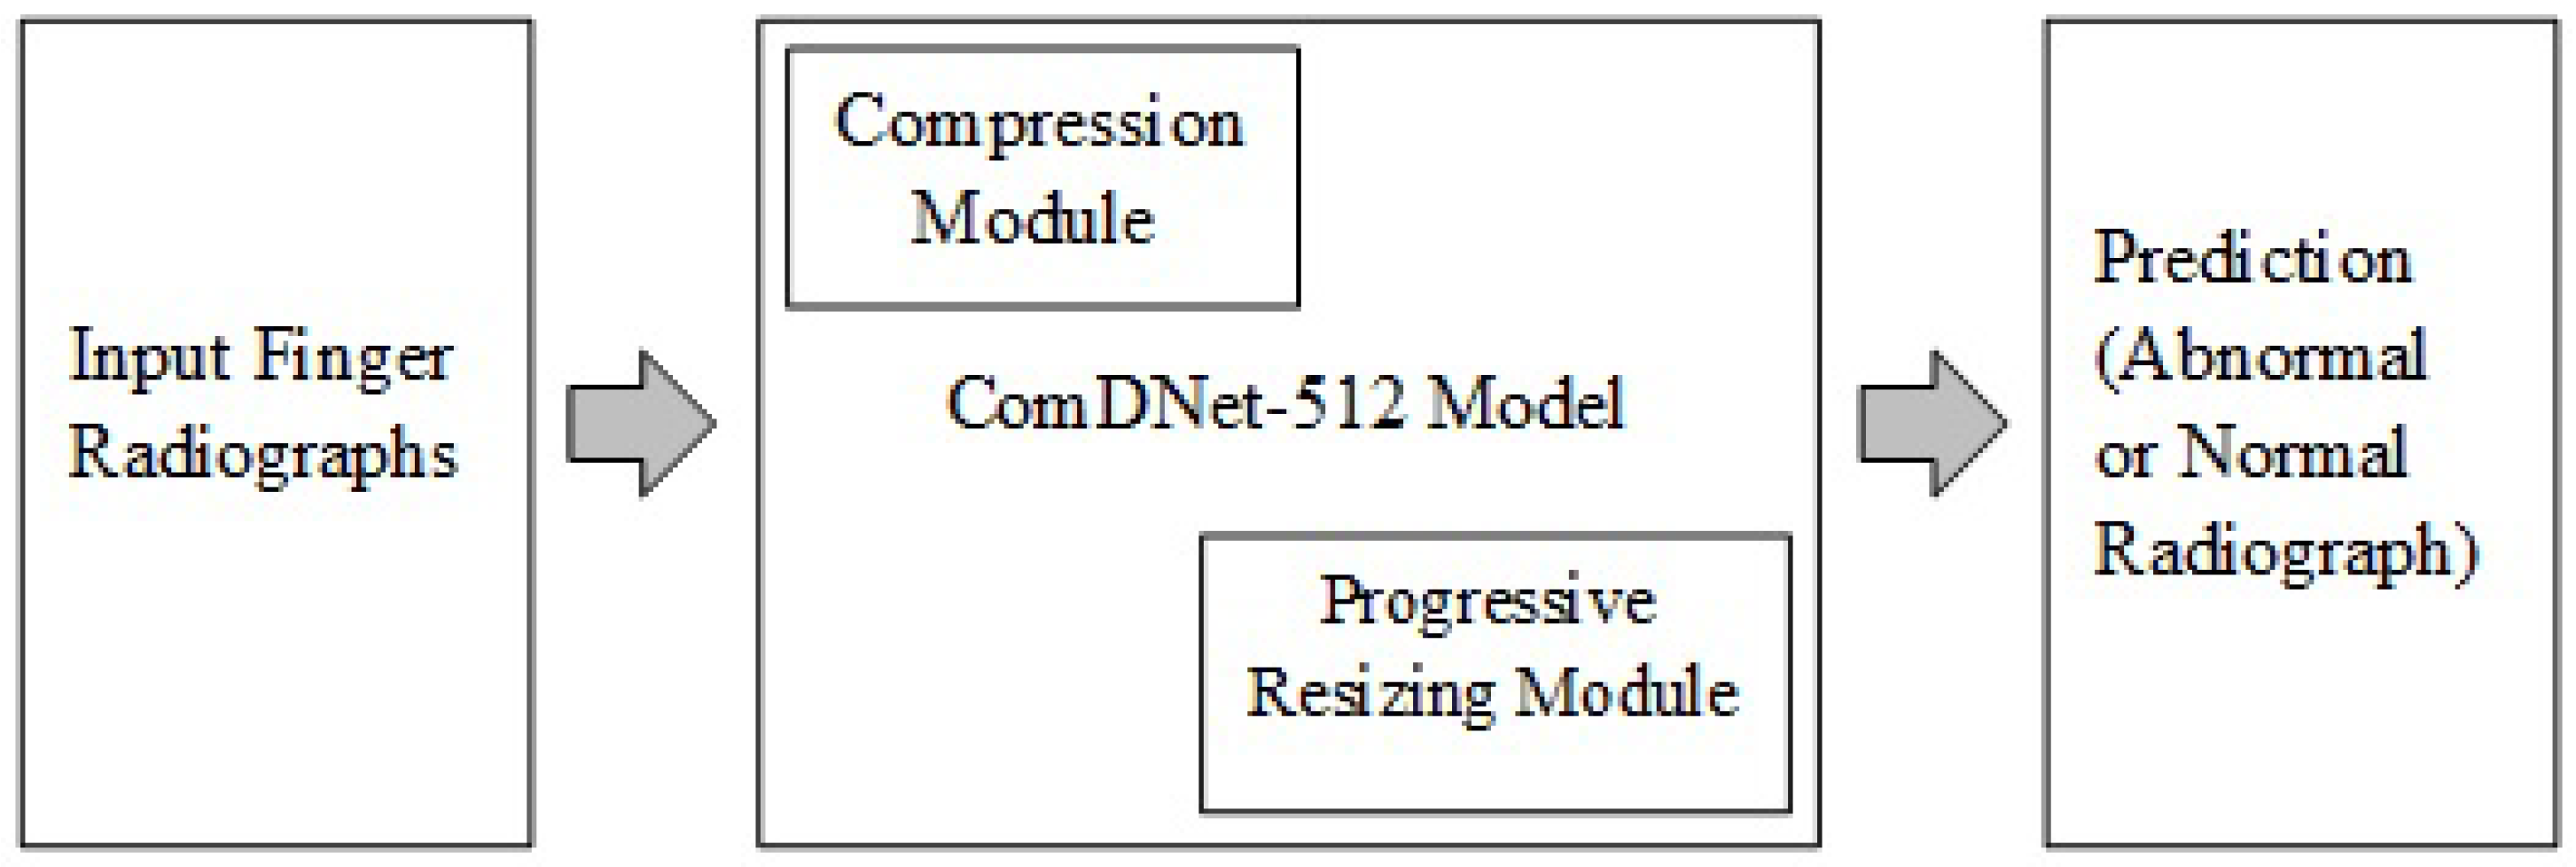
4. Proposed Model
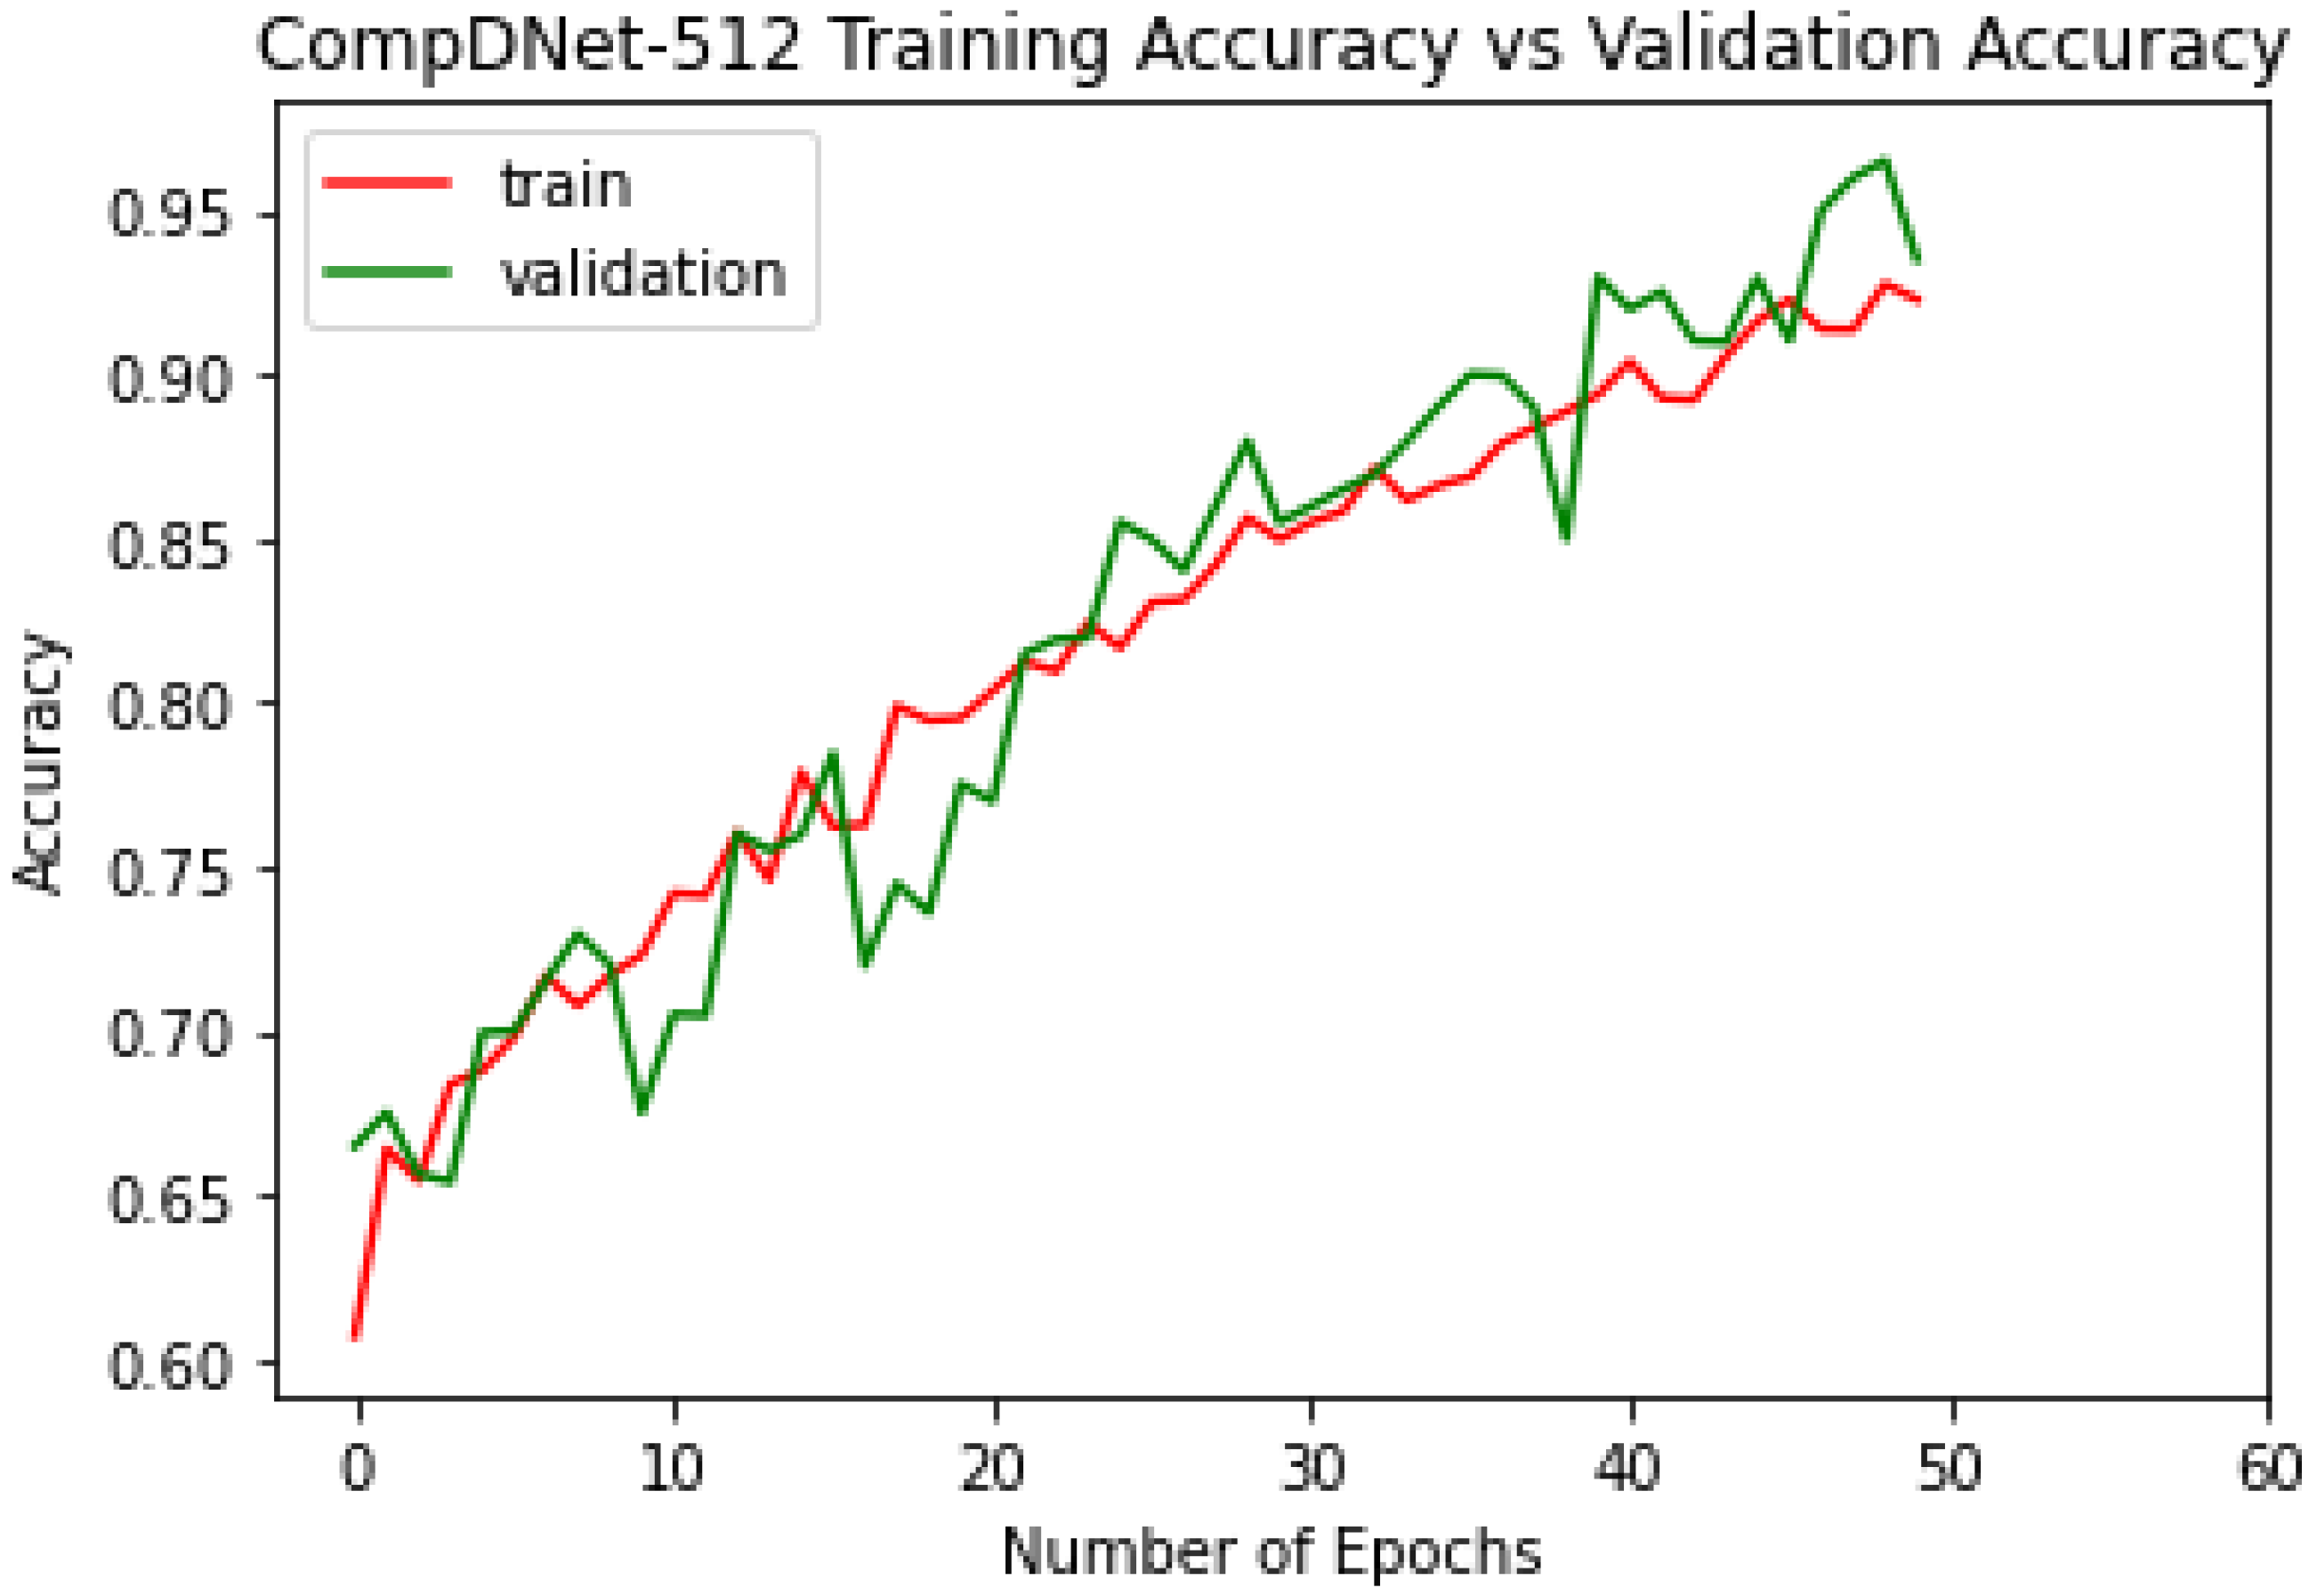
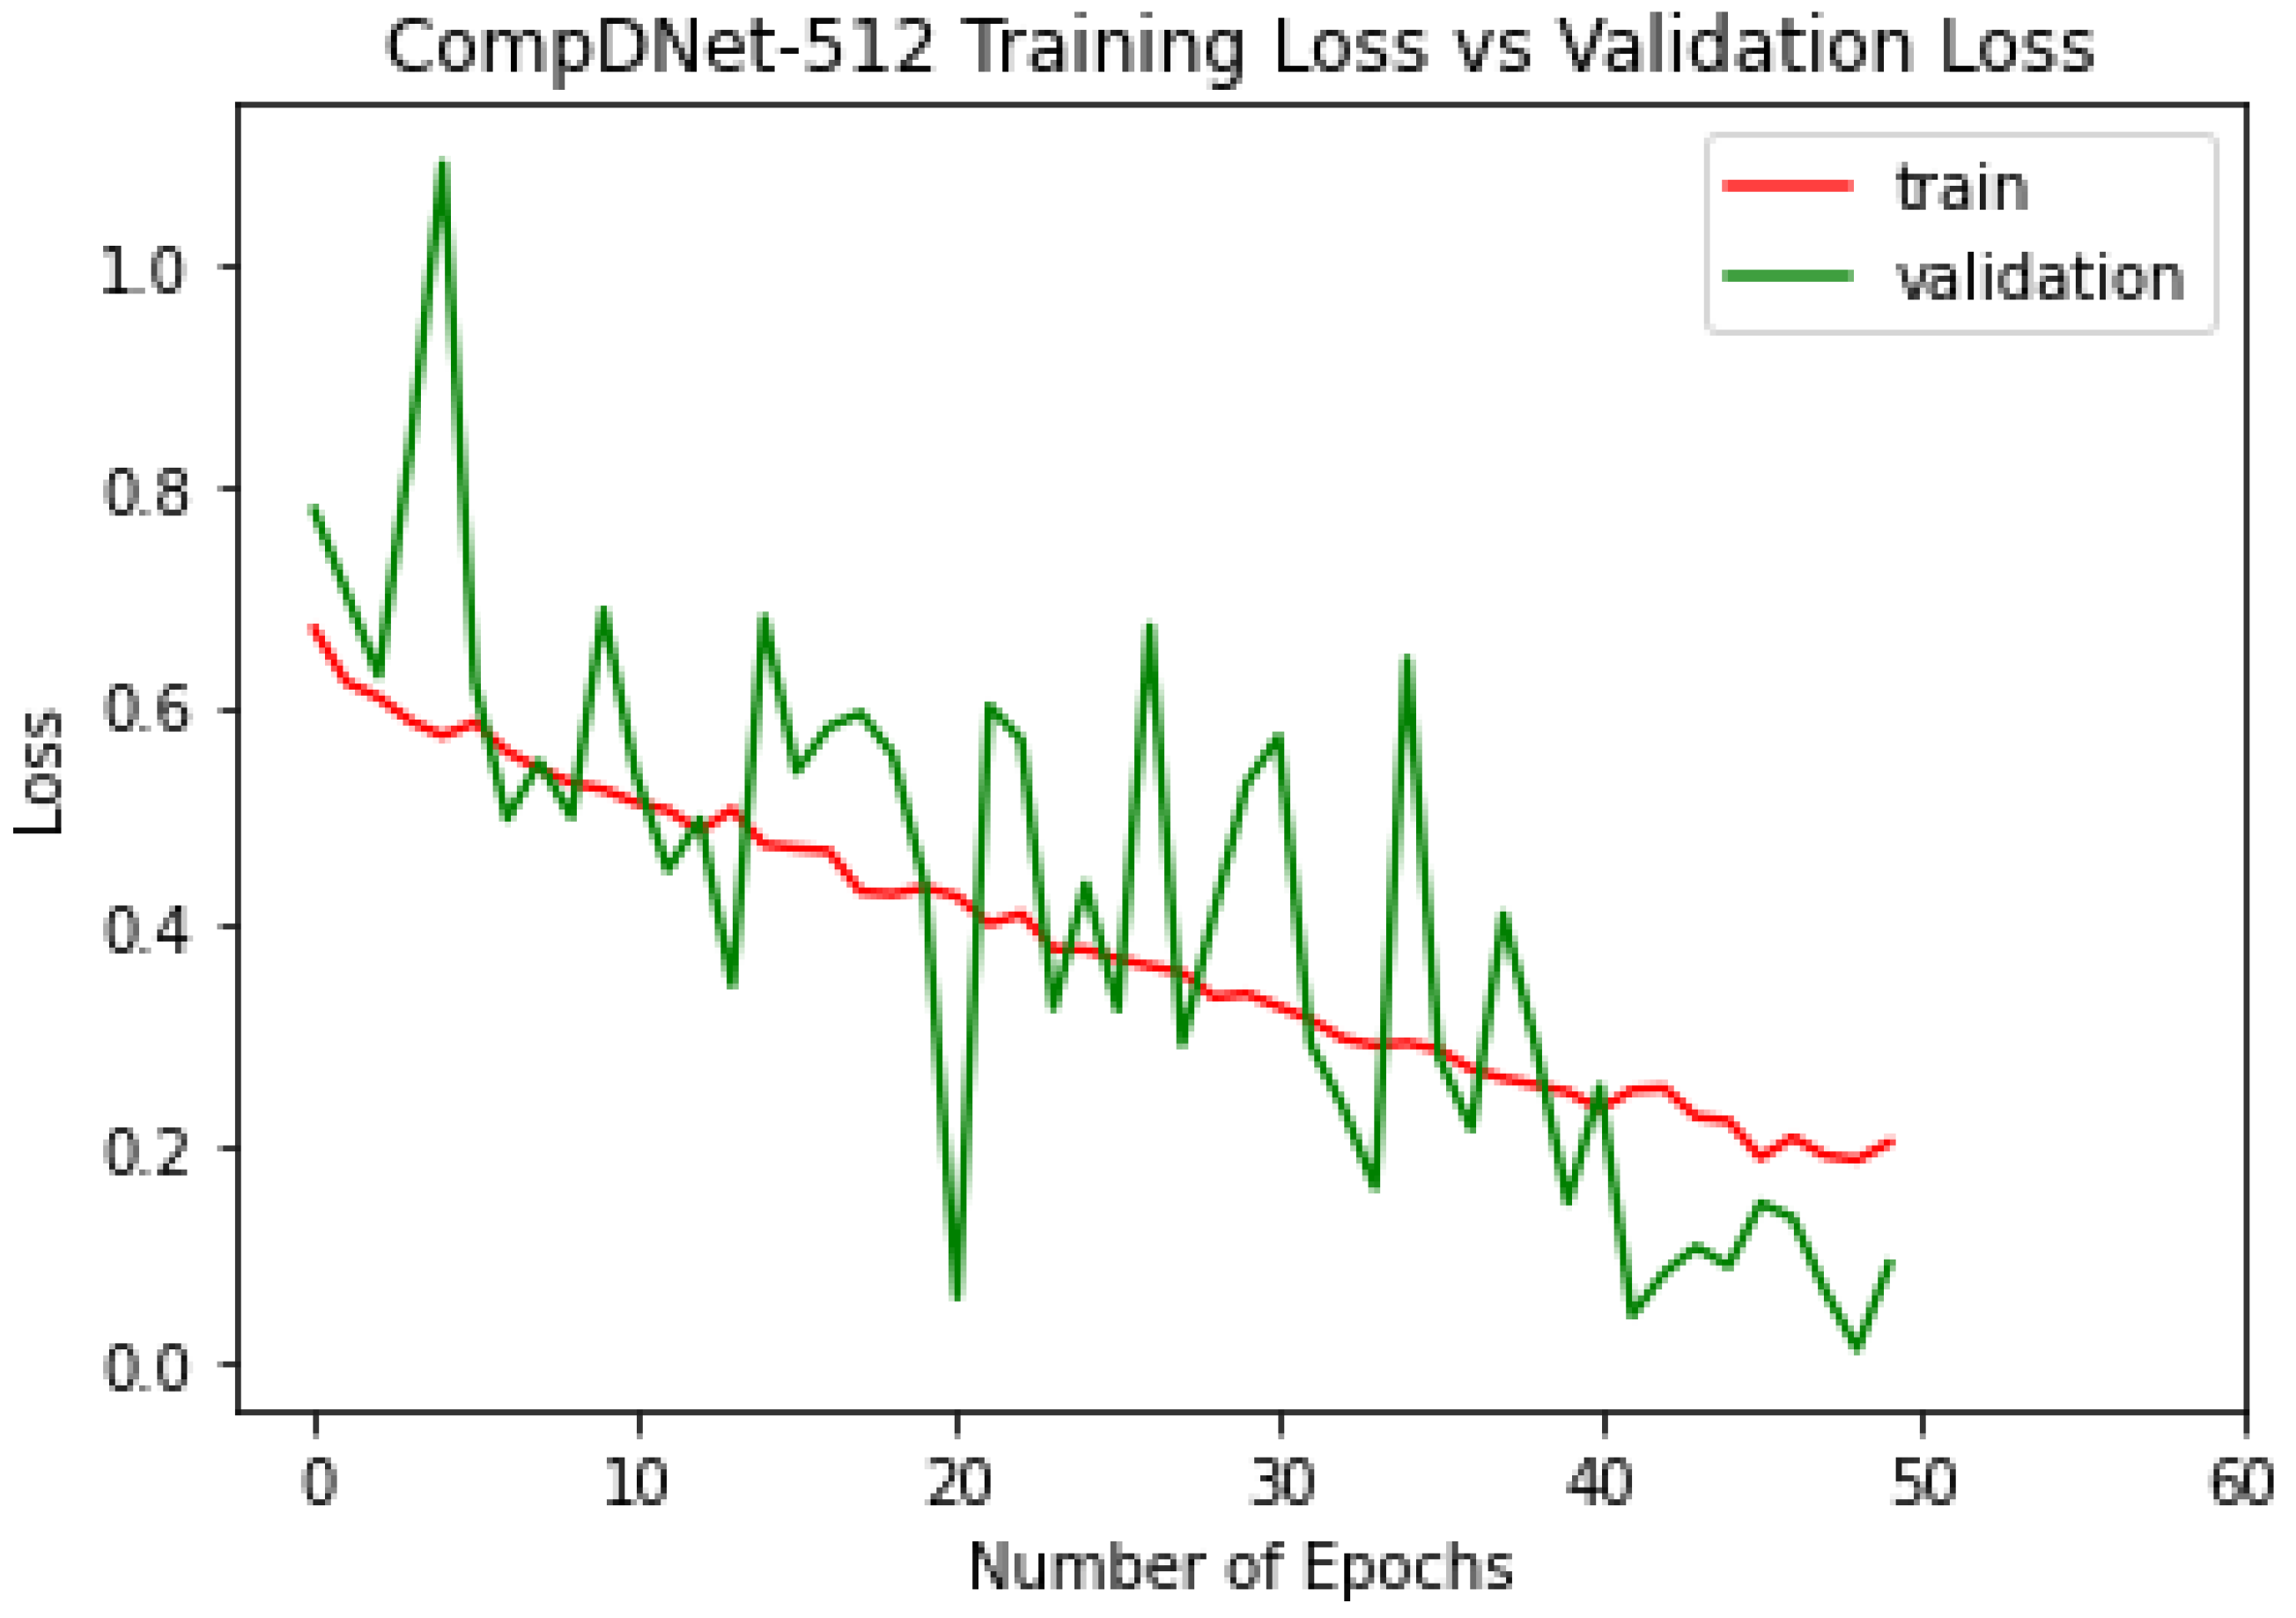
5. Experiment
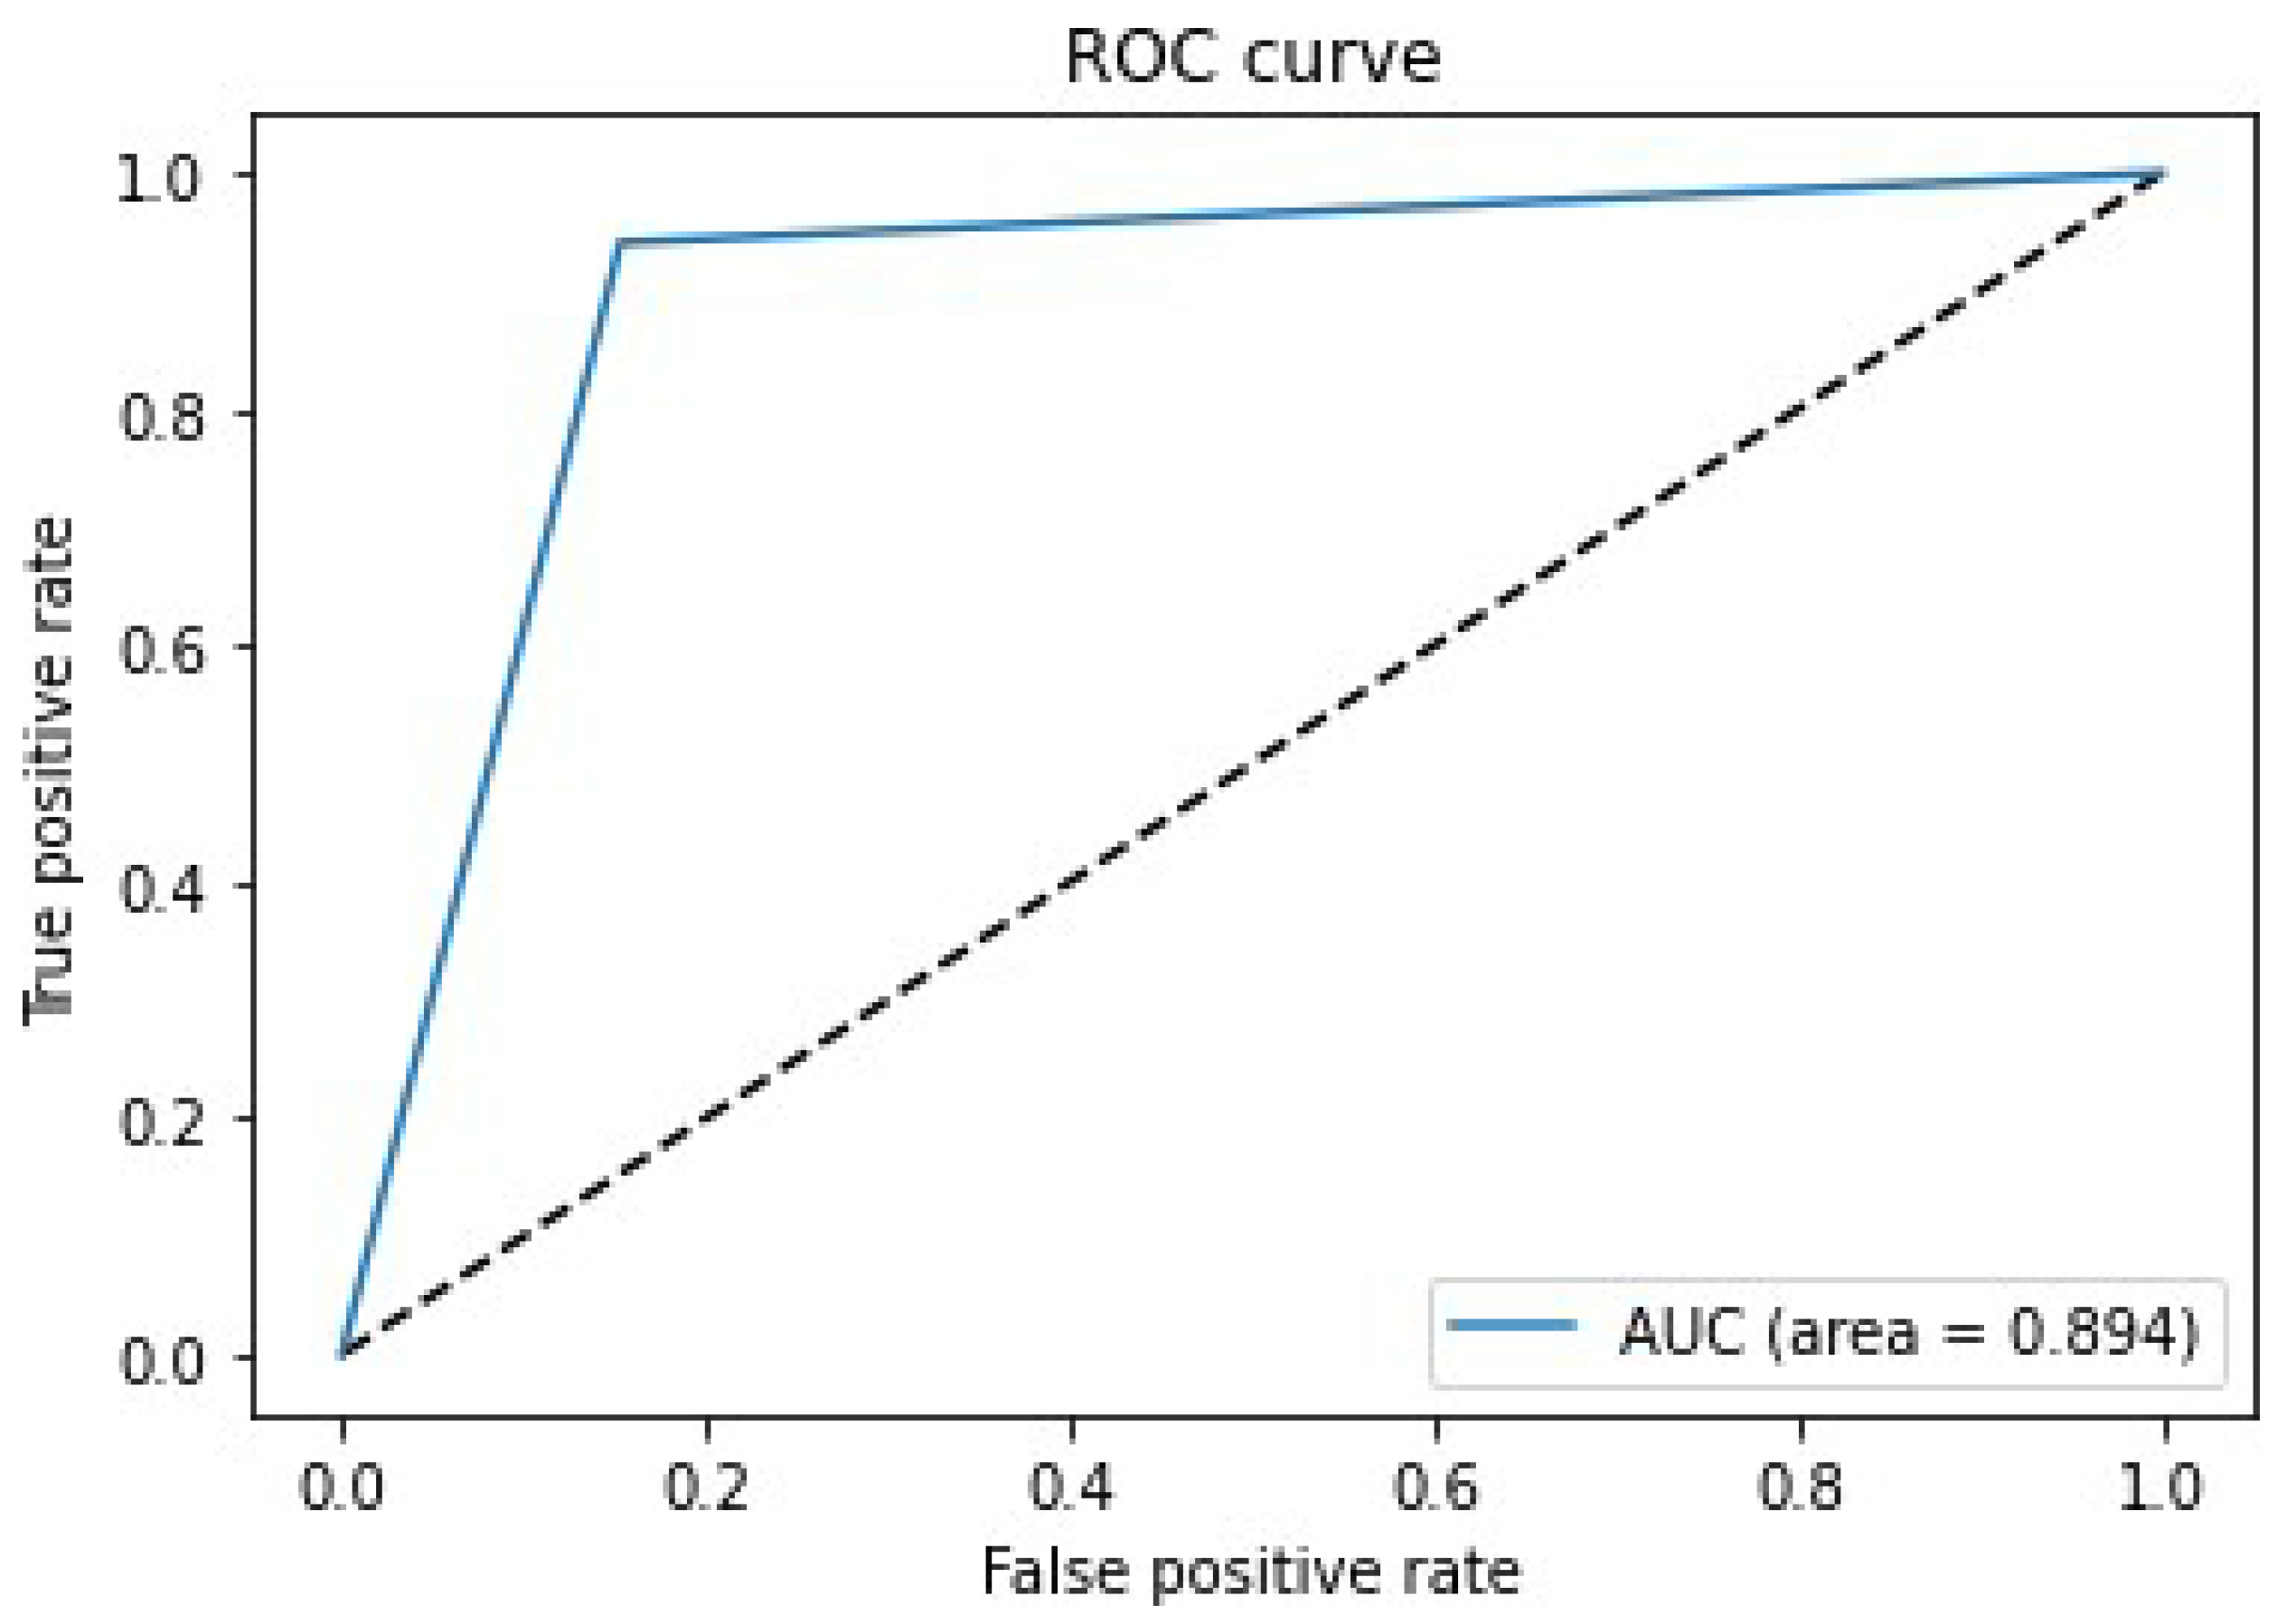
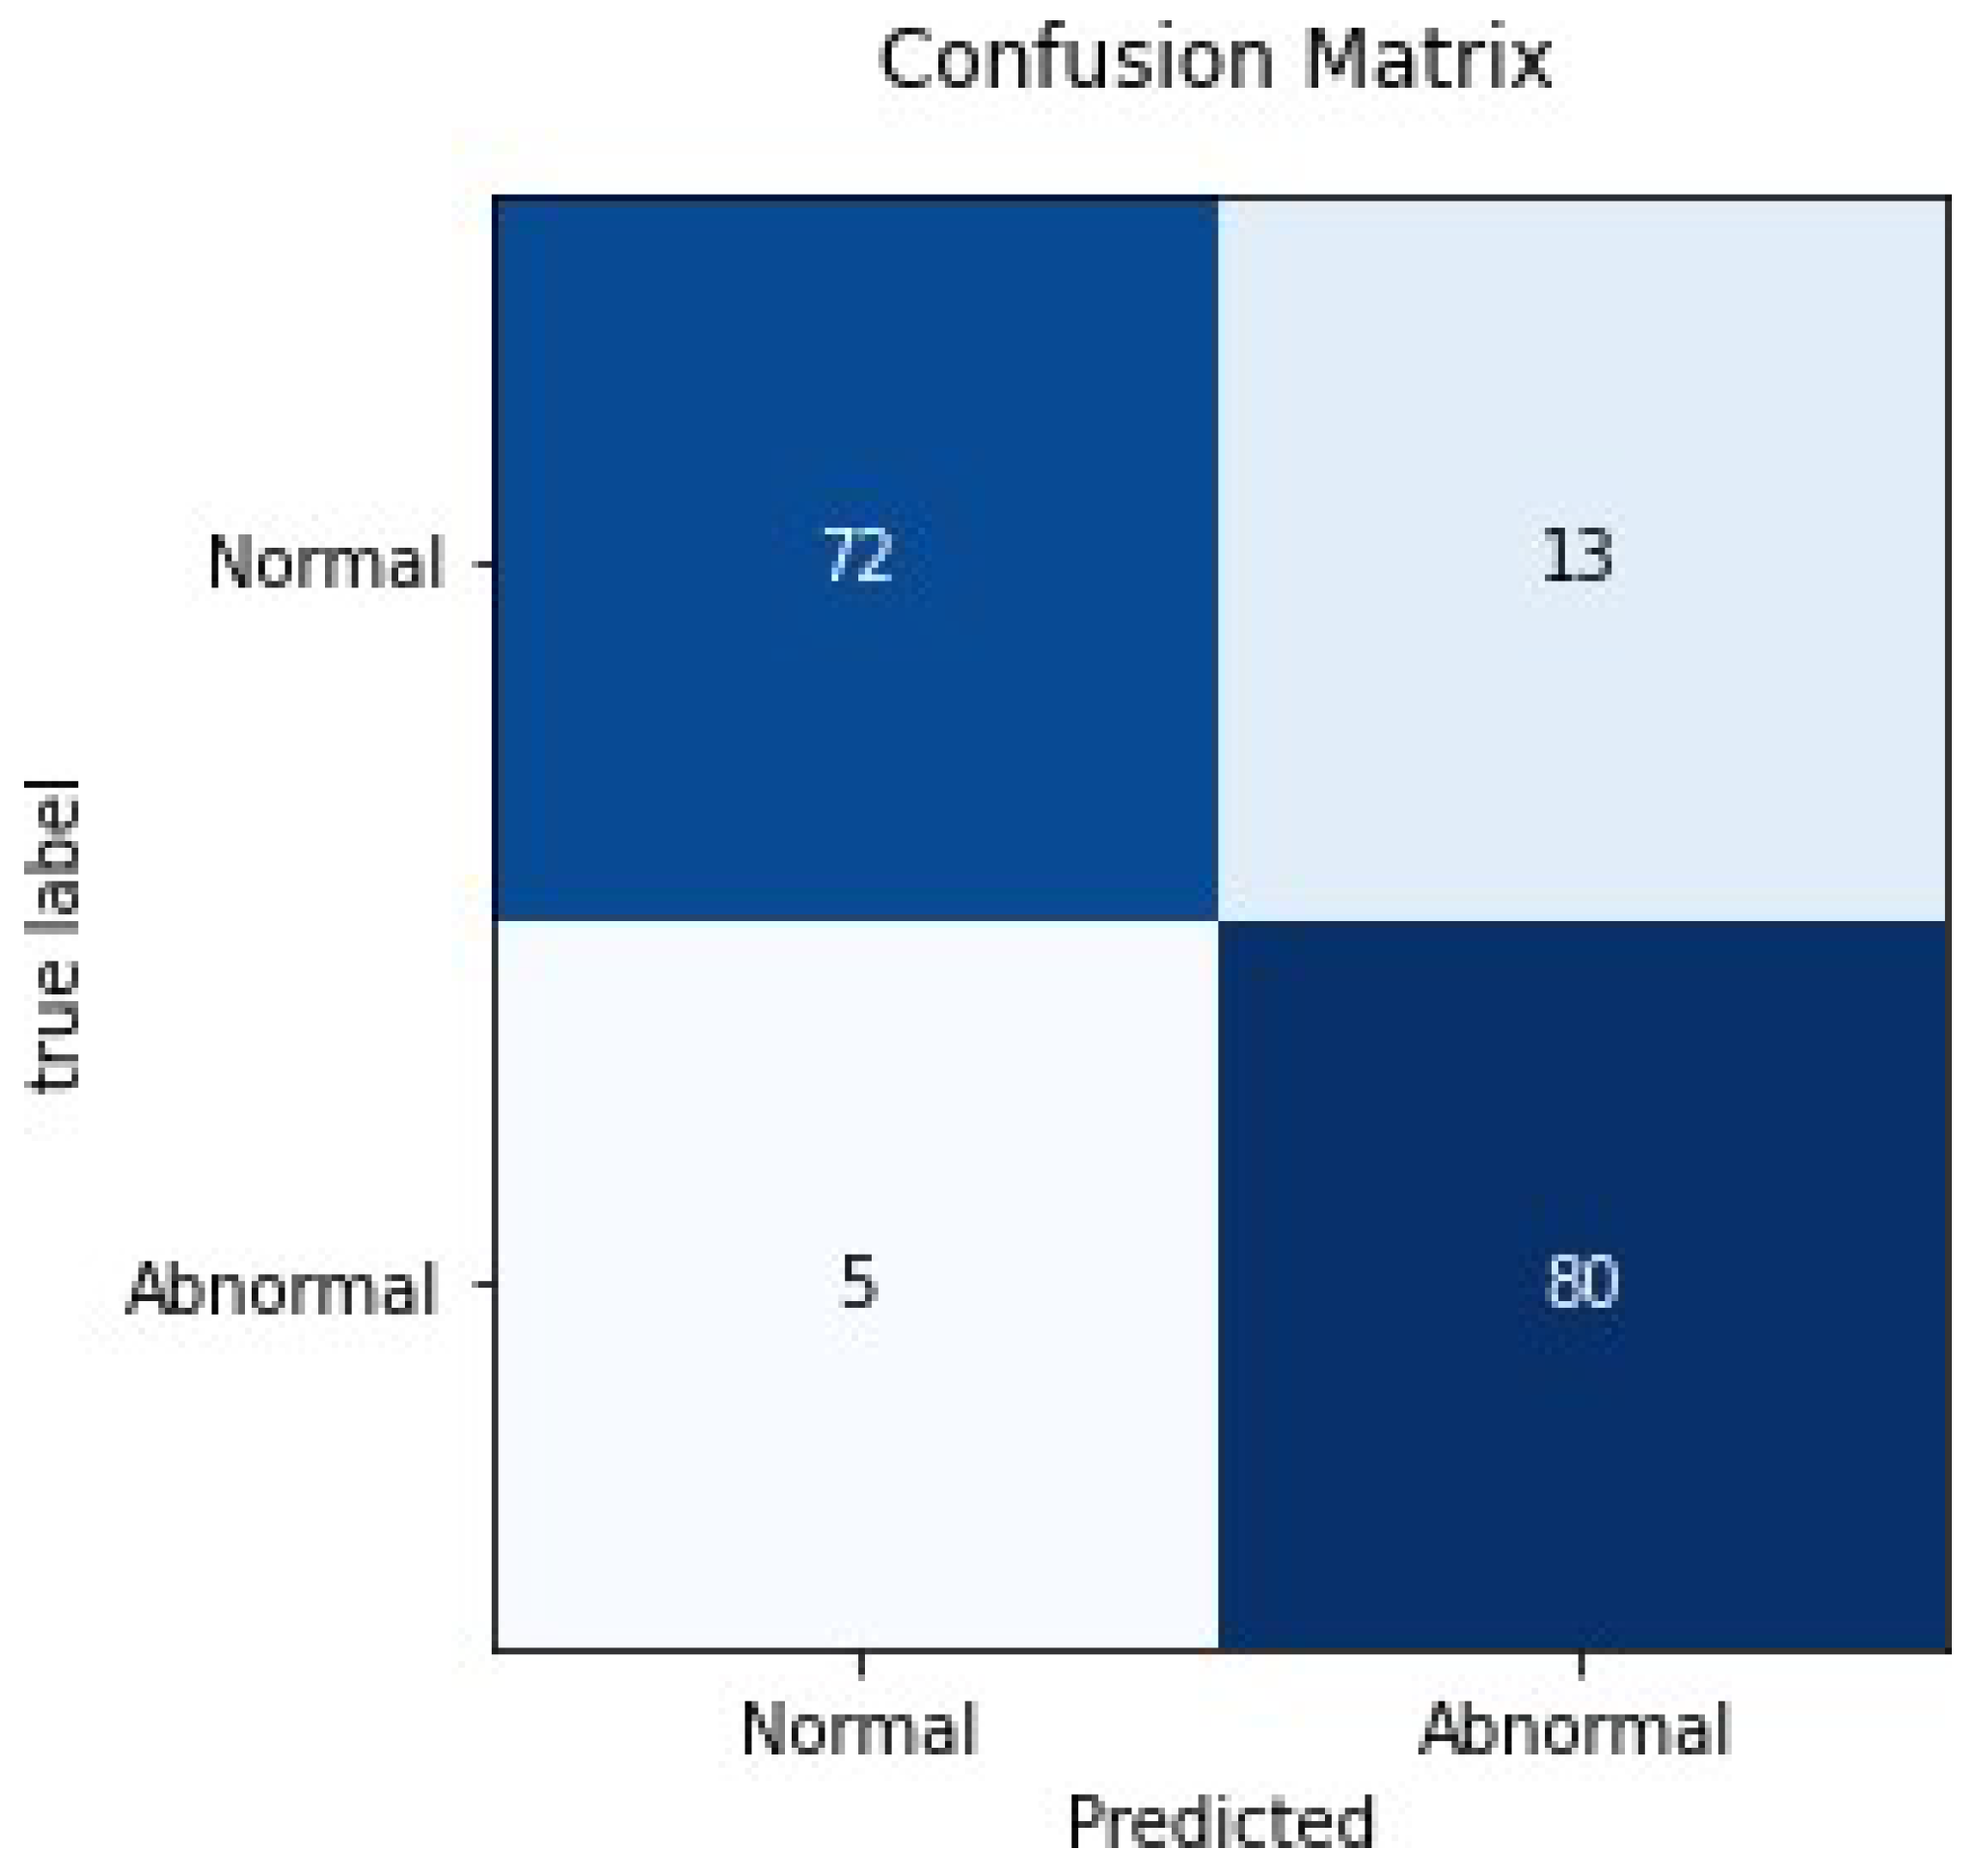
6. Results and Discussion
| True Positive (TP): | The original image was abnormal, and the model prediction was also abnormal. |
| False Negative (FN): | The original image was abnormal, but the model predicted it as normal. |
| True Negative (TN): | The original image was normal, and the model prediction was also normal. |
| False Positive (FP): | The original image was normal, but the model predicted it as abnormal. |
7. Conclusions and Future Scope
Author Contributions
Funding
Institutional Review Board Statement
Informed Consent Statement
Data Availability Statement
Conflicts of Interest
References
- Callahan, D. The WHO definition of health. Hastings Cent. Stud. 1973, 1, 77–87. [Google Scholar] [CrossRef] [PubMed]
- Senders, J.T.; Arnaout, O.; Karhade, A.V.; Dasenbrock, H.H.; Gormley, W.B.; Broekman, M.L.; Smith, T.R. Natural and artificial intelligence in neurosurgery: A systematic review. Neurosurgery 2018, 83, 181–192. [Google Scholar] [CrossRef] [PubMed] [Green Version]
- Brady, A.P. Error and discrepancy in radiology: Inevitable or avoidable? Insights Imaging 2017, 8, 171–182. [Google Scholar] [CrossRef] [Green Version]
- Harolds, J.A.; Parikh, J.R.; Bluth, E.I.; Dutton, S.C.; Recht, M.P. Burnout of radiologists: Frequency, risk factors, and remedies: A report of the ACR Commission on Human Resources. J. Am. Coll. Radiol. 2016, 13, 411–416. [Google Scholar] [CrossRef]
- Jiang, F.; Jiang, Y.; Zhi, H.; Dong, Y.; Li, H.; Ma, S.; Wang, Y.; Dong, Q.; Shen, H.; Wang, Y. Artificial intelligence in healthcare: Past, present and future. Stroke Vasc. Neurol. 2017, 21, 230–243. [Google Scholar] [CrossRef] [PubMed]
- Johnson, K.; Soto, J.T.; Glicksberg, B.; Shameer, K.; Miotto, R.; Ali, M.; Ashley, E.; Dudley, J.T. Artificial intelligence in cardiology. J. Am. Coll. Cardiol. 2018, 71, 2668–2679. [Google Scholar] [CrossRef]
- Murdoch, T.B.; Detsky, A.S. The inevitable application of big data to health care. JAMA 2013, 309, 1351–1352. [Google Scholar] [CrossRef]
- Administration UFaD. Guidance for Industry: Electronic Source Data in Clinical Investigations. 2013. Available online: https://www.fda.gov/downloads/drugs/guidances/ucm328691.pdf (accessed on 1 June 2017).
- He, J.; Baxter, S.L.; Xu, J.; Xu, J.; Zhou, X.; Zhang, K. The practical implementation of artificial intelligence technologies in medicine. Nat. Med. 2019, 25, 30–36. [Google Scholar] [CrossRef]
- Tang, A.; Tam, R.; Cadrin-Chênevert, A.; Guest, W.; Chong, J.; Barfett, J.; Chepelev, L.; Cairns, R.; Mitchell, J.R.; Cicero, M.D.; et al. Canadian Association of Radiologists White Paper on Artificial Intelligence in Radiology. Can. Assoc. Radiol. J. 2018, 69, 120–135. [Google Scholar] [CrossRef] [Green Version]
- Kermany, D.S.; Goldbaum, M.; Cai, W.; Valentim, C.C.S.; Liang, H.; Baxter, S.L.; McKeown, A.; Yang, G.; Wu, X.; Yan, F.; et al. Identifying Medical Diagnoses and Treatable Diseases by Image-Based Deep Learning. Cell 2018, 172, 1122–1131.e9. [Google Scholar] [CrossRef]
- Coppola, F.; Giannini, V.; Gabelloni, M.; Panic, J.; Defeudis, A.; Monaco, S.L.; Cattabriga, A.; Cocozza, M.; Pastore, L.; Polici, M.; et al. Radiomics and Magnetic Resonance Imaging of Rectal Cancer: From Engineering to Clinical Practice. Diagnostics 2021, 11, 756. [Google Scholar] [CrossRef] [PubMed]
- Scapicchio, C.; Gabelloni, M.; Barucci, A.; Cioni, D.; Saba, L.; Neri, E. A deep look into radiomics. Radiol. Med. 2021, 126, 1296–1311. [Google Scholar] [CrossRef]
- Coppola, F.; Faggioni, L.; Gabelloni, M.; De Vietro, F.; Mendola, V.; Cattabriga, A.; Cocozza, M.A.; Vara, G.; Piccinino, A.; Monaco, S.L.; et al. Human, All Too Human? An All-Around Appraisal of the “Artificial Intelligence Revolution” in Medical Imaging. Front. Psychol. 2021, 12, 4296. [Google Scholar] [CrossRef] [PubMed]
- Grace, K.; Salvatier, J.; Dafoe, A.; Zhang, B.; Evans, O. When will AI exceed human performance Evidence from AI experts. J. Artif. Intell. Res. 2018, 62, 729–754. [Google Scholar] [CrossRef]
- LeCun, Y.; Bengio, Y.; Hinton, G. Deep learning. Nature 2015, 521, 436–444. [Google Scholar] [CrossRef]
- Huang, G.; Liu, Z.; Van Der Maaten, L.; Weinberger, K.Q. Densely connected convolutional networks. In Proceedings of the IEEE Conference on Computer Vision and Pattern Recognition, Honolulu, HI, USA, 21–26 July 2017; pp. 4700–4708. [Google Scholar]
- Mura Dataset. Available online: https://stanfordmlgroup.github.io/competitions/mura/ (accessed on 24 September 2021).
- Rajpurkar, P.; Irvin, J.; Bagul, A.; Ding, D.; Duan, T.; Mehta, H.; Yang, B.; Zhu, K.; Laird, D.; Ball, R.L.; et al. Mura: Large dataset for abnormality detection in musculoskeletal radiographs. arXiv 2017, arXiv:1712.06957. [Google Scholar]
- Chada, G. Machine learning models for abnormality detection in musculoskeletal radiographs. Reports 2019, 2, 26. [Google Scholar] [CrossRef] [Green Version]
- Varma, M.; Lu, M.; Gardner, R.; Dunnmon, J.; Khandwala, N.; Rajpurkar, P.; Long, J.; Beaulieu, C.; Shpanskaya, K.; Fei-Fei, L.; et al. Automated abnormality detection in lower extremity radiographs using deep learning. Nat. Mach. Intell. 2019, 1, 578–583. [Google Scholar] [CrossRef]
- Mondol, T.C.; Iqbal, H.; Hashem, M. Deep CNN-based ensemble CADx model for musculoskeletal abnormality detection from radiographs. In Proceedings of the 2019 5th International Conference on Advances in Electrical Engineering, Dhaka, Bangladesh, 26–28 September 2019; IEEE: Piscataway, NJ, USA, 2019; pp. 392–397. [Google Scholar]
- Teeyapan, K. Abnormality Detection in Musculoskeletal Radiographs using EfficientNets. In Proceedings of the of the 24th International Computer Science and Engineering Conference, Bangkok, Thailand, 3–4 December 2020; pp. 1–6. [Google Scholar]
- El-Saadawy, H.; Tantawi, M.; Shedeed, H.A.; Tolba, M.F. A Hybrid Two-Stage GNG–Modified VGG Method for Bone X-rays Classification and Abnormality Detection. IEEE Access 2021, 9, 76649–76661. [Google Scholar] [CrossRef]
- He, M.; Wang, X.; Zhao, Y. A calibrated deep learning ensemble for abnormality detection in musculoskeletal radiographs. Sci. Rep. 2021, 11, 1–11. [Google Scholar] [CrossRef]
- Aziz, A.Z.B.; Hasan, M.; Mehedi, A.; Shin, J. Deep Transfer Learning-Based Musculoskeletal Abnormality Detection 2021. In Proceedings of International Joint Conference on Advances in Computational Intelligence; Springer: Singapore, 2021; pp. 191–201. [Google Scholar]
- Kumar, Y.; Kaur, K.; Singh, G. Machine learning aspects and its applications towards different research areas. In Proceedings of the 2020 International Conference on Computation, Automation and Knowledge Management (ICCAKM), Dubai, United Arab Emirates, 9–10 January 2020; pp. 150–156. [Google Scholar]
- Singh, G.; Anand, D. CompDNet-512: Hybrid Deep Learning Architecture for Prediction of COVID-19. In Proceedings of the 2021 3rd International Conference on Advances in Computing, Communication Control and Networking (ICAC3N), Greater Noida, India, 17–18 December 2021; IEEE: Piscataway, NJ, USA, 2021; pp. 2003–2007. [Google Scholar]
- Salgotra, R.; Singh, S.; Singh, U.; Saha, S.; Gandomi, A.H. COVID-19: Time series datasets India versus world. Mendeley Data, 2020. Available online: https://data.mendeley.com/datasets/tmrs92j7pv/23(accessed on 24 September 2021).
- Python. Available online: https://www.python.org/downloads/release/python-369/ (accessed on 24 September 2021).
- Ferroukhi, M.; Ouahabi, A.; Attari, M.; Habchi, Y.; Taleb-Ahmed, A. Medical video coding based on 2nd-generation wavelets: Performance evaluation. Electronics 2019, 8, 88. [Google Scholar] [CrossRef] [Green Version]
- Gurpreet, S.; Vinay, C. Design and Implementation of Testing Tool for Code Smell Rectification Using C-Mean Algorithm. Int. J. Adv. Res. Comput. Sci. 2013, 4, 108–114. [Google Scholar]
- Kingma, D.P.; Ba, J. Adam: A method for stochastic optimization. arXiv 2014, arXiv:1412.6980. [Google Scholar]
- Baldi, P.; Sadowski, P.J. Understanding dropout. In Proceedings of the 26th International Conference on Neural Information Processing Systems, Lake Tahoe, NV, USA, 5–10 December 2013; pp. 2814–2822. [Google Scholar]
- Shivangi, S.; Darpan, A. A novel digital signature algorithm based on biometric hash. Int. J. Comput. Netw. Inf. Secur. 2017, 9, 12. [Google Scholar]
- Anand, D.; Khemchandani, V. Data Security and Privacy Functions in Fog Computing for Healthcare 4.0. In Fog Data Analytics for IoT Applications; Springer: Singapore, 2020; pp. 387–420. [Google Scholar]
- Kaur, S.S.; Darpan, A. Smart Health Monitoring During Pandemic using Internet of Things. In Proceedings of the 2021 10th IEEE International Conference on Communication Systems and Network Technologies (CSNT), Bhopal, India, 24–25 April 2021; pp. 489–493. [Google Scholar]
- Kaur, S.S.; Darpan, A. Emotion Classification and Facial Key point detection using AI. In Proceedings of the 2021 2nd International Conference on Advances in Computing, Communication, Embedded and Secure Systems (ACCESS), Ernakulam, India, 2–4 September 2021; IEEE: Piscataway, NJ, USA, 2021; pp. 1–5. [Google Scholar]
- Darpan, A.; Aashish, K. IoT-Based Automated Healthcare System. In Advanced Healthcare Systems: Empowering Physicians with IoT-Enabled Technologies; John Wiley and Sons: Hoboken, NJ, USA, 2022; pp. 335–350. [Google Scholar]


| Target Disease | Description | Technique Used | Findings | Reference |
|---|---|---|---|---|
| Abnormality Detection in upper extremities in musculoskeletal radiographs | DenseNet-169 Baseline models were used to detect and localize abnormalities. | 169-layer CNN | The accuracy achieved by the model in the case of finger radiographs was 38.9% | [18] |
| Abnormality detection in humerus and finger radiograph. | DenseNet-169, DenseNet-201, and InceptionResNetV2 were implemented and evaluated on humerus and finger radiographs. | Deep Transfer Learning | The best accuracy achieved was 77.66% in finger radiographs. | [19] |
| Musculoskeletal disorder | Abnormality detection in lower extremity radiographs. | DenseNet-161 | With an AUROC of 0.88, it can be utilized to identify diverse abnormalities in lower extremity radiographs. | [20] |
| Abnormality detection in upper extremities in a musculoskeletal radiograph | They used VGG-19 ResNet architecture to build a model for four types of study (elbow, wrist, finger, and humerus). | Deep CNN | The highest accuracy achieved by the model was 82.13%. | [21] |
| Abnormality detection in upper extremities in a musculoskeletal radiograph | Use of deep learning model based on ensembles of Efficient-Net architecture to automate the detecting process. | Deep Transfer Learning of ImageNet. | The accuracy achieved by EfficientNet-B3 for finger radiograph was 85.5%. | [22] |
| Abnormality detection | Two-stage method for bone X-ray classification and abnormality detection. | Combining GNG Network and VGG model. | The highest accuracy achieved by the model was 78.51%. | [23] |
| Abnormality detection in upper extremities in a musculoskeletal radiograph | A new calibrated ensemble approach based on three deep neural networks for detecting musculoskeletal abnormalities. | Ensemble Learning approach (ConvNet, ResNet, and DenseNet) | The highest accuracy achieved by the model was 83%. | [24] |
| Abnormality detection in upper extremities in a musculoskeletal radiograph | They applied data augmentation resizing and cropping for data preprocessing and used an updated version of the pre-trained model DenseNet-169 for abnormality detection. | Deep Transfer Learning | The highest accuracy achieved by the model was 67.05%. | [25] |
| Training Set | Validation Set | Test Set | |||
|---|---|---|---|---|---|
| Normal | Abnormal | Normal | Abnormal | Normal | Abnormal |
| 3000 | 3000 | 1000 | 1000 | 85 | 85 |
| Filter Size | Training Accuracy | Loss | Validation Accuracy | Loss |
|---|---|---|---|---|
| 32 × 32 | 84.32 | 0.33 | 86.45 | 0.32 |
| 64 × 64 | 88.92 | 0.25 | 92.51 | 0.25 |
| 128 × 128 | 92.28 | 0.20 | 93.51 | 0.09 |
| Accuracy | Precision | Recall | F1 Score | Kappa Value |
|---|---|---|---|---|
| 89.41 | 0.82 | 0.97 | 0.89 | 0.74 |
Publisher’s Note: MDPI stays neutral with regard to jurisdictional claims in published maps and institutional affiliations. |
© 2022 by the authors. Licensee MDPI, Basel, Switzerland. This article is an open access article distributed under the terms and conditions of the Creative Commons Attribution (CC BY) license (https://creativecommons.org/licenses/by/4.0/).
Share and Cite
Singh, G.; Anand, D.; Cho, W.; Joshi, G.P.; Son, K.C. Hybrid Deep Learning Approach for Automatic Detection in Musculoskeletal Radiographs. Biology 2022, 11, 665. https://doi.org/10.3390/biology11050665
Singh G, Anand D, Cho W, Joshi GP, Son KC. Hybrid Deep Learning Approach for Automatic Detection in Musculoskeletal Radiographs. Biology. 2022; 11(5):665. https://doi.org/10.3390/biology11050665
Chicago/Turabian StyleSingh, Gurpreet, Darpan Anand, Woong Cho, Gyanendra Prasad Joshi, and Kwang Chul Son. 2022. "Hybrid Deep Learning Approach for Automatic Detection in Musculoskeletal Radiographs" Biology 11, no. 5: 665. https://doi.org/10.3390/biology11050665
APA StyleSingh, G., Anand, D., Cho, W., Joshi, G. P., & Son, K. C. (2022). Hybrid Deep Learning Approach for Automatic Detection in Musculoskeletal Radiographs. Biology, 11(5), 665. https://doi.org/10.3390/biology11050665