Article

Commercial Potential of the Cyanobacterium Arthrospira maxima: Physiological and Biochemical Traits and the Purification of Phycocyanin

1
Development & Planning Office, Ghent University Global Campus, 119-5, Songdomunhwa-ro, Incheon 21985, Korea
2
Laboratory of Plant Growth Analysis, Ghent University Global Campus, 119-5, Songdomunhwa-ro, Incheon 21985, Korea
3
Department of Cosmetic Science and Management, Incheon National University, 119, Academy-ro, Incheon 22012, Korea
4
Department of Marine Science, Incheon National University, 119, Academy-ro, Incheon 22012, Korea
5
Department of Plant Biotechnology and Bioinformatics, Ghent University, Technologiepark 71, 9052 Ghent, Belgium
6
School of Marine Science & Engineering, Plymouth University, Plymouth PL4 8AA, Devon, UK
7
Department of Animal Sciences and Aquatic Ecology, Ghent University, Coupure Links 653-Block F, 9000 Ghent, Belgium
*
Author to whom correspondence should be addressed.
Biology 2022, 11(5), 628; https://doi.org/10.3390/biology11050628
Submission received: 22 March 2022 / Revised: 15 April 2022 / Accepted: 18 April 2022 / Published: 20 April 2022

Abstract

:

Simple Summary

Arthrospira maxima is an unbranched, filamentous cyanobacterium rich in important cellular products such as vitamins, minerals, iron, essential amino acids, essential fatty acids, and protein, which has made it one of the most important commercial photoautotrophs. To optimize the growth conditions for the production of target compounds and to ensure profitability in commercial applications, the effects of pH and temperature were investigated. A. maxima has been shown to be tolerant to a range of pH conditions and to exhibit hyper-accumulation of phycoerythrin and allophycocyanin at low temperatures. These traits may offer significant advantages for future exploitation, especially in outdoor cultivation with fluctuating pH and temperature. Our study also demonstrated a new method for the purification of phycocyanin from A. maxima by using by ultrafiltration, ion-exchange chromatography, and gel filtration, producing PC at 1.0 mg·mL−1 with 97.6% purity.

Abstract

Arthrospira maxima is a natural source of fine chemicals for multiple biotechnological applications. We determined the optimal environmental conditions for A. maxima by measuring its relative growth rate (RGR), pigment yield, and photosynthetic performance under different pH and temperature conditions. RGR was highest at pH 7–9 and 30 °C. Chlorophyll a, phycocyanin, maximal quantum yield (Fv/Fm), relative maximal electron transport rate (rETRmax), and effective quantum yield (ΦPSII) were highest at pH 7–8 and 25 °C. Interestingly, phycoerythrin and allophycocyanin content was highest at 15 °C, which may be the lowest optimum temperature reported for phycobiliprotein production in the Arthrospira species. A threestep purification of phycocyanin (PC) by ultrafiltration, ion-exchange chromatography, and gel filtration resulted in a 97.6% purity of PC.

Graphical Abstract

1. Introduction

Cyanobacteria in the genus Arthrospira (formerly Spirulina) are easy to culture and harvest, exhibit high growth rates, and produce a variety of compounds used in natural food supplements, therapeutics, diagnostics, and biofuels [1,2,3,4]. Arthrospira maxima Setchell and Gardner is an unbranched, filamentous cyanobacterium rich in important cellular products such as vitamins, minerals, iron, essential amino acids, essential fatty acids, and protein [5]. The growing international demand for high-value phytonutrients and pigments produced by A. maxima has made it one of the most important commercial photoautotrophs, together with Chlorella and A. platensis [6,7].
The development of a biotechnological marine product for commercial use involves a series of steps that require (i) a large amount of biomass, (ii) high concentrations of the desired product in the biomass, and (iii) an industrial-scale process [8]. Therefore, to realize the full potential, it is essential to optimize the growth conditions and production of the target compound(s), which could be achieved through empirical studies. The biochemical composition of cyanobacteria varies under different culture conditions, and optimizing growth conditions for the production of target compounds is an important step for ensuring profitability in commercial applications [9]. Among the various environmental factors that influence processes such as growth, development, reproduction, and photosynthesis in autotrophs, the quantity (irradiance) and quality (spectral composition) of light are essential. Light also affects the production of metabolites [10]. In particular, pH and temperature are the most critical environmental factors influencing algal biotechnological processes [11]. pH alters nutrient solubility and bioavailability, membrane transport, enzyme activity, electron transport, and osmotic balance in the cytosol [12,13]. Cyanobacteria require highly alkaline conditions for optimal growth, and negative effects of low pH have been observed experimentally among different taxa [11]. Understanding the effects of pH on cyanobacteria has gained importance owing to the acidification of aquatic systems driven by climate change; this could negatively impact natural populations of cyanobacteria unless they exhibit protective or adaptive mechanisms [14]. Temperature also affects many cyanobacterial processes, including metabolism, growth, photosynthesis, reproduction, distribution, and survival. Many cellular processes of cyanobacteria are temperature-dependent, with optima between 25 °C and 40 °C [15]. Low temperatures negatively affect metabolism, whereas high temperatures inhibit growth [16]. Climate change resulting from global warming may be advantageous for cyanobacteria, as most cyanobacterial species show optimal growth at temperatures of 25 °C [17,18] or higher [19].
Phycobiliproteins are important pigments constituting approximately 40% of the soluble proteins in cyanobacteria [20]. Three types of phycobiliproteins are produced by cyanobacteria: bluish green allophycocyanin (APC), blue phycocyanin (PC), and red phycoerythrin (PE). Phycobiliproteins are water soluble and fluorescent, making them useful as natural coloring agents in foods, health drinks, and cosmetics [21,22] and as fluorescent labels in cellular assays [23]. They were also recently found to have important applications in human health owing to their anti-inflammatory, antioxidant, and anticancer properties [24]. The price of phycobiliproteins varies from USD 3 (per 25 mg of food/cosmetic grade pigments) to USD 1500 (per 1 mg of highly purified molecular markers labelled with antibodies or other fluorescent molecules) [25]. In 2018, the value of these pigments in the commercial sector was estimated to reach USD 1830 million by 2023 [26]. Even though A. maxima has a higher protein content than Arthrospira platensis [27], there have been few studies on the commercial production of phycobiliproteins from A. maxima [28].
PC is the major constituent of phycobilisomes in cyanobacteria and is water soluble and highly fluorescent. Its outstanding light absorbance and reddish fluorescence make PC one of the most important value-added products of cyanobacteria, being widely used for tracers in fluorescence immunoassays and in microscopy for diagnostics and biomedical research [29,30].
In this study, we examined the effects of pH and temperature on growth rate, pigment composition, and Chl a fluorescence of A. maxima. Our results will help to determine the optimal conditions for the production of A. maxima bioproducts and to predict cyanobacterial responses to acidification and warming driven by climate change. We also tested a three-step ultrafiltration, ion exchange, and gel filtration method for improving the purification of phycobiliproteins (especially PC).

2. Materials and Methods

2.1. A. maxima Culture

A. maxima strains (LIMS-PS-1691) were obtained from the Korea Marine Microalgae Culture Center and cultured in glass flasks (500 mL), each containing 400 mL of SAG medium (Austin, TX, USA). Cultures were maintained at 25 °C, pH 8.5, and a salinity of 20 psu. Cultures were exposed to 60 μmol m−2·s−1 photon flux density (PFD) light, with a 14/10 h light/dark cycle. Square LED (light emitting diode) panel lights (340 × 500 × 10 mm; Daewo, Bucheon, Korea) were used as main source of illumination for the growth of A. maxima. Each LED strip comprised 20 diodes spaced at 1 cm intervals vertically and horizontally. PFDs were measured with a quantum sensor (Licor-1400, Li-Cor, Lincoln, NE, USA).

2.2. Treatments

Treatments consisted of eight different pH levels (pH 4, 5, 6, 7, 8, 9, 10, and 11 (±0.1)) and seven temperatures (5 °C, 10 °C, 15 °C, 20 °C, 25 °C, 30 °C, and 35 °C (±1 °C)). Flasks containing 200 mL of A. maxima culture were exposed to each treatment. pH was adjusted using 1 M NaOH or 1 M HCl. All flasks were kept in environmentally controlled growth chambers. While testing the effect of one environmental factor, all other conditions, including pH, temperature, salinity, PFD, and photoperiod, were kept constant as described above. No time–series of pH monitoring was carried out.

2.3. Assessment

2.3.1. Growth Analysis

Each 200 mL culture was harvested after 8 d. Cultures were centrifuged at 5974× g for 10 min, followed by washing with distilled water and another round of centrifugation. Pellets were then dried at 60 °C until their weight remained constant. The relative growth rate (RGR) of A. maxima was calculated as follows:
RGR %   day 1 = l n D W f l n D W i t f × 100
where DWi represents the initial dry weight biomass (288 ± 7 mg·L−1), DWf represents the final dry weight biomass, and tf indicates the test duration. RGR is an instantaneous rate estimate, and thus simplifies much of the variability in growth over time. Nevertheless, RGR is a useful metric for the relative productivity of species growing under given conditions. Photoperiods for all samples were synchronized, thus preventing the harvesting of samples at different stages in their circadian rhythms.

2.3.2. Pigment Analysis

For each treatment, one of the 200 mL cell cultures was harvested after 8 d, washed with distilled water as above, and resuspended in 90% acetone. Acetone extracts were incubated for 30 min at 4 °C in the dark and then centrifuged at 5974× g for 5 min. The acetone supernatant was collected, and the extraction procedure was repeated five times until clear acetone extracts were obtained. Absorption of supernatants was measured at 664 nm. Chl a concentration was calculated as follows [31]:
Chl   a   mg · g 1 = A 664 / 73.6
To measure the concentrations of phycobiliproteins, one of the 200 mL cell cultures from each treatment was harvested after 8 d, centrifuged at 5974× g for 5 min, rinsed twice with distilled water, and then resuspended in 2 mL of sodium phosphate buffer (0.1 M, pH 6.8). Extracts were subsequently centrifuged at 5974× g for 5 min at 4 °C and clear supernatants containing phycobiliproteins were collected. The extraction process was repeated five times. The absorption of supernatants was measured at wavelengths ranging from 250 to 700 nm using a UV-Vis spectrophotometer (Scinco S-3100 PDA, Seoul, Korea). Concentrations of phycobiliproteins were calculated using the following equations [32]:
PC   mg · g 1 = A 620 0.474 × A 652 / 5.34
APC   mg · g 1 = A 620 0.208 × A 620 / 5.09
PE   mg · g 1 = A 562 2.41 P C 0.849 A P C / 9.62

2.3.3. Photosynthesis Analysis

Chl a fluorescence was measured as a proxy for photosynthesis using Imaging PAM (Walz, Germany). Algal samples were first incubated in the dark at 25 ± 1 °C for 10–15 min. Samples were subsequently exposed to pulses of approximately 0.15 µmol photon m−2·s−1 from a light emitting diode (LED), and the initial fluorescence yield (Fo) was recorded. Samples were then exposed to a 5000 µmol photons m−2·s−1 saturation pulse to measure the maximum fluorescence yield (Fm). Fo estimates baseline fluorescence when all photosystem II (PSII) reaction centers are open, while Fm represents fluorescence when all reaction centers are closed. Fv/Fm was calculated as follows:
F v / F m = F m F 0 / F m
where Fv is the variable fluorescence.
Rapid light curves were developed using 10 s pulses of actinic light, which increased in intensity from 0 to 1517 μmol photons m−2·s−1 [33]. The effective quantum yield (ΦPSII) was calculated as follows:
Φ PSII = F m F / F m
where Fm is the maximum light-acclimated fluorescence and F is the fluorescence at a given light intensity.
The relative electron transport rate (rETR) was calculated as the slope described by each ΦPSII multiplied by its PFD plotted against PFD. The ETR is given in arbitrary units since the absorbance of the microalgal sample was not measured. The relative maximum electron transport rate (rETRmax) was calculated using the following equation adapted from Jassby and Platt [34]:
rETR = ETR max × tan h α × I / ETR max
where α indicates the ETR under limited light and I indicates the PFD under limited light.

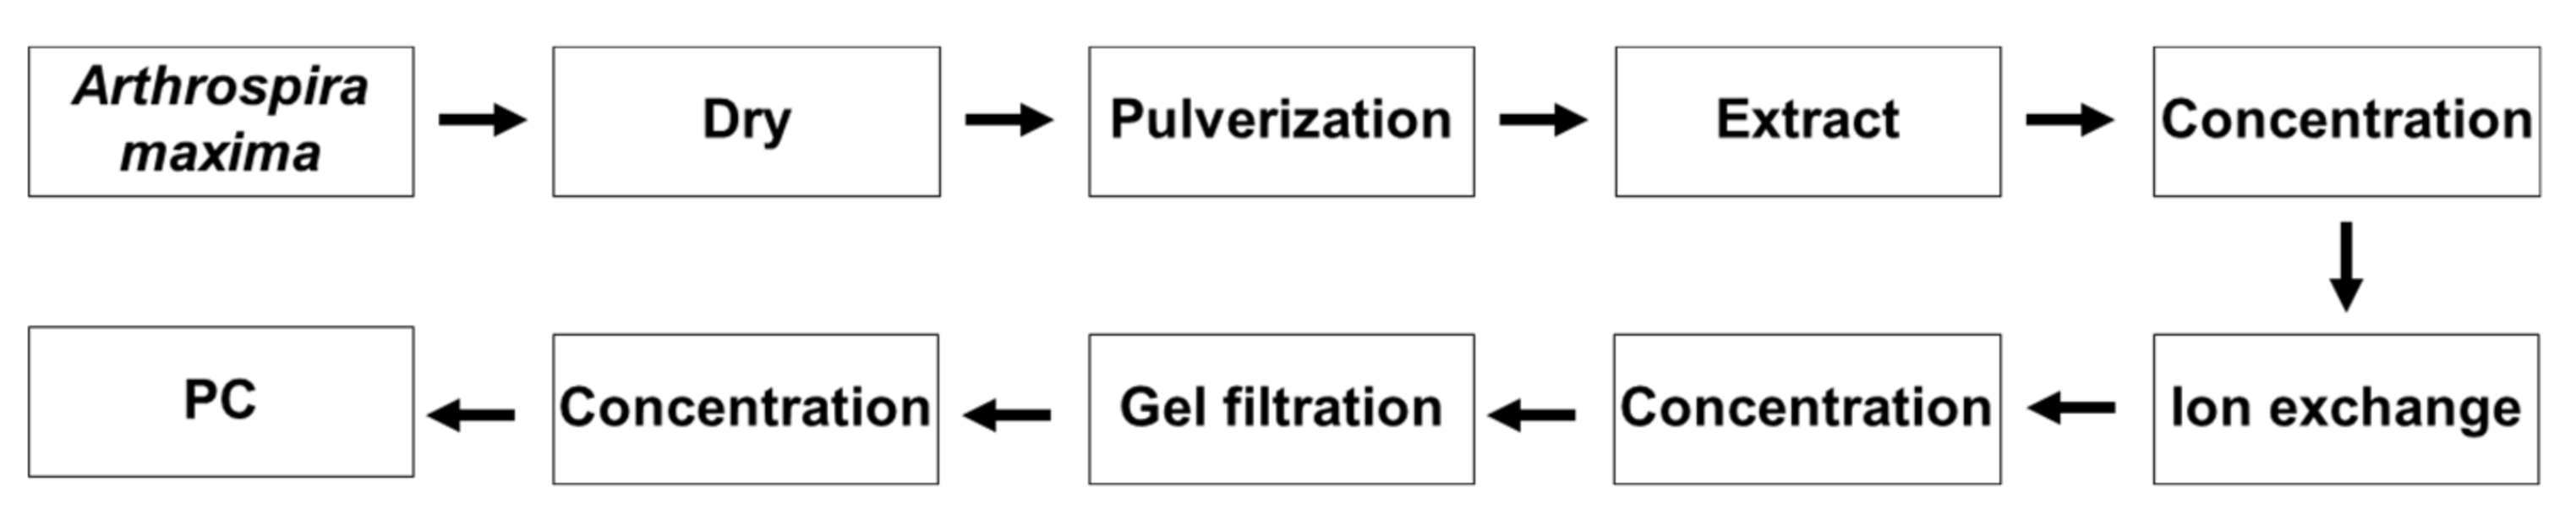
2.4. Purification of PC

2.4.1. Fractionation by Ultrafiltration

After 4 weeks under the culture conditions described above, A. maxima was harvested and centrifuged at 15,000× g rpm for 15 min at 4 °C. The pelleted cells (8 mL, 613 mg) were collected and mixed with 40 mL of sodium phosphate solution (pH 6.0). The mixed solution was incubated for 24 h at 4 °C with gentle stirring. The supernatant was then collected and filtered through Whatman filter paper (No. 541, 110 mm) to remove unpurified components. To prevent protein denaturation and ensure a stable sample for the next purification process, a buffer exchange system was operated with sodium phosphate buffer (pH 7.0) using a dialysis membrane (MWCO: 12–14,000) for 24 h. To prepare highly concentrated PC protein from the sample subjected to buffer exchange, the supernatant and filtrate were separated using an ultra-centrifugal filter with a molecular weight cut-off of 10,000 (Fisher Scientific, Hampton, NH, USA), and the concentrated supernatant was obtained.

2.4.2. Separation by Ion Exchange

Ion exchange was used to separate PC proteins according to the charge properties of PC and other proteins. After fractionation and concentration, 3.1 mg·mL−1 of concentrated supernatant was collected and adsorbed onto 70 mL of DEAE-Sepharose beads by stirring for 24 h at 4 °C to increase adsorption strength. The DEAE-Sepharose beads adsorbed with PC protein were then introduced into a DEAE column (DFF100, Sigma-Aldrich, St. Louis, MO, USA) by gravity. After removal of the unbound proteins using washing buffer, the PC protein bound to the DEAE-Sepharose beads was eluted using elution buffer spiked with 0.1 M NaCl; each eluate was collected at a flow rate of 20 mL·h−1, and PC protein was identified by absorbance at 620 nm using an ELISA reader.

2.4.3. Further Separation by Gel Filtration

The sample separated by the second step ion exchange (concentration 2.30 mg·mL−1) was loaded onto a column packed with Sephacryl S-200 beads. Since separation by gel filtration is not affected by the buffer, PC protein passing through the Sephacryl S-200 column was eluted using the same sodium phosphate buffer (pH 7.0) as in step 1. Absorbance of samples aliquoted for each section was measured at 620 nm, while PC protein was detected using an ELISA reader.
The purity of the PC protein obtained using the three step purification process was confirmed by automated analysis using TOTALLAB software (TotalLab Ltd., Newcastle upon Tyne, UK). An objective analysis of the purified proteins obtained from the three step separation process was performed by the Korea Institute of Basic Science (KBSI, https://www.kbsi.re.kr/eng, accessed on 6 April 2022; issue number: MS-00020-1) using HPLC (Agilent 1200 Series with Aeries WIDEPORE (3.6 µm) C4 column (150 × 4.6 mm)). The solvents used were 0.1% trifluoroacetic acid in water and 0.075% trifluoroacetic acid in acetonitrile, and the flow rate was 1 mL·min−1 at a 40 °C column temperature.

2.4.4. Sodium Dodecyl Sulfate–Polyacrylamide Gel Electrophoresis (SDS–PAGE)

Fractions of PC extracts from the different extraction and purification steps were characterized using SDS-PAGE to determine the molecular mass of PC. SDS–PAGE was performed in a vertical chamber using 12.5% polyacrylamide gel containing 0.1% SDS, 4% acrylamide, and 0.1% bisacrylamide. Electrophoresis was performed at room temperature and the proteins visualized using Coomassie brilliant blue staining. The molecular mass of the protein band was determined using a calibration gel with standard proteins as the molecular mass markers (Sigma SDS).

2.5. Statistical Analysis

One-way analysis of variance (ANOVA) was performed for treatments on each response variable after checking for homogeneity. There were six replicates per treatment per measure. Post hoc comparisons were performed using the least significant difference (LSD) test and a significance level of p < 0.05.

3. Results and Discussion
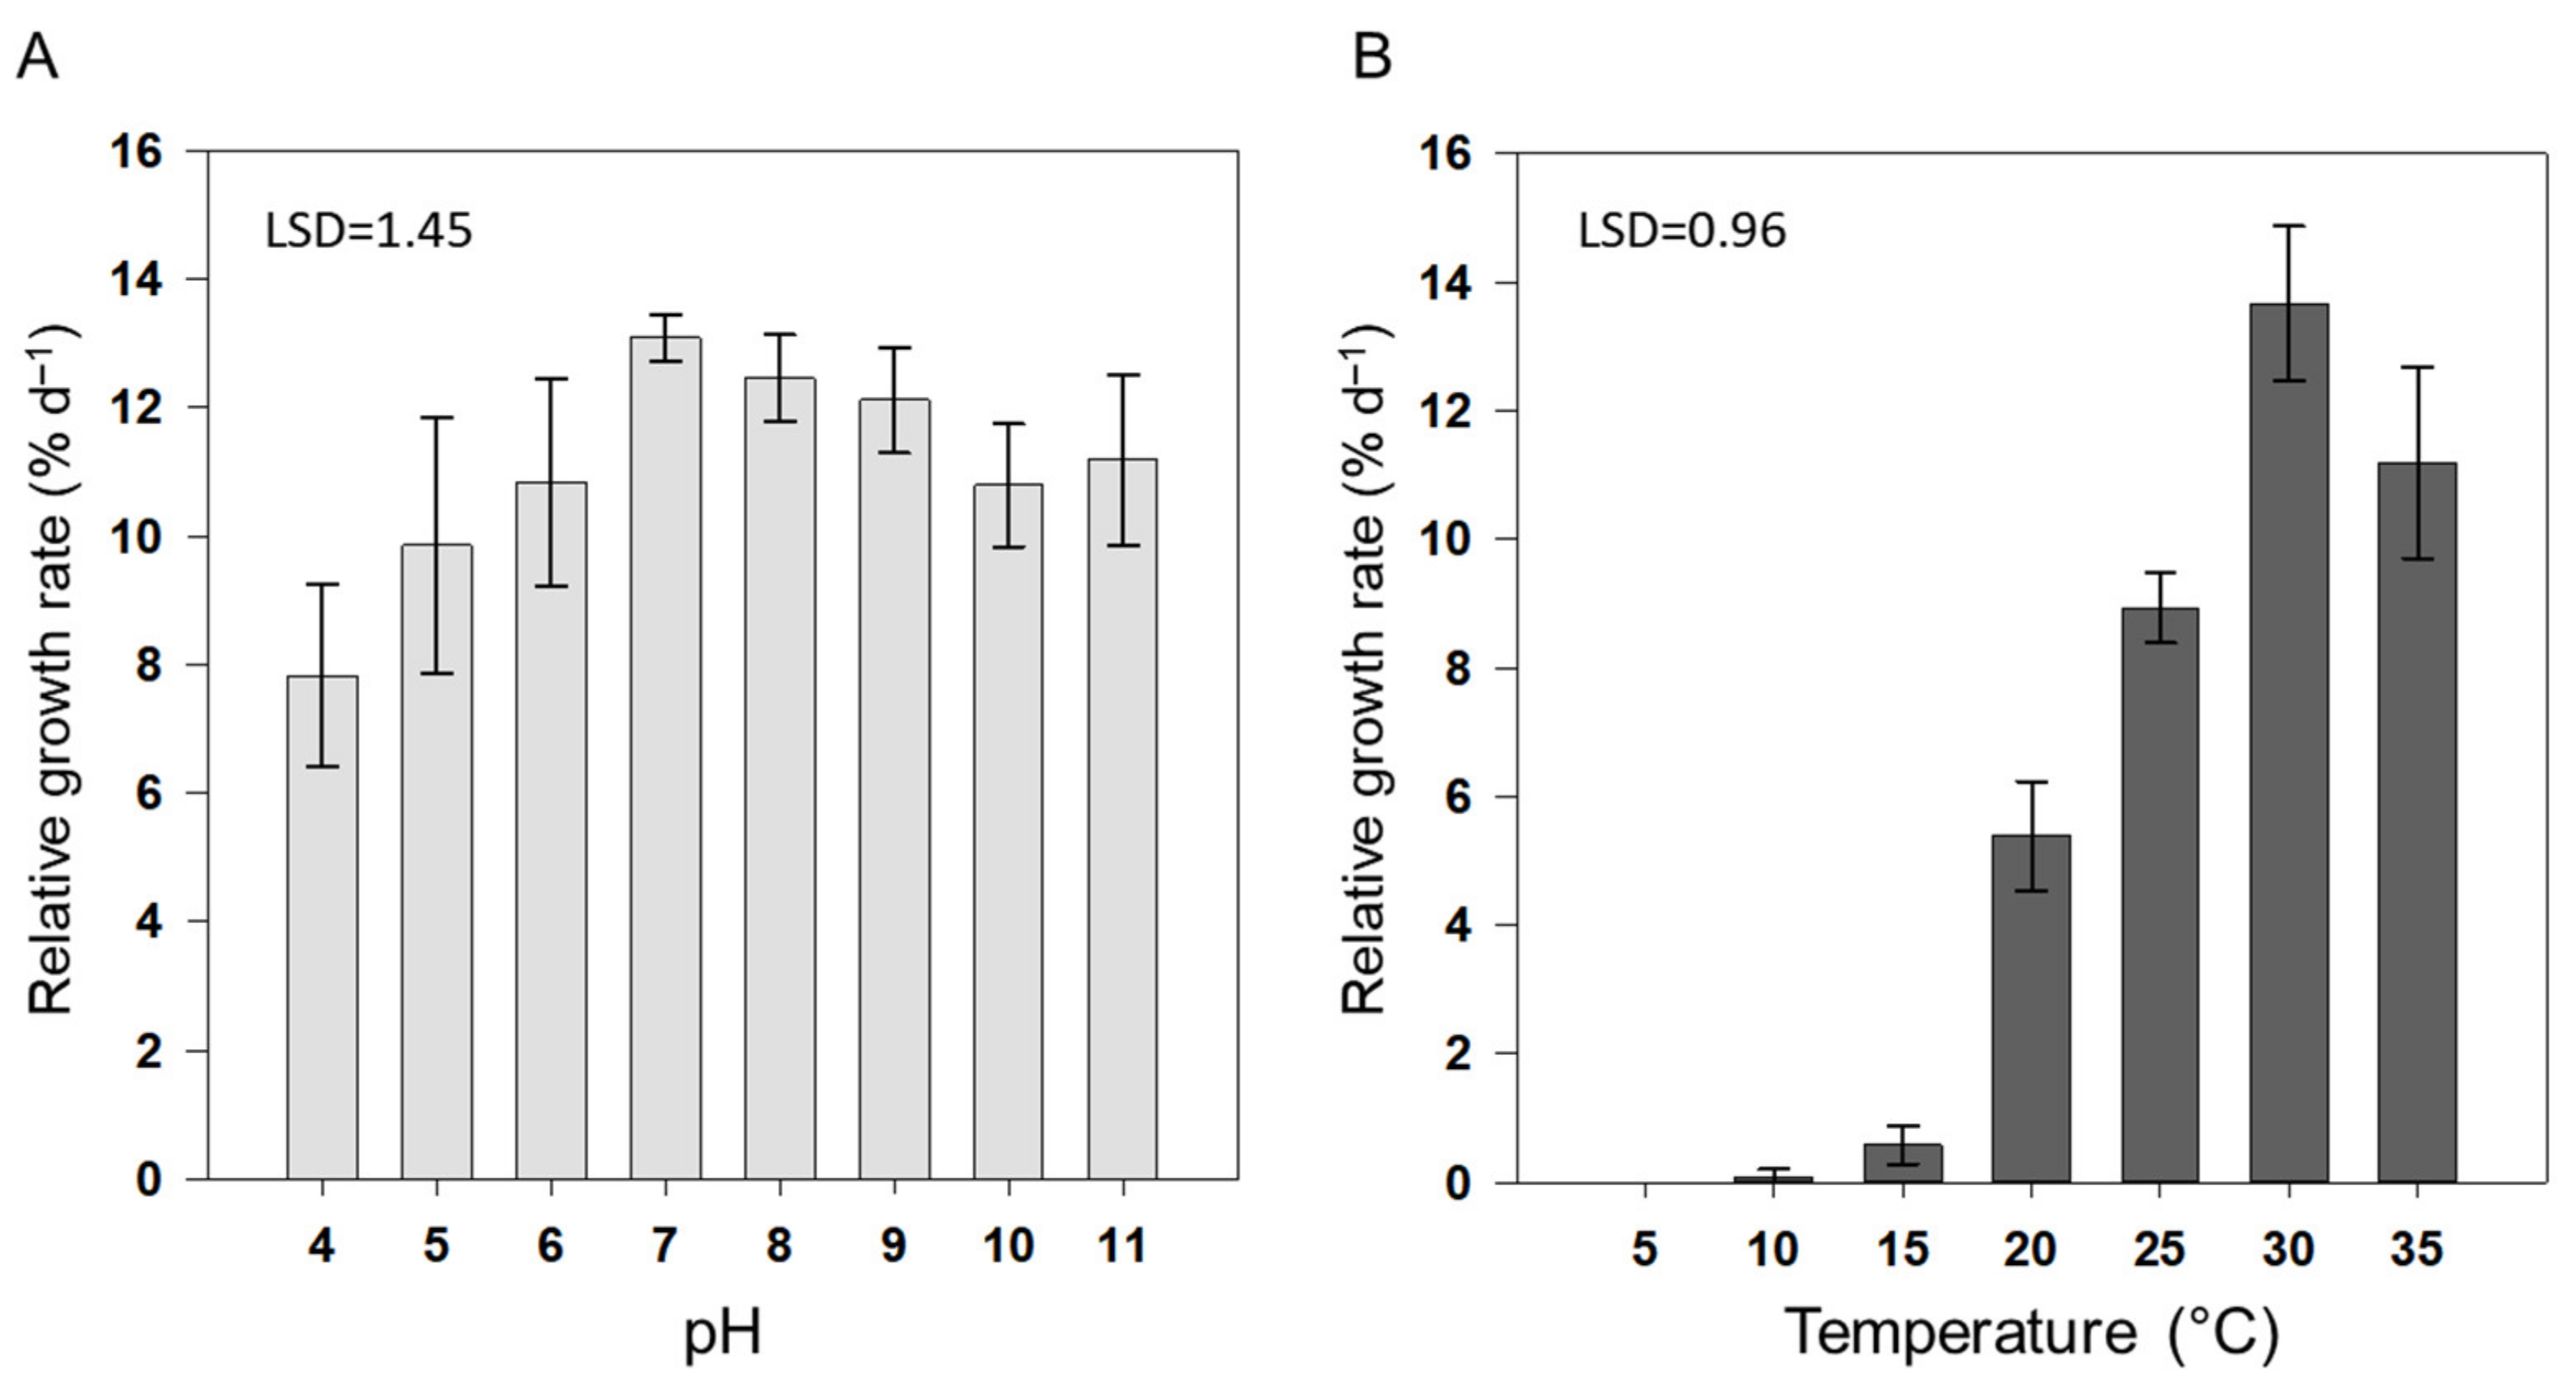
3.1. Growth

pH is an important regulator of cellular processes, including the solubility and bioavailability of CO2 and nutrients, membrane permeability, enzyme activity, photosynthesis, and osmoregulation of the cytoplasm [13,35]. The RGR of A. maxima showed a clear optimum at intermediate pH (Figure 1A). The growth rate of A. maxima was lowest (7.83%·d−1) at pH 4 and highest (mean growth rate = 12.1–13.1%·d−1) at pH 7–9. At pH 5, 6, 10, and 11, the growth rates of A. maxima were similar, with mean values ranging from 9.8 to 11.2%·d−1.
Cyanobacteria are alkalophiles with typical pH optimums ranging from pH 6 to 10, with more extreme values promoting leaching [11,36,37,38]. Rafiqul, Jalal, and Alam [11] reported that pH levels of 9.0 and 10.0 were optimal for the growth of A. platensis and Arthrospira fusiformis, respectively. Thirumala [38] reported the optimal growth of A. platensis at pH 10.0. For A. maxima, optimal growth was previously reported between pH 6 and 10 [6]. In the present study, we observed the highest growth rate of A. maxima between pH 7 and 9, with slightly lower growth rates at pH 6, 10, and 11. The decline in growth rate at either extreme of the pH scale may be caused by changes in carbon availability, which would either interfere with photosynthesis or disrupt cell membrane processes [13].
Cyanobacterial activity tends to become limited under acidic conditions [39]. When the pH of a growth medium decreases beyond a certain threshold, the cellular pH of cyanobacteria also declines since cyanobacteria possess a limited ability to regulate their internal pH. Acidification of the cytoplasm thus ultimately reduces growth rate. Low growth rate may also be related to a low ATP/(ATP plus ADP) ratio under acidic conditions [40].
The reduction in A. maxima growth rate at a pH > 10 may be related to reduced CO2 availability in the culture medium. Reduced CO2 limits photosynthetic activity and increases the production of reactive oxygen species (ROS), which generate oxidative stress [13,37,41,42]. Cyanobacteria possess a CO2 concentrating mechanism that increases the cellular pool of inorganic carbon and the supply of CO2 to RuBisCo, thus promoting photosynthesis under alkaline conditions [41]. In the present study, however, the photosynthetic performance of A. maxima decreased at a pH > 9, indicating that a higher pH interferes with photosynthesis. In A. platensis, a highly alkaline pH induces the overproduction of antioxidants [13]. High concentrations of antioxidant enzymes and non-enzymatic molecules such as glutathione or vitamins can indicate oxidative stress [43]. Thus, the high values for these indicators in the study by Ismaiel, El-Ayouty, and Piercey-Normore [13] suggest that high pH conditions cause oxidative stress in A. platensis. Although we did not measure oxidative stress indicators in this study, oxidative stress represents a likely mechanism for the reduced growth of A. maxima observed at a higher pH.
Interestingly, A. maxima maintained slower but relatively stable growth (59.8% of maximal growth) at the lowest pH tested in this study (pH 4). In nature, cyanobacteria do not inhabit environments with a pH < 4 [36,44]. Low pH may damage cellular functions or increase the energy requirement of cells via a direct impact on cellular metabolism and membrane transport [45]. Abiotic stresses such as extreme pH also lead to the generation of ROS, resulting in severe consequences such as the deterioration of cellular metabolism and damage to cellular molecules such as proteins, DNA, and membrane lipids [13]. Algae have developed several mechanisms, such as the production of non-enzymatic and/or enzymatic antioxidants, to mitigate the effects of ROS. Enhancement of the antioxidant system in Arthrospira spp. has been reported previously, and cyanobacterial antioxidants have been investigated for industrial production [46]. The sustained growth of A. maxima cells under acidic conditions (pH 4) in this study suggests the existence of an unforeseen protective mechanism against highly acidic environments. If true, A. maxima would be a potential candidate for mass cultivation under the conditions of high CO2 and low pH caused by global warming.
Cultivation of cyanobacteria for wastewater treatment is gaining popularity since cyanobacteria can remove inorganic compounds such as nitrogen and phosphorous from agro-industrial runoff, thus removing pollutants while producing biomass [47,48]. However, cyanobacterial effectiveness depends on the pH of wastewater systems, with activity severely inhibited at pH extremes. Amendments may be used to maintain a suitable pH [49]; however, this process is expensive. The cultivation of A. maxima in wastewaters might offer a cost-effective solution since A. maxima showed a broad range of pH tolerance in this study, including a growth rate of 7.83%·d−1 at pH 4.
The specific growth rates of A. maxima cultures at different temperatures are presented in Figure 1B. A. maxima cultures showed the highest growth rate (circa 11.2–13.7%·d−1) at 30–35 °C and grew well (8.9%·d−1) at 25 °C. A. maxima cultures showed negligible growth (0.09%·d−1) after 8 d at 10 °C or 15 °C and died after 3 d at 5 °C. The optimum temperature for growth of A. maxima was consistent with that reported in a previous study [50]. A. platensis shows tolerance to a wide range of temperatures (20–40 °C), with maximum growth at 35 °C and no growth at 45 °C [51]. Ranjitha and Kaushik [52] obtained the maximum biomass of Nostoc muscorum at 30 °C and 35 °C. An analysis of different strains of Arthrospira revealed that the optimal temperature for growth varied from 35 °C to 37 °C, with growth severely restricted at 40 °C [53]. Temperature has a profound influence on metabolic processes, and the optimum temperature of a particular algal strain determines its productivity [54]. Cyanobacteria tend to have relatively greater temperature dependence and higher optimum growth temperatures than other phytoplanktons. This relatively high optimum growth temperature makes A. maxima a potential candidate species for future mass cultivation under an ocean-warming scenario.

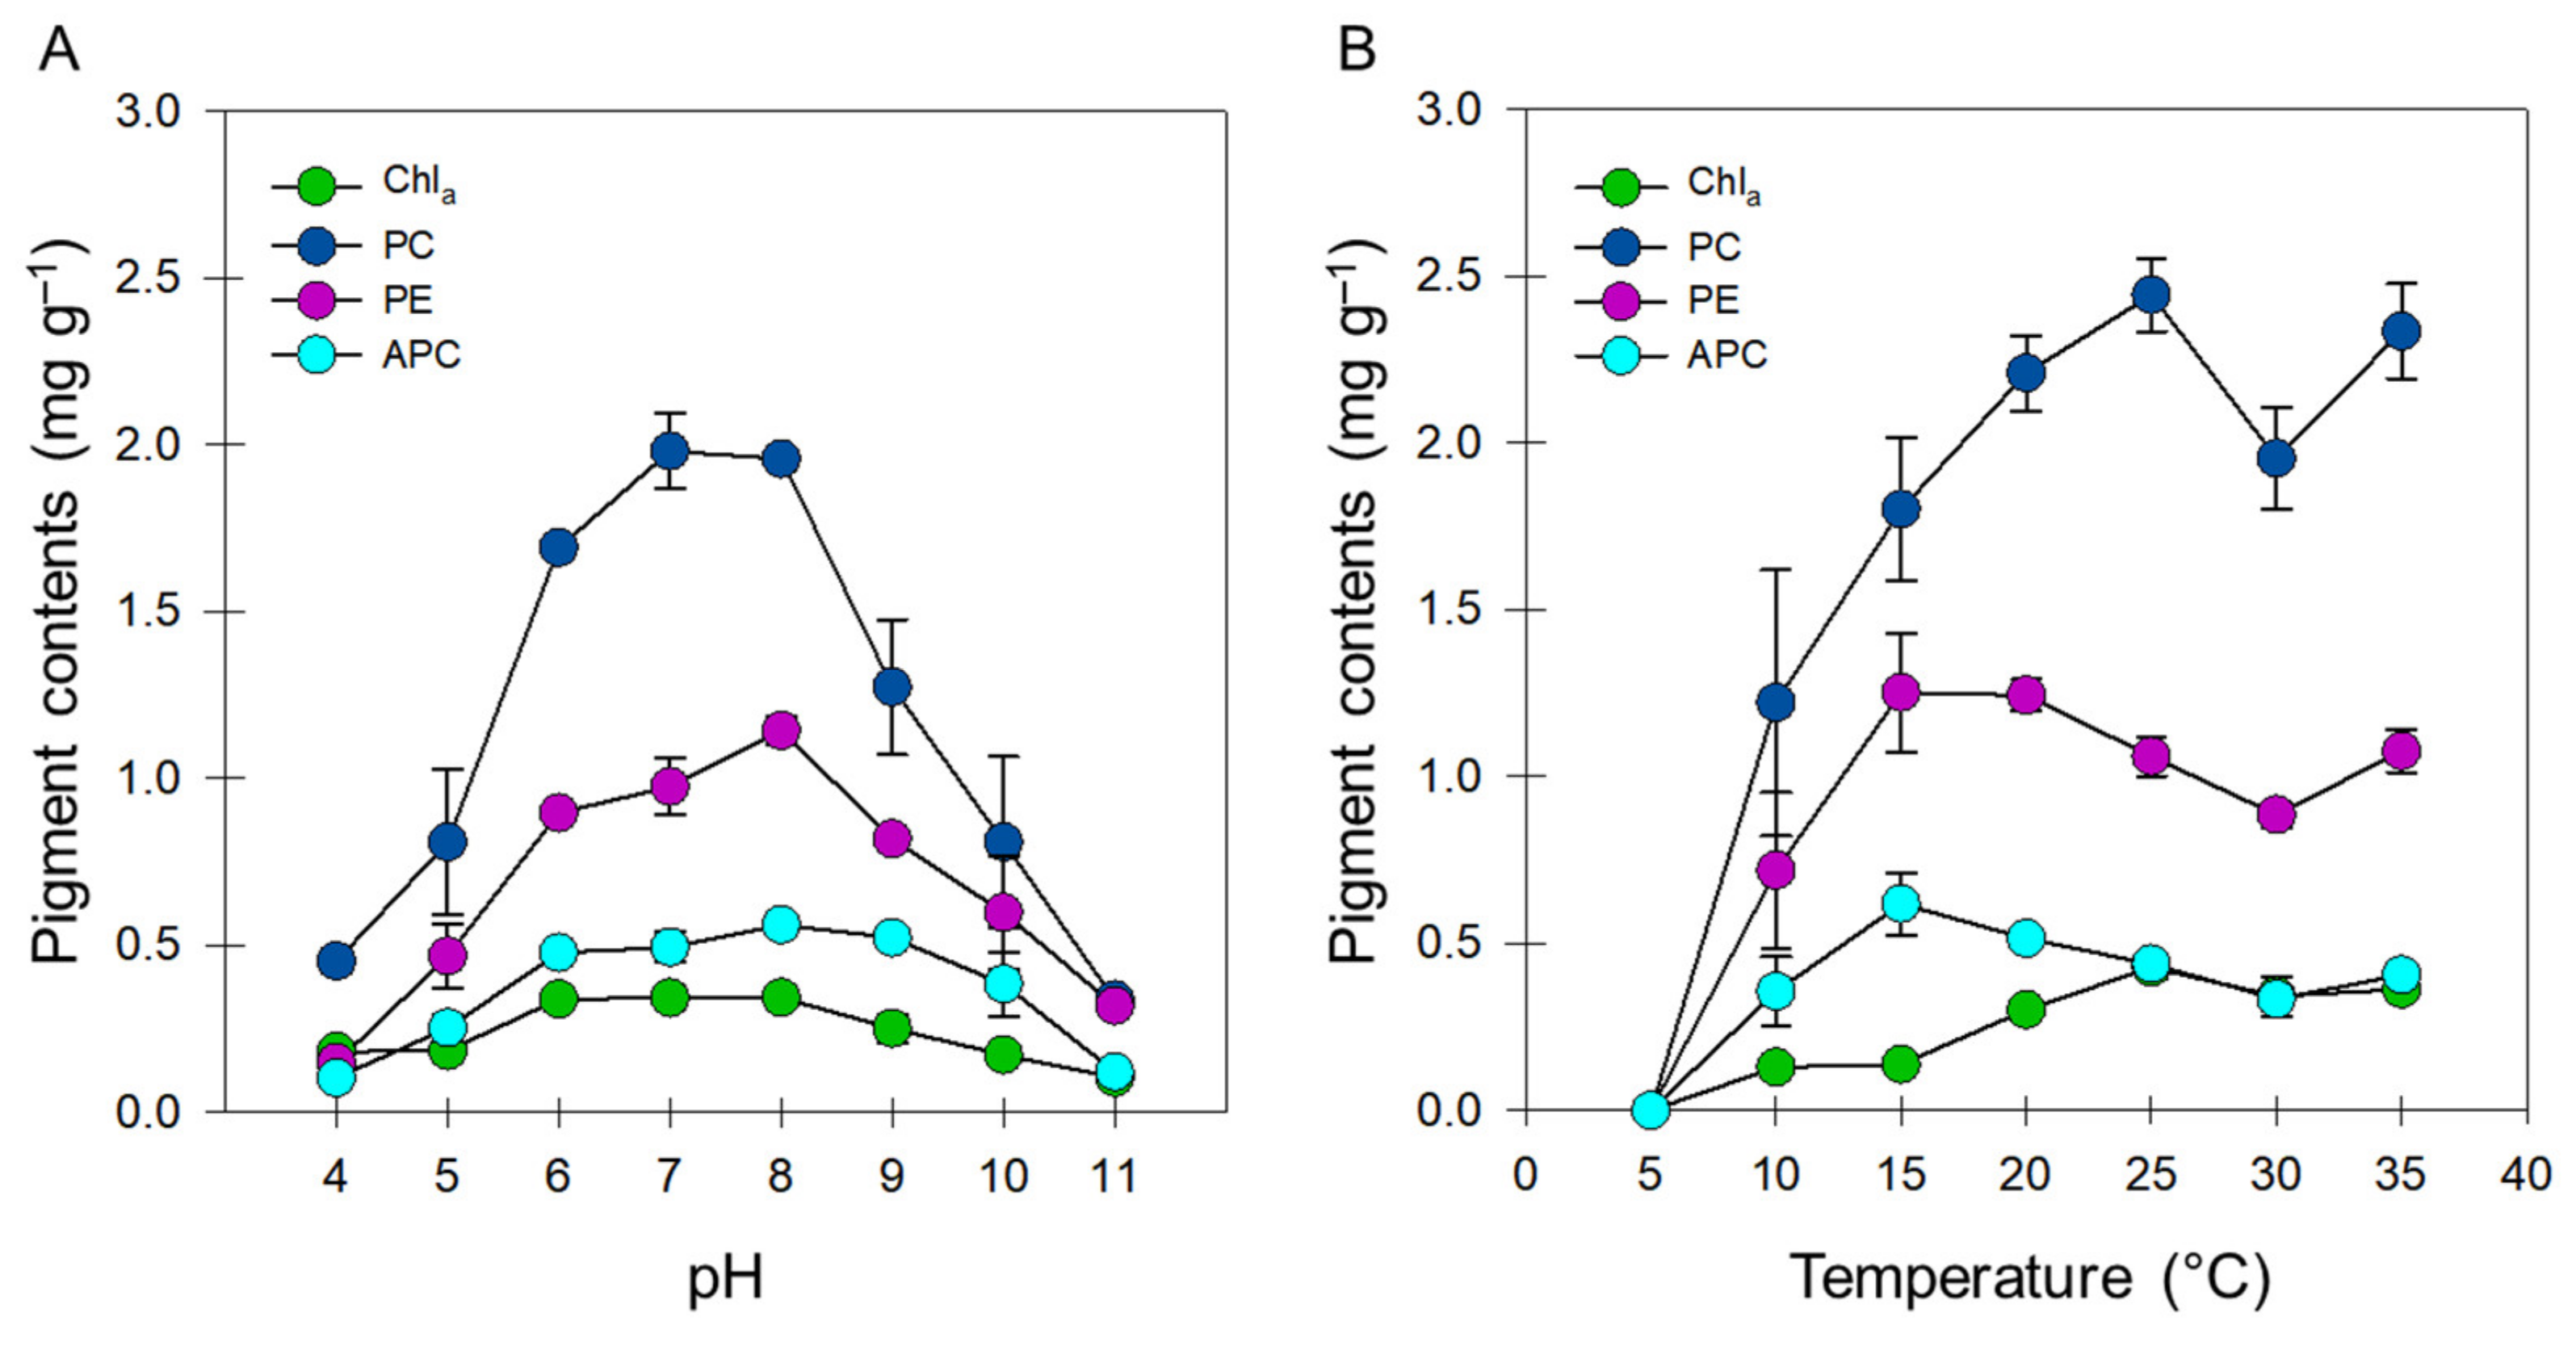
3.2. Pigment Biosynthesis

After the exposure of A. maxima cultures to different pH conditions for 8 d, the concentration of Chl a (0.338–0.342 mg·g−1) was highest at pH 6–8 (Figure 2A). The lowest concentrations of Chl a were observed at pH 4 (0.181 mg·g−1) and pH 11 (0.103 mg·g−1). A previous study determined that the Chl a content of A. platensis is highest at pH 7 and lowest at pH 11 [55]. Among the pH levels tested for Fischerella ambigua (pH 5, 7, and 9), Chl a content was highest at pH 7 [56]. By contrast, the Chl a content of Nostoc spp. is not affected by pH [57]. In cyanobacteria, pH extremes change the charge status of proteins, causing their denaturation. Acidic conditions cause Chl a degradation [58]; however, no report has been published explaining reduced Chl a content under alkaline conditions. In spinach (Spinacia oleracea), a pH > 9 induces changes in the PSII membrane proteins related to the release of Cl−1 ions from the deprotonation of Cl−1-binding groups or its replacement with OH−1 ions [59,60]. As chlorophylls are embedded in the PSII membrane, structural changes in the PSII membrane proteins could explain the reduced Chl a concentration and Chl a fluorescence in A. maxima under alkaline conditions.
For phycobiliproteins, PC concentration was highest at pH 7 (1.98 mg·g−1), followed by pH 8 (1.96 mg·g−1), pH 6 (1.69 mg·g−1), pH 4 (0.452 mg·g−1), and pH 11 (0.336 mg·g−1) (Figure 2A). The concentration of APC was highest at pH 8 (1.142 mg·g−1), followed by pH 7 (0.974 mg·g−1), and lowest at pH 4 (0.148 mg·g−1) (Figure 2A). The concentration of PE was highest at pH 8 (0.561 mg·g−1), followed by pH 11 (0.120 mg·g−1), and lowest at pH 4 (0.102 mg·g−1) (Figure 2A). A previous analysis of the effect of pH on the phycobiliprotein content of 10 cyanobacterial strains belonging to Anabaena spp., Calothrix spp., Nostoc spp., and Phormidium spp. recorded maximal and minimal concentrations of phycobiliproteins at pH 6–7 and pH 9 (and pH 5, depending on the strain), respectively [12]. In Nostoc sp. UAM, alkaline conditions (pH 7.0–9.0) enhance the total phycobiliprotein content [57]. The pH required for the maximal production of phycobiliproteins in A. maxima was therefore consistent with the pH optima reported for other cyanobacterial species [2].
In A. maxima, pH 11 inhibited the production of phycobiliproteins and Chl a. Phycobiliproteins located in phycobilisomes comprise the major photosynthetic antenna of PSII, and any change in the membrane structure of PSII might also affect the content of phycobiliproteins. This implies that alkaline pH could have been responsible for the decrease in phycobiliproteins at pH 11 via the same mechanism as that underlying the change in Chl a concentration.
The effects of temperature on photosynthetic pigment content in A. maxima cultures are shown in Figure 2B. Both Chl a and PC concentrations were highest (0.428 and 2.445 mg·g−1, respectively) at 25 °C. The concentrations of these pigments did not vary significantly at 20 °C, 30 °C, and 35 °C. By contrast, we recorded the highest concentrations of APC and PE at 15 °C, and accumulation of these pigments showed no significant difference at 10 °C, 30 °C, and 35 °C (Figure 2B). No trace of cyanobacterial pigments was observed at 5 °C.
Temperature not only influences respiration rate, membrane stability, and nutrient uptake in cyanobacteria [61], but also cyanobacterial species’ diversity and metabolic product biosynthesis [62]. However, the effect of temperature on the production of chlorophyll and phycobiliproteins has not been extensively studied in cyanobacteria. In A. platensis grown at temperatures ranging from 20 °C to 40 °C, pigment contents increase with temperature up to 35 °C but then decline upon further increases in temperature [51]. Cultures of A. platensis display the highest Chl a fluorescence at 35 °C, which is 10 °C higher than the temperature required for maximal Chl a production.
The biosynthesis of phycobiliproteins in cyanobacteria is affected by temperature, with strain-specific temperature optima for production. In the present study, 25 °C was optimal for PC biosynthesis and 15 °C was optimal for APC and PE biosynthesis in A. maxima (Figure 2B). Temperatures between 30 °C and 37 °C are reported to be most suitable for phycobiliprotein production in most cyanobacteria, including some Arthrospira species [16,28,51,62,63]. The lowest temperature recorded for maximal phycobiliprotein production was in Synechococcus sp. PCC 7002, at 22 °C [64]. Thus, the response of phycobiliprotein production to temperature in A. maxima is more similar to that of Synechococcus than to that of Arthrospira spp., and A. maxima appears to possess the lowest optimum temperature reported for the production of phycobiliproteins [22]. The substantial production of PE and APC in A. maxima over a wide range of temperatures (10–35 °C) contrasts with a significant reduction in phycobiliproteins in A. platensis when grown at 20 °C compared with 35 °C [51]. This trait may make A. maxima more favorable than A. platensis for pigment production.
In general, cyanobacteria are highly adaptable to a wide range of temperatures and can be found growing in extreme environments. Nonetheless, an optimal temperature is important for biomass and pigment production in each species. Notably, no pigments were produced by A. maxima at 5 °C, which may be due to the effect of low temperature on some of its metabolic processes.
Phycobiliproteins may serve as a nitrogen reserve [65]. PC and PE act as nitrogen storage compounds in A. platensis and Synechococcus sp. strain DC2, respectively [66,67]. In the current study, the levels of PE and APC were higher at 15 °C than at 25–35 °C. However, we observed significant growth inhibition at 15 °C (only 4.3% of the maximum at 30 °C), concomitant with a 57.7% reduction in photosynthesis. The reduced photosynthetic capacity in A. maxima at 15 °C suggests that low temperature might cause the cyanobacterium to increase the accumulation of PE and APC for future use. This would enable cells to photosynthesize and grow immediately after environmental conditions become optimal, without requiring additional costs for the resynthesis of pigments. This opportunistic trait of A. maxima could be highly beneficial during outdoor cultivation under fluctuating environmental conditions.

3.3. Photosynthetic Activity

The chlorophyll fluorescence parameters (Fv/Fm, ΦPSII, and rETRmax) for A. maxima under varying environmental pH are presented in Table 1. The values of all three parameters were highest at pH 7–8. However, A. maxima was still photosynthetically active, as determined by the chlorophyll parameters, even at pH extremes (pH 4 and pH 11).
The maximal values of Fv/Fm (0.43–0.44) were recorded at pH 7–8. Although the Fv/Fm values were reduced at a pH < 6 and pH > 9, these values were still within the range observed in healthy cyanobacteria. Other studies have reported Fv/Fm values ranging from 0.35 to 0.45 in A. platensis [68] and 0.3–0.4 in Anabaena spp. [69]. Decreases in the Fv/Fm ratio can indicate damage to the photosynthetic apparatus and a reduction in the photochemical efficiency of PSII [70]. In the present study, we observed a significant reduction in the Fv/Fm value at a pH > 8, indicating a decline in the photochemical efficiency of PSII.
The values of ΦPSII in A. maxima were highest (0.35–0.38) at pH 7–8, and we observed a significant reduction in ΦPSII under acidic (pH 4–5) and alkaline conditions (pH 11) (Table 1). The fluorescence parameter ΦPSII measures the efficiency of PSII, representing the proportion of light used in photochemistry [70]. The decline in ΦPSII observed under pH extremes suggests that PSII electron transport and the generation of NADPH and ATP were disrupted, inhibiting carbon fixation and assimilation via inhibition of the primary photochemical reactions. In this study, the decrease in ΦPSII at pH 4–5 and pH 11 was also associated with a decrease in Fv/Fm and rETRmax.
The values of rETRmax were greatest at pH 7 and 8, and significantly lower at a pH < 6 and a pH > 9 (Table 1). rETRmax is associated with photosynthetic electron transport activity. The decline in rETRmax at extreme pH levels suggests that A. maxima electron transport complexes were inhibited, and that NADPH and ATP production, as well as carbon assimilation, were constrained [71]. The reduced values of rETRmax in A. maxima at a pH < 6 and a pH > 9 may indicate that electron transport activity was substantially inhibited during photosynthesis, leading to a possible decline in PSII photochemical efficiency.
Among the various temperature treatments of A. maxima, the values of Fv/Fm, rETRmax, and ΦPSII were highest at 25–30 °C (Table 1). A comparison of means demonstrated that the values of Fv/Fm at temperatures ranging from 10 °C to 15 °C were significantly lower than those at 25–35 °C. Previous studies have reported that temperature stress inhibits the activity of PSII, leading to a significant reduction in Fv/Fm [72,73]. In this study, we observed a significant reduction in the Fv/Fm of A. maxima at 10–15 °C, indicating that lower temperatures result in the disruption of PSII reaction centers and impairment of photosynthetic activity.
ΦPSII was highest at 25 °C (0.27), significantly reduced at 10–15 °C (0.16–0.21), and zero at 5 °C (Table 1). A reduction in ΦPSII values at temperatures lower than 15 °C indicates that photochemical utilization of light energy absorbed by A. maxima grown at these temperatures was lower than in A. maxima grown at 20–35 °C.
The values of rETRmax were significantly lower at temperatures ranging from 10 °C to 20 °C than at temperatures greater than 25 °C (Table 1). A decline in rETRmax values at 10–20 °C, as discussed above, implies that electron transport and carbon assimilation were inhibited [71].

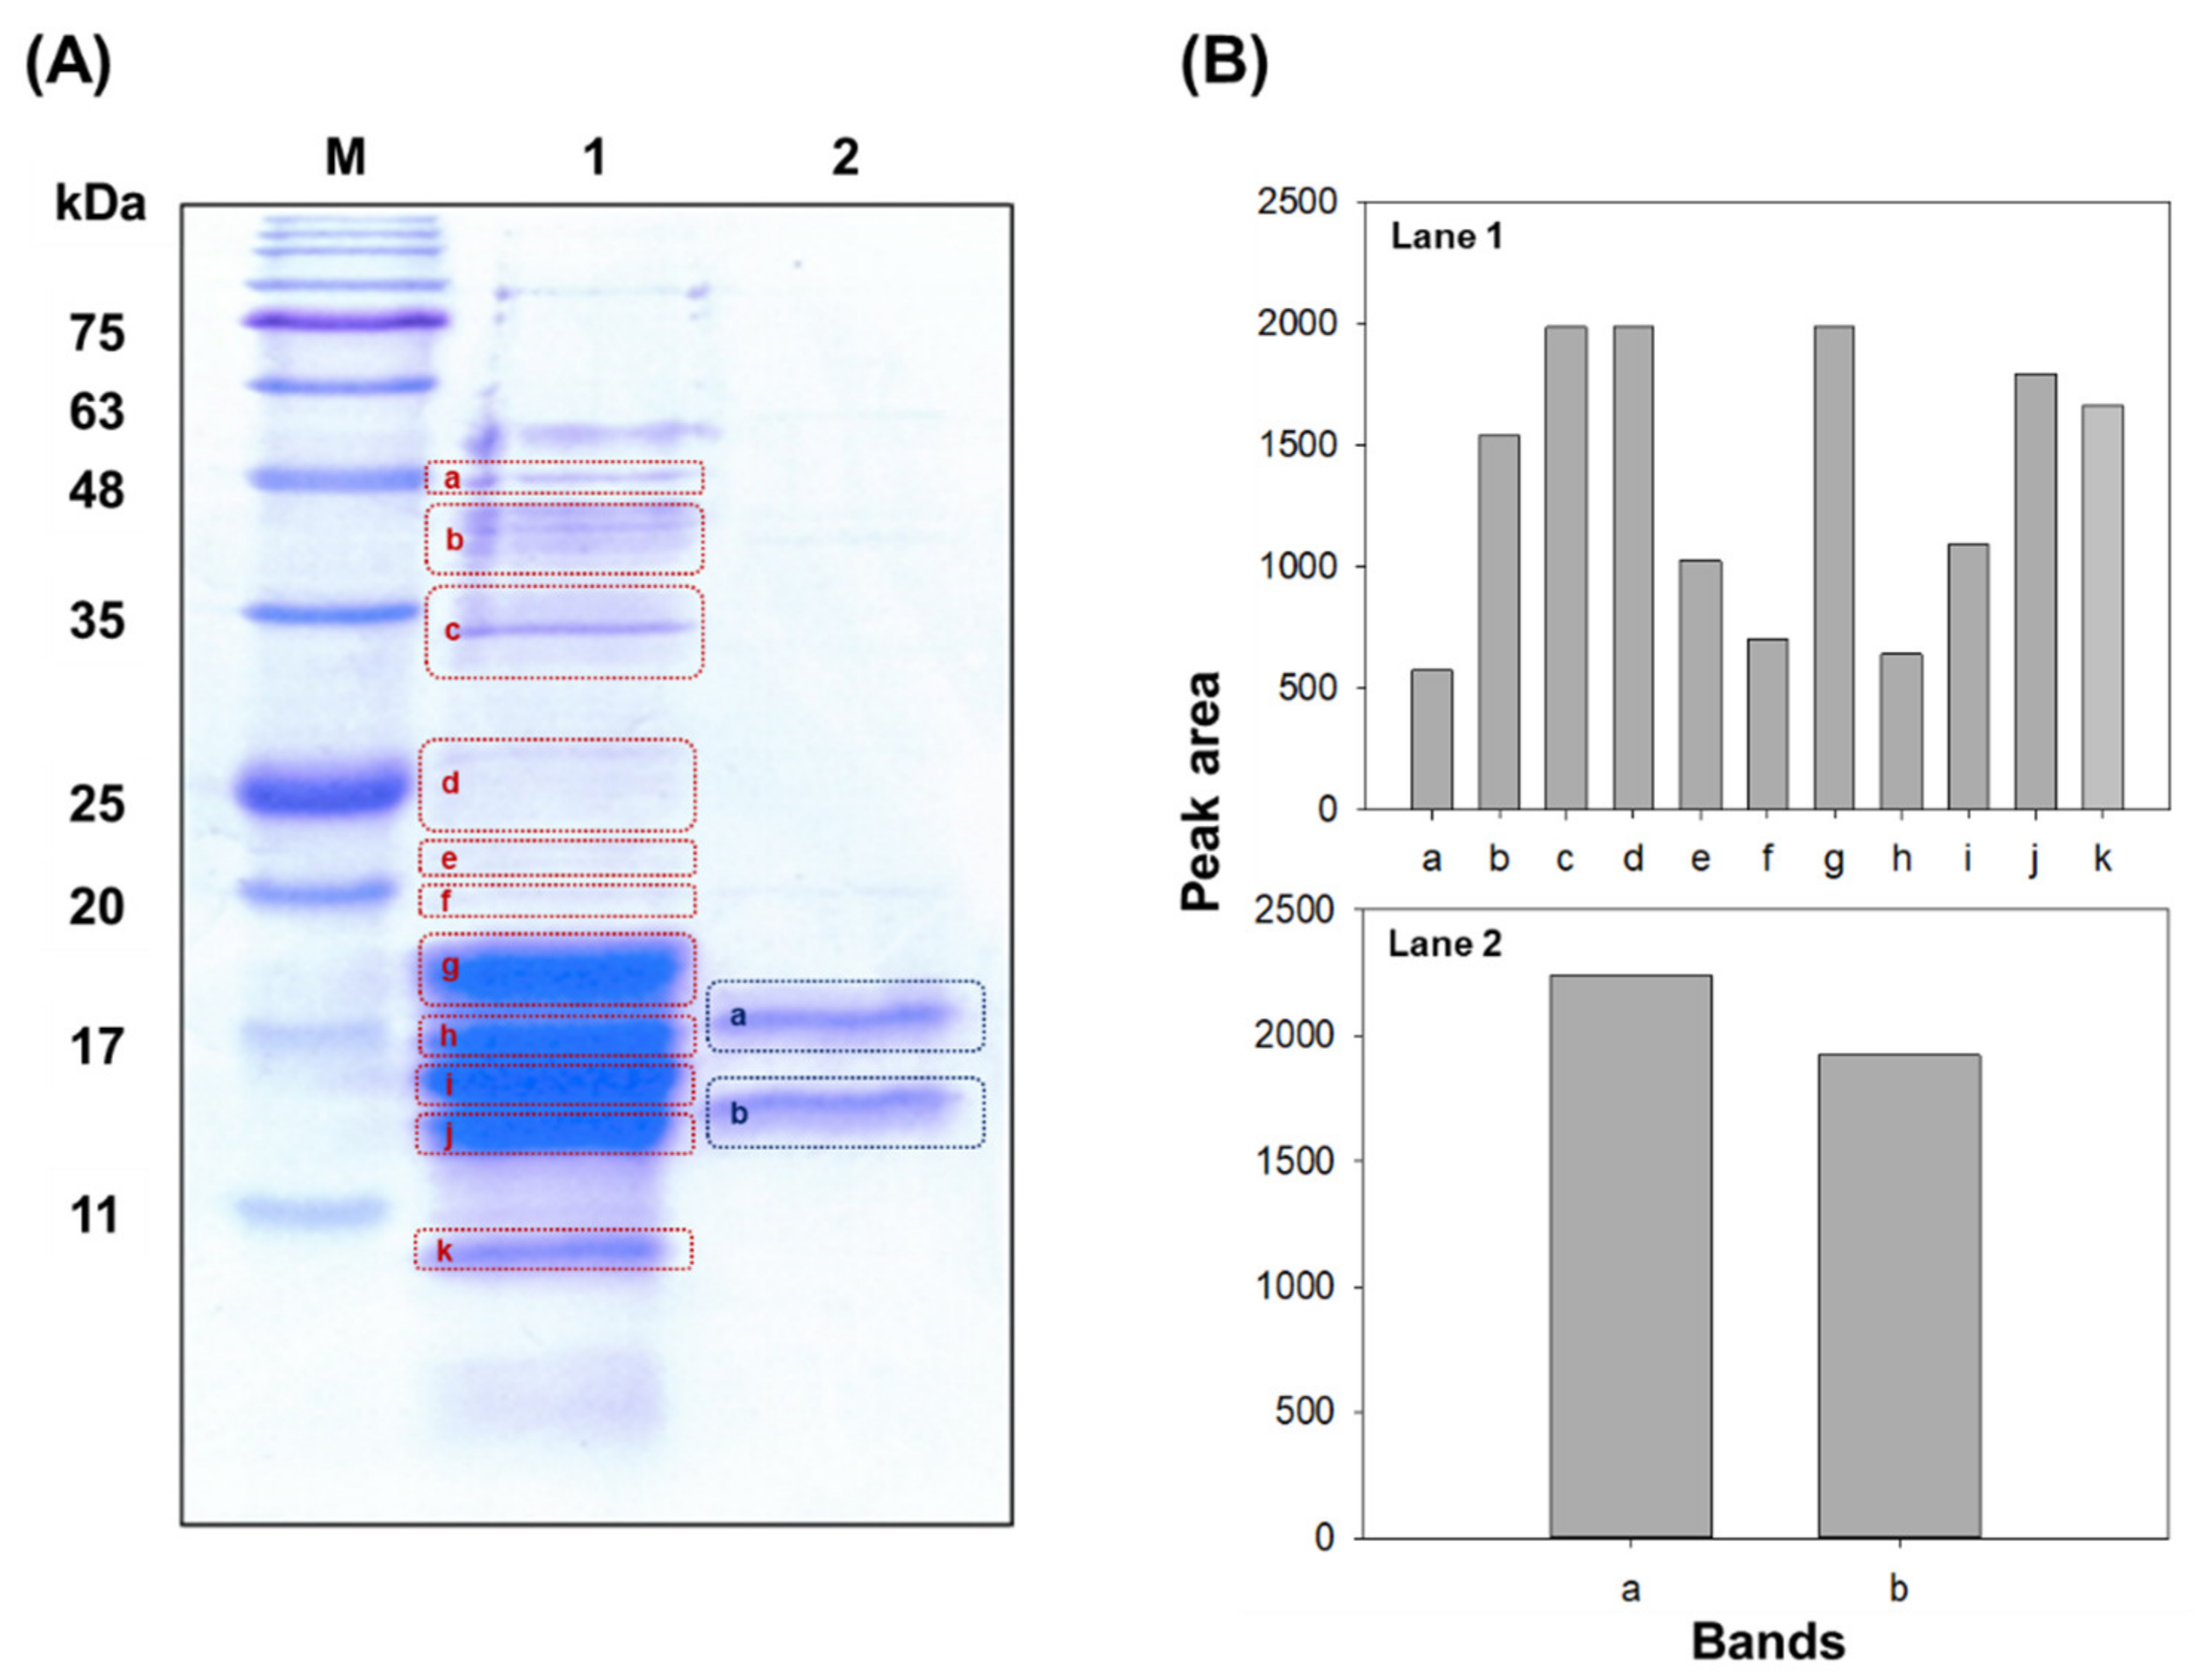
3.4. Purification of PC

Many different techniques for the extraction and purification of phycobilins from cyanobacterial species have been reported (Table S1). Figure 3 shows the protein extraction and purification process used in this study. As described in Materials and Methods, the purification process included fractionation, ultrafiltration, and ion exchange and size exclusion chromotography.
As illustrated by the electrophoresis results in Figure 4A, our proposed three step separation and purification process removed other proteins, leaving only the purified PC. We sent the crude PC extract and purified PC sample to an external testing center, which used the noise band detection method with HPLC and TOTALLAB software to confirm all proteins, including trace proteins not visually confirmed by electrophoresis. The results of the analysis of the crude PC extract and the purified sample after the three step separation procedure is shown in Figure 4B. Eleven peaks were observed in the HPLC profile of the crude extract, while only two peaks, at 8.6 min and 9.6 min, were observed in the sample that underwent three steps of extraction and purification. In addition, the peak at 8.6 min was found to correspond to 97.6% of the total protein in the purified sample, indicating that highly purified PC was obtained. The purity was confirmed to be 97.6%, and the final purified PC content was 1 mg·mL−1. To identify the cyanobacterial species with the highest phycocyanin yields, a reliable quantification method is needed. So far, phycobiliprotein yields or concentrations are most often calculated from absorbance values (Table S1), and this relatively simple approach is sometimes misleading [74].
Therefore, a different approach is needed. In this study, we analyzed the protein bands from the extracts and determined the purity based on the relative band area of the total amount instead of reporting the Apc/A280 ratio. Table S1 lists the various examples of PC purification procedures described in the literature, including the protocol presented in this work, with the PC yield and purity obtained. The extraction yield of A. maxima in this study does not appear to be lower than that of other cyanobacterial species, including A. platensis.

4. Conclusions

A. maxima has several favorable traits for commercial production, including tolerance to a range of pH conditions and the hyper-accumulation of PE and APC at low temperatures. These traits may offer significant advantages for future exploitation, especially in outdoor cultivation with fluctuating pH and temperature. We believe that A. maxima has greater potential for the commercial production of biomass and phycobiliproteins than A. platensis because of its ability to adapt to wider ranges of pH and temperature.
The enhanced production of PE and APC at the cost of algal growth in A. maxima grown at low temperatures is similar to that observed in the same species exposed to low-intensity blue light [75]. These similar responses may be due to common regulatory mechanisms, or at least crosstalk in the expression of genes encoding phycobiliproteins, with the end result of optimizing the collection of light energy in anticipation of favorable environmental conditions (Figure 5). In higher plants, the blue light photoreceptor phototropin is known to perceive both blue light and temperature, and it uses this information to regulate photosynthesis [76]. The different behaviors of Chl a and PC vs. PE and APC in response to temperature should be investigated in future studies.
The PC market size was estimated at USD 155.3 million in 2020, and is predicted to reach USD 409.8 million by 2030, at a compound annual growth rate (CAGR) of 9.6% from 2021 to 2030 [77]. The price of PC may depend on its purity and intended use. Our study demonstrated a new method for the purification of PC from A. maxima, which produced PC at 1.0 mg·mL−1 with 97.6% purity. All processes represent economically viable alternatives for industrial scale-up if they can be adapted to a continuous process and simplified to allow for large-scale handling.
The cost-effective production and harvesting of the biomass could be a major challenge for scaling up the purification of PC. To achieve large-scale production of the A. maxima biomass, new techniques such as photoautotrophic, mixotrophic, and heterotrophic production could be further explored [78,79].
There are a number of techniques for harvesting algae, such as sedimentation, flocculation, flotation, centrifugation, and filtration, or a combination of these. In general, the optimal harvesting method should use as few chemicals and as little energy as possible. Physical and chemisorption of algae with graphene (GO)-based tissue is also possible, since GO can easily interact with different functional groups [80,81,82].
Figure 5. A conceptual framework for the possible simultaneous perception of blue light and low temperature by dual receptors in A. maxima that signal the production of phycoerythrin (PE) and allophycocyanin (APC) [83] and delay cell proliferation. BLUF: sensor of blue light using flavin adenine dinucleotide (FAD) [84], CBCRs: cyanobacteriochrome [85], CRY: cryptochrome [86], LOV domains: light–oxygen–voltage sensing domains [87], OCP: orange carotenoid-binding protein [88], PYP: photoactive yellow protein [89].
Biology 11 00628 g005

Supplementary Materials

The following supporting information can be downloaded at: https://www.mdpi.com/article/10.3390/biology11050628/s1, Table S1: Process for the extraction and purification of phycocyanin from cyanobacteria. References [90,91,92,93,94,95,96,97,98,99,100,101,102,103,104,105,106,107,108,109,110,111,112,113,114,115,116,117,118,119,120,121,122,123,124,125,126,127,128,129] are cited in the Supplementary Materials.

Author Contributions

Conceptualization, T.H.; methodology, J.P., H.L. and T.B.D.; investigation, J.P. and T.B.D.; resources, S.C.; data curation, H.L.; writing—original draft preparation, J.P.; writing—review and editing, J.P., J.D.S., S.D., M.T.B. and T.H.; supervision, T.H. All authors have read and agreed to the published version of the manuscript.

Funding

This research was supported by the National Institute of Environment Research (NIER) and funded by the Ministry of Environment (MOE) of the Republic of Korea (NIER-2020-03-01-010).

Institutional Review Board Statement

Not applicable.

Informed Consent Statement

Not applicable.

Data Availability Statement

All the results found are available in this manuscript.

Conflicts of Interest

The authors declare no conflict of interest.

References

  1. Chen, H.-B.; Wu, J.-Y.; Wang, C.-F.; Fu, C.-C.; Shieh, C.-J.; Chen, C.-I.; Wang, C.-Y.; Liu, Y.-C. Modeling on chlorophyll a and phycocyanin production by Spirulina platensis under various light-emitting diodes. Biochem. Eng. J. 2010, 53, 52–56. [Google Scholar] [CrossRef]
  2. Zeng, X.; Danquah, M.K.; Zhang, S.; Zhang, X.; Wu, M.; Chen, X.D.; Ng, I.-S.; Jing, K.; Lu, Y. Autotrophic cultivation of Spirulina platensis for CO2 fixation and phycocyanin production. Chem. Eng. J. 2012, 183, 192–197. [Google Scholar] [CrossRef]
  3. Xie, Y.; Jin, Y.; Zeng, X.; Chen, J.; Lu, Y.; Jing, K. Fed-batch strategy for enhancing cell growth and C-phycocyanin production of Arthrospira (Spirulina) platensis under phototrophic cultivation. Bioresour. Technol. 2015, 180, 281–287. [Google Scholar] [CrossRef] [PubMed]
  4. Da Fontoura Prates, D.; Radmann, E.M.; Duarte, J.H.; de Morais, M.G.; Costa, J.A.V. Spirulina cultivated under different light emitting diodes: Enhanced cell growth and phycocyanin production. Bioresour. Technol. 2018, 256, 38–43. [Google Scholar] [CrossRef]
  5. Wikfors, G.H.; Ohno, M. Impact of algal research in aquaculture. J. Phycol. 2001, 37, 968–974. [Google Scholar] [CrossRef]
  6. Pandey, J.; Pathak, N.; Tiwari, A. Standardization of pH and light intensity for the biomass production of Spirulina platensis. J. Algal Biomass Util. 2010, 1, 93–102. [Google Scholar]
  7. Sarkar, S.; Gayen, K.; Bhowmick, T.K. Green extraction of biomolecules from algae using subcritical and supercritical fluids. Biomass Convers. Biorefin. 2022, 1–23. [Google Scholar] [CrossRef]
  8. Wijffels, R.H.; Kruse, O.; Hellingwerf, K.J. Potential of industrial biotechnology with cyanobacteria and eukaryotic microalgae. Curr. Opin. Biotechnol. 2013, 24, 405–413. [Google Scholar] [CrossRef]
  9. Wang, W.; Liu, X.; Lu, X. Engineering cyanobacteria to improve photosynthetic production of alka(e)nes. Biotechnol. Biofuels 2013, 6, 69. [Google Scholar] [CrossRef] [Green Version]
  10. Paliwal, C.; Mitra, M.; Bhayani, K.; Bharadwaj, S.V.; Ghosh, T.; Dubey, S.; Mishra, S. Abiotic stresses as tools for metabolites in microalgae. Bioresour. Technol. 2017, 244, 1216–1226. [Google Scholar] [CrossRef]
  11. Rafiqul, I.; Jalal, K.; Alam, M. Environmental factors for optimization of Spirulina biomass in laboratory culture. Biotechnology 2005, 4, 19–22. [Google Scholar]
  12. Keithellakpam, O.S.; Nath, T.O.; Oinam, A.S.; Thingujam, I.; Oinam, G.; Dutt, S.G. Effect of external pH on cyanobacterial phycobiliproteins production and ammonium excretion. J. Appl. Biol. Biotechnol. 2015, 3, 38–42. [Google Scholar]
  13. Ismaiel, M.M.S.; El-Ayouty, Y.M.; Piercey-Normore, M. Role of pH on antioxidants production by Spirulina (Arthrospira) platensis. Braz. J. Microbiol. 2016, 47, 298–304. [Google Scholar] [CrossRef] [Green Version]
  14. Hinners, J.; Hofmeister, R.; Hense, I. Modeling the role of pH on Baltic Sea cyanobacteria. Life 2015, 5, 1204–1217. [Google Scholar] [CrossRef] [Green Version]
  15. Reynolds, C.S. The Ecology of Freshwater Phytoplankton; Cambridge University Press: Cambridge, UK, 1984. [Google Scholar]
  16. Johnson, E.M.; Kumar, K.; Das, D. Physicochemical parameters optimization, and purification of phycobiliproteins from the isolated Nostoc sp. Bioresour. Technol. 2014, 166, 541–547. [Google Scholar] [CrossRef]
  17. Robarts, R.D.; Zohary, T. Temperature effects on photosynthetic capacity, respiration, and growth rates of bloom-forming cyanobacteria. N. Z. J. Mar. Freshw. Res. 1987, 21, 391–399. [Google Scholar] [CrossRef] [Green Version]
  18. Coles, J.F.; Jones, R.C. Effect of temperature on photosynthesis-light response and growth of four phytoplankton species isolated from a tidal freshwater river. J. Phycol. 2000, 36, 7–16. [Google Scholar] [CrossRef]
  19. Paerl, H.W. Mitigating harmful cyanobacterial blooms in a human-and climatically-impacted world. Life 2014, 4, 988–1012. [Google Scholar] [CrossRef] [Green Version]
  20. Udayan, A.; Arumugam, M.; Pandey, A. Nutraceuticals from algae and cyanobacteria. In Algal Green Chemistry; Elsevier: Amsterdam, The Netherlands, 2017; pp. 65–89. [Google Scholar]
  21. Eriksen, N.T. Production of phycocyanin—A pigment with applications in biology, biotechnology, foods and medicine. Appl. Microbiol. Biotechnol. 2008, 80, 1–14. [Google Scholar] [CrossRef]
  22. Pagels, F.; Guedes, A.C.; Amaro, H.M.; Kijjoa, A.; Vasconcelos, V. Phycobiliproteins from cyanobacteria: Chemistry and biotechnological applications. Biotechnol. Adv. 2019, 37, 422–443. [Google Scholar] [CrossRef]
  23. Sekar, S.; Chandramohan, M. Phycobiliproteins as a commodity: Trends in applied research, patents and commercialization. J. Appl. Phycol. 2008, 20, 113–136. [Google Scholar] [CrossRef]
  24. Khatoon, H.; Leong, L.K.; Rahman, N.A.; Mian, S.; Begum, H.; Banerjee, S.; Endut, A. Effects of different light source and media on growth and production of phycobiliprotein from freshwater cyanobacteria. Bioresour. Technol. 2018, 249, 652–658. [Google Scholar] [CrossRef]
  25. Ojit, S.; Indrama, T.; Gunapati, O.; Avijeet, S.; Subhalaxmi, S.; Silvia, C.; Indira, D.; Romi, K.; Minerva, S.; Thadoi, D. The response of phycobiliproteins to light qualities in Anabaena circinalis. J. Appl. Biol. Biotechnol. 2015, 3, 1–6. [Google Scholar]
  26. Research and Markets. Phycobiliprotein Global Market Insights 2021, Analysis and Forecast to 2026, by Manufacturers, Regions, Technology, Application. July 2021. Available online: https://www.researchandmarkets.com/reports/5358532/phycobiliprotein-global-market-insights-2021#src-pos-1 (accessed on 6 April 2022).
  27. De Oliveira, M.; Monteiro, M.; Robbs, P.; Leite, S. Growth and chemical composition of Spirulina maxima and Spirulina platensis biomass at different temperatures. Aquac. Int. 1999, 7, 261–275. [Google Scholar] [CrossRef]
  28. Chaneva, G.; Furnadzhieva, S.; Minkova, K.; Lukavsky, J. Effect of light and temperature on the cyanobacterium Arthronema africanum—A prospective phycobiliprotein-producing strain. J. Appl. Phycol. 2007, 19, 537–544. [Google Scholar] [CrossRef]
  29. Ajayan, K.; Selvaraju, M.; Thirugnanamoorthy, K. Enrichment of chlorophyll and phycobiliproteins in Spirulina platensis by the use of reflector light and nitrogen sources: An in-vitro study. Biomass Bioenergy 2012, 47, 436–441. [Google Scholar] [CrossRef]
  30. Rodríguez-Sánchez, R.; Ortiz-Butrón, R.; Blas-Valdivia, V.; Hernández-García, A.; Cano-Europa, E. Phycobiliproteins or C-phycocyanin of Arthrospira (Spirulina) maxima protect against HgCl2-caused oxidative stress and renal damage. Food Chem. 2012, 135, 2359–2365. [Google Scholar] [CrossRef]
  31. Evans, L. The Effects of Spectral Composition and Irradiance Level on Pigment Levels in Seaweeds. In Experimental Phycology; Lobban, C.S., Chapman, D.J., Kremer, B.P., Eds.; Cambridge University Press: New York, NY, USA, 1988; pp. 123–133. [Google Scholar]
  32. Bennett, A.; Bogorad, L. Complementary chromatic adaptation in a filamentous blue-green alga. J. Cell Biol. 1973, 58, 419–435. [Google Scholar] [CrossRef]
  33. Schreiber, U. Pulse-amplitude-modulation (PAM) fluorometry and saturation pulse method: An overview. Chlorophyll Fluoresc. 2004, 279–319. [Google Scholar] [CrossRef]
  34. Jassby, A.D.; Platt, T. Mathematical formulation of the relationship between photosynthesis and light for phytoplankton. Limnol. Oceanogr. 1976, 21, 540–547. [Google Scholar] [CrossRef] [Green Version]
  35. Walsby, A. Cell-Water and Cell-Solute. In The Biology of Cyanobacteria; Carr, N.G., Whitton, B.A., Eds.; University of California Press: Berkeley, CA, USA; Los Angeles, CA, USA, 1982; Volume 19, p. 237. [Google Scholar]
  36. Fogg, G. The comparative physiology and biochemistry of the blue-green algae. Bacteriol. Rev. 1956, 20, 148–165. [Google Scholar] [CrossRef] [PubMed]
  37. Pandey, J.P.; Tiwari, A. Optimization of biomass production of Spirulina maxima. J. Algal Biomass Util. 2010, 1, 20–32. [Google Scholar]
  38. Thirumala, M. Optimization of growth of Spirulina platensis LN1 for production of carotenoids. Int. J. Life Sci. Biotechnol. Pharma Res. 2012, 1, 152–157. [Google Scholar]
  39. Brock, T.D. Lower pH limit for the existence of blue-green algae: Evolutionary and ecological implications. Science 1973, 179, 480–483. [Google Scholar] [CrossRef]
  40. Kallas, T.; Castenholz, R.W. Internal pH and ATP-ADP pools in the cyanobacterium Synechococcus sp. during exposure to growth-inhibiting low pH. J. Bacteriol. 1982, 149, 229–236. [Google Scholar] [CrossRef] [Green Version]
  41. Mangan, N.M.; Flamholz, A.; Hood, R.D.; Milo, R.; Savage, D.F. pH determines the energetic efficiency of the cyanobacterial CO2 concentrating mechanism. Proc. Natl. Acad. Sci. USA 2016, 113, E5354–E5362. [Google Scholar] [CrossRef] [Green Version]
  42. Boatman, T.G.; Oxborough, K.; Gledhill, M.; Lawson, T.; Geider, R.J. An integrated response of Trichodesmium erythraeum IMS101 growth and photo-physiology to iron, CO2, and light intensity. Front. Microbiol. 2018, 9, 624. [Google Scholar] [CrossRef] [Green Version]
  43. Manduzio, H.; Rocher, B.; Durand, F.; Galap, C.; Leboulenger, F. The point about oxidative stress in molluscs. Invertebr. Surviv. J. 2005, 2, 91–104. [Google Scholar]
  44. Rippka, R.; Deruelles, J.; Waterbury, J.B.; Herdman, M.; Stanier, R.Y. Generic assignments, strain histories and properties of pure cultures of cyanobacteria. Microbiology 1979, 111, 1–61. [Google Scholar] [CrossRef] [Green Version]
  45. Hinga, K.R. Effects of pH on coastal marine phytoplankton. Mar. Ecol. Prog. Ser. 2002, 238, 281–300. [Google Scholar] [CrossRef]
  46. Hossain, M.F.; Ratnayake, R.R.; Meerajini, K.; Wasantha Kumara, K. Antioxidant properties in some selected cyanobacteria isolated from fresh water bodies of Sri Lanka. Food Sci. Nutr. 2016, 4, 753–758. [Google Scholar] [CrossRef] [Green Version]
  47. Balasubramanian, L.; Subramanian, G.; Nazeer, T.T.; Simpson, H.S.; Rahuman, S.T.; Raju, P. Cyanobacteria cultivation in industrial wastewaters and biodiesel production from their biomass: A review. Biotechnol. Appl. Biochem. 2011, 58, 220–225. [Google Scholar] [CrossRef]
  48. Markou, G.; Georgakakis, D. Cultivation of filamentous cyanobacteria (blue-green algae) in agro-industrial wastes and wastewaters: A review. Appl. Energy 2011, 88, 3389–3401. [Google Scholar] [CrossRef]
  49. Liotenberg, S.; Campbell, D.; Rippka, R.; Houmard, J.; de Marsac, N.T. Effect of the nitrogen source on phycobiliprotein synthesis and cell reserves in a chromatically adapting filamentous cyanobacterium. Microbiology 1996, 142, 611–622. [Google Scholar] [CrossRef] [Green Version]
  50. Lürling, M.; Eshetu, F.; Faassen, E.J.; Kosten, S.; Huszar, V.L. Comparison of cyanobacterial and green algal growth rates at different temperatures. Freshw. Biol. 2013, 58, 552–559. [Google Scholar] [CrossRef]
  51. Kumar, M.; Kulshreshtha, J.; Singh, G.P. Growth and biopigment accumulation of cyanobacterium Spirulina platensis at different light intensities and temperature. Braz. J. Microbiol. 2011, 42, 1128–1135. [Google Scholar] [CrossRef] [Green Version]
  52. Ranjitha, K.; Kaushik, B. Purification of phycobiliproteins from Nostoc muscorum. NISCARI Online Period. Repos. 2005, 64, 372–375. [Google Scholar]
  53. Richmond, A.; Grobbelaar, J.U. Factors affecting the output rate of Spirulina platensis with reference to mass cultivation. Biomass 1986, 10, 253–264. [Google Scholar] [CrossRef]
  54. Borowitzka, M.A. Algal physiology and large-scale outdoor cultures of microalgae. In The Physiology of Microalgae; Springer: Berlin/Heidelberg, Germany, 2016; pp. 601–652. [Google Scholar]
  55. Sharma, G.; Kumar, M.; Ali, M.I.; Jasuja, N.D. Effect of carbon content, salinity and pH on Spirulina platensis for phycocyanin, allophycocyanin and phycoerythrin accumulation. J. Microb. Biochem. Technol. 2014, 6, 202–206. [Google Scholar] [CrossRef] [Green Version]
  56. Soltani, N.; Khavari-Nejad, R.A.; Yazdi, M.T.; Shokravi, S.; Fernández-Valiente, E. Variation of nitrogenase activity, photosynthesis and pigmentation of the cyanobacterium Fischerella ambigua strain FS18 under different irradiance and pH values. World J. Microbiol. Biotechnol. 2006, 22, 571–576. [Google Scholar] [CrossRef]
  57. Poza-Carrión, C.; Fernández-Valiente, E.; Piñas, F.F.; Leganés, F. Acclimation of photosynthetic pigments and photosynthesis of the cyanobacterium Nostoc sp. strain UAM206 to combined fluctuations of irradiance, pH, and inorganic carbon availability. J. Plant Physiol. 2001, 158, 1455–1461. [Google Scholar] [CrossRef]
  58. Koca, N.; Karadeniz, F.; Burdurlu, H.S. Effect of pH on chlorophyll degradation and colour loss in blanched green peas. Food Chem. 2007, 100, 609–615. [Google Scholar] [CrossRef]
  59. Schlodder, E.; Meyer, B. pH dependence of oxygen evolution and reduction kinetics of photooxidized chlorophyll aII (P-680) in Photosystem II particles from Synechococcus sp. Biochim. Biophys. Acta Bioenerg. 1987, 890, 23–31. [Google Scholar] [CrossRef]
  60. Li, D.; Lijan, X.; Xu, Q.; Wang, K.; Gong, Y.; Kuang, T.; Zhang, X.; Zhao, N. pH dependence of chlorophyll states, protein structures and function of the PSII membranes. Tsinghua Sci. Technol. 2003, 8, 493–497. [Google Scholar]
  61. Guedes, A.C.; Amaro, H.M.; Gião, M.S.; Malcata, F.X. Optimization of ABTS radical cation assay specifically for determination of antioxidant capacity of intracellular extracts of microalgae and cyanobacteria. Food Chem. 2013, 138, 638–643. [Google Scholar] [CrossRef]
  62. Fatma, T. Screening of cyanobacteria for phycobiliproteins and effect of different environmental stress on its yield. Bull. Environ. Contam. Toxicol. 2009, 83, 509. [Google Scholar]
  63. Maurya, S.; Maurya, J.; Pandey, V. Factors regulating phycobiliprotein production in cyanobacteria. Int. J. Curr. Microbiol. Appl. Sci. 2014, 3, 764–771. [Google Scholar]
  64. Sakamoto, T.; Bryant, D.A. Growth at low temperature causes nitrogen limitation in the cyanobacterium Synechococcus sp. PCC 7002. Arch. Microbiol. 1997, 169, 10–19. [Google Scholar] [CrossRef]
  65. Tandeau de Marsac, N.; Houmard, J. Adaptation of cyanobacteria to environmental stimuli: New steps towards molecular mechanisms. FEMS Microbiol. Rev. 1993, 10, 119–189. [Google Scholar] [CrossRef]
  66. Boussiba, S.; Richmond, A.E. C-phycocyanin as a storage protein in the blue-green alga Spirulina platensis. Arch. Microbiol. 1980, 125, 143–147. [Google Scholar] [CrossRef]
  67. Wyman, M.; Gregory, R.; Carr, N. Novel role for phycoerythrin in a marine cyanobacterium, Synechococcus strain DC2. Science 1985, 230, 818–820. [Google Scholar] [CrossRef]
  68. Vonshak, A.; Torzillo, G.; Tomaseli, L. Use of chlorophyll fluorescence to estimate the effect of photoinhibition in outdoor cultures of Spirulina platensis. J. Appl. Phycol. 1994, 6, 31–34. [Google Scholar] [CrossRef]
  69. Gao, K.; Yu, H.; Brown, M.T. Solar PAR and UV radiation affects the physiology and morphology of the cyanobacterium Anabaena sp. PCC 7120. J. Photochem. Photobiol. B Biol. 2007, 89, 117–124. [Google Scholar] [CrossRef]
  70. Maxwell, K.; Johnson, G.N. Chlorophyll fluorescence—A practical guide. J. Exp. Bot. 2000, 51, 659–668. [Google Scholar] [CrossRef]
  71. Neelam, S.; Subramanyam, R. Alteration of photochemistry and protein degradation of photosystem II from Chlamydomonas reinhardtii under high salt grown cells. J. Photochem. Photobiol. B Biol. 2013, 124, 63–70. [Google Scholar] [CrossRef]
  72. Zhao, B.; Wang, J.; Gong, H.; Wen, X.; Ren, H.; Lu, C. Effects of heat stress on PSII photochemistry in a cyanobacterium Spirulina platensis. Plant Sci. 2008, 175, 556–564. [Google Scholar] [CrossRef]
  73. Zhang, L.; Liu, J. Effects of heat stress on photosynthetic electron transport in a marine cyanobacterium Arthrospira sp. J. Appl. Phycol. 2016, 28, 757–763. [Google Scholar] [CrossRef]
  74. Saluri, M.; Kaldmäe, M.; Tuvikene, R. Reliable quantification of R-phycoerythrin from red algal crude extracts. J. Appl. Phycol. 2020, 32, 1421–1428. [Google Scholar] [CrossRef]
  75. Park, J.; Dinh, T.B. Contrasting effects of monochromatic LED lighting on growth, pigments and photosynthesis in the commercially important cyanobacterium Arthrospira maxima. Bioresour. Technol. 2019, 291, 121846. [Google Scholar] [CrossRef]
  76. Fujii, Y.; Tanaka, H.; Konno, N.; Ogasawara, Y.; Hamashima, N.; Tamura, S.; Hasegawa, S.; Hayasaki, Y.; Okajima, K.; Kodama, Y. Phototropin perceives temperature based on the lifetime of its photoactivated state. Proc. Natl. Acad. Sci. USA 2017, 114, 9206–9211. [Google Scholar] [CrossRef] [Green Version]
  77. Sachan, S.; Jangra, H.; Kumar, V. RFID Market by Product Type (Tags, Readers, and Software & Services), Frequency (Low Frequency, High Frequency, and Ultra High Frequency), and End Use (Commercial, Animal Tracking, Transportation, Agriculture, Security & Access Control, Healthcare, Retail, Logistics & Supply Chain, and Others): Global Opportunity Analysis and Industry Forecast, 2021–2030; Allied Market Research. November 2021. Available online: https://www.alliedmarketresearch.com/rfid-market-A14522 (accessed on 6 April 2022).
  78. Milledge, J.J.; Heaven, S. A review of the harvesting of micro-algae for biofuel production. Rev. Environ. Sci. Bio/Technol. 2013, 12, 165–178. [Google Scholar] [CrossRef] [Green Version]
  79. Pragya, N.; Pandey, K.K.; Sahoo, P. A review on harvesting, oil extraction and biofuels production technologies from microalgae. Renew. Sustain. Energy Rev. 2013, 24, 159–171. [Google Scholar] [CrossRef]
  80. Yun, Y.J.; Hong, W.G.; Kim, W.J.; Jun, Y.; Kim, B.H. A novel method for applying reduced graphene oxide directly to electronic textiles from yarns to fabrics. Adv. Mater. 2013, 25, 5701–5705. [Google Scholar] [CrossRef]
  81. Kim, C.H.; Kim, B.-H.; Yang, K.S. TiO2 nanoparticles loaded on graphene/carbon composite nanofibers by electrospinning for increased photocatalysis. Carbon 2012, 50, 2472–2481. [Google Scholar] [CrossRef]
  82. Kim, J.K.; Kottuparambil, S.; Moh, S.H.; Lee, T.K.; Kim, Y.-J.; Rhee, J.-S.; Choi, E.-M.; Kim, B.H.; Yu, Y.J.; Yarish, C. Potential applications of nuisance microalgae blooms. J. Appl. Phycol. 2015, 27, 1223–1234. [Google Scholar] [CrossRef]
  83. Sonani, R.R.; Rastogi, R.P.; Patel, R.; Madamwar, D. Recent advances in production, purification and applications of phycobiliproteins. World J. Biol. Chem. 2016, 7, 100. [Google Scholar] [CrossRef]
  84. Hoff, W.D.; Van Stokkum, I.H.; Gural, J.; Hellingwerf, K.J. Comparison of acid denaturation and light activation in the eubacterial blue-light receptor photoactive yellow protein. Biochim. Biophys. Acta Bioenerg. 1997, 1322, 151–162. [Google Scholar] [CrossRef] [Green Version]
  85. Enomoto, G.; Nomura, R.; Shimada, T.; Narikawa, R.; Ikeuchi, M. Cyanobacteriochrome SesA Is a Diguanylate Cyclase That Induces Cell Aggregation in Thermosynechococcus. J. Biol. Chem. 2014, 289, 24801–24809. [Google Scholar] [CrossRef] [Green Version]
  86. Brudler, R.; Hitomi, K.; Daiyasu, H.; Toh, H.; Kucho, K.-i.; Ishiura, M.; Kanehisa, M.; Roberts, V.A.; Todo, T.; Tainer, J.A. Identification of a new cryptochrome class: Structure, function, and evolution. Mol. Cell 2003, 11, 59–67. [Google Scholar] [CrossRef]
  87. Cao, Z.; Livoti, E.; Losi, A.; Gärtner, W. A blue light-inducible phosphodiesterase activity in the cyanobacterium Synechococcus elongatus. Photochem. Photobiol. 2010, 86, 606–611. [Google Scholar] [CrossRef]
  88. Boulay, C.; Abasova, L.; Six, C.; Vass, I.; Kirilovsky, D. Occurrence and function of the orange carotenoid protein in photoprotective mechanisms in various cyanobacteria. Biochim. Biophys. Acta Bioenerg. 2008, 1777, 1344–1354. [Google Scholar] [CrossRef] [PubMed] [Green Version]
  89. Nielsen, I.; Boyé-Péronne, S.; El Ghazaly, M.; Kristensen, M.B.; Nielsen, S.B.; Andersen, L. Absorption spectra of photoactive yellow protein chromophores in vacuum. Biophys. J. 2005, 89, 2597–2604. [Google Scholar] [CrossRef] [PubMed] [Green Version]
  90. Benedetti, S.; Rinalducci, S.; Benvenuti, F.; Francogli, S.; Pagliarani, S.; Giorgi, L.; Micheloni, M.; D’Amici, G.M.; Zolla, L.; Canestrari, F. Purification and characterization of phycocyanin from the blue-green alga Aphanizomenon flos-aquae. J. Chromatogr. B 2006, 833, 12–18. [Google Scholar] [CrossRef] [PubMed]
  91. Piron, R.; Bustamante, T.; Barriga, A.; Lagos, N. Phycobilisome isolation and C-phycocyanin purification from the cyanobacterium Aphanizomenon gracile. Photosynthetica 2019, 57, 491–499. [Google Scholar] [CrossRef] [Green Version]
  92. Minkova, K.; Tchernov, A.; Tchorbadjieva, M.; Fournadjieva, S.; Antova, R.; Busheva, M.C. Purification of C-phycocyanin from Spirulina (Arthrospira) fusiformis. J. Biotechnol. 2003, 102, 55–59. [Google Scholar] [CrossRef]
  93. Munawaroh, H.; Darojatun, K.; Gumilar, G.; Aisyah, S.; Wulandari, A. Characterization of phycocyanin from Spirulina fusiformis and its thermal stability. In Proceedings of the Journal of Physics: Conference Series; IOP Publishing: Bristol, UK, 2018; p. 12205. [Google Scholar]
  94. Rito-Palomares, M.; Nunez, L.; Amador, D. Practical application of aqueous two-phase systems for the development of a prototype process for c-phycocyanin recovery from Spirulina maxima. J. Chem. Technol. Biotechnol. 2001, 76, 1273–1280. [Google Scholar] [CrossRef]
  95. Bhaskar, S.U.; Gopalaswamy, G.; Raghu, R. A simple method for efficient extraction and purification of C-phycocyanin from Spirulina platensis Geitler. NISCARI Online Period. Repos. 2005, 43, 277–279. [Google Scholar]
  96. Patil, G.; Chethana, S.; Sridevi, A.; Raghavarao, K. Method to obtain C-phycocyanin of high purity. J. Chromatogr. A 2006, 1127, 76–81. [Google Scholar] [CrossRef]
  97. Jian-Feng, N.; Guang-Ce, W.; Lin, X.-z.; Zhou, B.-C. Large-scale recovery of C-phycocyanin from Spirulina platensis using expanded bed adsorption chromatography. J. Chromatogr. B 2007, 850, 267–276. [Google Scholar]
  98. Patil, G.; Raghavarao, K. Aqueous two phase extraction for purification of C-phycocyanin. Biochem. Eng. J. 2007, 34, 156–164. [Google Scholar] [CrossRef]
  99. Silveira, S.T.; Burkert, J.d.M.; Costa, J.A.V.; Burkert, C.A.V.; Kalil, S.J. Optimization of phycocyanin extraction from Spirulina platensis using factorial design. Bioresour. Technol. 2007, 98, 1629–1634. [Google Scholar] [CrossRef]
  100. Patil, G.; Chethana, S.; Madhusudhan, M.; Raghavarao, K. Fractionation and purification of the phycobiliproteins from Spirulina platensis. Bioresour. Technol. 2008, 99, 7393–7396. [Google Scholar] [CrossRef]
  101. Moraes, C.C.; Sala, L.; Ores, J.d.C.; Braga, A.R.C.; Costa, J.A.V.; Kalil, S.J. Expanded and fixed bed ion exchange chromatography for the recovery of C-phycocyanin in a single step by using lysed cells. Can. J. Chem. Eng. 2015, 93, 111–115. [Google Scholar] [CrossRef]
  102. Yan, S.-G.; Zhu, L.-P.; Su, H.-N.; Zhang, X.-Y.; Chen, X.-L.; Zhou, B.-C.; Zhang, Y.-Z. Single-step chromatography for simultaneous purification of C-phycocyanin and allophycocyanin with high purity and recovery from Spirulina (Arthrospira) platensis. J. Appl. Phycol. 2011, 23, 1–6. [Google Scholar] [CrossRef]
  103. Liao, X.; Zhang, B.; Wang, X.; Yan, H.; Zhang, X. Purification of C-phycocyanin from Spirulina platensis by single-step ion-exchange chromatography. Chromatographia 2011, 73, 291–296. [Google Scholar] [CrossRef]
  104. Bermejo, R.; Ramos, A. Pilot scale recovery of phycocyanin from Spirulina platensis using expanded bed adsorption chromatography. Chromatographia 2012, 75, 195–204. [Google Scholar] [CrossRef]
  105. Kumar, D.; Dhar, D.W.; Pabbi, S.; Kumar, N.; Walia, S. Extraction and purification of C-phycocyanin from Spirulina platensis (CCC540). Indian J. Plant Physiol. 2014, 19, 184–188. [Google Scholar] [CrossRef] [Green Version]
  106. Su, C.-H.; Liu, C.-S.; Yang, P.-C.; Syu, K.-S.; Chiuh, C.-C. Solid–liquid extraction of phycocyanin from Spirulina platensis: Kinetic modeling of influential factors. Sep. Purif. Technol. 2014, 123, 64–68. [Google Scholar] [CrossRef]
  107. Suman, S.; Puri, N.; Jasuja, N.; Kumar, M.; Sharma, G. Optimization, purification and characterization of phycocyanin from Spirulina platensis. Int. J. Appl. Pure Sci. Agric. 2016, 2, 15–20. [Google Scholar]
  108. Chen, C.-Y.; Kao, P.-C.; Tan, C.H.; Show, P.L.; Cheah, W.Y.; Lee, W.-L.; Ling, T.C.; Chang, J.-S. Using an innovative pH-stat CO2 feeding strategy to enhance cell growth and C-phycocyanin production from Spirulina platensis. Biochem. Eng. J. 2016, 112, 78–85. [Google Scholar] [CrossRef]
  109. Martínez, J.M.; Luengo, E.; Saldaña, G.; Álvarez, I.; Raso, J. C-phycocyanin extraction assisted by pulsed electric field from Artrosphira platensis. Food Res. Int. 2017, 99, 1042–1047. [Google Scholar] [CrossRef]
  110. Lauceri, R.; Zittelli, G.C.; Maserti, B.; Torzillo, G. Purification of phycocyanin from Arthrospira platensis by hydrophobic interaction membrane chromatography. Algal Res. 2018, 35, 333–340. [Google Scholar] [CrossRef]
  111. Tavanandi, H.A.; Mittal, R.; Chandrasekhar, J.; Raghavarao, K. Simple and efficient method for extraction of C-Phycocyanin from dry biomass of Arthospira platensis. Algal Res. 2018, 31, 239–251. [Google Scholar] [CrossRef]
  112. Figueira, F.d.S.; Moraes, C.C.; Kalil, S.J. C-phycocyanin purification: Multiple processes for different applications. Braz. J. Chem. Eng. 2018, 35, 1117–1128. [Google Scholar] [CrossRef]
  113. Izadi, M.; Fazilati, M. Extraction and purification of phycocyanin from spirulina platensis and evaluating its antioxidant and anti-inflammatory activity. Asian J. Green Chem. 2018, 2, 364–379. [Google Scholar]
  114. Nagar, S.; Sharma, N.; Kumar, S. C-phycocyanin extraction and purification from Spirulina platensis. Res. Inventy Int. J. Eng. Sci. 2018, 8, 60–63. [Google Scholar]
  115. Chew, K.W.; Chia, S.R.; Krishnamoorthy, R.; Tao, Y.; Chu, D.-T.; Show, P.L. Liquid biphasic flotation for the purification of C-phycocyanin from Spirulina platensis microalga. Bioresour. Technol. 2019, 288, 121519. [Google Scholar] [CrossRef]
  116. Kaewdam, S.; Jaturonglumlert, S.; Varith, J.; Nitatwichit, C.; Narkprasom, K. Effect of isothermal and thermal diffusion on aqueous two-phase extraction for the purification of C-phycocyanin from Spirulina platensis. Int. Food Res. J. 2020, 27, 280–286. [Google Scholar]
  117. Aoki, J.; Sasaki, D.; Asayama, M. Development of a method for phycocyanin recovery from filamentous cyanobacteria and evaluation of its stability and antioxidant capacity. BMC Biotechnol. 2021, 21, 40. [Google Scholar] [CrossRef]
  118. Patel, A.; Mishra, S.; Pawar, R.; Ghosh, P. Purification and characterization of C-Phycocyanin from cyanobacterial species of marine and freshwater habitat. Protein Expr. Purif. 2005, 40, 248–255. [Google Scholar] [CrossRef] [PubMed]
  119. Chaiklahan, R.; Chirasuwan, N.; Loha, V.; Tia, S.; Bunnag, B. Separation and purification of phycocyanin from Spirulina sp. using a membrane process. Bioresour. Technol. 2011, 102, 7159–7164. [Google Scholar] [CrossRef]
  120. Gorgich, M.; Passos, M.L.; Mata, T.M.; Martins, A.A.; Saraiva, M.L.M.; Caetano, N.S. Enhancing extraction and purification of phycocyanin from Arthrospira sp. with lower energy consumption. Energy Rep. 2020, 6, 312–318. [Google Scholar] [CrossRef]
  121. Santiago-Santos, M.C.; Ponce-Noyola, T.; Olvera-Ramírez, R.; Ortega-López, J.; Cañizares-Villanueva, R.O. Extraction and purification of phycocyanin from Calothrix sp. Process Biochem. 2004, 39, 2047–2052. [Google Scholar] [CrossRef]
  122. Demirel, Z.; Sukatar, A. Purification of phycocyanin from isolated and identified hot spring cyanobacteria. Indian J. Exp. Biol. 2019, 57, 338–345. [Google Scholar]
  123. Safaei, M.; Maleki, H.; Soleimanpour, H.; Norouzy, A.; Zahiri, H.S.; Vali, H.; Noghabi, K.A. Development of a novel method for the purification of C-phycocyanin pigment from a local cyanobacterial strain Limnothrix sp. NS01 and evaluation of its anticancer properties. Sci. Rep. 2019, 9, 9474. [Google Scholar] [CrossRef] [Green Version]
  124. Sonani, R.R.; Singh, N.K.; Kumar, J.; Thakar, D.; Madamwar, D. Concurrent purification and antioxidant activity of phycobiliproteins from Lyngbya sp. A09DM: An antioxidant and anti-aging potential of phycoerythrin in Caenorhabditis elegans. Process Biochem. 2014, 49, 1757–1766. [Google Scholar] [CrossRef]
  125. Chittapun, S.; Jonjaroen, V.; Khumrangsee, K.; Charoenrat, T. C-phycocyanin extraction from two freshwater cyanobacteria by freeze thaw and pulsed electric field techniques to improve extraction efficiency and purity. Algal Res. 2020, 46, 101789. [Google Scholar] [CrossRef]
  126. Soni, B.; Kalavadia, B.; Trivedi, U.; Madamwar, D. Extraction, purification and characterization of phycocyanin from Oscillatoria quadripunctulata—Isolated from the rocky shores of Bet-Dwarka, Gujarat, India. Process Biochem. 2006, 41, 2017–2023. [Google Scholar] [CrossRef]
  127. Soni, B.; Trivedi, U.; Madamwar, D. A novel method of single step hydrophobic interaction chromatography for the purification of phycocyanin from Phormidium fragile and its characterization for antioxidant property. Bioresour. Technol. 2008, 99, 188–194. [Google Scholar] [CrossRef]
  128. Sonani, R.R.; Patel, S.; Bhastana, B.; Jakharia, K.; Chaubey, M.G.; Singh, N.K.; Madamwar, D. Purification and antioxidant activity of phycocyanin from Synechococcus sp. R42DM isolated from industrially polluted site. Bioresour. Technol. 2017, 245, 325–331. [Google Scholar] [CrossRef]
  129. El-Mohsnawy, E.; Abu-Khudir, R. A highly purified C-phycocyanin from thermophilic cyanobacterium Thermosynechococcus elongatus and its cytotoxic activity assessment using an in vitro cell-based approach. J. Taibah Univ. Sci. 2020, 14, 1218–1225. [Google Scholar] [CrossRef]
Figure 1. Effects of pH and temperature on the relative growth rate (RGR) of Arthrospira maxima cultures. Effects of various pH values (A) and temperatures (B) on RGRs. Data represent mean ± standard deviation (SD; n = 6).
Biology 11 00628 g001
Figure 2. Effect of pH (A) and temperature (B) on pigment concentrations in A. maxima cultures. The concentrations of chlorophyll a (green) and phycobiliproteins including phycocyanin (navy), allophycocyanin (sky blue), and phycoerythrin (pink). Data represent mean ± SD (n = 6).
Biology 11 00628 g002
Figure 3. Procedure used to extract phycocyanin (PC) and obtain analytical grade PC.
Biology 11 00628 g003
Figure 4. Purity of phycocyanin (PC) attained at crude extract and purification. SDS–PAGE of crude PC extract and purified PC from Arthrospira maxima. (A). Band peak areas of crude PC extract and purified PC (B). Lane M, protein marker (75, 63, 48, 35, 25, 20, 17, and 11 kDa); Lane 1, crude PC extract; Lane 2, purified PC.
Biology 11 00628 g004
Table 1. Values of the fluorescence parameters in Arthrospira maxima cultures grown under different pH and temperature treatments.
TreatmentsFluorescence Parameters
Fv/FmrETRmaxΦPSII
pH 40.32 ± 0.019 a65.2 ± 8.54 a0.21 ± 0.008 ab
pH 50.31 ± 0.020 a77.7 ± 9.40 a0.22 ± 0.006 abc
pH 60.31 ± 0.016 a85.9 ± 9.53 a0.26 ± 0.017 c
pH 70.43 ± 0.013 c118.2 ± 15.32 b0.35 ± 0.021 de
pH 80.44 ± 0.011 c128.4 ± 16.64 b0.38 ± 0.012 e
pH 90.35 ± 0.017 ab78.3 ± 9.43 a0.31 ± 0.021 d
pH 100.37 ± 0.009 b74.4 ± 13.40 a0.25 ± 0.009 bc
pH 110.32 ± 0.014 a58.54 ± 15.28 a0.18 ± 0.010 a
5 °CNA §NA §NA §
10 °C0.22 ± 0.021 ab40.9 ± 12.53 a0.16 ± 0.033 a
15 °C0.20 ± 0.020 a37.0 ± 13.89 a0.21 ± 0.019 b
20 °C0.30 ± 0.009 bc57.3 ± 9.28 a0.22 ± 0.034 bc
25 °C0.31 ± 0.039 c99.9 ± 6.79 b0.27 ± 0.035 d
30 °C0.33 ± 0.039 c87.4 ± 3.60 b0.25 ± 0.033 cd
35 °C0.31 ± 0.039 c88.75 ± 6.68 b0.21 ± 0.022 b
Data represent mean ± standard deviation (SD; n = 6). Different superscript letters indicate significant differences (p < 0.05). Fv/Fm, maximum quantum yield; rETRmax, maximum relative electron transport rate; ΦPSII, effective quantum yield; § NA, not applicable. Fluorescence parameters could not be measured at 5 °C because A. maxima cells died after 3 days of culture.
Publisher’s Note: MDPI stays neutral with regard to jurisdictional claims in published maps and institutional affiliations.

