Article

Invasion of African Clarias gariepinus Drives Genetic Erosion of the Indigenous C. batrachus in Bangladesh

1
Faculty of Environmental Management, Prince of Songkla University, Hat Yai 90110, Songkhla, Thailand
2
Department of Fisheries Biology and Genetics, Hajee Mohammad Danesh Science and Technology University, Dinajpur 5200, Bangladesh
3
School of Forest, Fisheries, and Geomatic Sciences, University of Florida/IFAS, 7922 NW 71st Street, Gainesville, FL 32653, USA
4
Fisheries Biotechnology Division, National Institute of Biotechnology, Ministry of Science and Technology, Dhaka 1000, Bangladesh
5
Department of Fisheries Management, Hajee Mohammad Danesh Science and Technology University, Dinajpur 5200, Bangladesh
6
Coastal and Climate Change Research Center, Faculty of Environmental Management, Prince of Songkla University, Hat Yai 90110, Songkhla, Thailand
*
Author to whom correspondence should be addressed.
Biology 2022, 11(2), 252; https://doi.org/10.3390/biology11020252
Submission received: 8 November 2021 / Revised: 15 January 2022 / Accepted: 1 February 2022 / Published: 6 February 2022

Abstract

:

Simple Summary

Bangladesh has substantially increased aquaculture production over the last few decades, and the exotic species share a significant portion of the total fish production. Although exotic species are contributing to aquaculture production, a few of them are causing biodiversity loss and genetic erosion of native species. The African catfish Clarias gariepinus is a highly carnivorous species and predates small indigenous freshwater fishes when escaping into natural water bodies. In addition, the hybridization of C. batrachus and C. gariepinus is considered a threat to the indigenous population. Although the government of Bangladesh has banned the farming of C. gariepinus, this species has been identified in local markets, and evidence of hybridization between C. gariepinus and C. batrachus has been found. This study revealed genetic erosion of native C. batrachus by the gene sequences of cytochrome c oxidase subunit I and cytochrome b. The phylogenetic tree confirmed the occurrences of hybridization between C. gariepinus and C. batrachus. Genetic erosion in the native catfish population is alarming for aquaculture sustainability and biodiversity conservation in Bangladesh.

Abstract

The African catfish Clarias gariepinus has been introduced for aquaculture in Bangladesh due to the scarcity of indigenous C. batrachus fingerlings. However, the government of Bangladesh has banned the farming of C. gariepinus due to the carnivorous nature of this species. Recently C. gariepinus has been reported by fish farmers and consumers in Bangladesh, and unplanned hybridization between native and exotic species has been suspected. This study attempts to know the purity of C. batrachus by analyzing mitochondrial genes. Both directly sequenced and retrieved Cytochrome C Oxidase subunit I (COI) and cytochrome b (Cytb) genes from C. gareipinus and C. batrachus were analyzed by MEGA software. The morphologically dissimilar C. batrachus showed the least genetic distance (0.295) from C. gariepinus, which provided evidence of hybridization between the two species. Maximum likelihood (ML) phylogenetic trees showed that C. batrachus from Bangladesh did not cluster with C. batrachus of other countries, instead C. batrachus clustered with the exotic C. gariepinus. The suspected hybrid formed sister taxa with the exotic C. gariepinus. The study corroborates the genetic deterioration of C. batrachus by unplanned hybridization with the invasive C. gariepinus. Unplanned hybridization has deleterious consequences; therefore, immediate action is necessary for aquaculture sustainability and biodiversity conservation in Bangladesh.

Graphical Abstract

1. Introduction

The walking catfish Clarias batrachus belonging to the Clariidae family, commonly known as walking catfish, is a popular food fish in the Indian sub-continent, including Bangladesh [1,2,3]. Catfish are a diverse group of fishes distributed from freshwater to marine environments, such as Clarias batrachus in freshwater [4] and Arius maculatus in brackish water [5]. Three species of the Clarias genera are important aquaculture candidates in Asia, namely C. batrachus in the Indian subcontinent [6], C. fuscus in Taiwan region [7,8], and C. macrocephalus in South-East Asia [9]. The native range of C. batrachus is Asia but Clarias aff. Batrachus from Indochina and Sundaland has been incorrectly identified as Clarias batrachus from Java [10]. The widely distributed African catfish C. gariepinus expanded its native range from the South to the Middle East and Eastern Europe [11].
Many exotic species have been introduced in Bangladesh for aquaculture in the past few decades, and some species are playing important roles in aquaculture production. A few of the exotic species have been proven detrimental to aquatic biodiversity and eventually banned for aquaculture in Bangladesh. The African magur, Clarias gariepinus, was introduced in Bangladesh in 1989 from Thailand by the Ministry of Fisheries and livestock (MoFL), but banned from aquaculture since 2014. The introduction of C. gariepinus caused native biodiversity loss due to its predatory nature [12]. The feasibility of hybrid vigor production between C. batrachus × C. gariepinus has been assessed but attained limited success [13]. Hybridization of C. gariepinus male × C. macrocephalus female in Vietnam has been widely practiced [14]. However, the potential of hybrids for a decline in the abundance of C. batrachus in the Chao Phraya and Mekong Basins has been considered [13]. Although aquaculture of C. gariepinus has been banned in Bangladesh [15], the availability of this species has been reported by consumers and farmers. Hybridization of C. batrachus × C. gariepinus has been known to occur in India [16] and in the Mekong Basin of Vietnam and Thailand [13]. Unplanned hybridization between C. gariepinus and C. batrachus is considered illegal in Bangladesh. Hybrids are less accepted by consumers due to differences in appearance and taste. In addition, the escape of the hybrids in natural water bodies could cause irreversible loss of the native biodiversity. If the purity of native stock is compromised in the natural population, it would be an irreversible problem for the future.
The mitochondrial genes were analyzed in this study to identify the native and hybrid Clarias species in Bangladesh. DNA sequencing was used to identify animal species because the mutation rate is low enough to allow distinguishing of closely related species [17]. This approach is used in evolutionary biology, phylogenetic systematics, and population genetics. Mitochondrial genes based on cytochrome C oxidase subunit I (COI) and cytochrome b (cytb) have been targeted for analysis in this study. These mitochondrial genes have been used in evolutionary and phylogenetic analyses of fishes, including genetic variation assessment of native and exotic climbing perch Anabas testudineus in Bangladesh [18]. The COI nucleotide sequences are widely used to authenticate the purebreds of different fish species and families, including the Sparidae family [19], groper fishes [20], Cyprinidae family [21], Ompok genus [22], and Clariidae and Pangasiidae families [23]. The mitochondrial cytochrome b (Cytb) has been found effective in fish species identification and authentication [24,25], the identification of catfishes in Korea [26], Puntius genus in Indian rivers [27], and fishes of the South China Sea [25]. In this study, COI and Cytb based DNA barcoding techniques have been targeted to identify C. batrachus, C. gareipinus, and the suspected hybrids in Bangladesh.

2. Materials and Methods

Fish collection and morphological identification: A total of 120 specimens of C. batrachus and 20 specimens of C. gariepinus were collected from three wholesale fish markets in Dinajpur district, Bangladesh. These fishes were produced by semi-intensive culture in earthen ponds. Traders in these fish markets collect fishes from all over the country, thereby the specimen used in this study were sourced from different parts of Bangladesh. Out of 120 specimens, a total of 20 native and 20 suspected hybrids were identified based on distinguishable morphological differences in body color, pectoral spine, and occipital process [13,28]. The body colors were brownish-black and greyish-black for native C. batrachus and the suspected hybrid, respectively (Figure 1). The occipital process was narrow and pointed in native C. batrachus, broad and blunt in suspected hybrid. Pectoral fin was elongated with strong spine in native C. batrachus (1), whereas the pectoral fin was round-shaped, without spines and rayed in suspected hybrid (Figure 1). The exotic C. gariepinus used were clearly distinguishable from the native C. batrachus (1) and suspected hybrid; therefore, morphological traits were not described in this study. Geometric morphometry was then used to validate the accuracy of morphological identification among the native C. batrachus, suspected hybrid and exotic C. gariepinus. A total of 13 landmark points from each fish specimen were digitized and analyzed by TPS software series and Past software (Ver. 3.0).
Tissue sample collection and DNA extraction: Fish muscle samples were collected and preserved in 95% ethanol. Phenol-Chloroform-Isoamyl alcohol method was used to extract DNA from the preserved muscle tissue, according to Shafi et al. 2016 [29]. The extracted DNA was confirmed by visualization of bands at 1% agarose gel electrophoresis with ethidium bromide (5 µg/mL) incorporated in 1× TBE buffer. Finally, DNA concentration was quantified by optical density (OD) measurement using a spectrophotometer at 260 nm (Thermo Scientific™, Waltham, MA, USA, NanoDrop™ 2000: Model SIA340). The step-by-step process from sample collection to species identification is presented in Figure 2.
Amplification mitochondrial COI and Cytb genes: The COI gene sequences (648 bp) were amplified using the primer pair Fish-F1 (5′-TCA ACC AAC CAC AAA GAC ATT GGC AC-3′), Fish-R1 (5′-TAG ACT TCT GGG TGG CCA AAG AAT CA-3′). A total of 25 µL reaction mixture was used that contained 1× assay buffer (100 mM Tris, 500 mM KCL, 0.1% gelatin, at pH 9.0), 1.5 mM MgCl2, 5 pmol of each primer, 200 µM of each dNTP, 1.5 U Taq DNA polymerase, and 20 ng of template DNA. The following protocol was used for PCR amplification: 95 °C for 2 min, followed by 35 cycles of 94 °C (30 s), 54 °C (30 s), and 72 °C (1 min), and extension for 2 min at 72 °C (Figure 2c). Partial fragments of 360 bp mitochondrial Cytb gene were amplified using primers CytbF (5′-AAA AAG CTT CCA TCC AAC ATC TC-3′) and CytbR (5′-AAA CTG CAG CCC CTC AGA ATG AT-3′). Again, a total of 25 µL reaction mixture was used that contained 12.5 µL master mix (Taq DNA Polymerase, dNTPs, MgCl2), 5 pmol of each primer, 20 ng of template DNA, and 9.5 µL distilled water. PCR amplification protocol included: 104 °C for 2 min, 95 °C for 1 min followed by 35 cycles of 94 °C (1 min), 48 °C (1 min), 72 °C (45 s), and extension for 5 min at 72 °C.
Purification of PCR products and sequencing: The amplified PCR products were passed through 1.5% agarose gels, stained with ethidium bromide, and visualized under UV illumination in the Gel-Doc system (BIO-RAD, Hercules, CA, USA). The PCR products were purified according to the manufacturer’s instructions of the Invitrogen purification kit (K310001, Thermo scientific, Waltham, MA, USA). The purified products were labeled by the Big Dye Terminator V.3.1 cycle sequencing kit (Applied Biosystems Inc, Thermo scientific, Waltham, MA, USA) and were sequenced bidirectionally using ABI 3730 capillary sequencer (Figure 2d).
Sequence analysis: BioEdit sequence alignment editor (version 7.0.5.2) was used to edit and align the raw DNA sequences (Figure 2e) [30]. The COI and Cytb sequences were aligned, and the final consensus size was identified. The consensus size of the COI and Cytb genes was 646 bp to 682 bp, and 356 bp to 368 bp, respectively. The Basic Local Alignment Search Tool (BLAST) at the NCBI website (http://ncbi.nih.gov/BLAST/ accessed on 11 October 2021) was used to process DNA sequences. Then the sequences were submitted to the NCBI GenBank database via the BankIt submission tool. Nucleotide sequences of the COI and Cytb genes from C. batrachus and C. gariepinus from other countries were retrieved from the NCBI GenBank database (http://www.ncbi.nlm.nih.gov/ accessed on 11 October 2021) to include reference sequences (Table 1). The polymorphic sites, nucleotide diversity, nucleotide composition, the disparity between sequences, net base composition bias, transitional/transversional bias, a test of homogeneity of substitution patterns between sequences, sequence divergence within species based on the Kimura 2 Parameter (K2P) model were run in MEGA (Version 7.01) for molecular genetic analysis [31]. The larger differences for all sequences were estimated by the Monte Carlo test (500 replicates) to observe the differences of base composition biases from the expected bases [31]. Based on the extent of differences in base composition biases between sequences, the probability of rejecting a null hypothesis that the sequences have evolved with the same pattern of substitution was tested [32]. The transition/transversion biases of COI gene sequence substitutions were estimated using a Kimura 2-parameter (K2P) model [33]. Phylogenetic trees based on a maximum likelihood method using COI and Cytb gene sequences were constructed using MEGA, which was validated using 1000 replicates of bootstrap values. Based on the results, C. batrachus, C. gariepinus, and the suspected hybrids were identified.

3. Results

3.1. Sequence Analysis of COI and Cytb Genes

Validation of morphological identification by geometric morphometry: Based on geometric morphometry, the scattered plot of the landmark points showed that native C. batrachus, suspected hybrid and exotic C. gariepinus were morphologically distinguishable (Figure 3). The principal component 1 (PCA 1)_and PCA 2 of landmark points showed that native C. batrachus, suspected hybrid exotic C. gariepinus formed a separate cluster.

3.2. Sequence Analysis of COI and Cytb Genes

In the COI gene, 751 sites were identified where 76 (10.12%) were conserved; 670 (89.88%) were variable, which indicated a high level of variation among C. batrachus, C. gariepinus, and the hybrid. The average nucleotide composition of the COI gene was 29.3%, 26.6%, 24.6%, and 19.5% for T, C, A, and G, respectively. The AT content was higher than GC content in all the samples. Higher differences were observed between the sequence pair of C. batrachus of Bangladesh and reference C. batrachus from the Philippines and Indonesia, Sequenced C. gariepinus, and reference C. batrachus from the Philiphines and Indonesia. Higher differences were not observed between the sequenced C. gariepinus and suspected hybrid (Table 2).

3.3. Transition/Transversion Bias

The estimated transition/transversion bias (R) among the COI gene sequences of the Clarias genus was 1.12. The rates of transitional and transversional substitutions are presented in bold and italics, respectively (Table 3). The nucleotide frequencies were A = 24.91%, T/U = 29.34%, C = 26.39% and G = 19.36%. The rates of transitional substitution from A to G, T to C, C to T, and G to A were 8.76%, 15.39%, 17.11%, and 11.27%, respectively (Table 2). The rates of transversional substitution from A to T, A to C, T to A, T to G, C to A, C to G, G to T, and G to C were 6.96%, 6.26%, 5.9107%, 4.59%, 6.96%, and 6.26%, respectively (Table 3). The rates of transitional substitution of the COI nucleotide sequences were higher (52.547%) than transversional substitution (47.453%).

3.4. Homogeneity of Substitution Patterns of COI Sequences

The estimated p values smaller than 0.05 (considered significant and marked with an asterisk) are presented above the diagonal in Table 4. The estimated disparity index per site is presented for each sequence pair above the diagonal in Table 4. The p-values were larger than 0.05 between sequence pairs of reference C. batrachus from the Philippines and Indonesia; the reference C. batrachus from India and Bangladesh relative to the reference from the Philippines and Indonesia; the Bangladeshi sequence of native C. batrachus and C. gariepinus; the C. gariepinus from Nigeria, Indonesia and C. batrachus from India, Indonesia, and the Philippines; the sequence of suspected hybrid and native C. batrachus and exotic C. gariepinus. The sequences of the COI gene in native C. batrachus evolved with the same pattern of substitution like the species originating from other counties (Table 4).

3.5. Genetic Distance

The lowest genetic distance was found between suspected hybrid and C. gariepinus (0.295). The highest genetic distance (6.238) was found between C. gariepinus from Indonesia and Bangladeshi C. batrachus. Low levels of genetic divergence (0.295–0.339) were found among sequenced native Clarias batrachus, suspected hybrid and exotic C. gariepinus (in Bangladesh, whereas interspecies genetic divergence was found between C. batrachus and C. gariepinus from other countries (Table 5). The pairwise genetic distances based on nucleotide sequence divergences are presented in Table 5.

3.6. Phylogenetic Tree Using COI Nucleotide Sequences by Maximum Likelihood Methods

The phylogenetic tree inferred from COI nucleotide sequences based on the maximum likelihood method showed that all the sequenced native C. batrachus and exotic C. gariepinus formed a single clade, where C. gariepinus and suspected hybrid and C. gariepinus formed a sister clade. The sequenced C. batrachus of Bangladeshi did not cluster with any of the reference sequences C. batrachus originated from other countries. However, C. batrachus from India, Indonesia, and the Philippines formed one clade. C. gariepinus from Nigeria and Indonesia formed a sister clade (Figure 4).

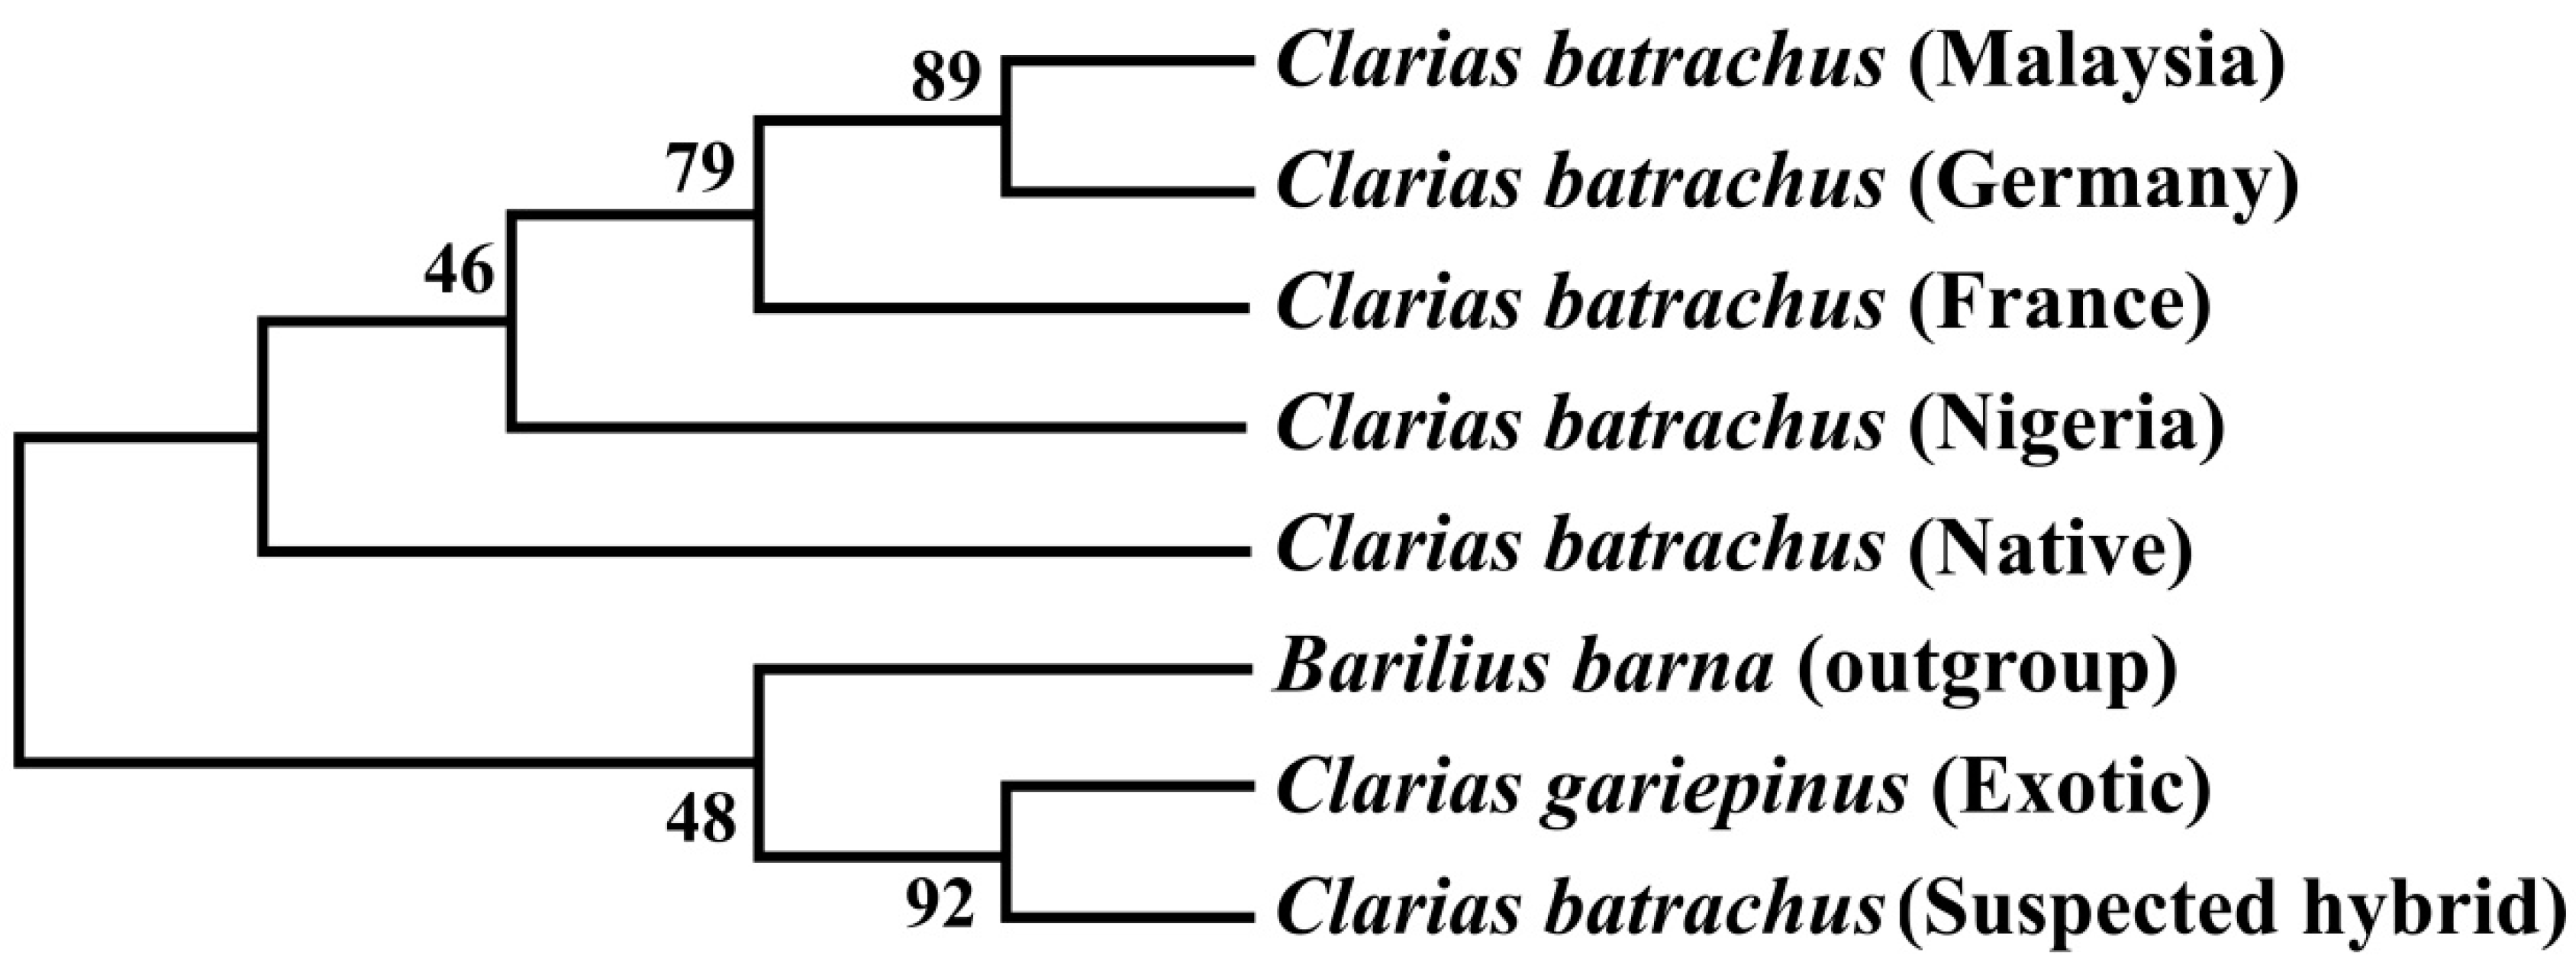
3.7. Phylogenetic Tree Using Cytb Nucleotide Sequences by Maximum Likelihood Method

The phylogenetic tree based on the Cytb nucleotide sequences was used to validate the phylogenetic tree inferred from the COI nucleotide sequence (Figure 5). The results showed that sequenced suspected hybrid formed sister taxa with the sequenced C. gariepinus. The native C. batrachus formed a clade with C. batrachus of originated from different countries (Nigeria, France, Germany, and Malaysia) except suspected hybrid and C. gariepinus. The formation of sister clade of suspected hybrid with native C. batrachus and C. gariepinus confirmed the occurrence of hybridization of C. batrachus and C. gariepinus in Bangladesh, which validated the results based on COI gene.

4. Discussion

In the present study, six partial sequences (forward and reverse) from native C. batrachus, C. gariepinus, and suspected hybrid were 751, 746, and 728, respectively. In multiple sequence alignment, a total of 751 sites were identified: 76 (10.11%) of them were conserved, 670 (89.21%) were variable, 670 (89.21%) were informative for parsimony sites, 653 (86.95%) were singleton sites. In Clarias gariepinus, Coptodon zillii, and Sarotherodon melanotheron from Southwestern Nigeria, 49.86% were conserved sites, 49.71% were variable sites, 32.33% were parsimony informative sites, and (17.39%) were singleton sites [34]. C. gariepinus, C. magur, and C. dussumieri based on COI gene sequences, showed a consensus-sized length of 623 sites, where 425, 197, 163, and 34 were conserved, variable, parsimony informative, and singletons, respectively [35]. Out of 628 sites in gene sequences in the indigenous barp Pethia manipurensis 144, 459, 267, and 192 were conserved, variable, parsimony informative, and singletons, respectively [36].
The average nucleotide composition of COI gene in three Clarias populations and reference population were 29.3%, 26.6%, 24.6%, and 19.5% for T, C, A, and G, respectively. In this study, GC contents of native Clarias batrachus (MG988399), C. gariepinus (MG988400), and suspected hybrid (MG988401) were 47.1%, 49.2%, and 51%, whereas AT contents were 52.8%, 50.8%, and 48.9%, respectively. The AT content was higher than GC content in the native and exotic species and the suspected hybrid. Since AT content positively relates to the rate of evolution, a high level of mutation rate has been expected based on the results in this study. COI genes from C. gariepinus, C. zillii, and S. melanotheron were higher than 500 bp in which the nucleotide composition were 29.0% for T, 26.6% for C, 26.4% for A, and 18.0% for G [34]. The highest and the lowest GC contents were found in C. zilli (49.6%) and C. gariepinus (42.2%), respectively [34].
Based on the substitution pattern, the highest interspecific divergence was 6.238 between C. gariepinus (Indonesia) and C. batrachus (India), but the lowest intraspecific divergence was 0.295 between suspected hybrid (MG988401) and C. gariepinus (MG98400). Multiple groups from the same common ancestor evolved and accumulated differences through evolutionary divergence, which resulted in differentiation in body structure and formed a new species. The lowest divergence was found between suspected hybrid (MG988401) and C. gariepinus (MG98400); these were evolved and accumulated differences. Genetic distances among C. gariepinus, C. zillii, and S. melanotheron from southwestern Nigeria showed the highest nucleotide divergence of COI gene in C. zilli (π = 0.184), while S. melanotheron showed the lowest divergence (π = 0.065) [35]. The interspecies genetic divergence ranged from 0.056 to 0.182 for the COI gene. The mean genetic difference between C. dussumieri and other African catfish species was 12.1% based on COI gene sequences. The level of substitution of C. batracus by C. gariepinus in India showed that the intraspecific divergence (0.53) and intrageneric divergence (15.05) was sufficiently high to allow differentiation of these species based on DNA barcode analysis with cytochrome c oxidase subunit I (COI) gene [15].
At low levels of divergence, transitions occur more commonly than transversions in the mtDNA. In this study, the transitions versus transversion bias were 1.12 for COI. The ratio of si/sv® with COI gene sequences was 0.79 for C. gariepinus, C. zillii, and S. melanotheron from southwestern Nigeria [34]. The indigenous and exotic Anabas testudineus showed a transition transversion bias of 0.94 [21].
In both phylogenetic trees, a sister group formed between the C. gariepinus (Nigeria) and C. gariepinus (Indonesia), sequenced C. gariepinus and sequenced suspected hybrid, whereas formed sub-clade with the native C. batrachus. This indicates occurrence hybridization between native C. batrachus with the exotic African catfish C. gariepinus. The feasibility of hybridization between C. batrachus × C. gariepinus was previously discussed in Bangladesh [15]. Hybridization between C. gariepinus male × C. macrocephalus female is widely practiced in Vietnam [16]. The abundance of crossbreeds of the native C. batrachus and exotic C. gariepinus in Bangladesh could deteriorate the purity of the native species. Hybridization caused a decline in the abundance of C. batrachus in the Chao Phraya and Mekong basins [16]. Thirty species of the family Carangidae were studied using cytochrome c oxidase I (COI), in which all the described species formed monophyletic clusters in phylogenetic trees [37]. ML tree from the COI nucleotide sequences of C. gariepinus, C. zillii, and S. melanotheron showed cluster formation independently within their corresponding genera [34]. Similar findings were observed in catfishes, Ompok pabda, O. pabo, and O. bimaculatus from Indian rivers, which resolved phylogenetic ambiguity using the COI gene [22]. The phylogenetic relationships of native and introduced catfishes in the Philippines showed sharing of the same unique concatenated sequence by Arius manillensis and A. dispar, but two specimens of Pterygoplichthys pardalis and one specimen of P. disjunctivus shared a unique concatenated sequence with [38].

5. Conclusions

This study confirms that the indigenous C. batrachus of Bangladesh is distinctly separate from the C. batrachus of other countries. In this study, twenty specimens the native and the suspected hybrid catfish were used for sequence data analysis which is considered reliable for molecular phylogeny. A total of 3 to 36 specimens were used in previous studies for COI and Cytb gene biomarkers for phylogenetic analysis of different catfish species [22,23,26]. The native C. batrachus of Bangladesh formed a cluster with both the introduced exotic African C. gariepinus and the suspected hybrid. The level of genetic variation and cluster formation of the hybrid with the invasive C. gariepinus is alarming for the native species in Bangladesh. We call for an immediate intervention to prevent unplanned hybridization between native and exotic species. Upon the escape of the hybrids into the wild due to flood or a human mistake, the loss of purity in the wild population will be irreversible.

Author Contributions

Conceptualization, I.P.; methodology, R.A.R.; software, I.P.; validation, M.M.H., S.P. and S.S. (Shirin Sultana); formal analysis, I.P.; investigation, R.A.R.; resources, S.S. (Shirin Sultana); data curation, I.P.; original draft preparation, I.P. and P.R.R.; writing—I.P., S.P. and S.S. (Suvit Suwanno); supervision, I.P.; funding acquisition, I.P. and S.P.; Revision I.P., S.P. and R.P. All authors have read and agreed to the published version of the manuscript.

Funding

This research was funded by Prince of Songkla University and the Ministry of Higher Education, Science, Research and Innovation, Thailand, under the Reinventing University Project (Grant Number REV64027) and also by the Ministry of Science Information and Communication Technology, Government of Bangladesh.

Institutional Review Board Statement

The experimental fishes were collected from the local fish markets. Therefore, sample collection of this experiment did not cause any issue of loss of biodiversity. The ethical use of animals in research was preliminarily reviewed by the Institute of Research and Training of Hajee Mohammad Danesh Science and Technology University, and finally by the project evaluation board of Ministry of Science and Technology, Government of Bangladesh (NST-FY-2018-2019/code no 12601-120005400).

Informed Consent Statement

Not applicable.

Data Availability Statement

The gene sequences generated in this study, is deposited to NCBI nucleotide sequences database (https://www.ncbi.nlm.nih.gov/), which can be publically accessed by using the accession number given at Table 1.

Acknowledgments

We express our thanks to the Research and Development Office (RDO/PSU) and Seppo Karrila for their English proofreading support.

Conflicts of Interest

The authors declare no conflict of interest.

References

  1. Linnaeus, C. Systema Naturae: Per Regna Tria Naturae, Secundum Classes, Ordines, Genera, Species, Cum Characteribus, Differentiis, Synonymis, Locis; Editio decima, reformata [10th revised edition]; Laurentius Salvius: Stockholm, Sweden, 1758; Volume 1, p. 824. [Google Scholar]
  2. Lakra, W.S.; Goswami, M.; Gopalakrishnan, A. Molecular identification and phylogenetic relationships of seven Indian Sciaenids (Pisces: Perciformes, Sciaenidae) based on 16S rRNA and cytochrome c oxidase subunit I mitochondrial genes. Mol. Biol. Rep. 2008, 36, 831–839. [Google Scholar] [CrossRef] [PubMed]
  3. Pouyaud, L.; Paradis, E. The phylogenetic structure of habitat shift and morphological convergence in Asian Clarias (Teleostei, Siluriformes: Clariidae). J. Zool. Syst. Evol. Res. 2009, 47, 344–356. [Google Scholar] [CrossRef]
  4. Rahman, A.K.A. Freshwater Fishes of Bangladesh, 2nd ed.; University of Dhaka: Dhaka, Bangladesh, 2005. [Google Scholar]
  5. Pradit, S.; Noppradit, P.; Goh, B.P.; Sornplang, K.; Ong, M.C.; Towatana, P. Occurrence of microplastics and trace metals in fish and shrimp from Songkhla Lake, Thailand during the COVID-19 pandemic. Appl. Ecol. Environ. Res. 2021, 19, 1085–1106. [Google Scholar] [CrossRef]
  6. Sahoo, S.K.; Giri, S.S.; Sahu, A.K.; Ayyappan, S. Experimental Hybridization between Catfish Clarias batrachus (Linn.) x Clarias gariepinus (Bur.) and Performance of the Offspring in Rearing Operations. Asian Fish. Sci. 2003, 16, 157–166. [Google Scholar] [CrossRef]
  7. Huang, C.F.; Lin, Y.H.; Chen, J.D. The use of RAPD markers to assess catfish hybridization. Biodivers. Conserv. 2005, 14, 3003–3014. [Google Scholar] [CrossRef]
  8. Szyper, J.P.; Tamaru, C.S.; Howerton, R.D.; Hopkins, K.D.; Fast, A.W.; Weidenbach, R.P. Maturation, Hatchery and Nursery Tech-Niques for Chinese Catfish, Clarias fuscus, in Hawaii. Aquaculture Extension Bulletin Summer 2001, UNIHJ-SEAGRANT-AB-01-01. Available online: http://citeseerx.ist.psu.edu/viewdoc/download?doi=10.1.1.548.9712&rep=rep1&type=pdf (accessed on 11 October 2021).
  9. Na-Nakorn, U.; Kamonrat, W.; Ngamsiri, T. Genetic diversity of walking catfish, Clarias macrocephalus, in Thailand and evidence of genetic introgression from introduced farmed C. gariepinus. Aquaculture 2004, 240, 145–163. [Google Scholar] [CrossRef]
  10. Froese, R.; Pauly, D. (Eds.) Clarias batrachus. Available online: https://www.fishbase.org/summary/Clarias-batrachus.html (accessed on 11 October 2021).
  11. Adan, R.I.Y. Catfish culture in Southeast Asia. SEAFDEC Asian Aquac. 2000, 22, 16–17. [Google Scholar]
  12. Thakur, N.K. A biological profile of African catfish Clarias gariepinus and impact of its introduction in Asia. In Fish Genetics and Biodiversity Conservation; Ponniah, A.G., Das, P., Verma, S.R., Eds.; Natcon Publications: Muzzafarnagar, India, 1998; pp. 275–292. [Google Scholar]
  13. Rahman, M.A.; Bhadra, A.; Begum, N.; Islam, M.S.; Hussain, M.G. Production of hybrid vigour through crossbreeding between Clarias batrachus Lin. and Clarias gariepinus Bur. Aquaculture 1995, 138, 125–130. [Google Scholar] [CrossRef]
  14. Welcomme, R.L.; Vidthayanon, C. The Impacts of Introduction and Stocking of Exotic Species in the Mekong Basin and Policies for Their Control; MRC Technical Paper; Mekong River Commission: Phnom Penh, Cambodia, 2003; p. 65. [Google Scholar]
  15. DOF (Department of Fisheries). Matshya Pakkhya Saranika; Department of Fisheries, Ministry of Fisheries and Livestock: Dhaka, Bangladesh, 2014; p. 208. [Google Scholar]
  16. Khedkar, G.D.; Anita, D.; Rushidkumar, N.; Shinde, D.; Haymer, D. High rates of substitution of the native catfish Clarias batrachus by Clarias gariepinus in India. Mitochondrial DNA Part A 2016, 27, 569–574. [Google Scholar] [CrossRef]
  17. Hebert, P.D.; Ratnasingham, S.; de Waard, J.R. Barcoding animal life: Cytochrome c oxidase subunit 1 divergences among closely related species. Proc. Biol. Sci. 2003, 270, S96–S99. [Google Scholar] [CrossRef] [Green Version]
  18. Parvez, I.; Mahajebin, T.; Clarke, M.; Chhanda, M.S.; Sultana, S. Genetic variation of native and introduced climbing perch, Anabas testudineus (Bloch, 1792) derived from mitochondrial DNA analyse. Ecol. Genet. Genom. 2020, 17, 100067. [Google Scholar] [CrossRef]
  19. Abbas, E.M.; Soliman, T.; El-Magd, M.A.; Farrag, M.M.S.; Ismail, R.F.; Kato, M. Phylogeny and DNA Barcoding of the Family Sparidae Inferred from Mitochondrial DNA of the Egyptian Waters. J. Fish. Aquat. Sci. 2017, 12, 73–81. [Google Scholar] [CrossRef] [Green Version]
  20. Basheer, V.S.; Vineesh, N.; Bineesh, K.K.; Kumar, R.G.; Mohitha, C.; Venu, S.; Kathirvelpandian, A.; Gopalakrishnan, A.; Jena, J.K. Mitochondrial signatures for identification of grouper species from Indian waters. Mitochondrial DNA Part A 2017, 28, 451–457. [Google Scholar] [CrossRef] [PubMed]
  21. Chandra, S.; Barat, A.; Singh, M.; Singh, B.K.; Matura, R. DNA barcoding of Indian coldwater fishes of genus Schizothorax (Family: Cyprinidae) from western Himalaya. J. Fish. Mar. Sci. 2012, 4, 430–435. [Google Scholar]
  22. Malakar, A.K.; Lakra, W.S.; Goswami, M.S.; Minhra, R.M. Molecular identification of three Ompok species using mitochondrial COI gene. Mitochondrial DNA 2012, 23, 20–24. [Google Scholar] [CrossRef] [PubMed]
  23. Wong, L.L.; Peatman, E.; Lu, J.; Kucuktas, H.; He, S.; Zhou, C.; Na-nakorn, U.; Liu, Z. DNA barcoding of catfish: Species authentication and phylogenetic assessment. PLoS ONE 2011, 6, e17812. [Google Scholar] [CrossRef]
  24. Kochzius, M.; Seidel, C.; Antoniou, A.; Botla, S.K.; Campo, D.; Cariani, A.; Vazquez, E.G.; Hauschild, J.; Hervet, C.; Hjorleifsdottir, S.; et al. Identifying fishes through DNA barcodes and microarrays. PLoS ONE 2010, 5, e12620. [Google Scholar] [CrossRef] [Green Version]
  25. Zhang, J.; Hanner, R. Molecular approach to the identification of fish in the South China Sea. PLoS ONE 2012, 7, e30621. [Google Scholar] [CrossRef]
  26. An, H.S.; Kim, M.J.; Lee, J.W.; Lee, W.O. Molecular identification of Korean catfish (Siluriformes) based on two genetic markers. Genes Genet. 2012, 34, 695–702. [Google Scholar] [CrossRef]
  27. Pallavi; Goswami, M.; Nautiyal, P.; Malakar, A.K.; Nagpure, N.S. Genetic divergence and molecular phylogenetics of Puntius spp. based on the mitochondrial cytochrome b gene. Mitochondrial DNA 2012, 23, 477–483. [Google Scholar] [CrossRef]
  28. Talwar, P.K.; Jhingran, A.G. Inland Fisheries of India and Adjacent Countries; Oxford-IBH Publishing Co. Pvt. Ltd.: New Delhi, India, 1991; Volume 2. [Google Scholar]
  29. Safi, N.; Rauf, A.; Akhtar, T.; Minhas, R.A.; Ulfat, S.B. Comparative isolation and amplification of cytochrome oxidase 1 DNA from Oncorhynchus mykiss (rainbow trout) of azad jammu & kasmir. Int. J. Fish. Aquat. Stud. 2016, 4, 196–199. [Google Scholar]
  30. Hall, T.A. BioEdit: A user-friendly biological sequence alignment editor and analysis program for Windows 95/98/NT. Nucleic Acids Symp. Ser. 1999, 41, 95–98. [Google Scholar]
  31. Tamura, K.; Stecher, G.; Peterson, D.; Filipski, A.; Kumar, S. Molecular Evolutionary Genetics Analysis version 6.0. Molecular Biology and Evolution. Mol. Biol. Evol. 2012, 30, 2725–2729. [Google Scholar] [CrossRef] [PubMed] [Green Version]
  32. Kumar, S.; Gadagkar, S.R. Disparity Index: A simple statistic to measure and test the homogeneity of substitution patterns between molecular sequences. Genetics 2001, 158, 1321–1327. [Google Scholar] [CrossRef]
  33. Kimura, M. A simple method for estimating evolutionary rate of base substitutions through comparative studies of nucleotide sequences. J. Mol. Evol. 1980, 15, 111–120. [Google Scholar] [CrossRef]
  34. Falade, M.O.; Opene, A.J.; Benson, O. DNA barcoding of Clarias gariepinus, Coptodon zillii and Sarotherodon melanotheron from Southwestern Nigeria. F1000Research 2016, 5, 1268. [Google Scholar] [CrossRef] [Green Version]
  35. Devassy, A.; Kumar, R.; Shajitha, P.P.; John, R.; Padmakumar, K.G.; Basheer, V.S.; Gopalakrishnan, A.; Mathew, L. Genetic identification and phylogenetic relationships of Indian clariids based on mitochondrial COI sequences. DNA Mapp. Seq. 2016, 27, 3777–3780. [Google Scholar] [CrossRef] [Green Version]
  36. Sobita, N.; Basudha, C.; Sharma, S.K. Molecular characterization of an indigenous barb Pethia manipurensis (Cyprinidae: Barbinae) from Manipur, India and its relationship with other cyprinid fishes inferring from mitochondrial cox1 gene sequences. Indian J. Anim. Res. 2019, 53, 181–186. [Google Scholar] [CrossRef] [Green Version]
  37. Jaafar, T.N. DNA Barcoding and Population Genetic Structure of Malaysian Marine Fishes (Doctoral Dissertation, Prifysgol Bangor University). 2014. Available online: http://ethos.bl.uk/OrderDetails.do?uin=uk.bl.ethos.612627 (accessed on 29 October 2021).
  38. Yu, S.C.S.; Quilang, J.P. Molecular phylogeny of catfishes (Teleostei: Siluriformes) in the Philippines using the mitochondrial genes COI, Cyt b, 16S rRNA and the nuclear genes Rag1 and Rag2. Philipp. J. Sci. 2014, 143, 2015. [Google Scholar]
Figure 1. Identification of native Clarias batrachus and suspected hybrid based on morphological characters.
Biology 11 00252 g001
Figure 2. The flow chart of the experimental procedures from sample collection to DNA sequence analyses for species identification.
Biology 11 00252 g002
Figure 3. Scatter plot generated 13 landmark landmark points based on geometric morphometry of native Clarias batrachus, suspected hybrid and exotic C. gariepinus.
Biology 11 00252 g003
Figure 4. Rooted phylogenetic tree inferred from COI nucleotide sequences using maximum likelihood method. The numbers indicate the bootstrap value, which validates the sister taxa and clade formation in the phylogenetic tree.
Biology 11 00252 g004
Figure 5. Unrooted phylogenetic tree inferred from Cytb nucleotide sequences using a maximum likelihood method. The numbers indicate the bootstrap value, which validates the sister taxa and clade formation in the phylogenetic tree.
Biology 11 00252 g005
Table 1. The sequenced and reference COI and Cytb sequences of native Clarias batrachus, suspected hybrid and C. gariepinus.
Gene NameAccession NoSpecies NameStatusCountry
COIMG988399C. batrachusSequencedBangladesh
MG988400C. gariepinusSequencedBangladesh
MG988401Suspected hybrid SequencedBangladesh
HQ682681.1C. batrachusReferencePhilippine
KU692438.1C. batrachusReferenceIndonesia
KF214296C. batrachusReferenceIndia
KU69244.1C. gariepinusReferenceIndonesia
HM882828.1C. gariepinusReferenceNigeria
Cytochrome bMG988402C. batrachusSequencedBangladesh
MG988403C. gariepinusSequencedBangladesh
MG988404Suspected hybridSequencedBangladesh
KR007705.1C. batrachusReferenceGermany
JF280859.1C. batrachusReferenceMalaysia
GU906881.1C. gariepinusReferenceNigeria
AF235924.1C. gariepinusReferenceFrance
Table 2. The estimated net base composition bias disparity between COI nucleotide sequences of native Clarias batrachus suspected hybrid and exotic C. gariepinus.
NoSpecies Name1234567
1C. batrachus 1 (MG988399)
2C. batrachus (Philiphine)0.189
3C. batrachus (Indonesia)0.6910.000
4C. batrachus (India)0.0000.0000.000
5C. gariepinus (MG988400)0.0001.3281.9610.900
6C. gariepinus (Indonesia)0.3180.0000.0000.0001.370
7C. gariepinus (Nigeria)0.1460.0000.0000.0001.0680.000
8Suspected hybrid (MG988401)0.0001.2581.9090.9230.0001.4401.235
The values (>0) in the table indicate the larger differences in base composition biases than the expected bases between the studied COI nucleotide sequences [31].
Table 3. The estimated maximum likelihood pattern of nucleotide substitutions.
ATCG
A-6.9605%6.2622%8.7613%
T5.9107%-15.3969%4.5926%
C5.9107%17.1140%-4.5926%
G11.2759%6.9605%6.2622%-
The rates of different transitional substitutions are presented in bold, and transversions substitutions are presented in italics.
Table 4. Test of the homogeneity of substitution patterns between COI sequences of native Clarias batrachus, suspected hybrid and exotic C. gariepinus.
Sl.NoSpecies Name12345678
1C. batrachus 1 (MG988399) 0.1890.6910.000 *0.000 *0.3180.1460.000 *
2C. batrachus (Philiphine)0.194 0.000 *0.000 *1.3280.000 *0.000 *1.258
3C. batrachus (Indonesia)0.1081.000 0.000 *1.9610.000 *0.000 *1.909
4C. batrachus (India)1.0001.0001.000 0.9000.000 *0.000 *0.923
5C. gariepinus (MG988400)1.0000.0440.0120.100 1.3701.0680.000 *
6C. gariepinus (Indonesia)0.2341.0001.0001.0000.032 0.000 *1.440
7C. gariepinus (Nigeria)0.3321.0001.0001.0000.0501.000 1.235
8Suspected hybrid (MG988401)1.0000.0240.0220.0821.0000.0260.046
Note: * means the p values smaller than 0.05 (p < 0.05) are considered as significant, which indi-cating the rejection of the null hypothesis that the sequences have evolved with the same pattern of substitution.
Table 5. Pairwise genetic distances of Clarias species from different countries based on a Kimura-2 parameter (KP2) model.
NoSpecies Name12345678
1C. batrachus 1 (MG988399)
2C. batrachus (Philiphine)4.931
3C. batrachus (Indonesia)3.2833.110
4C. batrachus (India)4.1222.1372.302
5C. gariepinus((MG988400)0.3395.0054.4004.635
6C. gariepinus (Indonesia)2.8374.9874.6386.2382.594
7C. gariepinus (Nigeria)4.0554.6365.0953.1474.0252.315
8Suspectred hybrid (MG988401))0.3114.7064.2974.7630.2952.6314.629
Publisher’s Note: MDPI stays neutral with regard to jurisdictional claims in published maps and institutional affiliations.

