Article

Genetic Structure of an East Asian Minnow (Toxabramis houdemeri) in Southern China, with Implications for Conservation

1
Pearl River Fisheries Research Institute, Chinese Academy of Fishery Sciences, Guangzhou 510380, China
2
Key Laboratory of Aquatic Animal Immune Technology of Guangdong Province, Guangzhou 510380, China
3
Guangzhou Scientific Observing and Experimental Station of National Fisheries Resources and Environment, Guangzhou 510380, China
4
Hainan Academy of Ocean and Fisheries Sciences, Haikou 571126, China
5
College of Marine Ecology and Environment, Shanghai Ocean University, Shanghai 201306, China
6
Aquatic Technology Extension Station of Du’an County, Hechi 530700, China
*
Author to whom correspondence should be addressed.
Biology 2022, 11(11), 1641; https://doi.org/10.3390/biology11111641
Submission received: 29 September 2022 / Revised: 3 November 2022 / Accepted: 8 November 2022 / Published: 9 November 2022
(This article belongs to the Special Issue Aquatic Biodiversity and Conservation Biology)

Abstract

:

Simple Summary

This study presents the first comprehensive view of the genetic structure of a widespread cyprinid, Toxabramis houdemeri, based on large-scale geographic sampling and mitochondrial and nuclear markers. Genetic endemism with clear geographic boundaries was formed in T. houdemeri populations due to river landscape changes, biogeographic barriers, and the species’ dispersal potential. Late Pleistocene demographic expansion had occurred in T. houdemeri populations. This study could help improve the monitoring and protection of this species.

Abstract

River dynamics have been hypothesized to substantially influence the genetic structure of freshwater fish taxa. Southern China harbors abundant independent river systems, which have undergone historical rearrangements. This river system is thus an excellent model with which to test the abovementioned hypothesis. In this study, a cyprinid widespread in many independent rivers in southern China, Toxabramis houdemeri, was chosen as an exemplar species with which to explore the effects of river configuration changes on spatial genetic structure using mitochondrial and nuclear markers. The results indicated that the T. houdemeri populations fell into four mitochondrial haplotype groups, each genetically endemic to a single river or two adjacent river systems. The mitochondrial haplotype network recovered a clear genetic boundary between Hainan Island populations and mainland populations. Notable genetic differentiation was observed within populations from distinct river systems in both mitochondrial and nuclear loci. River system separation, mountain barriers, and mobility were the key factors shaping the genetic structure of T. houdemeri populations. Late Pleistocene divergence and historical immigration were identified within the four mitochondrial haplotype groups, indicating that river rearrangements triggered by the Late Pleistocene glacial cycles were important drivers of the complex genetic structure and demographic history of T. houdemeri. Historical demographics suggested that T. houdemeri populations expanded during the Late Pleistocene. The present study has important consequences for the management and conservation of T. houdemeri.

1. Introduction

For effectively managed conservation, it is critical to understand the spatial configurations of genetic diversity and to excavate genetic endemism (unique genetic resources in a particular geographic region) within species, particularly in the case of widespread species. In particular, since widely distributed populations of freshwater fish may frequently be isolated by mountains or salinity [1], gene flow is likely to be interrupted, and genetic differentiation and/or endemism may occur within populations [2,3,4,5,6,7]. In addition, it has been argued that river rearrangements triggered by glacial cycles may have both blocked gene exchange by isolating previously connected rivers and promoted population dispersal by connecting previously isolated rivers [1,2,3,4,5,6,7,8]. River rearrangements have historically been more common in rivers near the sea [4,7]. For example, the Last Glacial Maximum led to sea-level retrogression, thus promoting the confluence of rivers previously isolated by salt water and allowing population migrations between previously isolated rivers [5,9]. Conversely, during interglacial periods, sea-level increases disrupted river connections, leading to population differentiation or even generating genetic endemism in certain isolated rivers [7,10]. Therefore, changes in riverine landscape structure both present and past may strongly affect patterns of genetic diversity within freshwater fish populations.
In addition to the large Pearl River, many independent coastal rivers are distributed in southern China, such as the Moyang River and the Jian River on the mainland and the Nandu River, the Changhua River, and the Wanquan River on Hainan Island (Figure 1). These rivers are currently separated but spatially proximate and discharge into the South China Sea. Previous geological reports have shown that the South China Sea has been affected by several worldwide glacial cycles since the Pleistocene [11,12], which have influenced the landscape configurations of rivers in this region. It is thus likely that the genetic structures of the fish species residing in these rivers have been shaped by periodic riverine connectivity and disruption.
Several genetic studies of freshwater fish in southern China have detected high levels of population differentiation [2,3,7,8,9,10,13]. For example, Yang and He [2] found that river landscape changes induced by the Pleistocene glacial cycles were significant drivers of the high levels of population divergence within Hemibagrus guttatus populations in the Pearl River, Hanjiang River, and Jiulongjiang River [2]. Similarly, Chen et al. [7] found marked genetic differentiation and endemism within populations of the black Amur bream (Megalobrama terminalis) in the Pearl River, the Moyang River, and the Wanquan River, and the authors argued that river rearrangements mediated by glacial cycles shaped this remarkable genetic pattern [7]. However, most previous genetic reports have focused on only a limited number of independent rivers in southern China. Therefore, a comprehensive examination of the effects of river landscape on the genetic structures of fish taxa is necessary.
Toxabramis houdemeri (Pellegrin, 1932), a small cyprinid (length at maturity < 14.7 cm; www.fishbase.cn, accessed on 28 September 2022) found in numerous rivers in southern China, is a good exemplar species for explorations of the influences of river landscape alternations on the genetic patterns of freshwater fish taxa. T. houdemeri is a mesopelagic fish that is considered a poor disperser due to its small body size [14,15]. Given the increasing threats posed by human interference and/or environmental degradation to freshwater biodiversity worldwide [16,17,18], it is crucial to protect current stocks of T. houdemeri. Resolving the spatial genetic structure of T. houdemeri and revealing the processes influencing this structure will provide a solid theoretical basis for the development of effective conservation strategies.
In this study, we sampled T. houdemeri populations from several independent coastal rivers in southern China and investigated population genetic structure using both mitochondrial and nuclear loci. We aimed (i) to investigate the spatial genetic structure of T. houdemeri populations and to identify genetic endemism in different rivers; (ii) to characterize population demographics and determine potential influencing factors; and (iii) to provide a relevant theoretical basis for the development of future conservation strategies.

2. Methods

2.1. Sampling

During field surveys between 2014 and 2022, we sampled 529 specimens of T. houdemeri from 26 localities in the rivers of southern China, including the Pearl River and eight independent coastal rivers (Table S1; Figure 1). A small piece of fin or muscle was clipped from each specimen and preserved in 95% ethanol.
Total genomic DNA was extracted from fin or muscle tissue samples using the Axygen DNA Extraction Kit (Axygen Scientific, Union City, CA, USA), following the manufacturer’s instructions. Two mitochondrial fragments were amplified: the partial mitochondrial cytochrome b gene (Cytb) and the control region (CR) using universal primers L14724 and H15915 [19] and DL1 and DH2 [20]. We also amplified and sequenced a nuclear locus (recombination activating gene 2, RAG2) using the primers RAG2-f2a and RAG2-R6a [21]. All selected markers were amplified and sequenced as previously described [19,20,21]. The amplification conditions were identical to those described by Chen et al. (2020) [7].

2.2. Sequence Analyses and Haplotype Network

The nucleotide sequences were initially aligned using MUSCLE [22] and manually optimized using MEGA X [23]. The mitochondrial fragments Cytb and CR were concatenated into one mitochondrial locus (MCR) for subsequent analyses. For RAG2, alleles were unphased using the PHASE algorithm as implemented in DnaSP v5.0 [24] with default settings. Identical MCR haplotypes and phased nuclear gene alleles were collapsed using DnaSP v5.0.
Due to low intraspecific sequence divergence and low resolution in the phylogenetic topology, we did not build phylogenetic trees for the T. houdemeri populations. Instead, we used PopART v1.7.2 [25] to infer mitochondrial haplotype and nuclear allele relationships between nine independent rivers. Haplotype networks can be used to infer precise relationships between closely related populations [25]. MCR sequences were directly utilized for haplotype network construction. The longest non-recombining region generated in IMGC [26] for RAG2 was used to build the allele network.

2.3. Molecular Diversity and Genetic Structure

To characterize the genetic diversity of the T. houdemeri populations, we calculated the number of haplotypes (h), haplotype diversity (Hd), and nucleotide diversity (π) using DnaSP v5.0. Genetic differentiation (the fixation index ϕST [27]) was assessed in ARLEQUIN v3.5 [28] by calculating pairwise ϕST values between populations. To test whether the T. houdemeri populations fit an isolation-by-distance pattern, a Mantel test was performed in ARLEQUIN v3.5. The geographical distance (in kilometers) was roughly measured as the straight-line distance using Google Earth v.4.3. Hierarchical and non-hierarchical population structures based on both types of loci were examined using analyses of molecular variance (AMOVAs) in ARLEQUIN v3.5. First, we estimated the overall differentiation of the complete data set without partitions. Second, we calculated the partitioning of genetic variation between the nine independent rivers and four defined genetic groups (see Section 3). All calculations implemented in ARLEQUIN v3.5 were performed with 1000 permutations.

2.4. Divergence Time Estimate

We used pairwise net average sequence distances between species to estimate the approximate divergence times between the species in the four observed genetic groups. We calculated the net average sequence distance between genetic group pairs in MEGA X to estimate approximate divergence times. The average net Kimura-2-Parameter (K2P [29]) distance for the MCR compared to Cytb alone was 0.756. The estimated mean substitution rates for MCR (0.756% and 1.513%) were obtained by multiplying the Cytb rate by the K2P ratio for Cytb alone (0.756). The estimated substitution rates for MCR were used to measure the approximate divergence times between group pairs.

2.5. Demographic History and Historical Gene Flow

Three approaches were used to infer the demographic histories of the T. houdemeri populations. First, to test for departures from a constant population size, the summary statistics Tajima’s D [30] and Fu’s FS [31] were estimated. Significance was assessed based on 1000 simulated samples. Second, pairwise mismatch distributions [32] were used to infer the demographic history and were performed using ARLEQUIN v3.5 and DnaSP v5.10. Third, we examined historical demographics using coalescent-based extended Bayesian skyline plots (EBSPs) [33]. EBSPs were performed using both mitochondrial and nuclear loci in BEAST v1.8.1 [34]. Mitochondrial Cytb and CR were separated in this analysis. Before conducting EBSPs, we chose the optimal model of nucleotide substitution for each locus (Table S2) using MrModeltest v2.3 [35]. The range of substitution rates (1.0–2.0% per million years, Myr) adopted for the Cytb gene in this study was selected based on commonly acknowledged rates in cyprinid fish [36,37,38,39]. The substitution rates for CR and RAG2 were measured as a function of the Cytb evolutionary rate. EBSPs were run with a strict clock model and 30 million generations. Finally, TRACER v1.6 [40] was employed to assess the stationarity of each run by analyzing the effective sizes of all parameters.
To assess the direction and magnitude of historical gene flow between the four haplotype groups, MIGRATE v4.5 [41] was utilized to calculate the historical migration rate. Three independent runs using the maximum likelihood strategy were executed. One long chain (20,000 genealogies sampled) and 12 short chains (5000 genealogies sampled) with temperatures of 1.0, 1.5, 3.0, and 100,000.0 and a burn-in of 10,000 genealogies per chain were implemented in the MCMC searches. We set the initial uniform priors Θ and M to 0.0–0.1 and 0.0–25,000.0, respectively.

3. Results

3.1. Sequence Statistics

Fragments of Cytb (1105 bp) and the CR (772 bp) were successfully sequenced from 527 samples. In total, we obtained 527 MCR sequences (1877 bp), with 147 variable sites and 106 haplotypes. We yielded RAG2 sequences (1201 bp) from 509 specimens, with 74 variable sites and 168 alleles. All novel sequences obtained in this study have been deposited in GenBank (Table S1).

3.2. Haplotype and Allele Networks

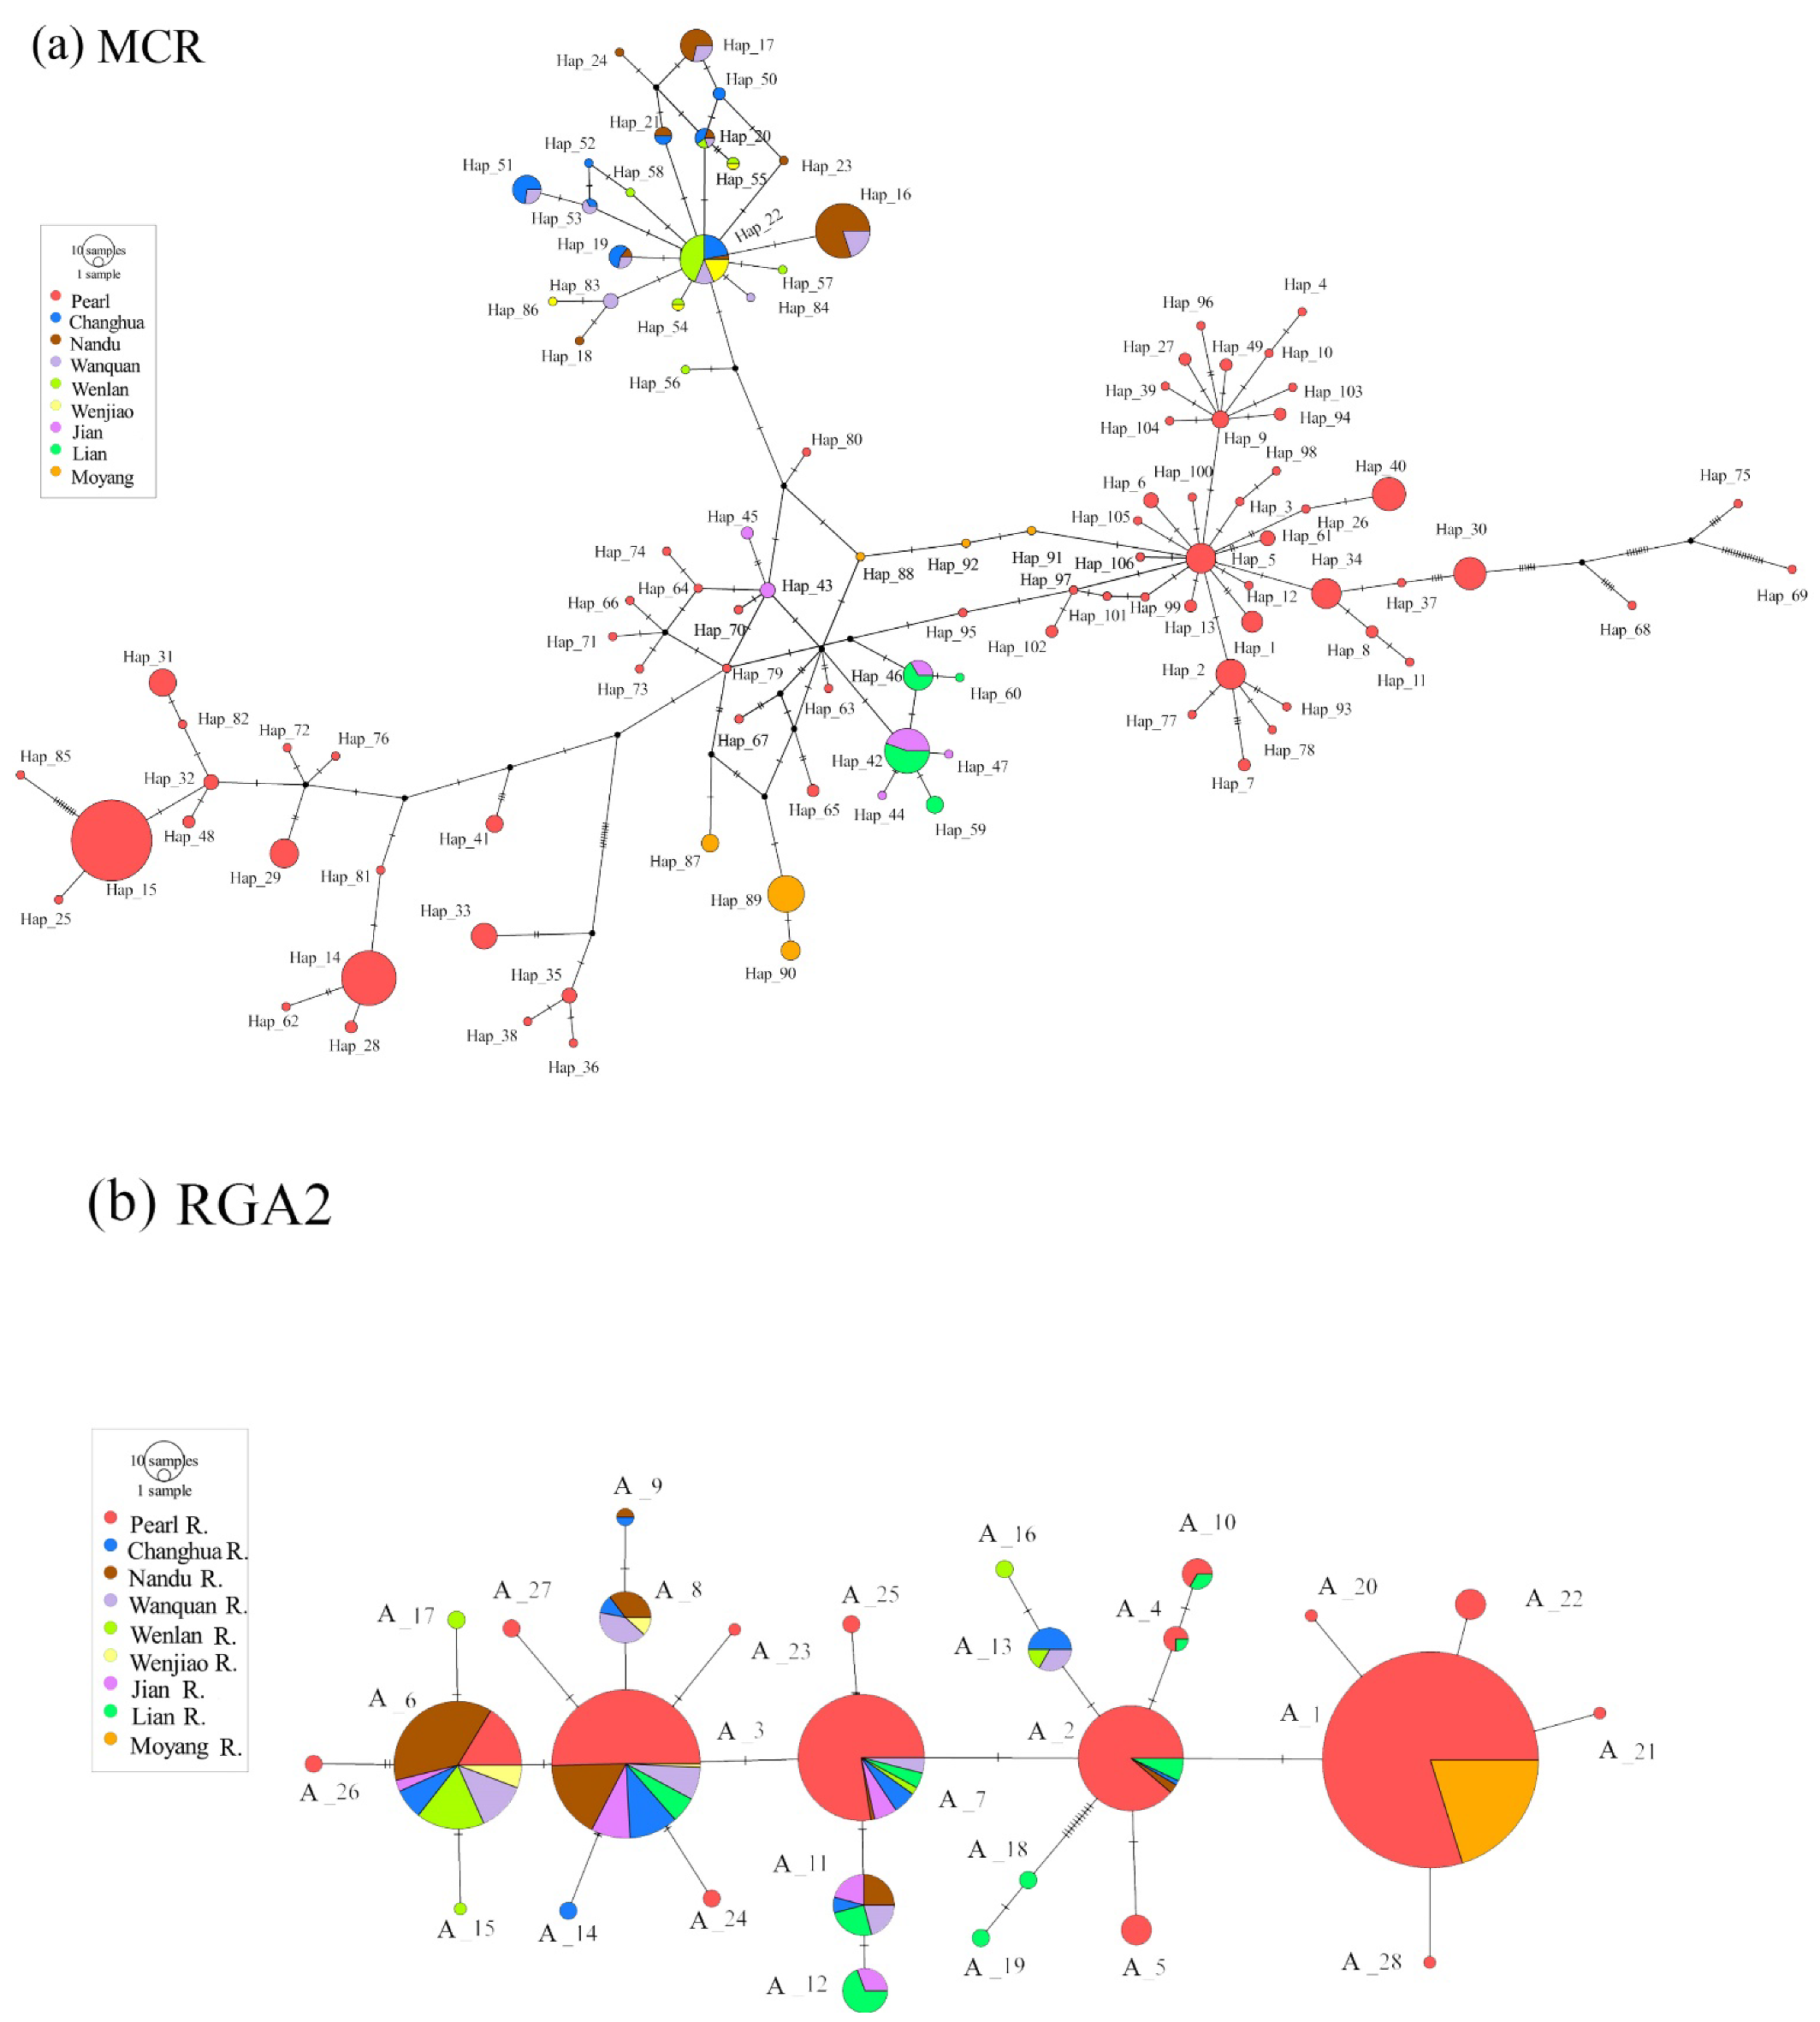
The mitochondrial network revealed that the Pearl River populations and the Moyang River population represented different private haplotype groups. In addition, the populations from the Jian River and the Lian River shared two main haplotypes, while the remaining haplotypes found in the two rivers were not shared (Figure 2a). There was a clear genetic delineation between the Hainan Island populations and the mainland populations. However, several haplotypes were shared among the populations from the five Hainan Island rivers. Based on the mitochondrial haplotype network, we defined four independent genetic groups: the Pearl River populations, the Moyang populations, the Jian and Lian populations, and the Hainan Island populations (groups G1, G2, G3, and G4, respectively). In the nuclear networks, many alleles were shared across the nine rivers, and a handful of alleles were unique in some rivers (Figure 2b).

3.3. Genetic Structure

The nonhierarchical AMOVAs identified statistically significant differences across populations, as indicated by high global ϕST values, for both loci (ϕCT = 0.539, p < 0.001 for MCR and ϕCT = 0.414, p < 0.001 for RAG2; Table 2). The estimated ϕCT value for the nine independent rivers, calculated using hierarchical AMOVAs, also recovered significant genetic differentiation (ϕCT = 0.253, p < 0.001 for MCR and ϕCT = 0.322, p < 0.001 for RAG2; Table 2). Hierarchical AMOVAs identified similar levels of significant genetic differentiation between the four defined generic groups for both loci (ϕCT = 0.379, p < 0.001 in MCR and ϕCT = 0.377, p < 0.001 in RAG2; Table 2). Within the Pearl River, nonhierarchical AMOVAs revealed relatively high levels of significant genetic differentiation between populations (ϕCT = 0.371, p < 0.001 in MCR and ϕCT = 0.240, p < 0.001 in RAG2; Table S3). In contrast, there was relatively low genetic differentiation between the Hainan Island populations (ϕCT = 0.149, p < 0.001 in MCR and ϕCT = 0.093, p < 0.001 in RAG2; Table S3).
The range of pairwise ϕST values for MCR was 0.000–0.965, and 251 out of 276 ϕST values were significant (Table S4). The range of pairwise ϕST values for RAG2 was 0.000–0.925, and 257 out of 276 ϕST values were significant (Table S5). Additionally, for both of these loci, pairwise ϕST values were relatively high among the Pearl River populations but relatively low among the Hainan Island populations (Tables S3–S5). Mantel tests identified a significant correlation between geographical and genetic differentiation in MCR (r = 0.259, p < 0.001) and RAG2 (r = 0.451, p < 0.001).

3.4. Molecular Diversity Indexes

The Hd and π values of each population, overall samples, and the defined genetic groups were showed in Table 1. For MCR, the global haplotype (Hd) and nucleotide diversity (π) values were 0.948 and 0.0044, respectively. The highest Hd and π values within the four defined groups were detected in G1. With respect to RGA2, the overall Hd and π values were 0.915 and 0.0036, respectively. The highest Hd and π values within the four genetic groups were examined in G3.

3.5. Demographic Analyses and Gene Flow

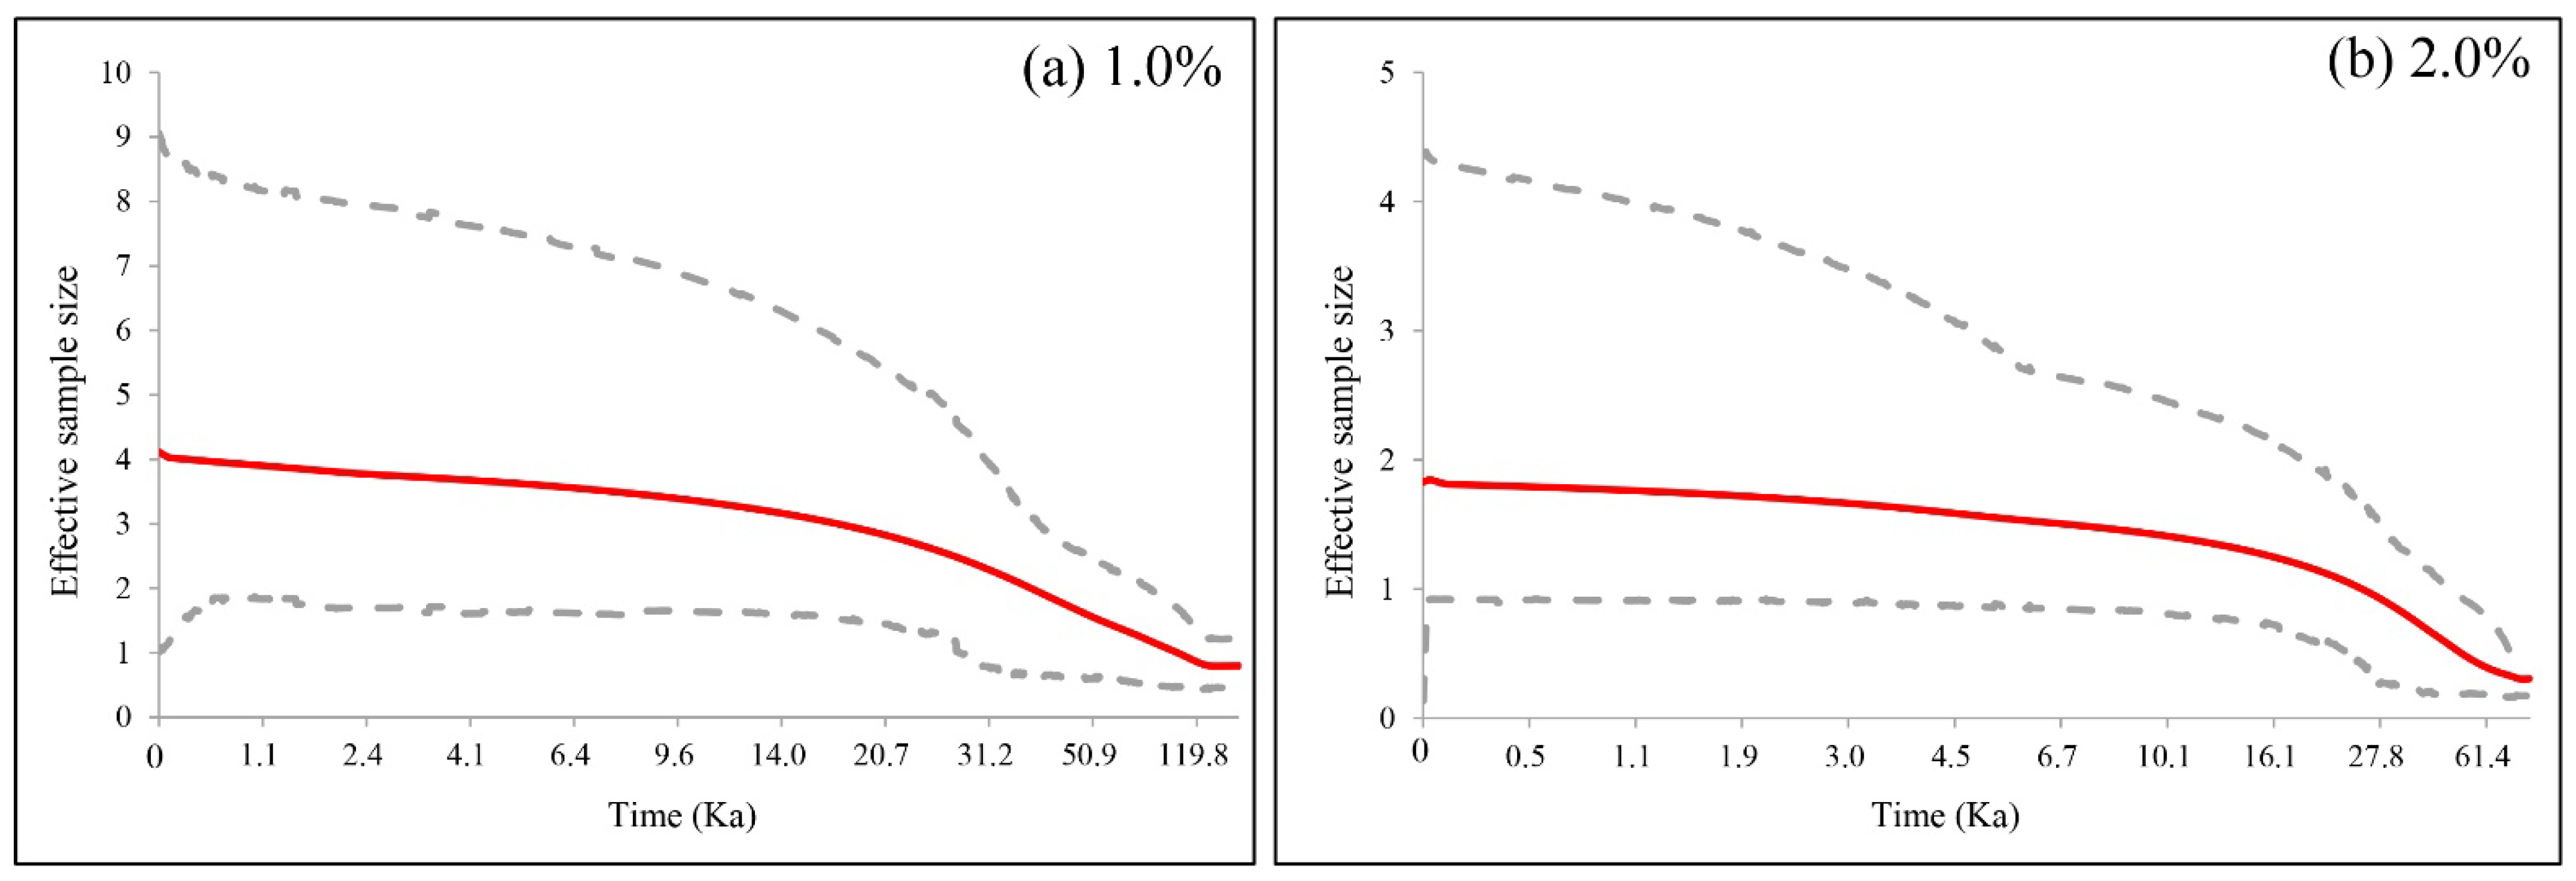
Both Tajima’s D and Fu’s FS for the overall populations were significantly negative (Table S6). Additionally, mismatch analyses revealed multimodal distribution of pairwise differences for both loci (Figure S1). The model of sudden demographic expansion was not rejected by the generalized least square procedure (SSD = 0.005, p = 0.355 for MCR and SSD = 0.003, p = 0.690 for RAG2) or by the raggedness index of the distribution (Rag = 0.008, p = 0.421 for MCR and Rag = 0.013, p = 0.740 for RAG2) (Table S6). Lastly, EBSP analyses using the substitution rates of 1% and 2% for Cytb detected a population expansion from ~0.06 million years ago (Ma) to 0.120 Ma (Figure 3).
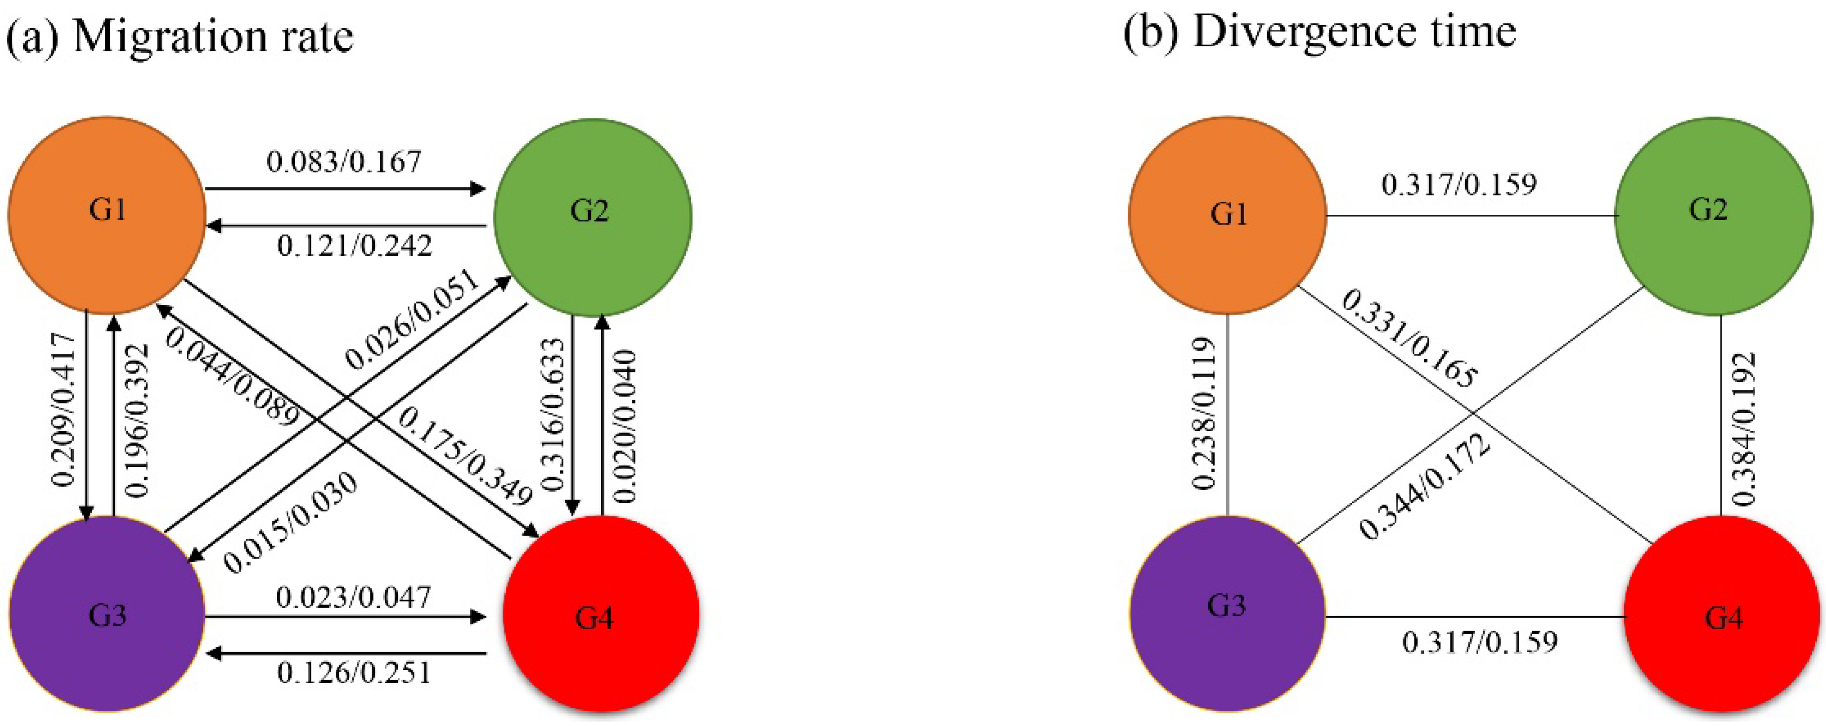
Using substitution rates of 0.756% and 1.513% per Myr for MCR, estimates of historical migration between the four groups showed symmetrical magnitude and direction between G1 and G2, between G1 and G3, and between G2 and G3. Additionally, asymmetrical bias in historical gene flow was detected between G1 and G4, between G2 and G4, and between G3 and G4. The median estimates of the number of effective migrants per generation originating from G1 and traveling into G4 was 0.175 (0.756%)/0.349 (1.513%), while the median number of migrants per generation traveling in the opposite direction was estimated at 0.044 (0.756%)/0.089 (1.513%). Estimates of migration between G2 and G4, as well as between G3 and G4, showed similar patterns (Figure 4a).

3.6. Divergence Time Estimates

Based on average sequence distances, the divergence time range for the four defined groups was 0.119–0.192 Ma based on a substitution rate of 1.513% and was 0.238–0.384 Ma based on a substitution rate of 0.756% (Figure 4b).

4. Discussion

4.1. Genetic Structure of T. houdemeri

Four mitochondrial haplotype groups with rigid geography were observed in the T. houdemeri populations, suggesting long-term geographical separation. Divergence time estimates suggested that the four defined groups split at ~0.119–0.384 Ma, which indicated isolation during the Late Pleistocene. In addition, the historical gene flow between the four genetic groups indicated that, at some point in history, these independent rivers were connected, allowing overlapping dispersal and gene flow. River rearrangements during the Late Pleistocene glacial cycles [42] appear to have been a key factor that shaped the complex evolutionary histories. During the glacial period, the reduced sea levels in the South China Sea generated wide continental shelves and land bridges and also connected some of the rivers in this region, which may have accelerated gene flow between T. houdemeri populations. At the end of the glacial period, the rising sea levels [11,12,43] isolated Hainan Island, the Moyang River, the Jian and Lian rivers, and the Pearl River, hindering gene exchange between T. houdemeri populations. Similar population structure patterns have previously been documented in many other freshwater fish species in southern China, including Culter recurviceps [8], Megalobrama terminalis [7], Rhinogobius duospilus [10], and Schistura fasciolata [3].
Significant differentiation (ϕCT = 0.253 for MCR and ϕCT = 0.322 for RAG2) between the nine independent river populations indicated that riverine isolation might have influenced the genetic architecture of T. houdemeri populations. Nowadays, these nine rivers are independent and unconnected, divided by both terrestrial and/or marine areas. Consequently, the T. houdemeri populations in these rivers are each restricted to single rivers, resulting in obvious genetic differentiation.
Interestingly, endemic mitochondrial haplotypes were discovered in the Moyang River even though the Moyang River and various branches of the Pearl River are isolated only by tens of kilometers (Figure 1). Furthermore, high levels of genetic differentiation between the Moyang River populations and the Pearl River populations were recovered by AMOVA and ϕST calculations in both loci. A similar pattern was observed in M. terminalis [7]. The Yunkai Mountains, an important biogeographical barrier in southern China, have played a noteworthy role in shaping the genetic structures of the T. houdemeri populations. The Pearl River and the Moyang River are located on the flanks of the Yunkai Mountains, and this geographic placement has potentially hindered gene exchange between the two rivers. Consistently, it has been proposed that during the Pleistocene, the Yunkai Mountains facilitated the differentiation of several freshwater species and populations [7,9,44,45]. The unique mitochondrial haplotypes identified in the Jian River and the Lian River may also have arisen due to population separations associated with the Yunkai Mountains. The phenomenon of haplotype sharing occurring between the Jian River population and the Lian River population might be due to the spatial proximity of the two rivers (Figure 1).
As expected, the mitochondrial network revealed a clear genetic boundary between the Hainan Island populations and the mainland populations (Figure 2a), likely due to the isolating effects of the Qiongzhou strait. This strait is an acknowledged phylogeographic break that has been identified as a key force driving genetic differentiation between Hainan Island and Mainland China freshwater fish [7,8,13,44,46], such as Micronemacheilus pulcher [13], Garra orientalis [9], Megalobrama terminalis [7], and Culter recurviceps [8].
Unexpectedly, AMOVA and ϕST estimates of genetic differentiation between the Pearl River populations based on the mitochondrial and nuclear loci were relatively high. This result was incongruent with the outcome in M. terminalis (subfamily Cultrinae) in the Pearl River, which found no population structure among M. terminalis populations [7]. Furthermore, the genetic differentiation between T. houdemeri populations in the Pearl River was also greater than that between C. recurviceps populations in the Pearl River [8]. This discrepancy may be due to the limited dispersal potential of T. houdemeri, considering T. houdemeri is a small fish (<14.7 cm; www.fishbase.cn: accessed on 10 September 2022) and has been deemed a poor disperser.
The low levels of genetic differentiation identified between populations from the five independent rivers on Hainan Island suggested that the Hainan Island populations might constitute a single panmictic population, even though these rivers have been thought to be distinct river systems separated by known barriers, such as the Yinggeling and Wuzhishan Mountains [9,47]. Our results were incongruent with previous studies of G. orientalis and Channa gachua, both which recovered deeply divergent lineages among the Hainan Island river populations [9,47]. This discrepancy is likely due to mobility differences between T. houdemeri and the other two species. T. houdemeri is a mesopelagic fish, while G. orientalis and C. gachua are benthic species [14,48]. Therefore, T. houdemeri may have relatively higher dispersal potential than either G. orientalis or C. gachua. Indeed, the five rivers are spatially close (on the scale of tens of kilometers), and some river sections may occasionally be physically connected by seasonal flooding. Consistently, previous studies have suggested that seasonal flooding may promote migration in some fish taxa, such as Arapaima gigas [49] and the genus Marcopodus [50]. Moreover, population migration via the continental shelf during more recent glacial periods is a non-negligible factor.

4.2. Demographic History

Neutrality tests, mismatch distribution analyses, and EBSP analyses supported the recent population expansion of T. houdemeri. EBSP analyses suggested the expansion event had occurred ~0.060–0.120 Ma, during the Late Pleistocene. Geological reports have argued that southern China experienced an interglacial period during the Late Pleistocene (0.126–0.018 Ma) [42]. During interglacial periods, the warm climate may have promoted the expansion of T. houdemeri populations, as has previously been proposed in C. recurviceps [8]. Taken together, our results indicated that climate fluctuations during the Late Pleistocene shaped the demographic history of T. houdemeri populations. However, we found that T. houdemeri populations remained stable during the Last Glacial Maximum (~0.021 Ma), suggesting that the Last Glacial Maximum did not impact the demography of this species. The regions in southern China are temperate and tropical zones, which might be less influenced by the Last Glacial Maximum. Similar patterns were also reported in other fish species in southern China [49,51,52], such as Hemiculter leucisculus [51] and Ochetobius elongatus [52].

4.3. Genetic Diversity

High levels of Hd and low levels of π observed in T. houdemeri populations using both MCR and RAG2 were indicative of a population bottleneck followed by rapid population expansion [53]. A signal of recent population expansion occurred in T. houdemeri populations was also demonstrated by different analytical methods. The global genetic diversity level using concatenated Cytb and CR of T. houdemeri populations was slightly lower than that of M. terminalis populations [7]. However, the genetic diversity level using RAG2 was higher than that of M. terminalis populations [7]. Furthermore, our study uncovered the obvious difference of genetic diversity level between the four genetic groups (Table 1). One possible reason was that the T. houdemeri members within the four genetic groups were derived from the ancestral populations through a recent population expansion.

4.4. Conservation Implications

Delineating the population structures of widespread taxa remains inherently difficult, as many populations of widespread species have dwindled or even disappeared in certain sections of their distribution ranges due to human interference and/or environmental degradation [54]. It is essential to identify population boundaries to support conservation and management programs aiming to ensure the continued persistence of such species. It was clear that the T. houdemeri populations were comprised of four mitochondrial haplotype groups that were distributed in separate river systems. The genetic endemism uncovered in these independent rivers deserves specific consideration. Special attention should also be paid to the Moyang River, the Jian River, and the Lian River because these small rivers harbor two unique mitochondrial haplotype groups. The low genetic diversity and fragmented distributions of T. houdemeri in these three rivers increase the susceptibility of these populations to adverse effects, such as inbreeding depression and diseases, leading to a high threat of extinction [55,56]. Importantly, Hainan Island populations and mainland populations should be treated as two independent management units (MUs [57]) due to their obvious population boundary and high level of genetic differentiation.

5. Conclusions

Our study provides the first comprehensive view of the genetic structure T. houdemeri populations based on wide geographic sampling and both mitochondrial and nuclear markers. Genetic endemism with clear geographic boundaries was identified in the T. houdemeri populations. River landscape changes during the Late Pleistocene, independent river systems, biogeographic barriers, and dispersal potential have played key roles in shaping the genetic structure and demographic dynamics of T. houdemeri. The results of this study may help improve monitoring and protection efforts targeting T. houdemeri.

Supplementary Materials

The following supporting information can be downloaded at: https://www.mdpi.com/article/10.3390/biology11111641/s1, Figure S1: Mismatch distribution analyses for global Toxabramis houdemeri populations using MCR (a) and RAG2 (b). The abscissa and the ordinate present the number of pairwise differences between compared sequences and the frequency for each value, respectively. Histograms are the observed frequencies of pairwise divergences among sequences, and the line refers to the expectation under the model of population expansion. Table S1: Details of sample locations for Toxabramis houdemeri. The locations, coordinates (latitude/longitude), sample dates, sample sizes, voucher numbers, and GenBank accession numbers for Cytb, the control region, and RAG2 are presented. Table S2: Nucleotide substitution models used in EBSPs for each gene fragment. Table S3: Nonhierarchical AMOVA of Toxabramis houdemeri populations among the Pearl River and Hainan Island populations. Table S4: Pairwise ϕST comparisons between Toxabramis houdemeri populations based on MCR. Statistically significant pairwise ϕST values are highlighted in bold (p < 0.05). For population codes, refer to Table 1. Table S5: Pairwise ϕST comparisons between Toxabramis houdemeri populations based on RAG2. Statistically significant pairwise ϕST values are highlighted in bold (p < 0.05). For population codes, refer to Table 1. Table S6: Neutrality tests and mismatch distribution analyses of Tajima’s D and Fu’s FS for global Toxabramis houdemeri populations. SSD, sum of squared distribution; Hri, Harpending’s raggedness index; p, the probability value.

Author Contributions

W.C., X.L. and J.L. designed the research. W.C., Y.L., X.C., D.X., S.G., C.L. (Ce Li), C.L. (Chun Lan), S.Z. and J.Y. performed the sampling and laboratory analyses. W.C. wrote the initial manuscript. All authors have read and agreed to the published version of the manuscript.

Funding

This research was supported by the Open Project of Key Laboratory of Aquatic Biodiversity and Conservation, Chinese Academy of Sciences (2019) and the project of the innovation team of survey and assessment of the Pearl River fishery resources (2020TD-10 and 2020ZJTD-04).

Institutional Review Board Statement

The study was approved by the Laboratory Animal Ethics Committee of the Pearl River Fisheries Research Institute, Chinese Academy of Fishery Sciences (protocol code: LAEC-PRFRI-2019-01-01; date: 19 February 2019).

Informed Consent Statement

Not applicable.

Data Availability Statement

DNA sequences have been deposited in GenBank under Accession numbers Details regarding individual samples are available in Table S1.

Conflicts of Interest

The authors declare that there is no conflict of interest.

References

  1. Burridge, C.P.; Craw, D.; Fletcher, D.; Waters, J.M. Geological dates and molecular rates: Fish DNA sheds light on time dependency. Mol. Biol. Evol. 2008, 25, 624–633. [Google Scholar] [CrossRef] [PubMed] [Green Version]
  2. Yang, L.; He, S. Phylogeography of the freshwater catfish Hemibagrus guttatus (Siluriformes, Bagridae): Implications for South China biogeography and influence of sea-level changes. Mol. Phylogenet. Evol. 2008, 49, 393–398. [Google Scholar] [CrossRef] [PubMed]
  3. Wong, W.; Ma, K.; Tsang, L.; Chu, K. Genetic legacy of tertiary climatic change: A case study of two freshwater loaches, Schistura fasciolata and Pseudogastromyzon myersi, in Hong Kong. Heredity 2017, 119, 360–370. [Google Scholar] [CrossRef] [PubMed]
  4. Perea, S.; Doadrio, I. Phylogeography, historical demography and habitat suitability modelling of freshwater fishes inhabiting seasonally fluctuating Mediterranean river systems: A case study using the Iberian cyprinid Squalius valentinus. Mol. Ecol. 2015, 24, 3706–3722. [Google Scholar] [CrossRef] [Green Version]
  5. Swartz, E.R.; Skelton, P.H.; Bloomer, P. Sea-level changes, river capture and the evolution of populations of the Eastern Cape and fiery redfins (Pseudobarbus afer and Pseudobarbus phlegethon, Cyprinidae) across multiple river systems in South Africa. J Biogeogr. 2007, 34, 2086–2099. [Google Scholar] [CrossRef]
  6. Dolby, G.A.; Ellingson, R.A.; Findley, L.T.; Jacobs, D.K. How sea level change mediates genetic divergence in coastal species across regions with varying tectonic and sediment processes. Mol. Ecol. 2018, 27, 994–1011. [Google Scholar] [CrossRef]
  7. Chen, W.; Li, C.; Chen, F.; Li, Y.; Yang, J.; Li, J.; Li, X. Phylogeographic analyses of a migratory freshwater fish (Megalobrama terminalis) reveal a shallow genetic structure and pronounced effects of sea-level changes. Gene 2020, 737, 144478. [Google Scholar] [CrossRef]
  8. Xiang, D.; Li, Y.; Li, X.; Chen, W.; Ma, X. Population structure and genetic diversity of Culter recurviceps revealed by multi-loci. Biodivers. Sci. 2021, 29, 1505–1512. [Google Scholar] [CrossRef]
  9. Yang, J.Q.; Hsu, K.C.; Liu, Z.Z.; Su, L.W.; Kuo, P.H.; Tang, W.Q.; Zhou, Z.C.; Liu, D.; Bao, B.L.; Lin, H.D. The population history of Garra orientalis (Teleostei: Cyprinidae) using mitochondrial DNA and microsatellite data with approximate Bayesian computation. BMC Evol. Biol. 2016, 16, 1–15. [Google Scholar] [CrossRef] [Green Version]
  10. Wu, T.H.; Tsang, L.M.; Chen, I.-S.; Chu, K.H. Multilocus approach reveals cryptic lineages in the goby Rhinogobius duospilus in Hong Kong streams: Role of paleodrainage systems in shaping marked population differentiation in a city. Mol. Phylogenet. Evol. 2016, 104, 112–122. [Google Scholar] [CrossRef]
  11. Wang, P.; Li, Q. The South China Sea: Paleoceanography and Sedimentology; Springer: Dordrecht, The Netherlands, 2009. [Google Scholar]
  12. Zong, Y.; Yim, W.S.; Yu, F.; Huang, G. Late Quaternary environmental changes in the Pearl River mouth region, China. Quatern. Int. 2009, 206, 35–45. [Google Scholar] [CrossRef]
  13. Qiu, C.; Lin, Y.; Qing, N.; Zhao, J.; Chen, X. Genetic variation and phylogeography of Micronoemacheilus pulcher populations among drainage systems between western South China and Hainan Island. Acta Entomol. Sin. 2008, 51, 1099–1128. [Google Scholar]
  14. Luo, Y.; Chen, Y. Culterinae. Fauna Sinica, Osteichthyes, Cypriniformes II; Science Press: Beijing, China, 1998. [Google Scholar]
  15. Zheng, C. Ichthyography of the Pearl River; Science Press: Beijing, China, 1989. [Google Scholar]
  16. Reid, A.J.; Carlson, A.K.; Creed, I.F.; Eliason, E.J.; Gell, P.A.; Johnson, P.T.; Kidd, K.A.; MacCormack, T.J.; Olden, J.D.; Ormerod, S.J. Emerging threats and persistent conservation challenges for freshwater biodiversity. Biol. Rev. 2019, 94, 849–873. [Google Scholar] [CrossRef] [Green Version]
  17. Castello, L.; Macedo, M.N. Large-scale degradation of Amazonian freshwater ecosystems. Glob. Change Biol. 2016, 22, 990–1007. [Google Scholar] [CrossRef]
  18. Radinger, J.; Britton, J.R.; Carlson, S.M.; Magurran, A.E.; Alcaraz-Hernández, J.D.; Almodóvar, A.; Benejam, L.; Fernández-Delgado, C.; Nicola, G.G.; Oliva-Paterna, F.E. Effective monitoring of freshwater fish. Fish Fish. 2019, 20, 729–747. [Google Scholar] [CrossRef] [Green Version]
  19. Xiao, W.; Zhang, Y.; Liu, H. Molecular systematics of Xenocyprinae (Teleostei: Cyprinidae): Taxonomy, biogeography, and coevolution of a special group restricted in East Asia. Mol. Phylogenet. Evol. 2001, 18, 163–173. [Google Scholar] [CrossRef] [Green Version]
  20. Liu, H.; Chen, Y. Phylogeny of the East Asian cyprinids inferred from sequences of the mitochondrial DNA control region. Can. J. Zool. 2003, 81, 1938–1946. [Google Scholar] [CrossRef] [Green Version]
  21. Lovejoy, N.R.; Collette, B.B. Phylogenetic relationships of new world needlefishes (Teleostei: Belonidae) and the biogeography of transitions between marine and freshwater habitats. Copeia 2001, 2001, 324–338. [Google Scholar] [CrossRef]
  22. Edgar, R.C. MUSCLE: Multiple sequence alignment with high accuracy and high throughput. Nucleic Acids Res. 2004, 32, 1792–1797. [Google Scholar] [CrossRef] [Green Version]
  23. Kumar, S.; Stecher, G.; Li, M.; Knyaz, C.; Tamura, K. MEGA X: Molecular evolutionary genetics analysis across computing platforms. Mol. Biol. Evol. 2018, 35, 1547–1549. [Google Scholar] [CrossRef]
  24. Librado, P.; Rozas, J. DnaSP v5: A software for comprehensive analysis of DNA polymorphism data. Bioinformatics 2009, 25, 1451–1452. [Google Scholar] [CrossRef] [PubMed]
  25. Leigh, J.W.; Bryant, D. popart: Full-feature software for haplotype network construction. Methods Ecol. Evol. 2015, 6, 1110–1116. [Google Scholar] [CrossRef]
  26. Woerner, A.E.; Cox, M.P.; Hammer, M.F. Recombination-filtered genomic datasets by information maximization. Bioinformatics 2007, 23, 1851–1853. [Google Scholar] [CrossRef] [PubMed] [Green Version]
  27. Weir BS, C.C. Estimating F-statistics for the analysis of population structure. Evolution 1984, 38, 1358–1370. [Google Scholar] [PubMed]
  28. Excoffier, L.; Lischer, H.E.L. Arlequin suite ver 3.5: A new series of programs to perform population genetics analyses under Linux and Windows. Mol. Ecol. Resour. 2010, 10, 564–567. [Google Scholar] [CrossRef] [PubMed]
  29. Kimura, M. A simple method for estimating evolutionary rates of base substitutions through comparative studies of nucleotide sequences. J. Mol. Evol. 1980, 16, 111–120. [Google Scholar] [CrossRef]
  30. Tajima, F. Statistical method for testing the neutral mutation hypothesis by DNA polymorphism. Genetics 1989, 123, 585–595. [Google Scholar] [CrossRef]
  31. Fu, Y.X. Statistical tests of neutrality of mutations against population growth, hitchhiking and background selection. Genetics 1997, 147, 915–925. [Google Scholar] [CrossRef]
  32. Schneider, S.; Excoffier, L. Estimation of past demographic parameters from the distribution of pairwise differences when the mutation rates vary among sites: Application to human mitochondrial DNA. Genetics 1999, 152, 1079–1089. [Google Scholar] [CrossRef]
  33. Drummond, A.J.; Rambaut, A.; Shapiro, B.; Pybus, O.G. Bayesian coalescent inference of past population dynamics from molecular sequences. Mol. Biol. Evol. 2005, 22, 1185–1192. [Google Scholar] [CrossRef] [Green Version]
  34. Drummond, A.J.; Rambaut, A. BEAST: Bayesian evolutionary analysis by sampling trees. BMC Evol. Biol. 2007, 7, 1–8. [Google Scholar] [CrossRef]
  35. Nylander, J. MrModeltest v2. Program Distributed by the Author; Evolutionary Biology Centre, Uppsala University: Uppsala, Sweden, 2004. [Google Scholar]
  36. Meyer, A. Evolution of Mitochondrial DNA in Fishes: Biochemistry and Molecular Biology of Fishes; Hochachka, P.W., Mommsen, T.P., Eds.; Elsevier Press: Hague, Netherlands, 1993; Volume 2. [Google Scholar]
  37. Durand, J.D.; Tsigenopoulos, C.S.; Unlu, E.; Berrebi, P. Phylogeny and biogeography of the family Cyprinidae in the Middle East inferred from cytochrome b DNA-Evolutionary significance of this region. Mol. Phylogenet. Evol. 2002, 25, 218. [Google Scholar] [CrossRef]
  38. Ketmaier, V.; Bianco, P.G.; Cobollia, M.; Krivokapic, M.; Caniglia, R.; de Matthaeis, E. Molecular phylogeny of two lineages of Leuciscinae cyprinids (Telestes and Scardinius) from the peri-Mediterranean area based on cytochrome b data. Mol. Phylogenet. Evol. 2004, 32, 1061–1071. [Google Scholar] [CrossRef]
  39. Yu, D.; Chen, M.; Tang, Q.; Li, X.; Liu, H. Geological events and Pliocene climate fluctuations explain the phylogeographical pattern of the cold water fish Rhynchocypris oxycephalus (Cypriniformes: Cyprinidae) in China. BMC Evol. Biol. 2014, 14, 1–12. [Google Scholar] [CrossRef] [Green Version]
  40. Tracer v1.4. Available online: http://beast.bio.ed.ac.uk/Tracer (accessed on 8 August 2022).
  41. Beerli, P. How to Use MIGRATE or Why Are Markov Chain Montecarlo Programs Difficult to Use? Cambridge University Press: Cambridge, UK, 2009. [Google Scholar]
  42. Gascoyne, M.; Benjamin, G.J.; Schwarcz, H.P.; Ford, D.C. Sea-level lowering during the illinoian glaciation: Evidence from a bahama “blue hole”. Science 1979, 205, 806–808. [Google Scholar] [CrossRef]
  43. Liu, Z.; Trentesaux, A.; Clemens, S.C.; Colin, C.; Wang, P.; Huang, B.; Boulay, S. Clay mineral assemblages in the northern South China Sea: Implications for East Asian monsoon evolution over the past 2 million years. Mar. Geol. 2003, 201, 133–146. [Google Scholar] [CrossRef]
  44. Chen, X.L.; Chiang, T.Y.; Lin, H.D.; Zheng, H.S.; Shao, K.T.; Zhang, Q.; Hsu, K.C. Mitochondrial DNA phylogeography of Glyptothorax fokiensis and Glyptothorax hainanensis in Asia. J. Fish Biol. 2007, 70, 75–93. [Google Scholar] [CrossRef]
  45. Lin, H.D.; Kuo, P.H.; Wang, W.K.; Chiu, Y.W.; Ju, Y.M.; Lin, F.J.; Hsu, K.C. Speciation and differentiation of the genus Opsariichthys (Teleostei: Cyprinidae) in East Asia. Biochem. Syst. Ecol. 2016, 68, 92–100. [Google Scholar] [CrossRef]
  46. Chen, W.; Hubert, N.; Li, Y.; Xiang, D.; Cai, X.; Zhu, S.; Yang, J.; Zhou, C.; Li, X.; Li, J. Large-scale DNA barcoding of the subfamily Culterinae (Cypriniformes: Xenocyprididae) in East Asia unveils a geographical scale effect, taxonomic warnings and cryptic diversity. Mol. Ecol. 2022, 31, 3871–3887. [Google Scholar] [CrossRef]
  47. Wang, J.; Li, C.; Chen, J.; Wang, J.; Jin, J.; Jiang, S.; Yan, L.; Lin, H.D.; Zhao, J. Phylogeographic structure of the dwarf snakehead (Channa gachua) around Gulf of Tonkin: Historical biogeography and pronounced effects of sea-level changes. Ecol. Evol. 2021, 11, 12583–12595. [Google Scholar] [CrossRef]
  48. Zhou, J.; Zhang, C. Freshwater Fishes of Guangxi, China; Guangxi People’s Publishing House: Nanning, China, 2005. [Google Scholar]
  49. Araripe, J.; do Rêgo, P.S.; Queiroz, H.; Sampaio, I.; Schneider, H. Dispersal capacity and genetic structure of Arapaima gigas on different geographic scales using microsatellite markers. PLoS ONE 2013, 8, e54470. [Google Scholar] [CrossRef] [PubMed]
  50. Tzeng, C.S.; Lin, Y.S.; Lin, S.M.; Wang, T.Y.; Wang, F.Y. The phylogeography and population demographics of selected freshwater fishes in Taiwan. Zool. Stud. 2006, 45, 285–297. [Google Scholar]
  51. Chen, W.; Zhong, Z.; Dai, W.; Fan, Q.; He, S. Phylogeographic structure, cryptic speciation and demographic history of the sharpbelly (Hemiculter leucisculus), a freshwater habitat generalist from southern China. BMC Evol. Biol. 2017, 17, 1–13. [Google Scholar] [CrossRef] [PubMed] [Green Version]
  52. Yang, J.; Li, C.; Chen, W.; Li, Y.; Li, X. Genetic diversity and population demographic history of Ochetobius elongatus in the middle and lower reaches of the Xijiang River. Biodivers. Sci. 2018, 26, 1289–1295. [Google Scholar] [CrossRef] [Green Version]
  53. Grant, W.S.; Bowen, B.W. Shallow population histories in deep evolutionary lineages of marine fishes: Insights from sardines and anchovies and lessons for conservation. J. Hered. 1998, 89, 415–426. [Google Scholar] [CrossRef] [Green Version]
  54. Bernard, A.M.; Feldheim, K.A.; Heithaus, M.R.; Wintner, S.P.; Wetherbee, B.M.; Shivji, M.S. Global population genetic dynamics of a highly migratory, apex predator shark. Mol. Ecol. 2016, 25, 5312–5329. [Google Scholar] [CrossRef]
  55. Huey, J.A.; Cook, B.D.; Unmack, P.J.; Hughes, J.M. Broadscale phylogeographic structure of five freshwater fishes across the Australian Monsoonal Tropics. Freshw. Sci. 2013, 33, 273–287. [Google Scholar] [CrossRef] [Green Version]
  56. Frankham, R. Effective population size/adult population size ratios in wildlife: A review. Genet. Res. 1995, 66, 95–107. [Google Scholar] [CrossRef]
  57. Moritz, C. Uses of molecular phylogenies for conservation. Phil. Trans. R. Soc. B 1995, 349, 113–118. [Google Scholar]
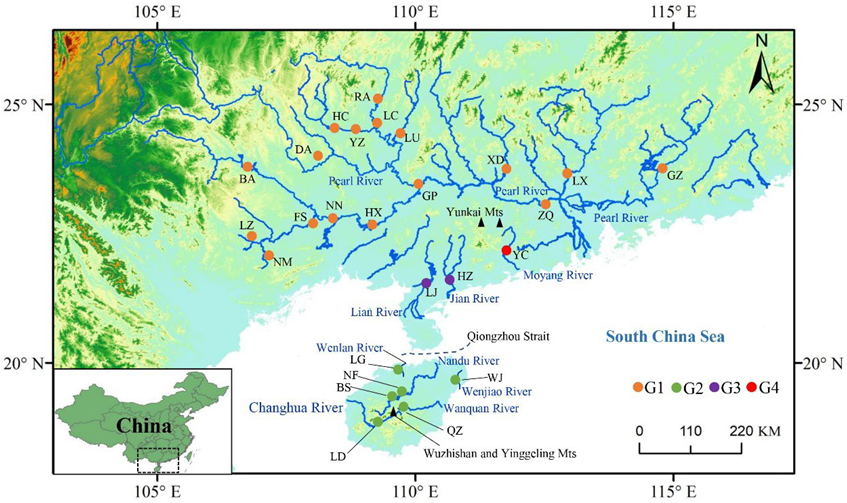
Figure 1. Toxabramis houdemeri sampling sites in the current study. The pie charts represent the four mitochondrial groups defined based on the mitochondrial network. Population codes are defined in Table 1.
Biology 11 01641 g001
Figure 2. Haplotype (a) and allele (b) networks for the nine rivers included in this study based on concatenated mitochondrial locus (MCR) and RAG2 data. Circles are proportional to sample size (scale differs between networks) and colored based on geographical origin.
Biology 11 01641 g002
Figure 3. Extended Bayesian skyline plots of the Cytb gene using substitution rates of 1.0% (a) and 2.0% (b) per million years (Myr). The ordinate corresponds to Neτ, the product of effective population size and generation length per millennium (ka), and the abscissa corresponds to time (ka). Estimates of means are joined by a red line, while the dashed lines delineate the 95% HPD limits.
Biology 11 01641 g003
Figure 4. Historical immigration rates (a) and divergence times (b) between the four defined mitochondrial haplotype groups (G1–G4) as derived from the mitochondrial network. Immigration rates (a) and divergence times (b) were inferred based on concatenated mitochondrial loci (MCR) with a substitution rates of 0.756% (left) and 1.513% (right).
Biology 11 01641 g004
Table 1. Genetic diversity indexes for Toxabramis houdemeri populations based on concatenated mitochondrial locus (MCR) and RAG2. n, sequence numbers; H, haplotype numbers; Hd, haplotype diversity; and π, nucleotide diversity.
LocationsCodesRiverMCRRAG2
nHHdπnHHdπ
BaiseBAPearl R.2830.611 ± 0.0600.0029 ± 0.000356200.933 ± 0.0150.0027 ± 0.0002
DuanDAPearl R.2121
FushuiFSPearl R.2220.091 ± 0.0810.0001 ± 0.00014490.796 ± 0.0490.0023 ± 0.0001
GuipingGPPearl R.2690.868 ± 0.0400.0035 ± 0.000552150.880 ± 0.0330.0027 ± 0.0002
GuzhuGZPearl R.3380.782 ± 0.0450.0056 ± 0.00036670.304 ± 0.0730.0005 ± 0.0001
HechiHCPearl R.111002290.896 ± 0.0340.0018 ± 0.0001
HengxianHXPearl R.640.867 ± 0.1290.0041 ± 0.00081250.848 ± 0.0670.0032 ± 0.0003
LiuchengLCPearl R.1980.830 ± 0.0660.0040 ± 0.000438130.902 ± 0.0220.0024 ± 0.0001
LixiLXPearl R.28130.905 ± 0.0340.0013 ± 0.000248200.855 ± 0.0430.0023 ± 0.0003
LongzhouLZPearl R.26180.954 ± 0.0270.0059 ± 0.001152210.956 ± 0.0130.0029 ± 0.0002
LuzhaiLUPearl R.1180.927 ± 0.0660.0047 ± 0.000422130.952 ± 0.0240.0026 ± 0.0002
NanningNNPearl R.771.0 ± 0.0760.0028 ± 0.00051460.879 ± 0.0520.0034 ± 0.0004
NingmingNMPearl R.1740.331 ± 0.1430.0017 ± 0.00073090.703 ± 0.0850.0015 ± 0.0002
RonganRAPearl R.2820.071 ± 0.0650.0003 ± 0.000356140.647 ± 0.0730.0018 ± 0.0003
XinduXDPearl R.1122
YizhouYZPearl R.1720.309 ± 0.1220.0021 ± 0.00093470.793 ± 0.0400.0018 ± 0.0002
ZhaoqingZQPearl R.30220.972 ± 0.0170.0033 ± 0.000450150.788 ± 0.0540.0020 ± 0.0003
BaishaBSNandu R.3090.632 ± 0.0960.0010 ± 0.000260150.811 ± 0.0350.0014 ± 0.0001
NanfengNFNandu R.2020.442 ± 0.0870.0009 ± 0.000240120.897 ± 0.0250.0023 ± 0.0001
LedongLDChanghua R.2780.835 ± 0.0430.0010 ± 0.001054240.942 ± 0.0160.0024 ± 0.0002
LingaoLGWenlan R.2070.521 ± 0.1350.0005 ± 0.00023090.821 ± 0.0480.0023 ± 0.0004
QiongzhongQZWanquan R.2890.873 ± 0.0370.0011 ± 0.000156230.944 ± 0.0150.0025 ± 0.0002
WenjiaoWJWenjiao R.940.583 ± 0.1830.0007 ± 0.00031470.890 ± 0.0550.0021 ± 0.0002
HuazhouHZJian R.2360.700 ± 0.0880.0008 ± 0.000244140.895 ± 0.03-0.0018 ± 0.0001
LianjiangLJLian R.2840.632 ± 0.0670.0004 ± 0.000160300.953 ± 0.0140.0047 ± 0.0008
YangchunYCMoyang R.3060.611 ± 0.0880.0013 ± 0.000360100
G1 312710.895 ± 0.0130.0044 ± 0.0002600910.873 ± 0.0120.0027 ± 0.0001
G2 134210.835 ± 0.0200.0010 ± 0.0001254560.912 ± 0.0110.0023 ± 0.0001
G3 5180.665 ± 0.0580.0006 ± 0.0001104380.935 ± 0.0140.0036 ± 0.0005
G4 3060.611 ± 0.0880.0013 ± 0.000360100
Global 5271060.948 ± 0.00490.0044 ± 0.000110181680.915 ± 0.00640.0036 ± 0.0001
Table 2. Hierarchical population structure of Toxabramis houdemeri populations based on concatenated mitochondrial locus (MCR) and RAG2.
Source of VariationMCRRAG2
Percentage of VariationΦ-Statisticp-ValuePercentage of VariationΦ-Statisticp-Value
Grouped by locations
Between populations53.940.539<0.00141.440.414<0.001
Within populations46.060.461 58.560.586
Grouped by nine rivers
Between rivers25.260.253<0.00132.150.322<0.001
Between populations within rivers32.650.327<0.00115.690.157<0.001
Within populations42.090.421<0.00152.160.522<0.001
Grouped by genetic groups
Between genetic groups37.980.379<0.00137.740.377<0.001
Between populations within genetic groups22.910.229<0.00112.400.124<0.001
Within populations39.110.391<0.00149.860.499<0.001
Publisher’s Note: MDPI stays neutral with regard to jurisdictional claims in published maps and institutional affiliations.