

Can Biological Traits Serve as Predictors for Fishes’ Introductions, Establishment, and Interactions? The Mediterranean Sea as a Case Study

 ,
,  ,
,
Abstract
Simple Summary
Abstract

1. Introduction
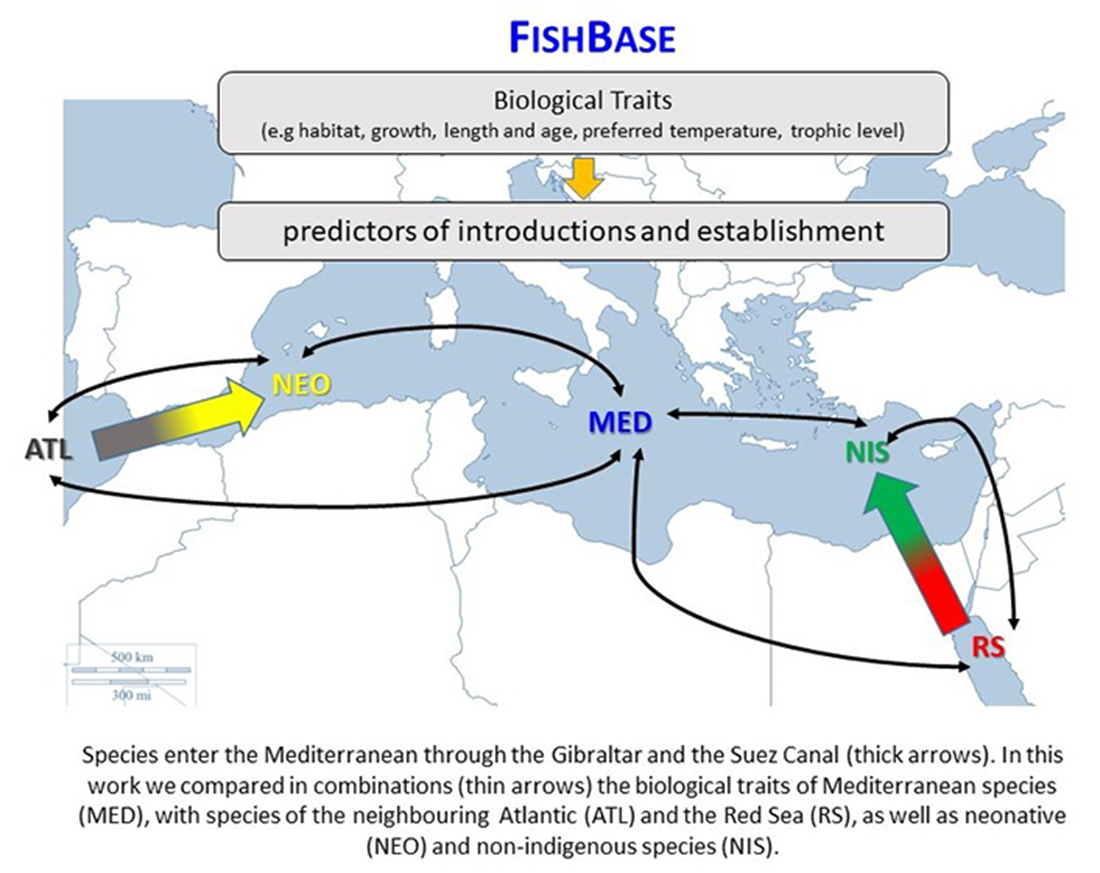
2. Materials and Methods
2.1. Compilation of the Data Set
2.2. Statistical Analyses
3. Results
3.1. Species per Region
3.1.1. Mediterranean Sea Inhabitants (MED)
3.1.2. Red Sea Species (RS)
3.1.3. Atlantic Species (ATL)
3.1.4. Non-Indigenous Species (NIS)
3.1.5. Neonative Species (NEO)
3.2. Between Regions Species’ Comparisons
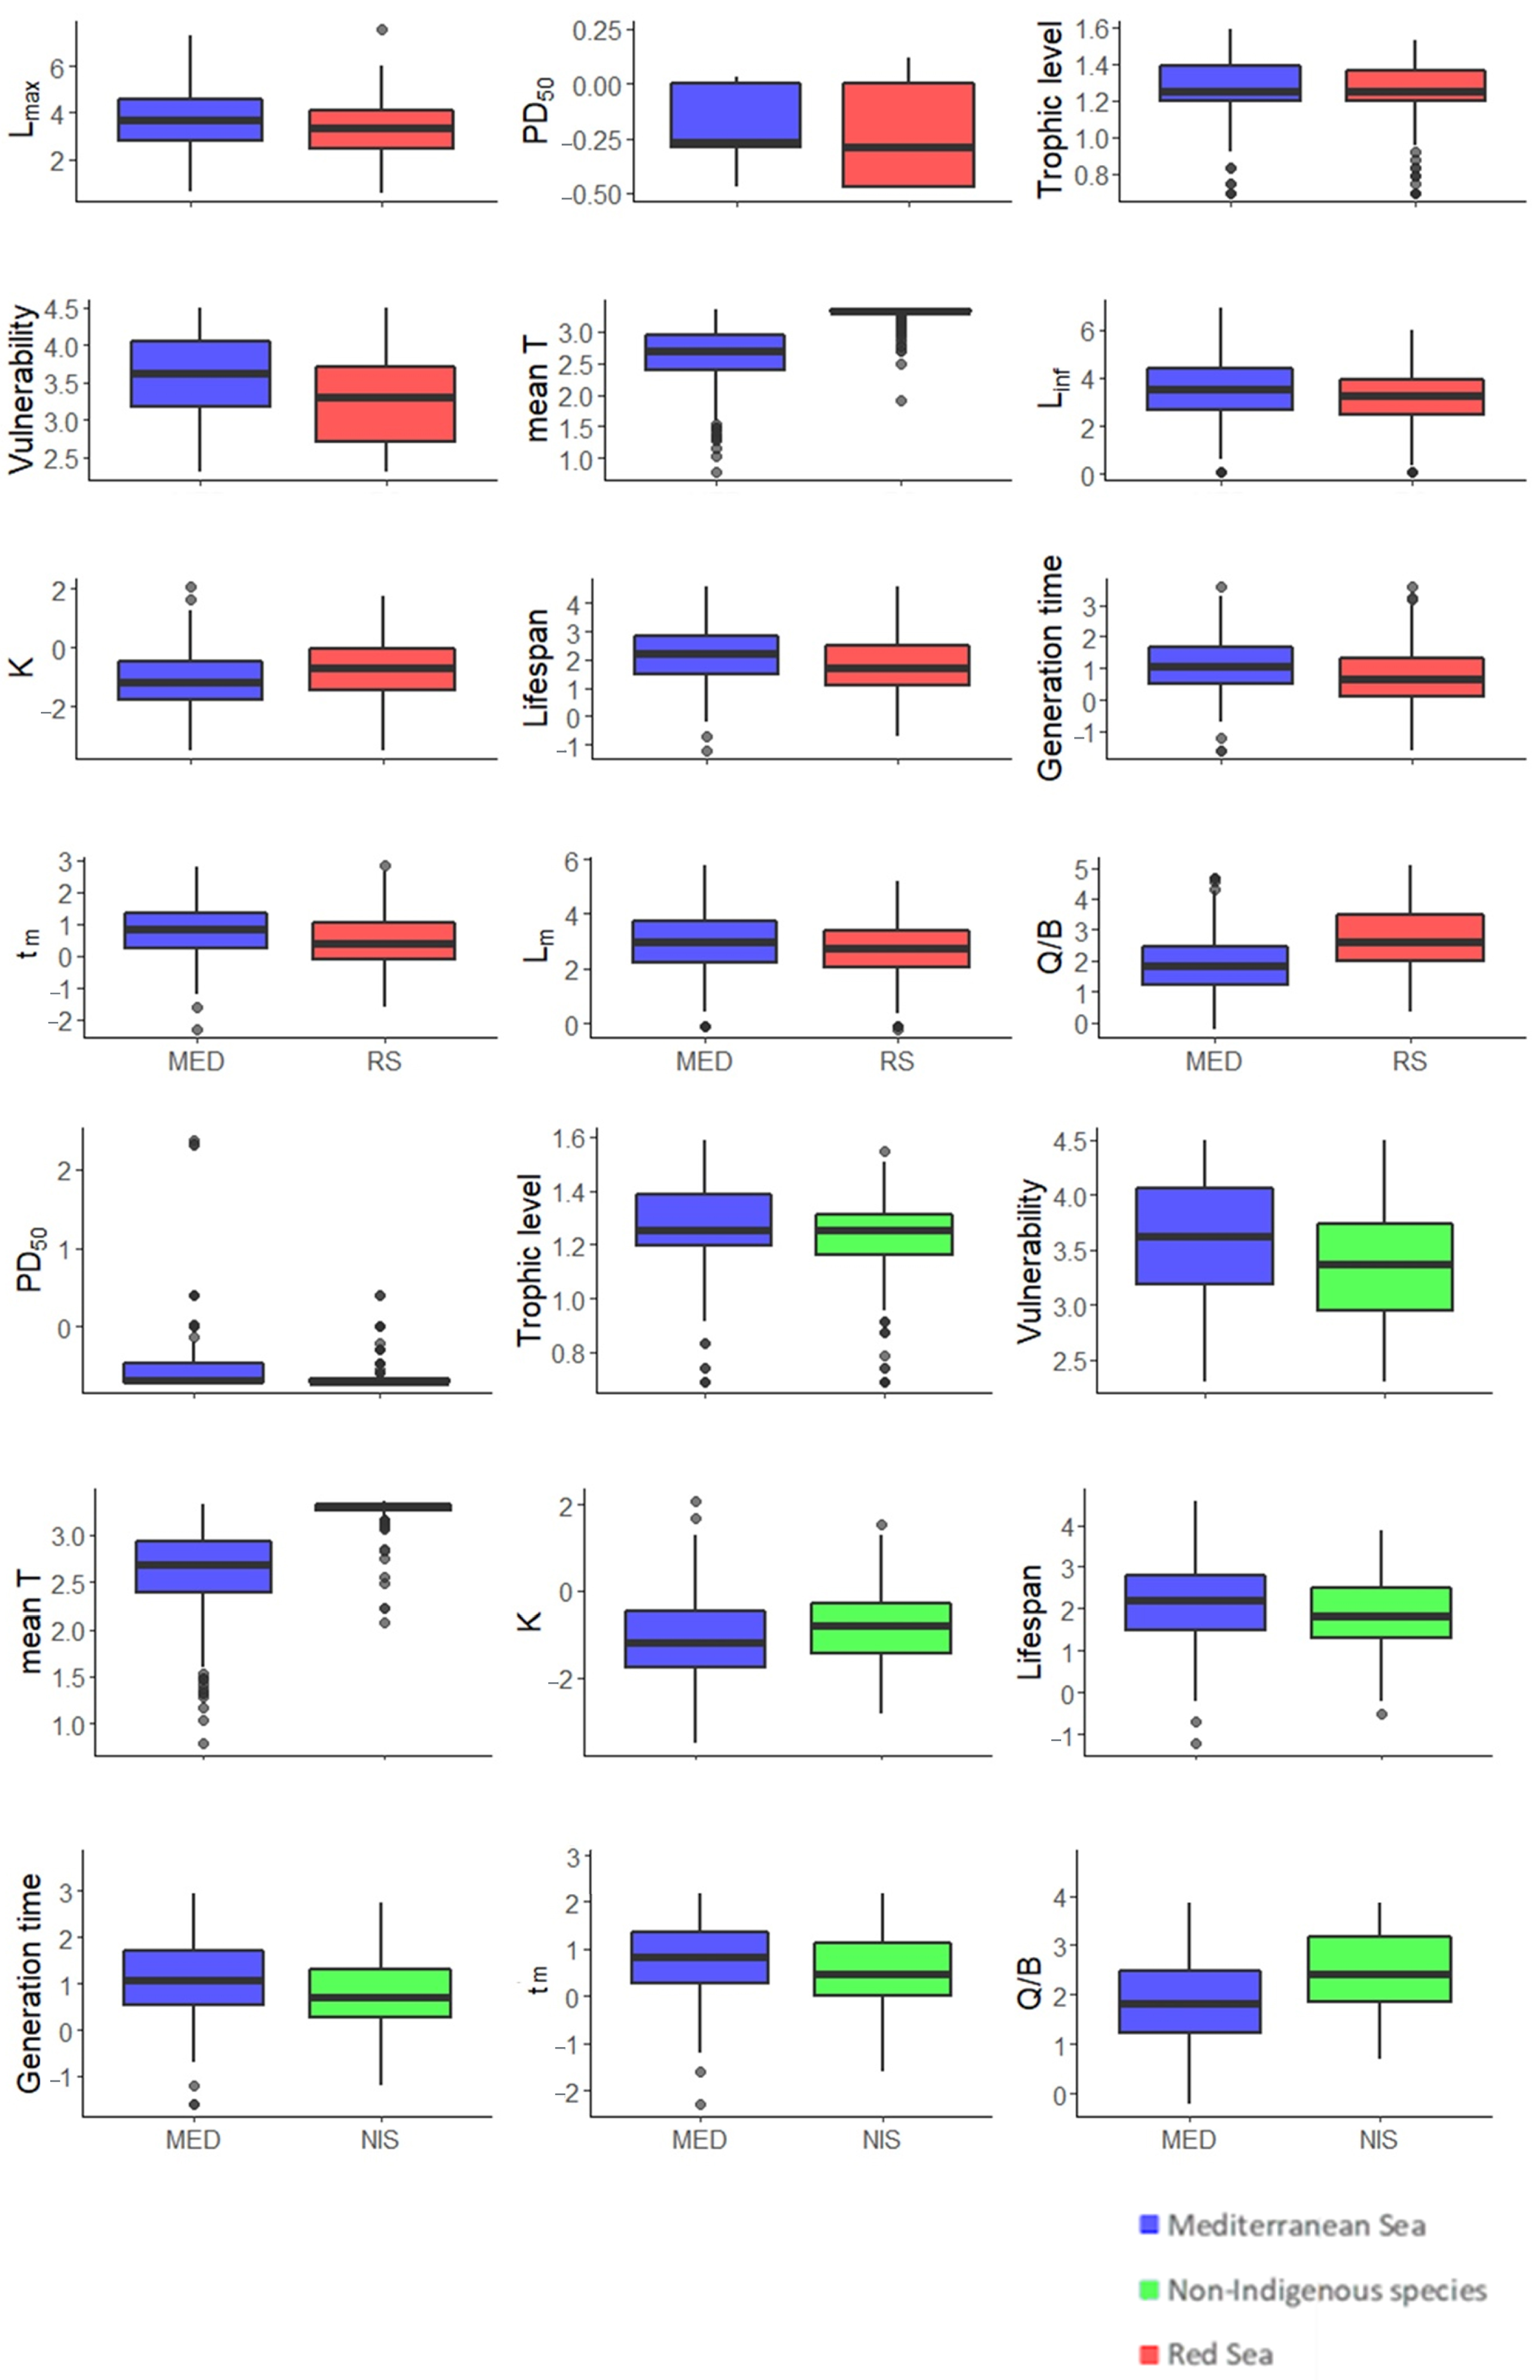
3.2.1. MED and RS
3.2.2. MED and NIS
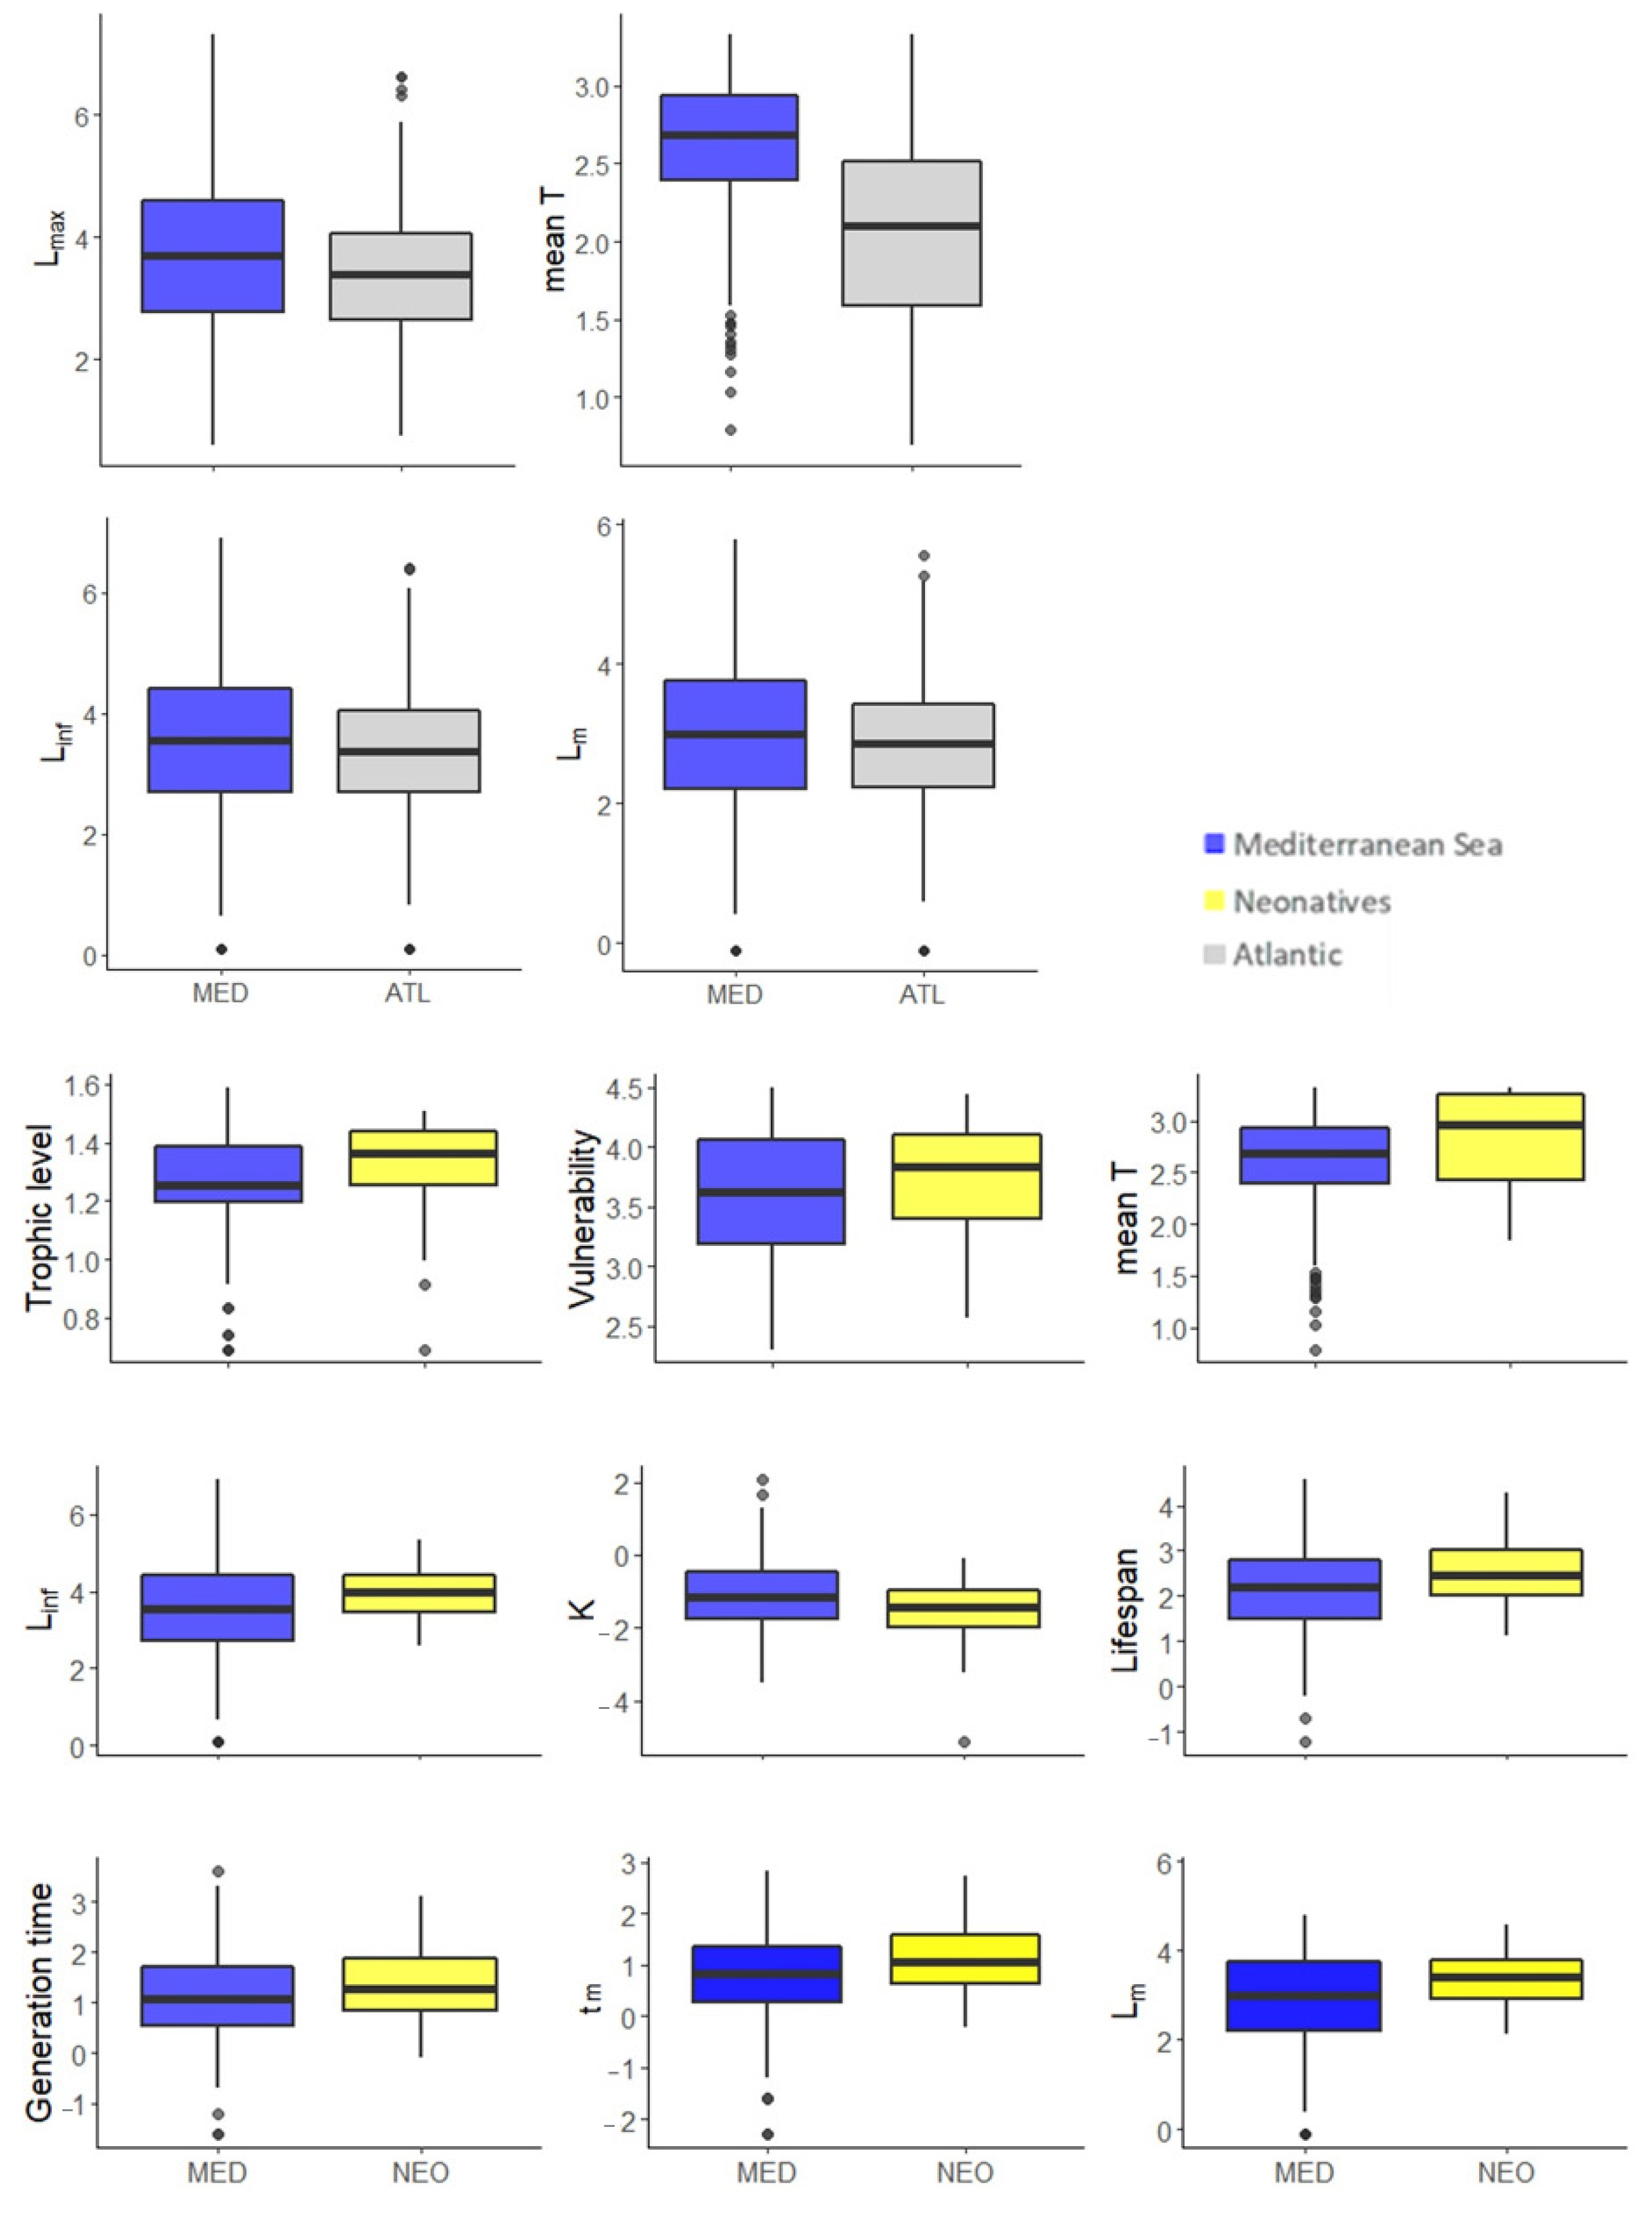
3.2.3. MED and ATL
3.2.4. MED and NEO
3.3. Traits per Region
3.4. Trait Space of Fish Species
3.5. Traits of Establishment
4. Discussion
4.1. Species per Region
4.2. Between Regions Species’ Comparisons
4.3. Biological Traits and Introduction/Establishment
4.4. Competition, Invasiveness, and Possible Extirpations
4.5. Future Research Potential
5. Conclusions
Supplementary Materials
Author Contributions
Funding
Institutional Review Board Statement
Informed Consent Statement
Data Availability Statement
Acknowledgments
Conflicts of Interest
References
- Jensen, A.S. Concerning a Change of Climate during Recent Decades in the Arctic and Subarctic Regions, from Greenland in the West to Eurasia in the East, and Contemporary Biological and Geophysical Changes, Det Kongelige Danske Videnskabernes Selskab; Biologiske Meddelelser: Copenhagen, Denmark, 1939; pp. 1–75. [Google Scholar]
- Hewitt, C.L. Distribution and biodiversity of Australian tropical marine bioinvasions. Pac. Sci. 2002, 56, 213–222. [Google Scholar] [CrossRef]
- Dukes, J.S.; Mooney, H.A. Does global change increase the success of biological invaders? Trends Ecol. Evol. 1999, 4, 135–139. [Google Scholar] [CrossRef]
- Katsanevakis, S.; Wallentinus, I.; Zenetos, A.; Leppäkoski, E.; Çinar, M.E.; Oztürk, B.; Grabowski, M.; Golani, D.; Cardoso, A.C. Impacts of invasive alien marine species on ecosystem services and biodiversity: A pan-European review. Aquat. Invasions 2014, 9, 391–423. [Google Scholar] [CrossRef]
- Myers, J.H.; Simberloff, D.; Kuris, A.M.; Carey, J.R. Eradication revisited: Dealing with exotic species. Trends Ecol. Evol. 2000, 15, 316–320. [Google Scholar] [CrossRef]
- Essl, F.; Dullinger, S.; Genovesi, P.; Hulme, P.E.; Jeschke, J.M.; Katsanevakis, S.; Kühn, I.; Lenzner, B.; Pauchard, A.; Pyšek, P.; et al. A Conceptual Framework for Range-Expanding Species that Track Human-Induced Environmental Change. BioScience 2019, 69, 908–919. [Google Scholar] [CrossRef]
- Por, F.D. Lessepsian migration: The Influx of Red Sea Biota into the Mediterranean by Way of the Suez Canal; Springer: Berlin/Heidelberg, Germany, 1978; pp. 8–228. [Google Scholar]
- Ζenetos, A.; Gofas, S.; Morri, C.; Rosso, A.; Violanti, D.; García Raso, J.E.; Çinar, M.E.; Almogi-Labin, A.; Ates, A.S.; Azzurro, E.; et al. Alien species in the Mediterranean Sea by 2012. A contribution to the application of European Union’s Marine Strategy Framework Directive (MSFD). Part 2. Introduction trends and pathways. Mediterr. Mar. Sci. 2012, 13, 328–352. [Google Scholar] [CrossRef]
- Zenetos, A.; Apostolopoulos, G.; Crocetta, F. Aquaria kept marine fish species possibly released in the Mediterranean Sea: First confirmation of intentional release in the wild. Acta Ichthyol. Piscat. 2016, 46, 255–262. [Google Scholar] [CrossRef][Green Version]
- Golani, D.; Orsi-Relini, L.; Massuti, E.; Quignard, J.-P. CIESM Atlas of Exotic Species in the Mediterranean–Vol. 1 Fishes; CIESM Publishers: Monte Carlo, Monaco, 2002; p. 256. [Google Scholar]
- Puth, L.M.; Post, D.M. Studying invasion: Have we missed the boat? Ecol. Lett. 2005, 8, 715–721. [Google Scholar] [CrossRef]
- Hamilton, M.A.; Murray, B.R.; Cadotte, M.W.; Hose, G.C.; Baker, A.C.; Harris, C.J.; Licari, D. Life-history correlates of plant invasiveness at regional and continental scales. Ecol. Lett. 2005, 8, 1066–1074. [Google Scholar] [CrossRef]
- Gallardo, B.; Zieritz, A.; Adriaens, T.; Bellard, C.; Boets, P.; Britton, J.R.; Newman, J.R.; Van Valkenburg, J.L.C.H.; Aldridge, D.C. Trans-national horizon scanning for invasive non-native species: A case study in western Europe. Biol. Invasions 2016, 18, 17–30. [Google Scholar] [CrossRef]
- Peyton, J.M.; Martinou, A.F.; Pescott, O.L.; Demetriou, M.; Adriaens, T.; Arianoutsou, M.; Bazos, I.; Bean, C.W.; Botham, M.; Britton, J.R.; et al. Horizon scanning for invasive alien species with the potential to threaten biodiversity and human health on a Mediterranean island. Biol. Invasions 2019, 21, 2107–2125. [Google Scholar] [CrossRef]
- Peyton, J.M.; Martinou, A.F.; Adriaens, T.; Chartosia, N.; Karachle, P.K.; Rabitsch, W.; Tricarico, E.; Arianoutsou, M.; Bacher, S.; Bazos, I.; et al. Horizon scanning to predict and prioritize invasive alien species with the potential to threaten human health and economies on Cyprus. Front. Ecol. Evol. 2020, 8, 566281. [Google Scholar] [CrossRef]
- Roy, H.E.; Peyton, J.; Aldridge, D.C.; Bantock, T.; Blackburn, T.M.; Britton, R.; Clark, P.; Cook, E.; Dehnen-Schmutz, K.; Dines, T.; et al. Horizon scanning for invasive alien species with the potential to threaten biodiversity in Great Britain. Glob. Chang. Biol. 2014, 20, 3859–3871. [Google Scholar] [CrossRef]
- Roy, H.E.; Bacher, S.; Essl, F.; Adriaens, T.; Aldridge, D.C.; Bishop, J.D.D.; Blackburn, T.M.; Branquart, E.; Brodie, J.; Carboneras, C.; et al. Developing a list of invasive alien species likely to threaten biodiversity and ecosystems in the European Union. Glob. Chang. Biol. 2019, 25, 1032–1048. [Google Scholar] [CrossRef] [PubMed]
- Arndt, E.; Schembri, P.J. Common traits associated with establishment and spread of Lessepsian fishes in the Mediterranean Sea. Mar. Biol. 2015, 162, 2141–2153. [Google Scholar] [CrossRef]
- Evans, J.; Arndt, E.; Schembri, P.J. Atlantic fishes in the Mediterranean: Using biological traits to assess the origin of newcomer fishes. Mar. Ecol. Prog. Ser. 2020, 643, 133–143. [Google Scholar] [CrossRef]
- Goren, M.; Galil, B.S.; Diamant, A.; Stern, N.; Levitt-Barmats, Y. Invading up the food web? Invasive fish in the southeastern Mediterranean Sea. Mar. Biol. 2016, 163, 180. [Google Scholar] [CrossRef]
- Tzanatos, E.; Moukas, C.; Koutsidi, M. Mediterranean nekton traits: Distribution, relationships and significance for marine ecology monitoring and management. PeerJ 2020, 8, e8494. [Google Scholar] [CrossRef]
- Gaither, M.R.; Bowen, B.W.; Toonen, R.J. Population structure in the native range predicts the spread of introduced marine species. Proc. Royal Soc. B 2013, 280, 20130409. [Google Scholar] [CrossRef]
- Schickele, A.; Guidetti, P.; Giakoumi, S.; Zenetos, A.; Francour, P.; Raybaud, V. Improving predictions of invasive fish ranges combining functional and ecological traits with environmental suitability under climate change scenarios. Glob. Chang. Biol. 2021, 27, 6086–6102. [Google Scholar] [CrossRef]
- Coll, M.; Piroddi, C.; Steenbeek, J.; Kaschner, K.; Ben Rais Lasram, F.; Aguzzi, J.; Ballesteros, E.; Bianchi, C.N.; Corbera, J.; Dailianis, T.; et al. The Biodiversity of the Mediterranean Sea: Estimates, Patterns, and Threats. PLoS ONE 2010, 5, e11842. [Google Scholar] [CrossRef] [PubMed]
- Froese, R.; Pauly, D. FishBase. World Wide Web Electronic Publication. Available online: https://www.fishbase.org (accessed on 1 December 2021).
- Akel, E.H.K.H.; Karachle, P.K. The marine ichthyofauna of Egypt. Egypt. J. Aquat. Biol. Fish. 2017, 21, 81–116. [Google Scholar] [CrossRef]
- Zenetos, A.; Albano, P.; Lopez, E.; Stern, N.; Tsiamis, K.; Galanidi, M. Established non-indigenous species increased by 40% in 11 years in the Mediterranean Sea. Mediterr. Mar. Sci. 2022, 23, 196–212. [Google Scholar] [CrossRef]
- Von Bertalanffy, L. A quantitative theory of organic growth (inquiries on growth laws. II). Hum. Biol. 1938, 10, 181–213. [Google Scholar]
- Stergiou, Κ.Ι.; Karpouzi, V.S. Feeding habits and trophic levels of Mediterranean fish. Rev. Fish Biol. Fish. 2002, 11, 217–254. [Google Scholar] [CrossRef]
- Karachle, P.K.; Stergiou, K.I. An update on the feeding habits of fish in the Mediterranean. Mediterr. Mar. Sci. 2017, 18, 43–52. [Google Scholar] [CrossRef]
- Faith, D.P.; Reid, C.A.M.; Hunter, J. Integrating phylogenetic diversity, complementarity, and endemism for conservation assessment. Conserv. Biol. 2004, 18, 255–261. [Google Scholar] [CrossRef]
- Benjamini, Y.; Hochberg, Y. Controlling the false discovery rate: A practical and powerful approach to multiple testing. J. R. Stat. Soc. Ser. B 1995, 57, 289–300. [Google Scholar] [CrossRef]
- Pearson, K.X. On the criterion that a given system of deviations from the probable in the case of a correlated system of variables is such that it can be reasonably supposed to have arisen from random sampling. Lond. Edinb. Dublin Philos. Mag. J. Sci. 1900, 50, 157–175. [Google Scholar] [CrossRef]
- Cramér, H. Mathematical Methods of Statistics; Princeton University Press: Princeton, NJ, USA, 1946. [Google Scholar]
- Breiman, L. Random Forests. Mach. Learn. 2001, 45, 5–32. [Google Scholar] [CrossRef]
- Hanley, J.A.; McNeil, B.J. The meaning and use of the area under a Receiver Operating Characteristic (ROC) curve. Radiology 1982, 143, 29–36. [Google Scholar] [CrossRef] [PubMed]
- R Core Team. R: A Language and Environment for Statistical Computing Computing v. 4.0. 4; R Core Team: Vienna, Austria, 2021. [Google Scholar]
- Karachle, P.K.; Corsini-Foka, M.; Crocetta, F.; Dulčić, J.; Dzhembekova, N.; Galanidi, M.; Ivanova, P.; Shenkar, N.; Skolka, M.; Stefanova, E.; et al. Setting-up a billboard of priority invasive species in the ESENIAS marine area. Acta Adriat. 2017, 58, 429–458. [Google Scholar] [CrossRef][Green Version]
- Mastrototaro, F.; Carlucci, R.; Capezzuto, F.; Sion, L. First record of dwarf flathead Elates ransonnetii (Platycephalidae) in the Mediterranean Sea (North-Western Ionian Sea). Cybium 2007, 31, 393–394. [Google Scholar]
- Schembri, P.J.; Bodilis, P.; Evans, J.; Francour, P. Occurrence of barred knifejaw, Oplegnathus fasciatus (Actinopterygii: Perciformes: Oplegnathidae), in Malta (Central Mediterranean) with a discussion on possible modes of entry. Acta Ichthyol. Piscat. 2010, 40, 101–104. [Google Scholar] [CrossRef]
- Bariche, M.; Al-Mabruk, S.; Ateş, M.; Büyük, A.; Crocetta, F.; Dritsas, M.; Edde, D.; Fortič, A.; Gavriil, E.; Gerovasileiou, V.; et al. New Alien Mediterranean Biodiversity Records (March 2020). Mediterr. Mar. Sci. 2020, 21, 129–145. [Google Scholar] [CrossRef]
- Hassan, M.; Harmelin-Vivien, M.; Bonhomme, F. Lessepsian invasion without bottleneck: Example of two rabbitfish species (Siganus rivulatus and Siganus luridus). J. Exp. Mar. Biol. Ecol. 2003, 291, 219–232. [Google Scholar] [CrossRef]
- Bilecenoglu, M.; Kaya, M. Growth of marbled spinefoot Siganus rivulatus Forsskal, 1775 (Teleostei: Siganidae) introduced to Antalya Bay, eastern Mediterranean Sea (Turkey). Fish. Res. 2002, 54, 279–285. [Google Scholar] [CrossRef]
- Bariche, M.; Letoruneur, Y.; Harmelin-Vivien, M. Temporal fluctuations and settlement patterns of native and Lessepsian herbivorous fishes on the Lebanese coast (eastern Mediterranean). Environ. Biol. Fishes 2004, 70, 81–90. [Google Scholar] [CrossRef]
- Harmelin-Vivien, M.L.; Bitar, G.; Harmelin, J.-G.; Monestiez, P. The littoral fish community of the Lebanese rocky coast (eastern Mediterranean Sea) with emphasis on Red Sea immigrants. Biol. Invasions 2005, 7, 625–637. [Google Scholar] [CrossRef]
- Faith, D.P. Threatened species and the potential loss of phylogenetic diversity: Conservation scenarios based on estimated extinction probabilities and phylogenetic risk analysis. Conserv. Biol. 2008, 22, 1461–1470. [Google Scholar] [CrossRef]
- Meynard, C.N.; Mouillot, D.; Mouquet, N.; Douzery, E.J.P. A Phylogenetic perspective on the evolution of Mediterranean teleost fishes. PLoS ONE 2012, 7, e36443. [Google Scholar] [CrossRef] [PubMed]
- Koutsidi, M.; Moukas, C.; Tzanatos, E. Trait-based life strategies, ecological niches, and niche overlap in the nekton of the data-poor Mediterranean Sea. Ecol. Evol. 2020, 10, 7129–7144. [Google Scholar] [CrossRef] [PubMed]
- Pyšek, P.; Bacher, S.; Kühn, I.; Novoa, A.; Catford, J.A.; Hulme, P.E.; Pergl, J.; Richardson, D.M.; Wilson, J.R.U.; Blackburn, T.M. MAcroecological Framework for Invasive Aliens (MAFIA): Disentangling large-scale context dependence in biological invasions. NeoBiota 2020, 62, 407–461. [Google Scholar] [CrossRef]
- Su, G.; Mertel, A.; Brosse, S.; Calabrese, J.M. Species invasiveness and community invasibility of US freshwater fish fauna revealed via trait-based analysis. bioRxiv 2022. [Google Scholar] [CrossRef]
- Pauly, D. Gasping Fish and Panting Squids: Oxygen Temperature and the Growth of Water Breathing Animals, 2nd ed.; Excellence in Ecology Series; International Ecology Institute: Oldendorf/Luhe, Germany, 2019. [Google Scholar]
- Pauly, D. The gill-oxygen limitation theory (GOLT) and its critics. Sci. Adv. 2021, 7, eabc6050. [Google Scholar] [CrossRef]
- Berman, T.; Paldor, N.; Brenner, S. Annual SST cycle in the Eastern Mediterranean, Red Sea and Gulf of Elat. Geophys. Res. Lett. 2003, 30, 1261. [Google Scholar] [CrossRef]
- Rasul, N.M.A.; Stewart, I.C.F. The Red Sea: The Formation, Morphology, Oceanography and Environment of a Young Ocean Basin; Springer: Berlin/Heidelberg, Germany, 2015. [Google Scholar]
- Raitsos, D.E.; Hoteit, I.; Prihartato, P.K.; Chronis, T.; Triantafyllou, G.; Abualnaja, Y. Abrupt warming of the Red Sea. Geophys. Res. Lett. 2011, 38, L14601. [Google Scholar] [CrossRef]
- Cheung, W.W.; Pitcher, T.J.; Pauly, D. A fuzzy logic expert system to estimate intrinsic extinction vulnerabilities of marine fishes to fishing. Biol. Conserv. 2005, 124, 97–111. [Google Scholar] [CrossRef]
- Cheung, W.W.L.; Lam, V.W.Y.; Sarmiento, J.L.; Kearney, K.; Watson, R.; Zeller, D.; Pauly, D. Large-scale redistribution of maximum fisheries catch potential in the global ocean under climate change. Glob. Chang. Biol. 2010, 16, 24–35. [Google Scholar] [CrossRef]
- McClanahan, T.; Allison, E.H.; Cinner, J.E. Managing fisheries for human and food security. Fish Fish. 2015, 16, 78–103. [Google Scholar] [CrossRef]
- Robinson, J.P.W.; Wilson, S.K.; Robinson, J.; Gerry, C.; Lucas, J.; Assan, C.; Govinden, R.; Jennings, S.; Graham, N.A.J. Productive instability of coral reef fisheries after climate-driven regime shifts. Nat. Ecol. Evol. 2019, 3, 183–190. [Google Scholar] [CrossRef] [PubMed]
- Sala, E. The past and present topology and structure of Mediterranean subtidal rocky-shore food webs. Ecosystems 2004, 7, 333–340. [Google Scholar] [CrossRef]
- Pauly, D. A simple method for estimating the food consumption of fish population from growth data and food conversion experiments. Fish. Bull. 1986, 84, 827–840. [Google Scholar]
- Giakoumi, S. Distribution patterns of the invasive herbivore Siganus luridus (Rüppell, 1829) and its relation to native benthic communities in the central Aegean Sea, Northeastern Mediterranean. Mar. Ecol. 2014, 35, 96–105. [Google Scholar] [CrossRef]
- Stergiou, K.I. Feeding habits of the Lessepsian migrant Siganus luridus in the eastern Mediterranean Sea, its new environment. J. Fish Biol. 1988, 33, 531–543. [Google Scholar] [CrossRef]
- Arndt, E.; Givan, O.; Edelist, D.; Sonin, O.; Belmaker, J. Shifts in eastern Mediterranean fish communities: Abundance changes, trait overlap, and possible competition between native and non-native species. Fishes 2018, 3, 19. [Google Scholar] [CrossRef]
- Jackson, J.B.C.; Kirby, M.X.; Berger, W.H.; Bjorndal, K.A.; Botsford, L.W.; Bourque, B.J.; Bradbury, R.; Cooke, R.; Estes, J.A.; Hughes, T.P.; et al. Historical overfishing and the recent collapse of coastal ecosystems. Science 2001, 293, 629–637. [Google Scholar] [CrossRef]
- Christensen, V.; Guenette, S.; Heymans, J.J.; Walters, C.; Watson, R.; Zeller, D.; Pauly, D. Hundred-year decline of North Atlantic predatory fishes. Fish Fish. 2003, 4, 1–24. [Google Scholar] [CrossRef]
- Myers, R.A.; Worm, B. Rapid worldwide depletion of predatory fish communities. Nature 2003, 423, 280–283. [Google Scholar] [CrossRef]
- Pauly, D.; Christensen, V.; Guenette, S.; Pitcher, T.; Sumaila, R.; Walters, C.; Watson, R.; Zeller, D. Towards sustainability in world fisheries. Nature 2002, 418, 689–695. [Google Scholar] [CrossRef]
- Pitcher, T.J. A cover story: Fisheries may drive stocks to extinction. Rev. Fish Biol. Fish. 1998, 8, 367–370. [Google Scholar] [CrossRef]
- Coll, M.; Libralato, S.; Tudela, S.; Palomera, I.; Pranovi, F. Ecosystem overfishing in the ocean. PLoS ONE 2008, 3, e3881. [Google Scholar] [CrossRef] [PubMed]
- Lleonart, J.; Maynou, F. Fish stock assessments in the Mediterranean: State of the art. Sci. Mar. 2003, 67, 37–49. [Google Scholar] [CrossRef]
- Golani, D.; Bogorodsky, S.V. The fishes of the Red Sea-reappraisal and updated checklist. Zootaxa 2010, 2463, 1–135. [Google Scholar] [CrossRef]
- Polunin, N.V.C.; Pinnegar, J.K. Ecology of fishes in marine food-webs. In Handbook of Fish and Fisheries; Hart, P.J., Reynolds, J.D., Eds.; Blackwell: Oxford, UK, 2002; Volume 1, pp. 310–320. [Google Scholar]
- Emmerson, M.; Yearsley, J.M. Weak interactions, omnivory and emergent food-web properties. Proc. R. Soc. B Biol. Sci. 2004, 271, 397–405. [Google Scholar] [CrossRef]


Publisher’s Note: MDPI stays neutral with regard to jurisdictional claims in published maps and institutional affiliations. |
© 2022 by the authors. Licensee MDPI, Basel, Switzerland. This article is an open access article distributed under the terms and conditions of the Creative Commons Attribution (CC BY) license (https://creativecommons.org/licenses/by/4.0/).
Share and Cite
Karachle, P.K.; Oikonomou, A.; Pantazi, M.; Stergiou, K.I.; Zenetos, A. Can Biological Traits Serve as Predictors for Fishes’ Introductions, Establishment, and Interactions? The Mediterranean Sea as a Case Study. Biology 2022, 11, 1625. https://doi.org/10.3390/biology11111625
Karachle PK, Oikonomou A, Pantazi M, Stergiou KI, Zenetos A. Can Biological Traits Serve as Predictors for Fishes’ Introductions, Establishment, and Interactions? The Mediterranean Sea as a Case Study. Biology. 2022; 11(11):1625. https://doi.org/10.3390/biology11111625
Chicago/Turabian StyleKarachle, Paraskevi K., Anthi Oikonomou, Maria Pantazi, Konstantinos I. Stergiou, and Argyro Zenetos. 2022. "Can Biological Traits Serve as Predictors for Fishes’ Introductions, Establishment, and Interactions? The Mediterranean Sea as a Case Study" Biology 11, no. 11: 1625. https://doi.org/10.3390/biology11111625
APA StyleKarachle, P. K., Oikonomou, A., Pantazi, M., Stergiou, K. I., & Zenetos, A. (2022). Can Biological Traits Serve as Predictors for Fishes’ Introductions, Establishment, and Interactions? The Mediterranean Sea as a Case Study. Biology, 11(11), 1625. https://doi.org/10.3390/biology11111625