Article

BICD Cargo Adaptor 1 (BICD1) Downregulation Correlates with a Decreased Level of PD-L1 and Predicts a Favorable Prognosis in Patients with IDH1-Mutant Lower-Grade Gliomas

1
Center of General Education, Chung Hua University, Hsinchu 707, Taiwan
2
Department of Neurology, Po-Jen General Hospital, Taipei 105, Taiwan
3
Genomics Research Center, Academia Sinica, Taipei 11529, Taiwan
4
Graduate Institute of Clinical Medicine, College of Medicine, Taipei Medical University, Taipei 11031, Taiwan
5
Department of Law, School of Law, Ming Chuan University, Taipei 111, Taiwan
6
School of Oral Hygiene, College of Oral Medicine, Taipei Medical University, Taipei 11031, Taiwan
7
Cell Physiology and Molecular Image Research Center, Wan Fang Hospital, Taipei Medical University, Taipei 11696, Taiwan
*
Authors to whom correspondence should be addressed.
Biology 2021, 10(8), 701; https://doi.org/10.3390/biology10080701
Submission received: 17 June 2021 / Revised: 15 July 2021 / Accepted: 19 July 2021 / Published: 22 July 2021

Abstract

:

Simple Summary

The hypoxic inducible factor 1A (HIF1A) pathway has been known to play an important role in tumor progression in various cancers, including lower-grade (Grade II/III) gliomas (LGGs). An in silico analysis using 34 genes associated with the activity of the HIF1A pathway demonstrated that the BICD cargo adaptor 1 (BICD1) gene is a potential prognostic marker in LGGs. Moreover, BICD1 gene (BICD1) expression was positively correlated with CD274, GSK3B, HGF, and STAT3 expression in LGGs. Importantly, BICD1 downregulation was significantly associated with well-known favorable prognostic markers, such as a higher Karnofsky performance score (KPS), IDH1/TP53/ATRX mutations, wild-type EGFR and younger patient age, in LGGs. Therefore, our findings present BICD1 as a new prognostic biomarker to more precisely predict the clinical outcomes of LGG patients in coordination with those well-known biomarkers.

Abstract

Although several biomarkers have been identified to predict the prognosis of lower-grade (Grade II/III) gliomas (LGGs), we still need to identify new markers to facilitate those well-known markers to obtain more accurate prognosis prediction in LGGs. Bioinformatics data from The Cancer Genome Atlas (TCGA), the Chinese Glioma Genome Atlas (CGGA), and the Cancer Cell Line Encyclopedia (CCLE) datasets were used as the research materials. In total, 34 genes associated with the HIF1A pathway were analyzed using the hierarchical method to search for the most compatible gene. The BICD cargo adaptor 1 (BICD1) gene (BICD1) was shown to be significantly correlated with The hypoxic inducible factor 1A (HIF1A) expression, the World Health Organization (WHO) grade, and IDH1 mutation status. In addition, BICD1 downregulation was significantly correlated with a higher Karnofsky performance score (KPS), IDH1/TP53/ATRX mutations, wild-type EGFR, and younger patient age in the enrolled LGG cohort. Moreover, BICD1 expression was significantly upregulated in wild-type IDH1 LGGs with EGFR mutations. Kaplan–Meier survival analysis revealed that BICD1 downregulation predicts a favorable overall survival (OS) in LGG patients, especially in those with IDH1 mutations. Intriguingly, we found a significant correlation between BICD1 downregulation and a decreased level of CD274, GSK3B, HGF, or STAT3 in LGGs. Our findings suggest that BICD1 downregulation could be a potential biomarker for a favorable prognosis of LGGs.

1. Introduction

Lower-grade gliomas (LGGs), defined by the World Health Organization (WHO) as grades II and III gliomas, include oligodendrogliomas and astrocytomas [1]. There is a wide range of the 5-year survival rate in LGG patients because the clinical behaviors of LGGs are highly variable [2]. Stratification of LGGs into more clinically distinct subgroups may help clinicians more accurately predict patients’ prognosis. In the past, the WHO grade, histological type of tumor, and patient age were used to classify LGG patients and predict their prognosis [3]. However, the WHO histopathological classification still remains unsatisfactory and limited because of the inter-observer variability and low objectivity in reading the histopathological data of LGG samples [4].
To overcome this limitation, several well-known molecular markers, including chromosome 1p19q codeletions, and mutations in IDH1, TP53, ATRX, CIC, and FUBP1, and the promoter of TERT have been reported for diagnosis and classification of LGGs [5,6,7]. Therefore, the 2016 WHO classification of tumors of the CNS system incorporated those molecular parameters with classical histopathological subtypes of LGGs to make a new guideline for the classification of LGGs [8]. Although the IDH1 mutation status and 1p19q codeleted status are the most well-known biomarkers of LGGs and have been validated as powerful and useful prognosis indicators for LGG patients, there is still a wide range of clinical outcomes even in patients who have the same IDH1 or 1p19q codeleted status [9,10]. Hence, we aimed to search for a new molecular marker that can facilitate IDH1 status to classify LGGs into further clinically distinct subgroups, which may provide more accurate prognosis prediction for LGG patients.
Hypoxia has already been shown to correlate with poor prognosis and can be used to predict survival and response to therapy in multiple cancer models [11]. Several studies have demonstrated that hypoxia inducible factor 1A (HIF1A) and its downstream genes (e.g., GLUT1, VEGF, CA9) are also poor prognostic markers for various cancers [12]. In order to detect hypoxic conditions in cancer tissue, most previous studies focused on targeting HIF1A. However, measurement of the HIF1A protein is somehow difficult due to its instability under normoxic conditions. Immunohistochemistry (IHC) is currently used to measure the protein level of HIF1A in a hypoxic cancer tissue, but it needs invasive biopsy of the patient’s tumor and lacks reproducibility and consistency due to inter-observer variability. In addition, biopsy samples obtained from different sites of the primary tumor would might have different hypoxic conditions. All of these would limit the clinical application of targeting the HIF1A protein for predicting the prognosis of cancer patients.
Gene sequencing could be an affordable and reliable approach to get prognostic information from patients’ tumor samples. However, the gene expression of HIF1A did not show prognostic significance in the Cancer Genome Atlas (TCGA) LGG cohort (Supplementary Figure S1). Therefore, we searched for genes associated with the HIF1A pathway as research materials for this study. We selected 34 genes, which were reported to be associated with the HIF1A pathway [13,14,15], as candidate genes for further analyses (Supplementary Table S1). These genes will be screened according to the criteria we proposed for this study: significantly and positively correlated with HIF1A expression (upregulation), the WHO grade (grade III), and IDH1 mutation status (wild-type). The gene most compatible with our criteria will be selected as the putative marker for further correlation and survival analyses, and its prognostic significance and correlations with the clinicopathological features and important markers of LGGs will be validated in LGG patients in the Chinese Glioma Genome Atlas (CGGA) dataset and in LGG cell lines in the Cancer Cell Line Encyclopedia (CCLE) dataset.

2. Materials and Methods

2.1. Clinicopathological Data and Gene Expression Profiles of Patients with LGGs from the TCGA Database

The clinicopathological data of patients in the TCGA LGG cohort were downloaded from the TCGA Portal (http://xena.ucsc.edu/welcome-to-ucsc-xena/, accessed on 1 February 2021). Patients’ clinicopathological information, including gender, age at initial diagnosis, the Karnofsky performance score, the WHO grade, histological subtypes, the overall survival time, and survival status, were collected from the aforementioned website.
Gene sequencing data, including the gene expression levels (detected by gene expression RNAseq (IlluminaHiSeq, San Diego, CA, USA), mutation status of specific genes (detected by somatic mutation (SNP and INDEL)), and copy number variation in specific chromosomes (detected by copy number segments), were also downloaded from the above TCGA Portal.

2.2. Clinicopathological Data and Gene Expression Profiles of Patients with LGGs from the CGGA Database

LGG patients in the CGGA dataset (n = 420) were used as a validation cohort. The clinicopathological information and gene sequencing data, including the WHO histological grade, the overall survival time, survival status, IDH1 mutation status, chromosome 1p19q codeleted status, and the expression levels of specific genes, were downloaded from the CGGA website (http://www.cgga.org.cn/).

2.3. Gene Sequencing Data of LGG Cell Lines in the CCLE Dataset from the TCGA Database

The TCGA website (http://xena.ucsc.edu/welcome-to-ucsc-xena/, accessed on 1 February 2021) also provided the gene sequencing data of glioma cell lines, including LGGs and glioblastomas, in the CCLE dataset. All the cell lines we used in this manuscript were rechecked in the website of Cancer Model Passport (https://cellmodelpassports.sanger.ac.uk/) to ensure all of them are LGG cell lines. The expression levels of BICD1 and CD274 (PD-L1) (detected by gene expression RNAseq) in the eight LGG cell lines in the CCLE dataset were downloaded from the above TCGA Portal.

2.4. Subgroups of Patients with LGGs for Further Analyses

LGG patients in the TCGA LGG cohort (n = 508) and in the CGGA dataset (n = 420) were stratified into subgroups for correlation and survival analyses.
For correlation analyses, patients were stratified into two subgroups according to their clinicopathological features, including age (>40 vs. ≤40), gender (male vs. female), the WHO grade (grade III vs. grade II), histological subtypes (astrocytoma vs. others), the mutation status (mutant vs. wild-type) of specific genes (including IDH1, TP53, ATRX and EGFR), chromosome 1p19q codeleted status (codeleted vs. others), the Karnofsky performance score (≤80 vs. >80), and the expression levels of BICD1 (50% high vs. 50% low). For the age factor, the age of 40 was determined as the cutoff value, by which patients were stratified into two approximately equal groups, the younger (age≤40, n = 249, 49%) and the older (age>40, n = 259, 51%).
For survival analyses, patients were stratified into two subgroups by their clinicopathological features, the mutation status of specific genes (including IDH1, EGFR) and the expression levels of BICD1 (50% high vs. 50% low, 33.1% high vs. 66.9% low, 20.1% high vs. 79.9% low, and 10.0% high vs. 90.0% low, respectively).

2.5. Statistical Analysis

All statistical analyses were performed with the use of SPSS version 20.0 software (SPSS, Chicago, IL, US). The scatter pictures and dot plots were drawn with the use of Prism 5 software (GraphPad software Inc., San Diego, CA, US). A t test was used to analyze the differences in gene expression levels between different subgroups of LGG patients. Correlations between downregulation of BICD1 and the clinicopathological features of LGG patients were analyzed by Pearson’s Chi-square test. The overall survival time and 5-year survival rate of patients in different LGG subgroups were calculated using the Kaplan–Meier method, and the difference in the overall survival between subgroups of patients were compared by the log-rank test. The survival curves of patients in different LGG subgroups were drawn with the use of SPSS software. To identify the factor which had a significant and independent impact on patients’ overall survival, BICD1 downregulation and the clinicopathological features of LGGs, which were potentially related to patients’ survival, were compared by univariate and multivariate analyses with the Cox proportional hazard model. For all analyses, a p value of <0.05 was considered statistically significant.

3. Results

3.1. Identification of 12 Genes from HIF1A-Associated Pathways as Candidate Markers of LGGs

In total, 34 genes reported to be associated with the hypoxia inducible factor 1A (HIF1A) pathway (Supplementary Table S1) were analyzed and ranked according to the criteria we proposed for this study: significantly and positively correlated with HIF1A expression (upregulation), the WHO grade (grade III), and IDH1 mutation status (wild-type). The expression heatmaps of genes associated with the HIF1A pathway were constructed according to the gene sequencing data obtained from the TCGA LGG cohort (n = 508). There were 18 genes whose expression levels were significantly and positively correlated with HIF1A upregulation (Figure 1A). There were 26 genes whose expression levels were significantly and positively correlated with a higher WHO grade (grade III) (Figure 1B), and there were 28 genes whose expression levels were significantly and positively correlated with IDH1 status (wild-type) (Figure 1C). The hierarchical method revealed a total of 12 genes, i.e., FN1, CD274 (programmed death-ligand 1, PD-L1), CXCR4, BICD1, IGFBP3, DDIT4, VEGFA, PDCD1 (programmed cell death-1, PD-1), TGFB1, TGFB3, VIM, and HGF, compatible with our criteria (Figure 1D). The 12 genes were selected as candidate markers for further analyses.

3.2. BICD1 Gene Severs as a Potential Prognostic Marker of LGGs

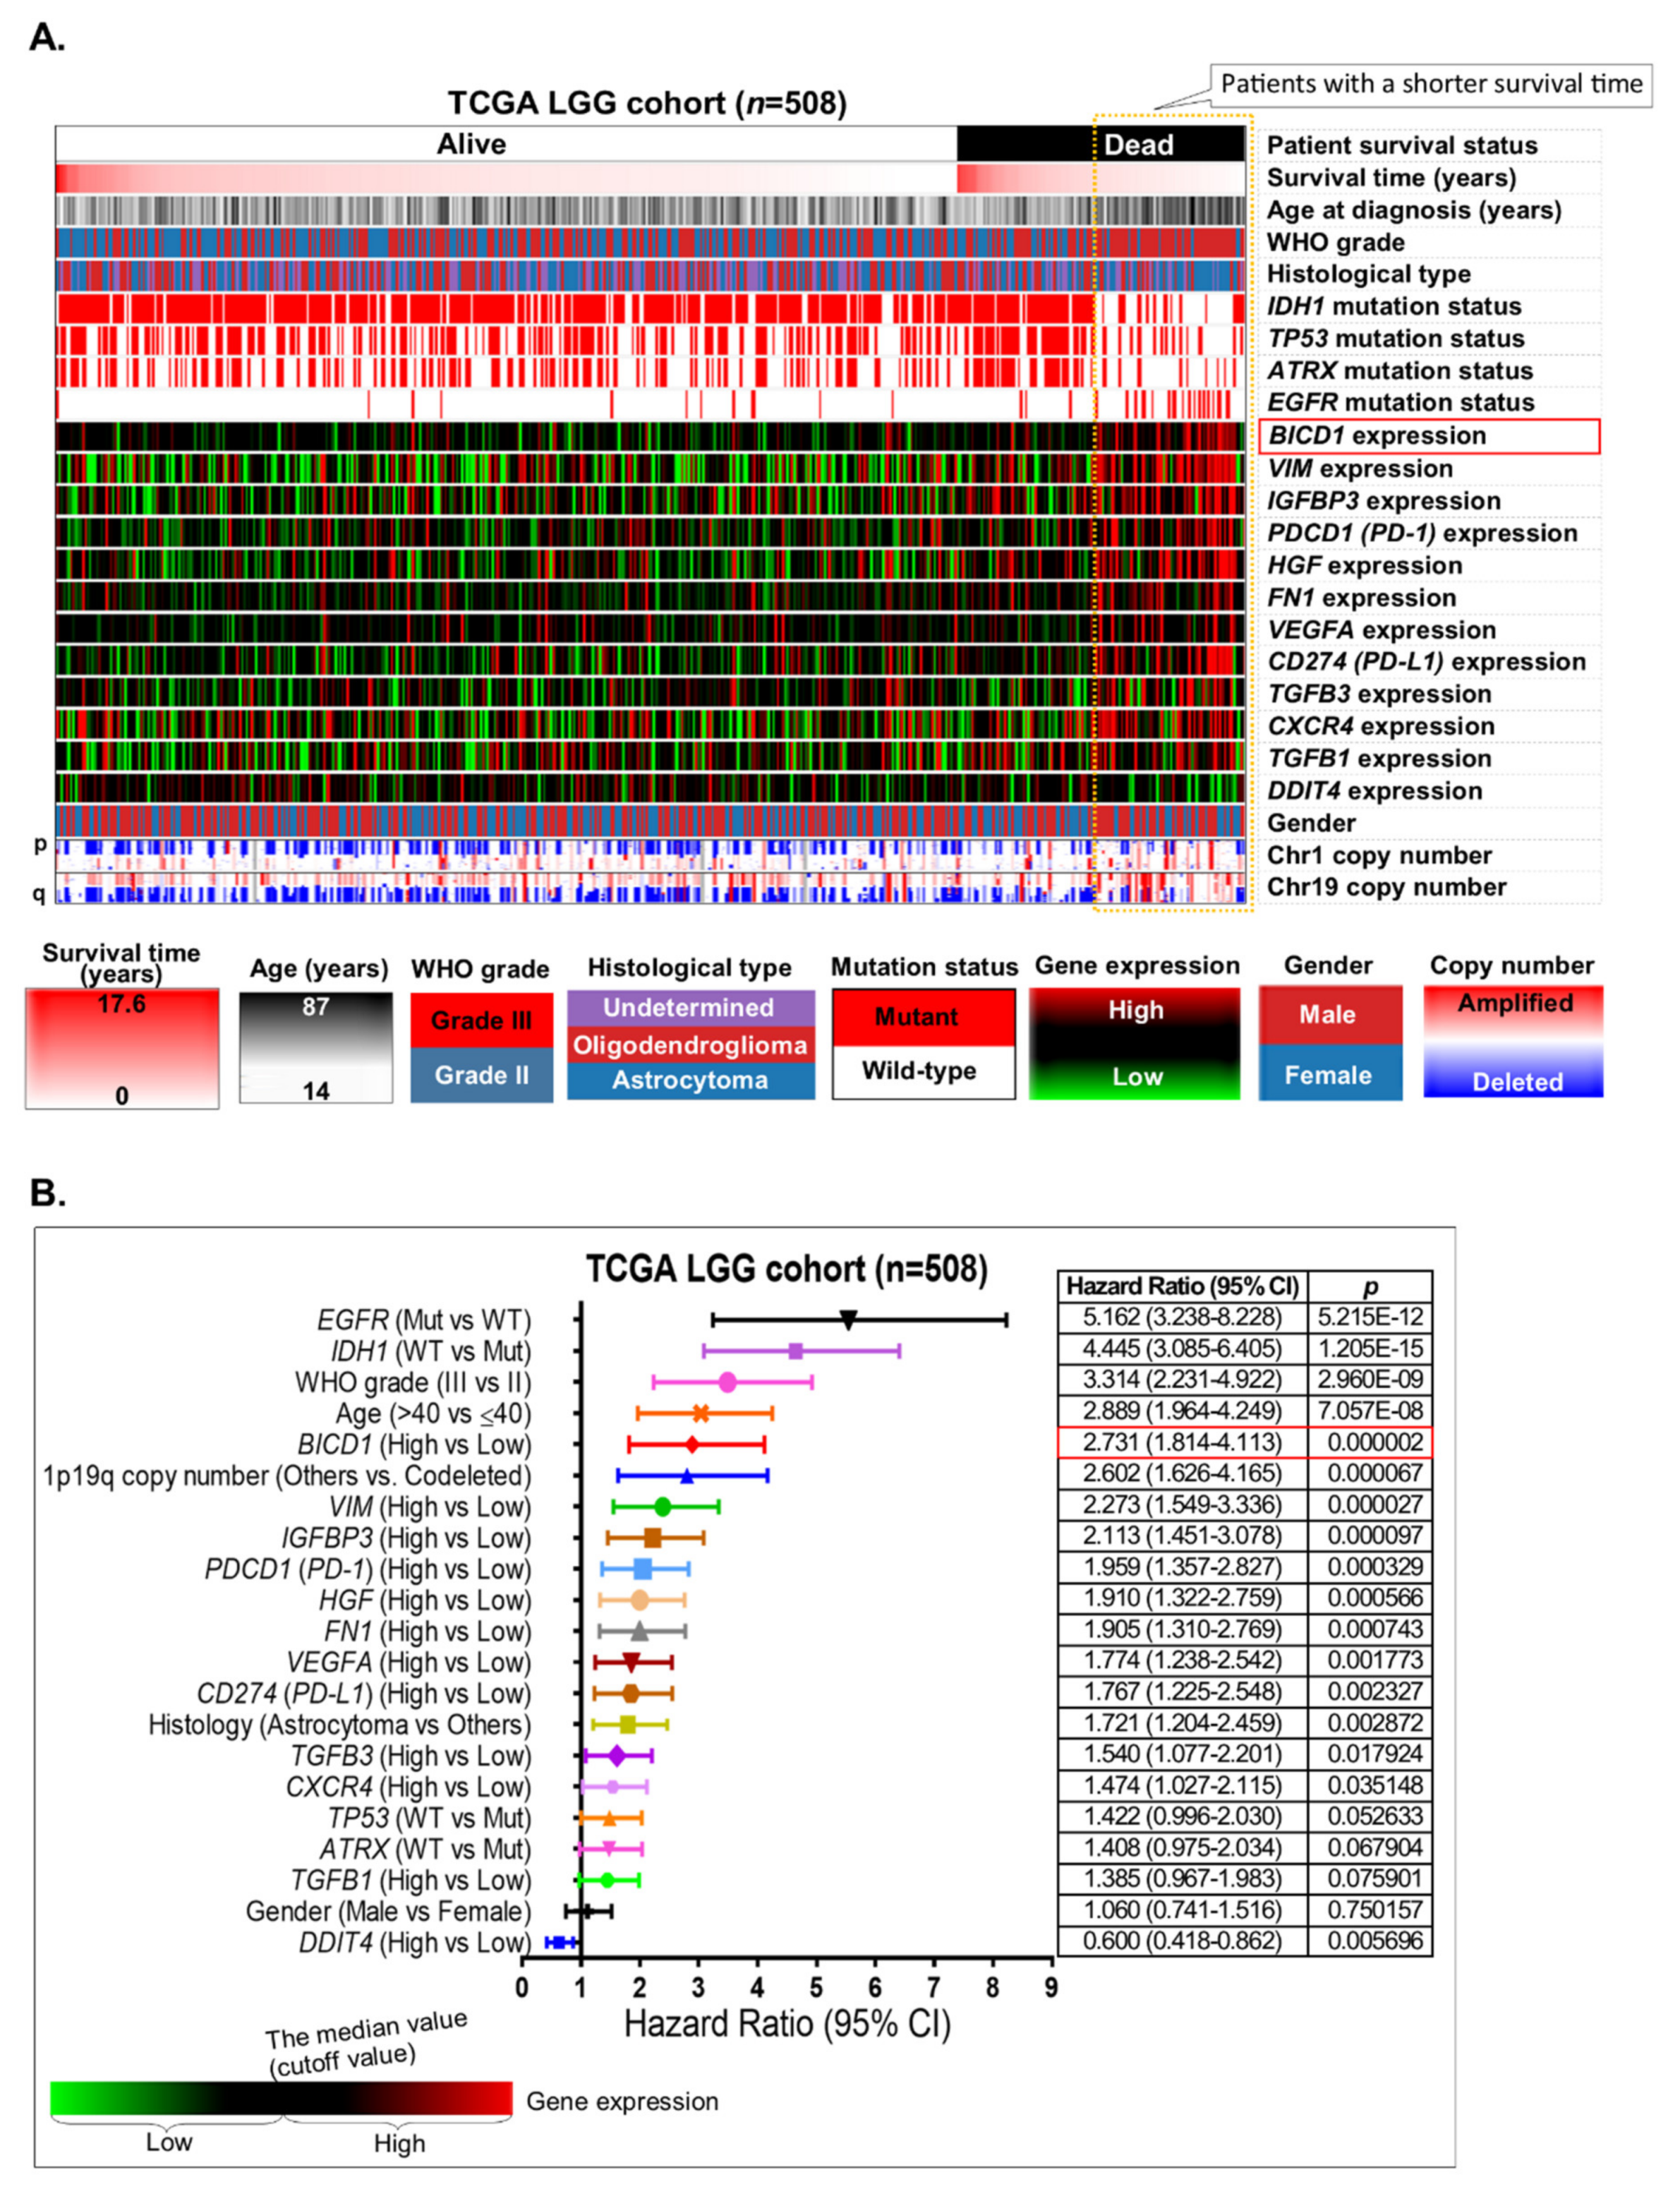
Based on the heatmap analysis, the 12 candidate markers compatible with our criteria were compared with the clinicopathological features and several important molecular markers of LGGs for evaluating their prognostic significance in LGGs (Figure 2A). In patients with dead status in the TCGA LGG cohort, there were apparent correlations of a shorter survival time (whose survival time is less than the median value of the survival time in all LGG patients) with an older patient age, a higher WHO grade (grade III), the astrocytoma subtype of LGGs, wild-type IDH1/TP53/ATRX, mutations in EGFR, upregulation of BICD1, VIM, IGFBP3, PDCD1 (PD-1), HGF, FN1, VEGFA, CD274 (PD-L1), TGFB3, CXCR4 and TGFB1, downregulation of DDIT4, and chromosome 1p19q codeletions.
Based on the Cox regression analysis, the 12 candidate markers, as well as the clinicopathological features of patients in the TCGA LGG cohort, were ranked according to their hazard ratio (HR) (Figure 2B). Undoubtedly, those well-known poor prognostic markers of LGGs, including EGFR status (mutant vs. wild-type, HR = 5.162), IDH1 status (wild-type vs. mutant, HR = 4.445), the WHO grade (grade III vs. grade II, HR = 3.314) and patient age (>40 vs. ≤40, HR = 2.889), showed the highest HRs. The expression of BICD1 gene (BICD1, High vs. Low) also demonstrated the highest HR (2.731) among the 12 candidate genes. 1p19q codeleted status (Others vs. Codeleted) also presented a high HR (2.602). However, its HR was not as high as that of BICD1 expression and other well-known markers of LGGs (Figure 2B). Therefore, the BICD1 gene was chosen as the putative marker of LGGs for further correlation and survival analyses in this study.

3.3. BICD1 Downregulation Correlates with Benign Clinicopathological Features of LGG Patients

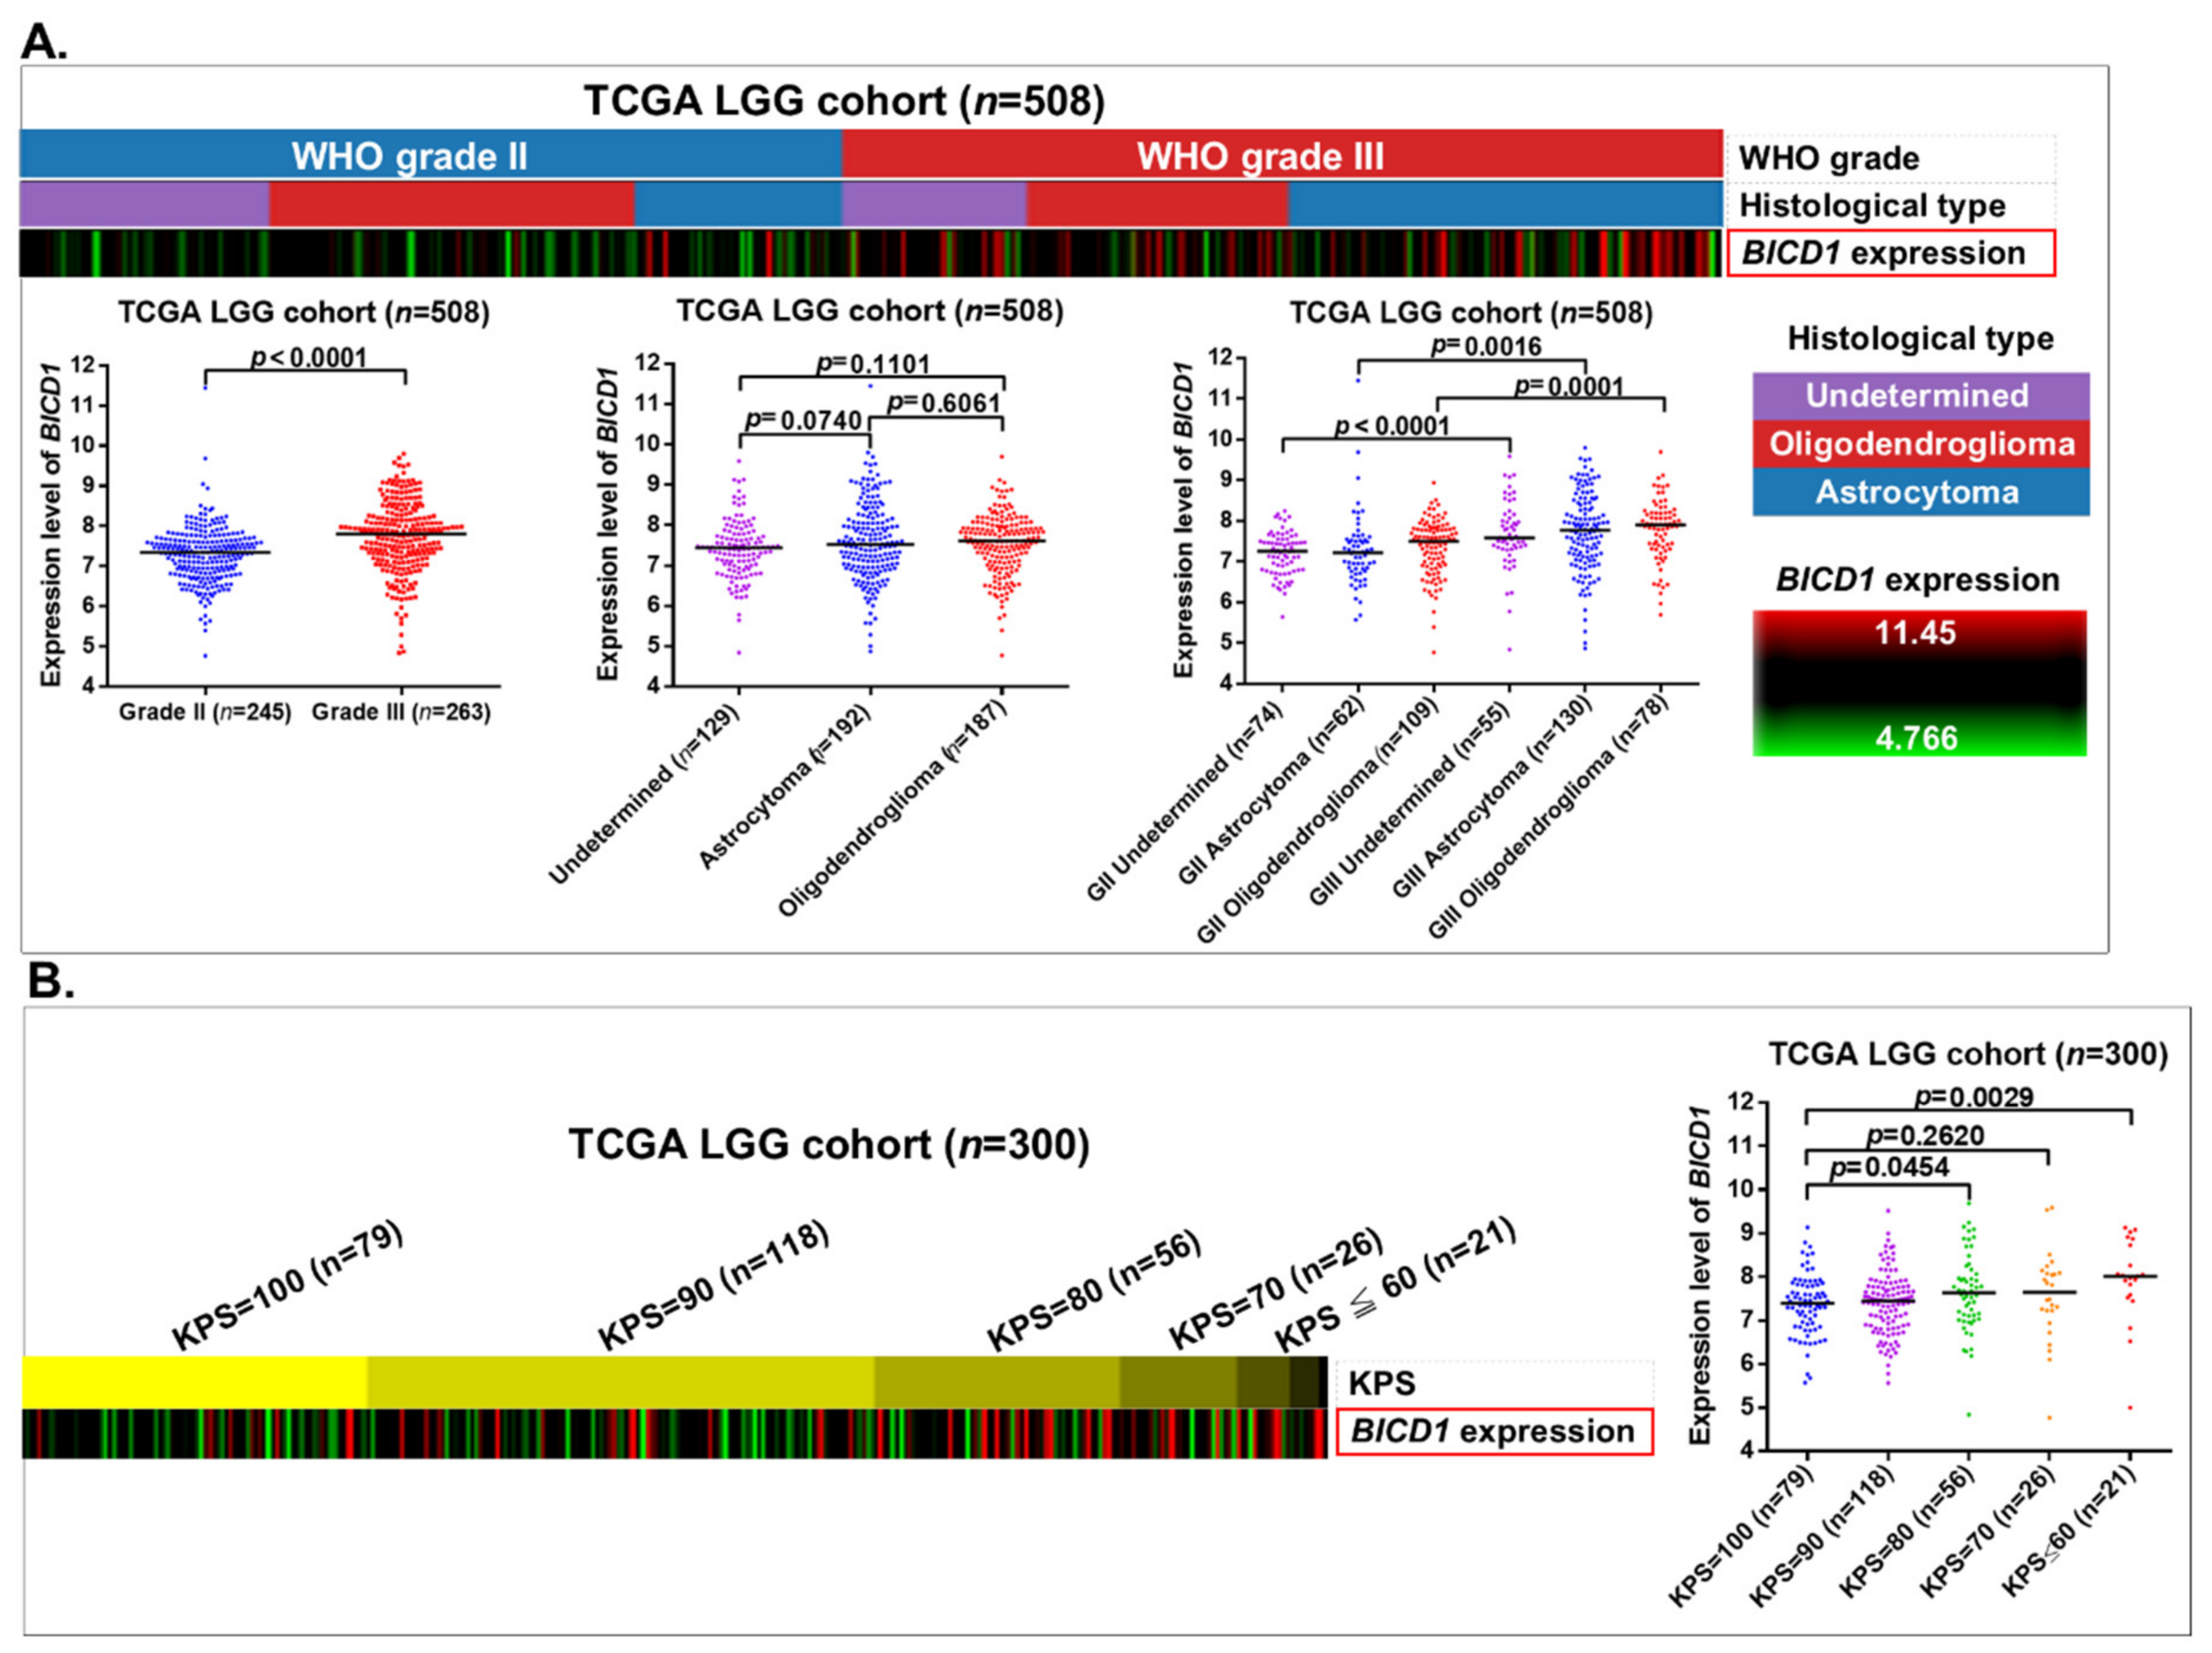
In this study, we demonstrated that downregulation of BICD1 was significantly correlated with a couple of benign clinicopathological features of patients in the TCGA LGG cohort (Supplementary Table S2). The heatmap revealed that downregulation of the BICD1 gene was more enriched in grade II gliomas than in grade III gliomas, and the t-test analysis revealed that the expression levels of BICD1 were significantly lower in grade II gliomas than in grade III gliomas. However, in the histological subtypes of LGGs, including oligodendroglioma and astrocytoma, BICD1 was not differentially expressed (Figure 3A).
The Karnofsky Performance Score (KPS) is used for evaluating a patient’s clinical performance. In the TCGA LGG cohort (n = 300), the heatmap revealed that downregulation of BICD1 was enriched in patients with their KPS ≥ 90, and in the t-test analysis, the expression levels of BICD1 were significantly lower in patients with KPS = 100 than in those with KPS = 80 (p = 0.0454) or KPS ≤ 60 (p = 0.0029) (Figure 3B). The correlations between the KPS and the clinicopathological features of patients in the TCGA LGG cohort (n = 300) were analyzed. IDH1 mutations, wild-type EGFR, and downregulation of BICD1 showed significant correlations with a higher KPS (≥90) of LGG patients (Supplementary Table S3).
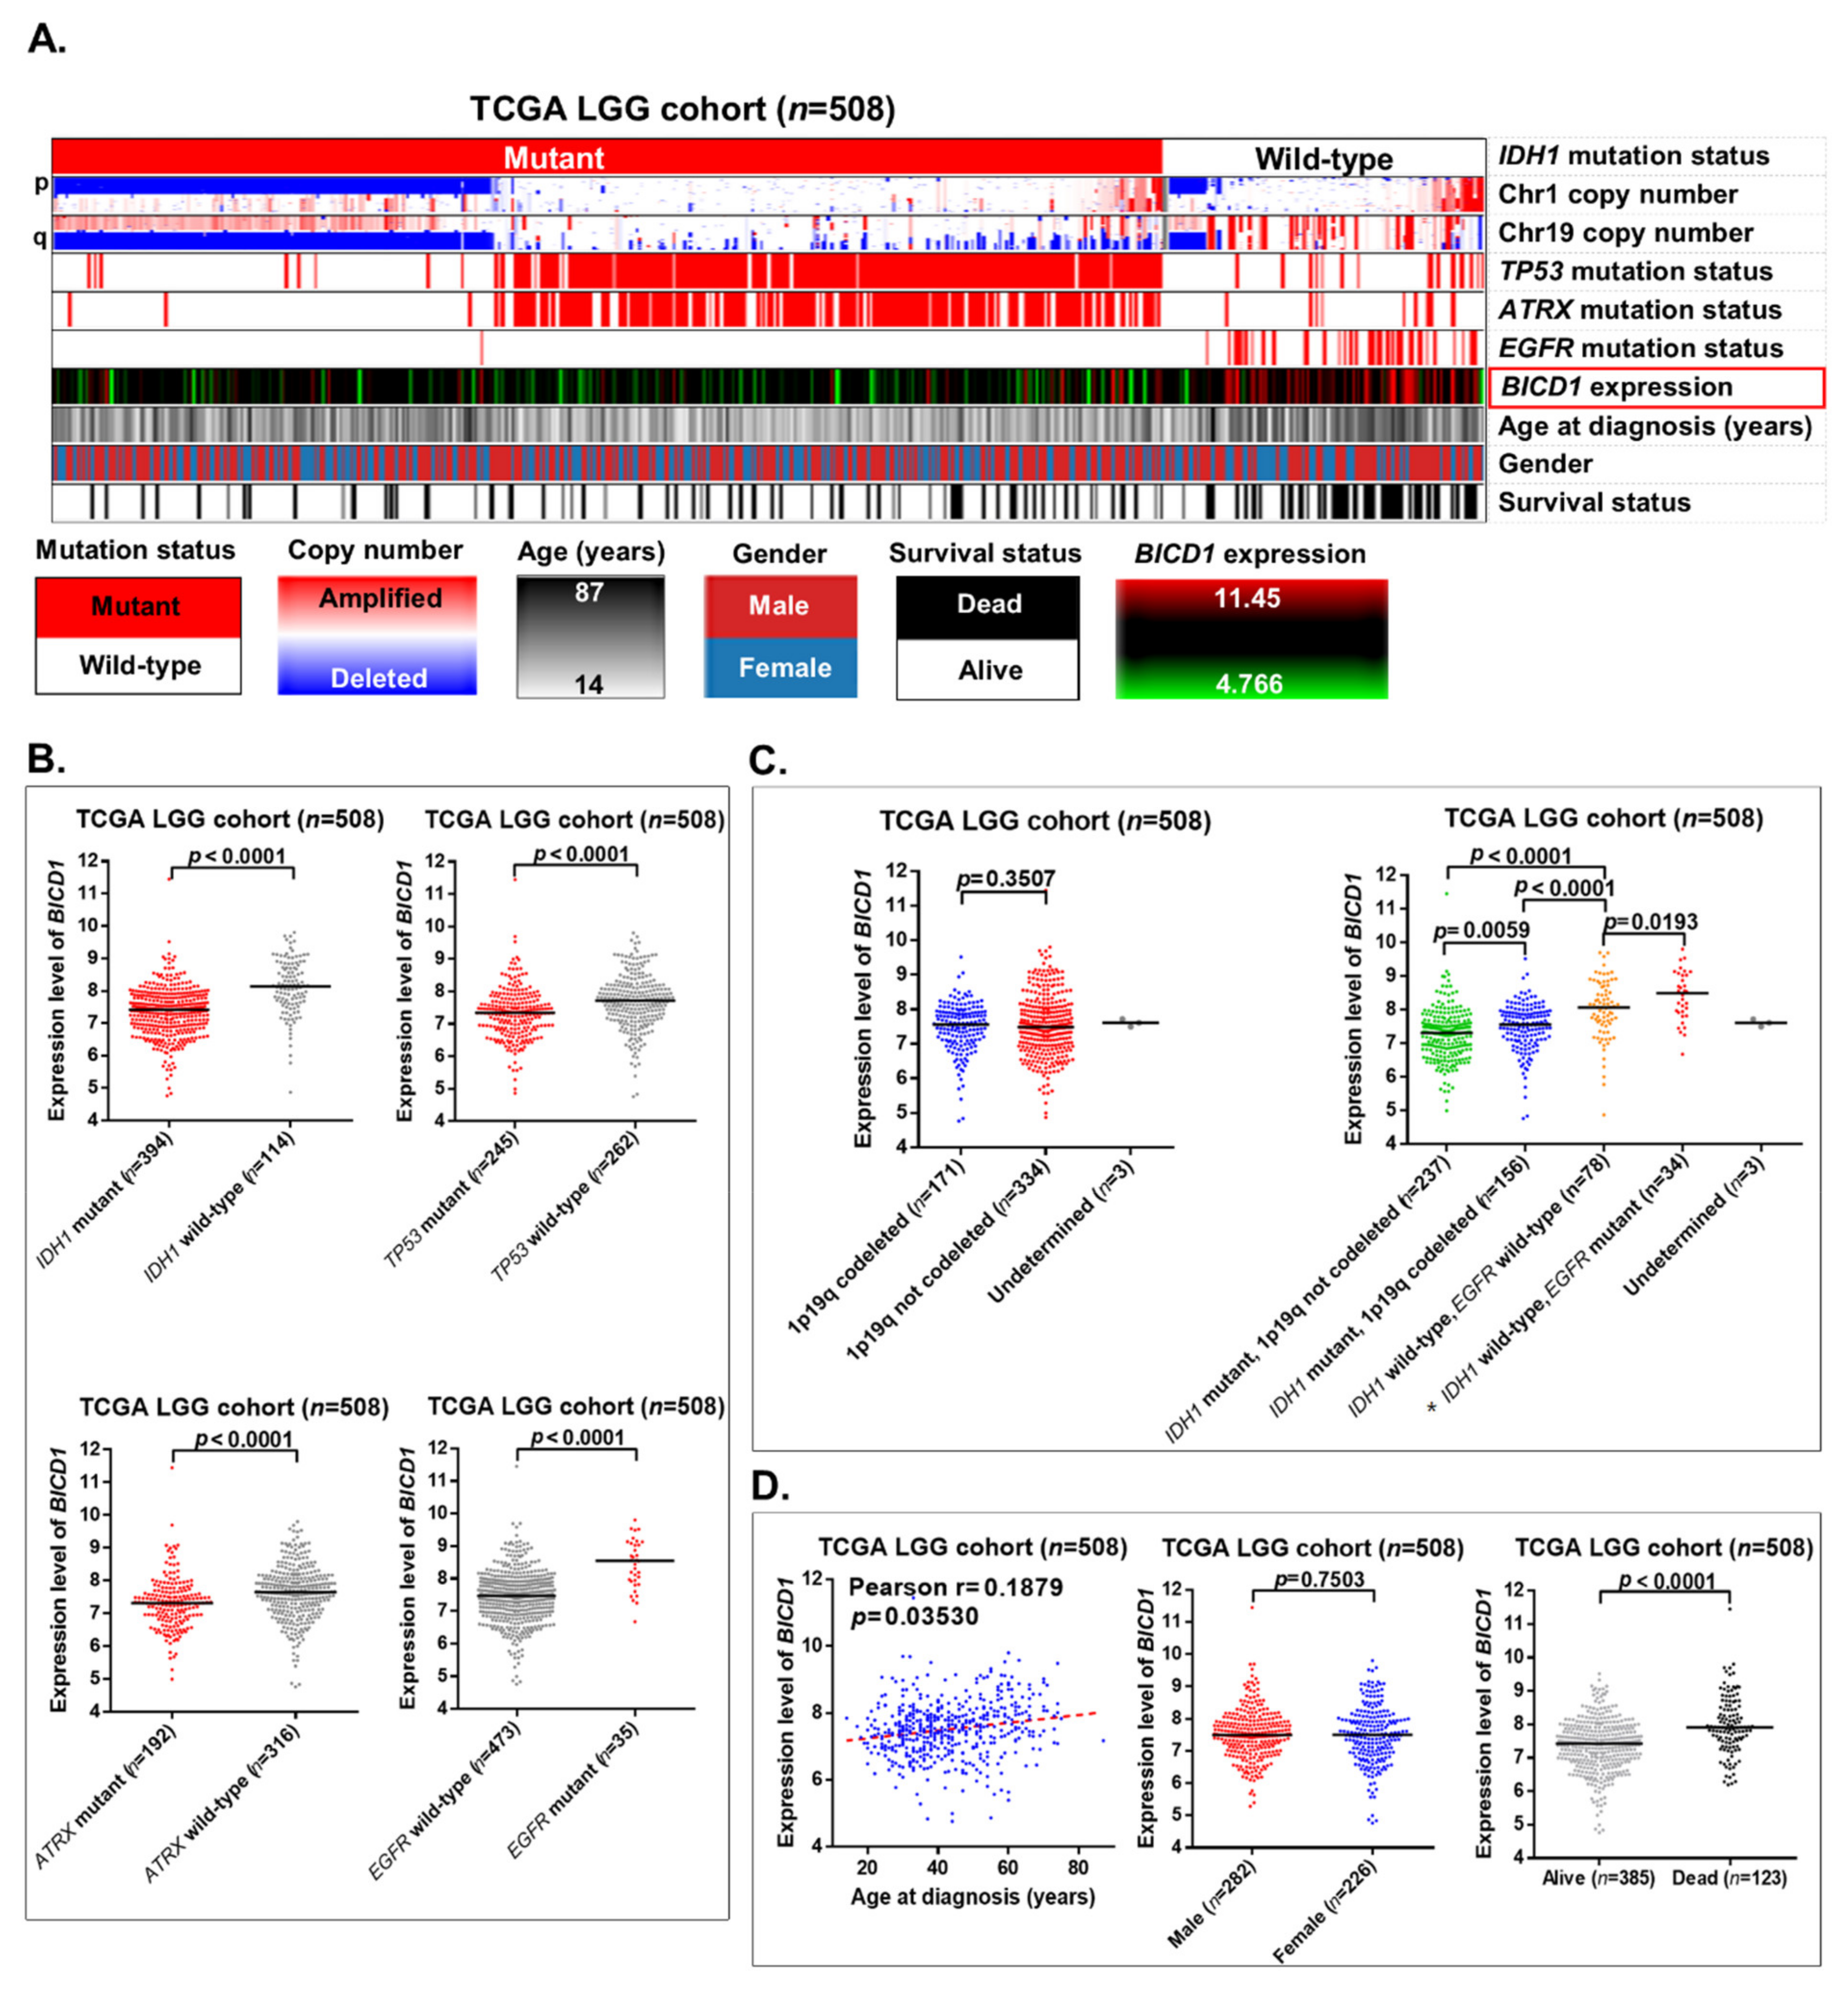
IDH1 mutation status and chromosome 1p19q codeleted status are important markers for the classification of LGGs. In the TCGA LGG cohort (n = 508), the heatmap revealed that upregulation of BICD1 was enriched in wild-type IDH1 LGGs without 1p19q codeletions, which also had profound EGFR mutations and dead status of patients. Interestingly, mutations in TP53 and ATRX were enriched in LGGs without 1p19q codeletions, especially in those with IDH1 mutations (Figure 4A). In t-test analyses, the expression levels of BICD1 were significantly lower in LGGs with mutant IDH1, TP53, or ATRX. Its expression levels were also significantly higher in LGGs with EGFR mutations (Figure 4B).
The expression levels of BICD1 were not significantly correlated with 1p19q codeleted status in LGGs. When LGGs were stratified into four subgroups depending on their IDH1 status, 1p19q codeleted status and EGFR status, BICD1 was differentially expressed within the four subgroups, and its expression levels were highest in the subgroup of LGGs with wild-type IDH1 and mutant EGFR, which could be considered to be glioblastoma (grade IV glioma), rather than LGGs (grade II and III gliomas) according to the 2016 WHO classification of CNS tumors (Figure 4C). In addition, the expression levels of BICD1 were significantly and positively correlated with patient age and were significantly lower in LGG patients with alive status. However, its expression levels were not significantly distinct between males and females (Figure 4D).

3.4. BICD1 Downregulation in Coordination with IDH1 or EGFR Status Effectively Predicts a Faborable Overall Survival of LGG Patients

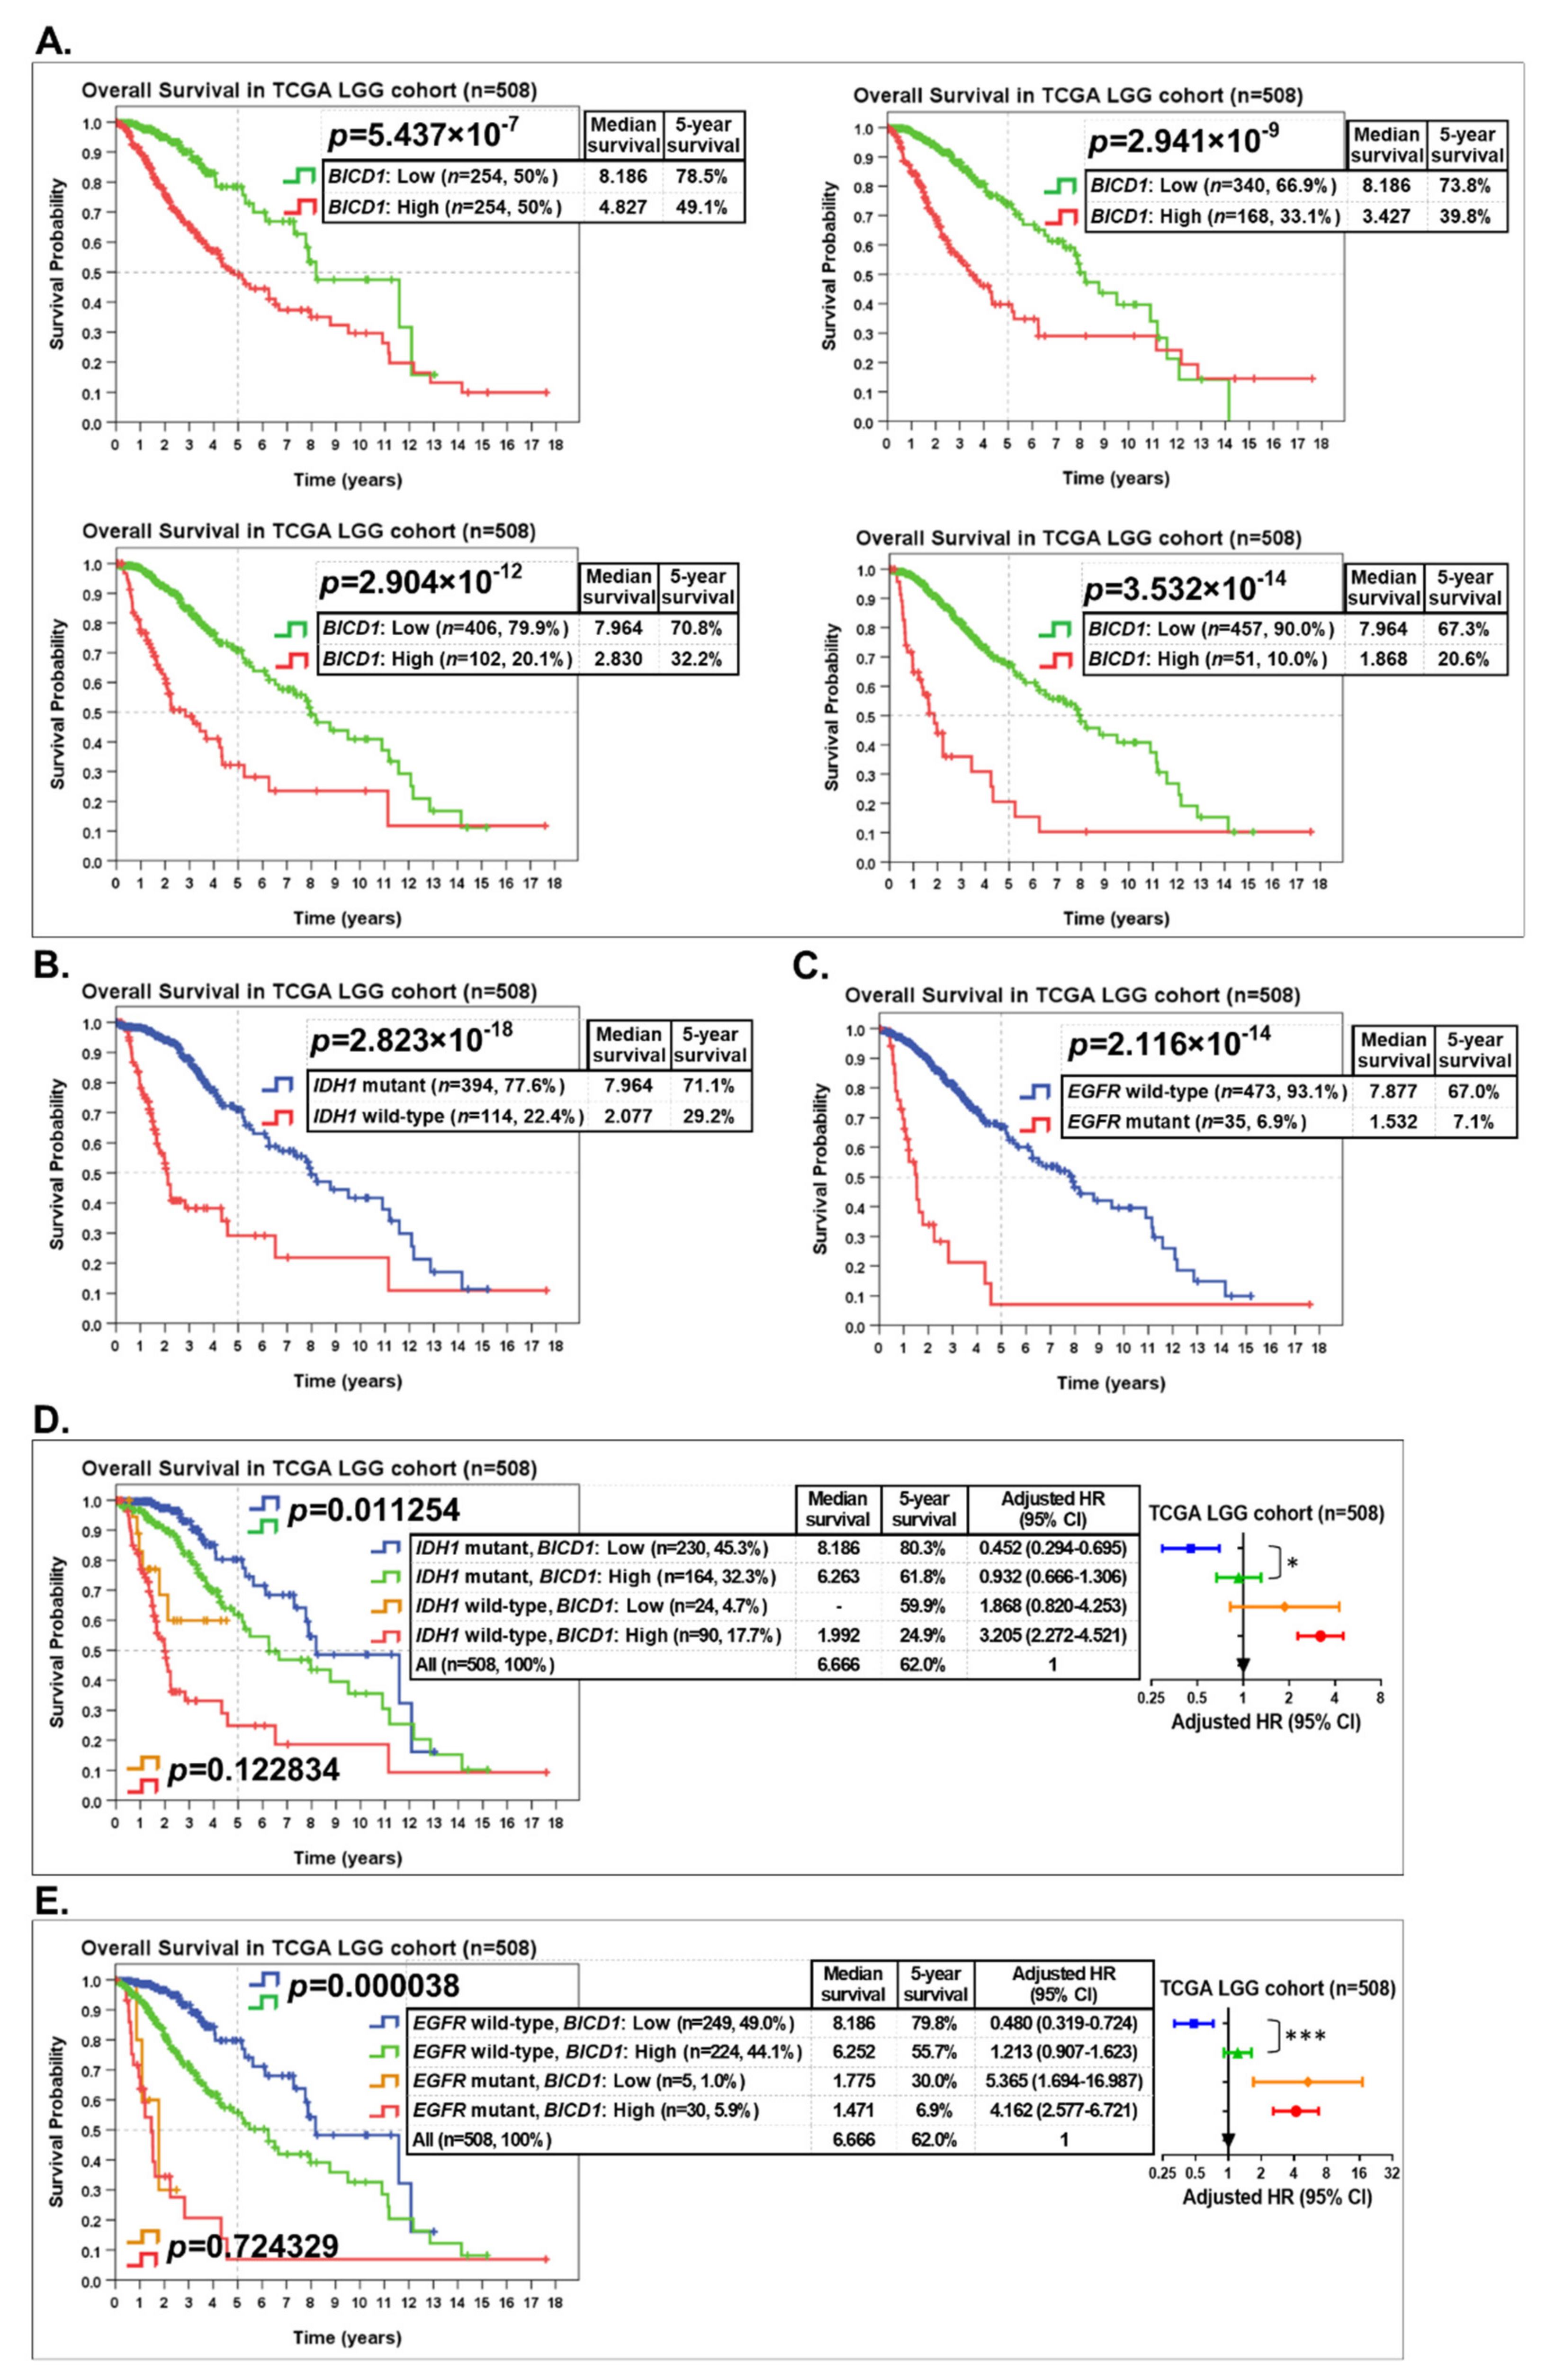
To evaluate the prognostic significance of BICD1, patients in the TCGA LGG cohort (n = 508) were stratified into two groups according to their BICD1 expression for Kaplan–Meier survival analyses (Figure 5A). When LGG patients were stratified by their BICD1 expression (50% high, n = 254 vs. 50% low, n = 254), those with upregulation of BICD1 had a significantly worse overall survival (OS) (median survival: 4.827 years, 5-year survival: 49.1%) (p = 5.437 × 10⁻⁷). When patients were stratified by their BICD1 expression (33.1% high, n = 168 vs. 66.9% low, n = 340), those with upregulation of BICD1 had a more significantly worse OS (median survival: 3.427 years, 5-year survival: 39.8%) (p = 2.941 × 10⁻⁹). When patients were stratified by their BICD1 expression (20.1% high, n = 102 vs. 79.9% low, n = 406), those with upregulation of BICD1 had a further significantly worse OS (median survival: 2.830 years, 5-year survival: 32.2%) (p = 2.904 × 10⁻¹²). When patients were stratified by their BICD1 expression (10% high, n = 51 vs. 90% low, n = 457), the difference in the OS between the two groups of LGGs had the highest significance (p = 3.532 × 10⁻¹⁴), and those with upregulation of BICD1 had the worst OS (median survival: 1.868 years, 5-year survival: 20.6%) (Figure 5A). Our analyses confirmed that upregulation of BICD1 had a significant impact on the worsening of OS of LGG patients, and downregulation of BICD1 had a significant impact on a favorable outcome of LGG patients, and those with the highest expression of BICD1 had the worst prognosis (the shortest survival time and the lowest 5-year survival rate).
Consistent with previous studies that the IDH1 mutation is a favorable prognostic marker for LGGs, LGG patients with IDH1 mutations (n = 394) had a significantly better OS (median survival: 7.964 years, 5-year survival: 71.1%) than those with wild-type IDH1 (n = 114) (median survival: 2.077 years, 5-year survival: 29.2%) (Figure 5B), which had the highest statistical significance (p = 2.823 × 10⁻¹⁸) compared with other well-known markers (Figure 2B). Conversely, LGG patients with EGFR mutations (n = 35) had a worse OS (median survival: 1.532 years, 5-year survival: 7.1%) than those with wild-type EGFR (n = 473) (median survival: 7.877 years, 5-year survival: 67.0%), which also had a high statistical significance (p = 2.116 × 10⁻¹⁴) (Figure 5C). EGFR status (mutant vs. wild-type) also had the highest impact (HR = 5.162) on a worse OS of LGG patients (Figure 2B).
To improve the prognostic accuracy of the IDH1 and EGFR mutation status, we incorporated BICD1 expression with these well-known markers to stratify LGG patients into more distinct subgroups for further survival analysis. Patients in the TCGA LGG cohort (n = 508) were stratified into four subgroups according to their IDH1 status and BICD1 expression (Figure 5D). In LGG patients with IDH1 mutations (n = 394, 77.6%), those with downregulation of BICD1 (n = 230, 45.3%) (median survival: 8.186 years, 5-year survival: 80.3%, adjusted HR = 0.452) had a significantly better OS than those with upregulation of BICD1 (n = 164, 32.3%) (median survival: 6.263 years, 5-year survival: 61.8%, adjusted HR = 0.932) (p = 0.011254). In LGG patients with wild-type IDH1 (n = 114, 22.4%), although the difference was not statically significant in the OS between the two subgroups stratified by BICD1 expression (p = 0.122834), patients with downregulation of BICD1 (n = 24, 4.7%) (5-year survival: 59.9%, adjusted HR = 1.868) still had a better OS than those with upregulation of BICD1 (n = 90, 17.7%) (median survival: 1.992 years, 5-year survival: 24.9%, adjusted HR = 3.205) (Figure 5D). More importantly, LGG patients with IDH1 mutations and downregulation of BICD1 had a better OS (median survival: 8.186 years, 5-year survival: 80.3%, Figure 5D) than those with only IDH1 mutations (median survival: 7.964 years, 5-year survival: 71.1%, Figure 5B). Our results highlighted that incorporating BICD1 expression with IDH1 mutation status improved the prognostic accuracy of IDH1 status when it served as a prognostic marker of LGGs.
LGG patients were stratified into four subgroups according to their EGFR status and BICD1 expression. In patients with wild-type EGFR (n = 473, 93.1%), those with downregulation of BICD1 (n = 249, 49.0%) (median survival: 8.186 years, 5-year survival: 79.8%, adjusted HR = 0.480) had a significantly better OS than those with upregulation of BICD1 (n = 224, 44.1%) (median survival: 6.252 years, 5-year survival: 55.7%, adjusted HR = 1.213) (p = 0.000038) (Figure 5E). Incorporating BICD1 expression successfully stratified LGG patients with wild-type EGFR into two subgroups with a statistically significant difference in their OS, and LGG patients with wild-type EGFR and downregulation of BICD1 had a better OS (median survival: 8.186 years, 5-year survival: 79.8%, Figure 5E) than those only with wild-type EGFR (median survival: 7.877 years, 5-year survival: 67.0%, Figure 5C).
Our findings confirmed that BICD1 expression is a useful marker for incorporation with IDH1 or EGFR mutation status to stratify LGG patients into more clinically distinct subgroups and to obtain more accurate prognostic information.

3.5. BICD1 Expression Is an Independent Prognostic Factor in Patients with LGGs

In univariate Cox’s regression analyses, EGFR status (HR = 5.062, p = 5.215 × 10⁻¹²), IDH1 status (HR = 4.445, p = 1.205 × 10⁻¹⁵), the WHO grade (HR = 3.314, p = 2.960 × 10⁻⁹), and patient age (HR = 2.889, p = 7.057 × 10⁻⁸) showed a stronger impact than BICD1 expression (HR = 2.731, p = 0.000002) on the OS of LGG patients (Supplementary Table S4). In multivariate Cox’s regression analyses, BICD1 expression was confirmed as an independent prognostic marker for indicating the OS of LGG patients (HR = 1.896, p = 0.004547) (Supplementary Table S5).
In univariate Cox’s regression analyses, the prognostic significance of BICD1 expression was not as strong as that of EGFR status, IDH1 status, the WHO grade, and patient age (Supplementary Table S4). In multivariate Cox’s regression analyses, conversely, BICD1 expression (HR = 1.896, p = 0.004547) showed a significant and stronger impact than IDH1 (HR = 1.687, p = 0.086014) and EGFR status (HR = 1.054, p = 0.857723) (Supplementary Table S5). It is important to notice that in univariate Cox’s regression analyses, 1p19q codeleted status did not show strong prognostic significance (HR = 2.602, p = 0.000067) (Supplementary Table S4). However, in multivariate Cox’s regression analyses, 1p19q codeleted status presented the highest prognostic significance among all variables (HR = 3.787, p = 0.000041) (Supplementary Table S5).
Our results confirmed the prognostic value of BICD1 expression as an independent factor for indicating the outcome of LGG patients.

3.6. BICD1 Downregulation Probably Suppresses Signaling Pathways Related to Immune Checkpoints and Cancer Progression in LGGs

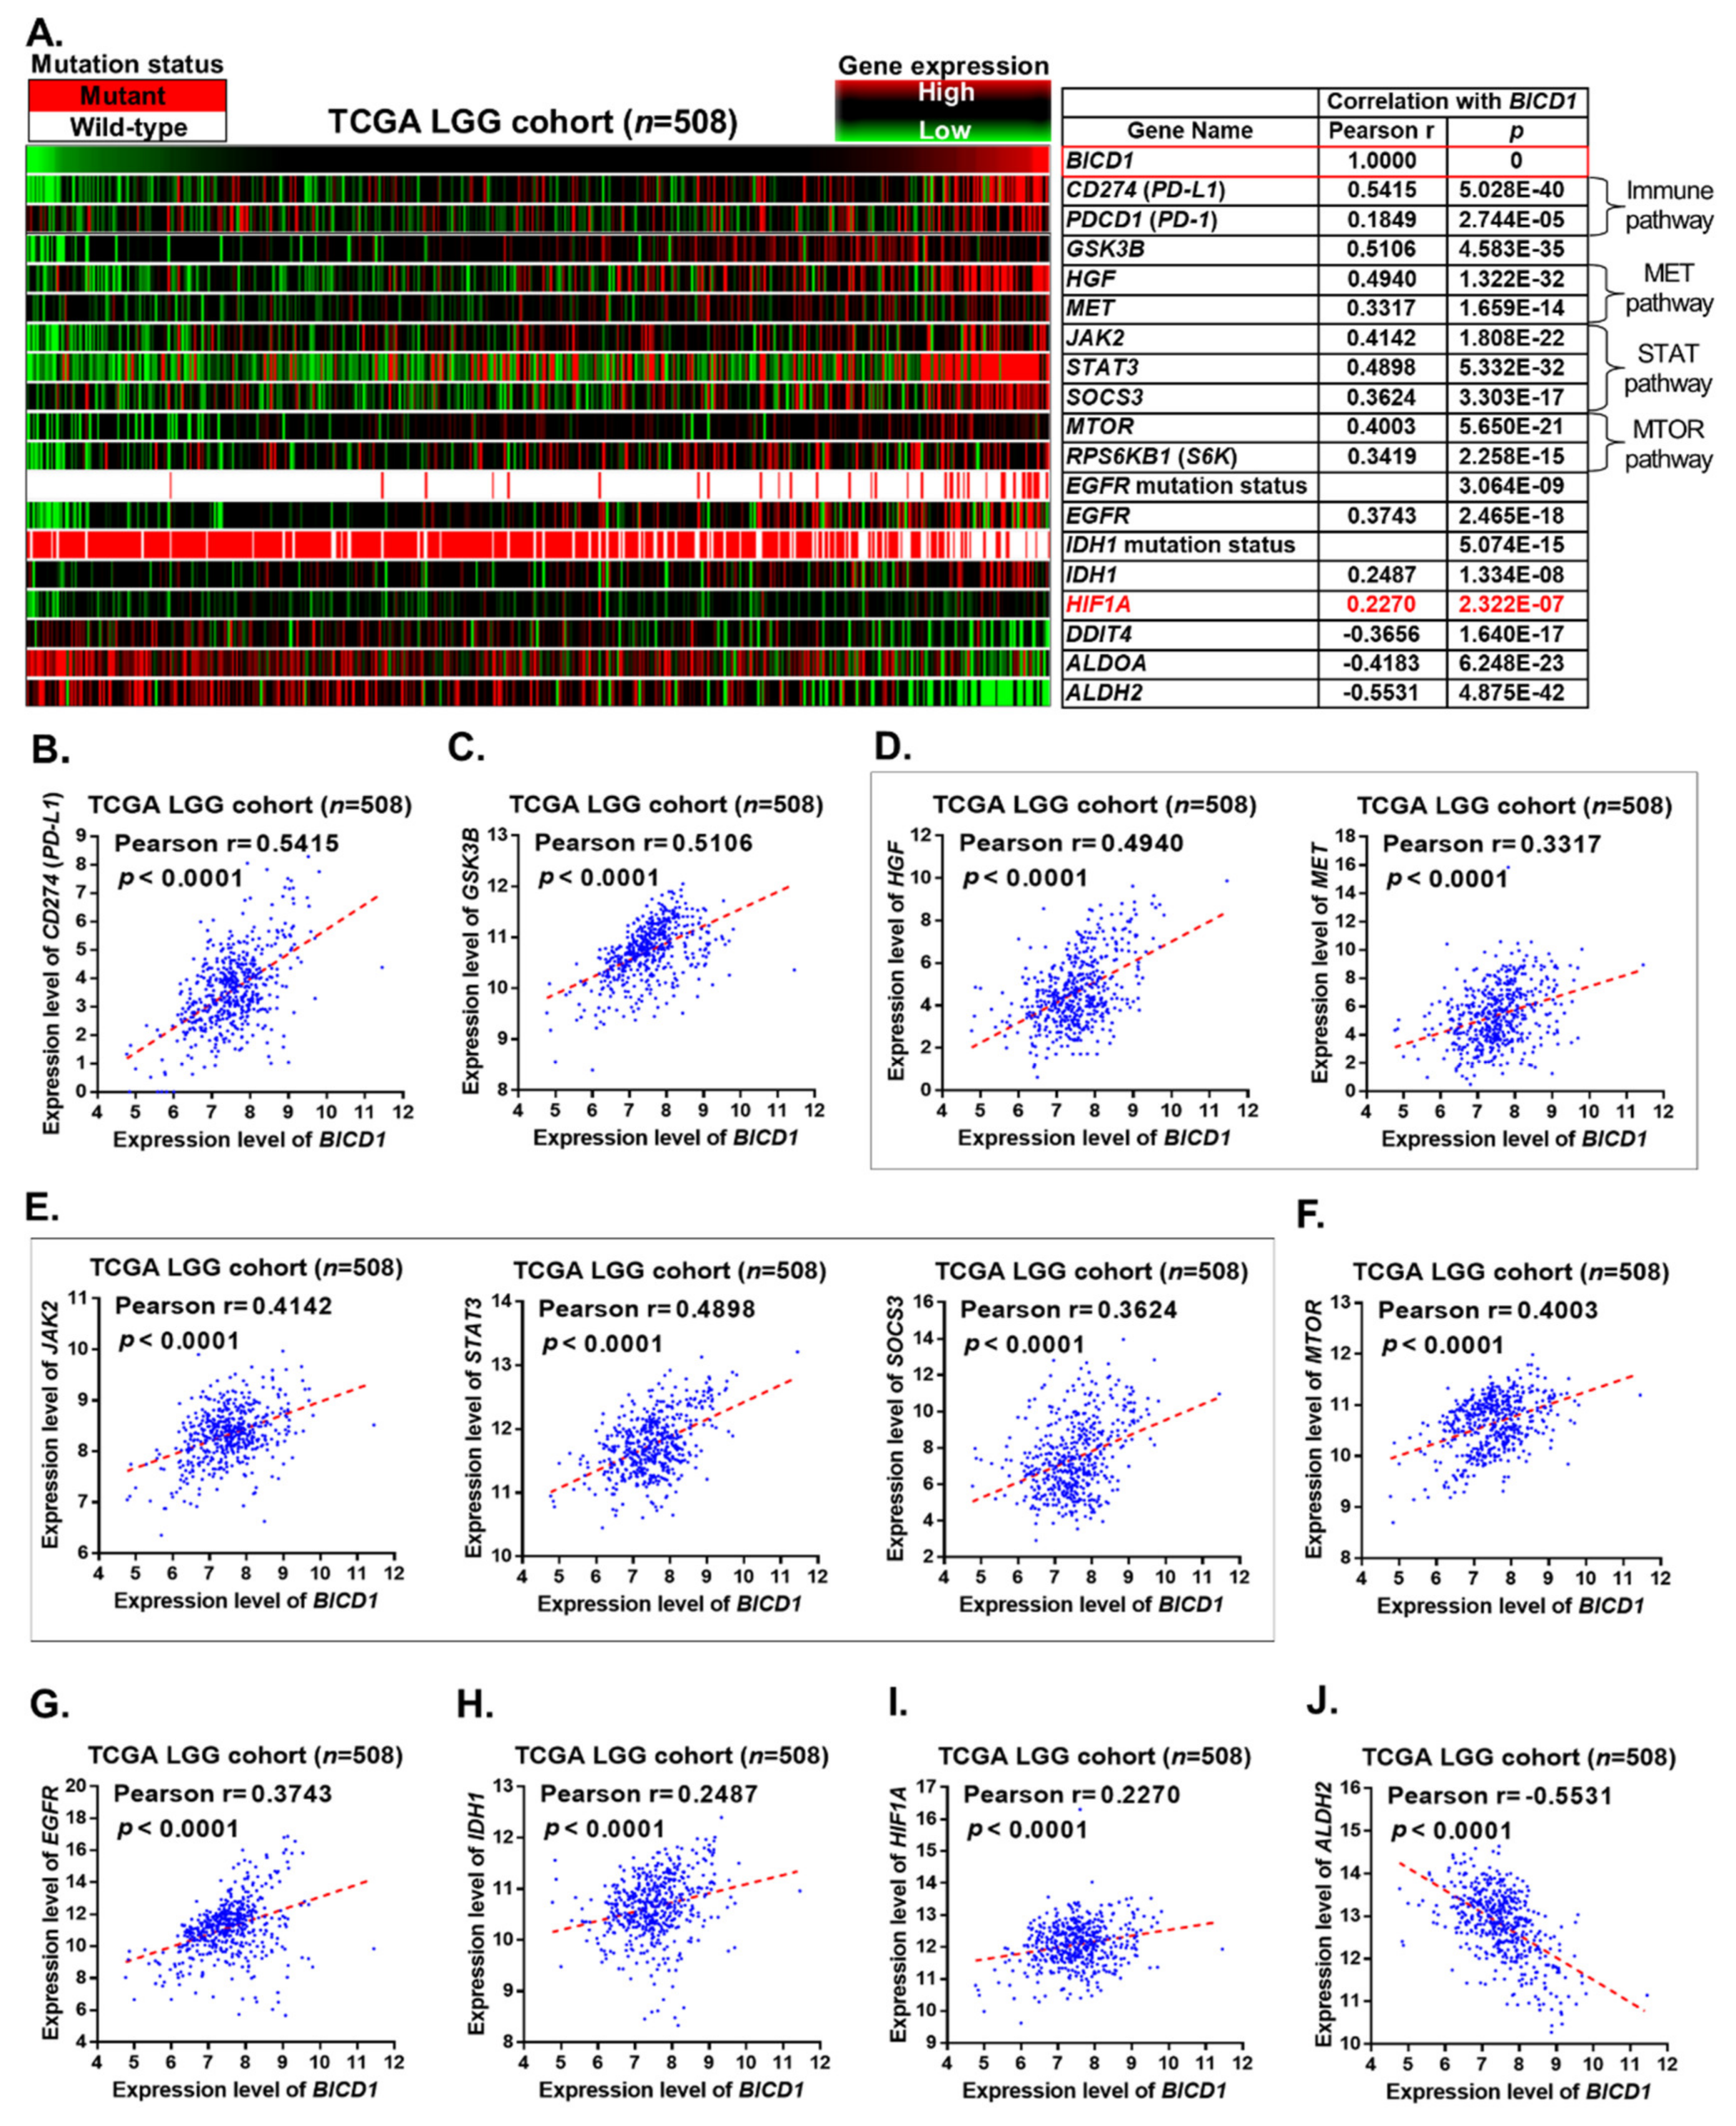
To explore the possible mechanism by which downregulation of BICD1 contributed to a favorable outcome in LGG patients, we used the TCGA LGG cohort to analyze the correlation of BICD1 expression with a couple of representative markers involved in several important pathways associated with cancer progression, including the immune checkpoint (PD-1 and PD-L1), MET, STAT, and MTOR pathways. The heatmap showed apparently positive correlations between downregulation of BICD1 and a couple of markers, including CD274 (PD-L1), PDCD1 (PD-1), GSK3B, HGF, MET, JAK2, STAT3, SOCS3, MTOR, RPS6KB1 (S6K), EGFR, IDH1, and HIF1A. Downregulation of BICD1 also showed strong correlations with wild-type EGFR and IDH1 mutations. Conversely, downregulation of BICD1 revealed negative correlations with DDIT4, ALDOA, and ALDH2 (Figure 6A).
The expression levels of BICD1 showed the highest correlation with CD274(PD-L1) (Pearson’s r = 0.5415, p = 5.028 × 10−40) (Figure 6A,B). They were also significantly and positively correlated with GSK3B (Pearson’s r = 0.5106, p = 4.583 × 10⁻³⁵) (Figure 6A,C), HGF (Pearson’s r = 0.4940, p = 1.322 × 10⁻³²), MET (Pearson’s r = 0.3317, p = 1.659 × 10⁻¹⁴) (Figure 6A,D), JAK2 (Pearson’s r = 0.4142, p = 1.808 × 10⁻²²), STAT3 (Pearson’s r = 0.4898, P = 5.332 × 10⁻³²), SOCS3 (Pearson’s r = 0.3624, p = 3.303 × 10⁻¹⁷) (Figure 6A,E), MTOR (Pearson’s r = 0.4003, p = 5.650 × 10⁻²¹) (Figure 6A,F), EGFR (Pearson’s r = 0.3743, p = 2.465 × 10⁻¹⁸) (Figure 6A,G), IDH1 (Pearson’s r = 0.2487, p = 1.334 × 10⁻⁸) (Figure 6A,H), and HIF1A (Pearson’s r = 0.2270, p = 2.322 × 10⁻⁷) (Figure 6A,I). Conversely, the expression levels of BICD1 were significantly and negatively correlated with ALDH2 (Pearson’s r = −0.5531, p = 4.875 × 10−42) (Figure 6A,J).
Our analyses identified the high correlations between the downregulation of BICD1 and the decreased levels of a couple of markers representing several important pathways associated with cancer progression, including immune checkpoint (PD-L1 related), HGF-MET, JAK2-STAT3-SOCS3, GSK3B, MTOR-S6K, HIF1A, IDH1, and EGFR pathways. Our findings may possibly explain why downregulation of BICD1 contributed to a favorable outcome in LGG patients by connecting it with the suppression of pathways associated with cancer progression.

3.7. The Prognostic Significance of BICD1 Downregulation Is Validated by Another LGG Cohort from the CCGA Database

To ensure the consistency of our previous findings in the TCGA LGG cohort with other LGG datasets, the LGG (Grades II + III) patients in the CGGA dataset (n = 420) were used as a validation set for further correlation and survival analyses. The t-test analyses revealed that the expression levels of BICD1 were significantly lower in LGGs with a lower WHO grade (grade II), IDH1 mutations, 1p19q codeletions, and alive status of patients in the CGGA dataset. Notably, the expression levels of BICD1 were highest in LGGs with wild-type IDH1 and not codeleted 1p19q (Figure 7A). These findings are consistent with our previous analytical results for the TCGA LGG cohort. However, BICD1 expression levels showed a significant (p = 0.00692) and negative correlation (Pearson r = −0.08319) with patient age in LGG patients in the CGGA dataset (Supplementary Figure S2), which was not consistent with our result in the TCGA LGG cohort (Figure 4D).
LGG patients in the CGGA dataset (n = 420) were stratified into two groups depending on BICD1 expression (50% high, n = 210 vs. 50% low, n = 210) for Kaplan–Meier survival analyses. Consistent with our previous results, those with downregulation of BICD1 had a significantly better OS than those with upregulation of BICD1 (p = 5.993 × 10⁻⁶) (Figure 7B), and LGG patients with IDH1 mutations (n = 288, 68.6%) had a significantly better OS (median survival: 7.386 years, 5-year survival: 60.7%) than those with wild-type IDH1 (n = 94, 22.4%) (median survival: 2.134 years, 5-year survival: 37.6%) (p = 1.046 × 10⁻⁶) (Figure 7C). Our results confirmed downregulation of BICD1 as a favorable prognostic marker of LGGs.
BICD1 expression was incorporated with IDH1 status to stratify LGG patients in the CGGA dataset (n = 420) into further distinct subgroups for survival analysis. In LGG patients with IDH1 mutations (n = 288, 68.6%), those with downregulation of BICD1 (n = 135, 32.1%) (5-year survival: 70.6%, adjusted HR=0.607) had a significantly better OS than those with upregulation of BICD1 (n = 153, 36.4%) (5-year survival: 51.2%, adjusted HR = 1.141) (p = 0.000253), and in LGG patients with wild-type IDH1 (n = 94, 22.4%), those with downregulation of BICD1 (n = 41, 9.8%) (median survival: 2.841, 5-year survival: 45.5%, adjusted HR = 1.290) had a significantly better OS than those with upregulation of BICD1 (n = 53, 12.6%) (median survival: 1.836, 5-year survival: 31.3%, adjusted HR = 2.410) (p = 1.0004 × 10⁻¹⁰) (Figure 7D). Consistent with our previous results, LGG patients with wild-type IDH1 and upregulation of BICD1 had the worst OS (median survival: 1.836, 5-year survival: 31.3%, adjusted HR = 2.410) and those with IDH1 mutations and downregulation of BICD1 had the best OS (5-year survival: 70.6%, adjusted HR = 0.607). More importantly, LGG patients with IDH1 mutations and downregulation of BICD1 had a better OS (n = 135, 5-year survival: 70.6%, Figure 7D) than those only with IDH1 mutations (n = 288, 5-year survival: 60.7%, Figure 7C). Our results confirmed that incorporating BICD1 expression improves the prognostic accuracy of IDH1 mutations when serving as a prognostic marker of LGGs.
The expression level of BICD1 also showed a positive and significant correlation with that of CD274 (PD-L1) (Pearson’s r = 0.2665, p < 0.0001) in LGGs in the CGGA dataset (Figure 7E). The gene expression profiles of LGG cell lines (n = 8) in the CCLE dataset were used as another validation set for confirming the correlation between downregulation of BICD1 and that of CD274 (PD-L1). The expression level of BICD1 in LGG cell lines showed a positive and significant correlation with that of CD274 (PD-L1) (Pearson’s r = 0.7549, p = 0.0304) in the CCLE dataset (Figure 7F).
Our findings confirmed that downregulation of BICD1 is a favorable prognostic marker and is highly correlated with downregulation of several important markers associated with cancer progression, including CD274 (PD-L1), in LGGs in the CGGA and CCLE datasets.

4. Discussion

The BICD Cargo Adaptor 1 (BICD1), encoded by BICD1 gene and previously named Bicaudal D (Drosophila) homolog 1, was initially identified in Drosophila [16]. The BICD1 and BICD2 genes are two human homologues of the Drosophila Bicaudal-D gene. The Drosophila Bicaudal-D gene plays a role in drosophila oocyte differentiation [17]. In drosophila, mutations in the Drosophila Bicaudal-D gene result in a double abdomen, or a bicaudal (means “two-tailed”) phenotype of the drosophila embryo [18]. Subsequently, this gene was named “Bicaudal-D” (BICD) due to the striking phenotype when it was mutated [19]. In humans, naturally occurring variants in this gene are associated with short telomere length [20] and emphysema [21].
The BICD1 gene encodes an adaptor protein that belongs to the Bicaudal-D family of dynein cargo adaptors. This protein acts as an intracellular cargo transport cofactor that regulates the microtubule-based transport of cargo onto the dynein motor complex [22]. It is also involved in cargo transport between the Golgi apparatus and endoplasmic reticulum and the recruitment of the dynein –dynactin complex [23]. Intracellular cargo transport via vesicle trafficking has been linked to tumor growth, tumor invasion, neo-angiogenesis, oncogenic transformation, and modulation of the immune response [24]. Recently, microtubule-associated factors were reported to be involved in hypoxia inducible factor 1A (HIF1A) nuclear translocation [25], and the BICD Cargo Adaptor 1 protein was shown to be a novel factor regulating the translocation of the HIF1A protein into nucleus [15].
The clinical significance of BICD expression in cancers was rarely reported before. A recent study demonstrated that upregulation of the BICD1 gene is a predictor for poor prognosis and poor response to Temozolomide (TMZ) in glioblastoma (GBM) patients [26]. Another study also reported that BICD1 functions as a prognostic biomarker and promotes hepatocellular carcinoma (HCC) progression [27]. To date, there has been no report concerning the clinical relevance of BICD1 downregulation in LGGs. Our study is the first to identify the novel characteristics of BICD1 downregulation in LGGs and validate it as a potential biomarker for predicting a favorable prognosis of LGG patients.
In this study, we showed that downregulation of BICD1 was significantly correlated with a couple of benign clinicopathological features in LGG patients, including a lower WHO grade (grade II), mutations in IDH1, TP53, and ATRX, wild-type EGFR, a younger patient age (≤40 years), and a higher KPS. In addition, the Kaplan–Meier survival analysis revealed that downregulation of BICD1 predicts a better overall survival of LGG patients. All of our results were validated in two validation sets (LGG patients in the CGGA dataset and LGG cell lines in the CCLE dataset), which confirmed that downregulation of BICD1 could be a potential biomarker for predicting a favorable prognosis of LGG patients.
Although IDH1 mutations and 1p19q codeletions are both well-known markers for indicating a favorable outcome of LGG patients [28,29], the mechanism by which IDH1 mutations or 1p19q codeletions contribute to a favorable outcome of LGGs is still not clearly elucidated. IDH1 mutations are known to play a role in affecting cancer metabolism [30] and have been validated as the most significant biomarker for predicting a longer overall survival time in LGG patients (Figure 5B and Figure 7C). In our results, downregulation of BICD1 was shown to be significantly correlated with IDH1 mutations (Figure 4B). Although BICD1 expression was not significantly corelated with 1p19q codeleted status, it was significantly upregulated in IDH1 wild-type LGGs with EGFR mutations, which was the subgroup of LGGs with the poorest prognosis, and could be considered as glioblastoma (grade IV glioma), rather than LGGs, according to the 2016 WHO classification of CNS tumors (Figure 4C). Based on the previous finding that BICD1 promotes the translocation of HIF1A into the nucleus [15], we could try to answer the question of why IDH1 mutations and 1p19q codeletions contributed to a favorable outcome in LGG patients by connecting IDH1 mutations or 1p19q codeletions with the HIF1A pathway via the intermediate regulator, BICD1. In addition to IDH1 mutations, BICD1 downregulation was shown to significantly correlate with wild-type EGFR and mutations in TP53 and ATRX (Figure 4B). Although mutations in TP53 and ATRX are known molecular markers of LGGs, they did not have significant impact on the overall survival of LGG patient (TP53 status: HR = 1.422, p = 0. 052633; ATRX status: HR = 1.408, p = 0. 067904, respectively) (Figure 2B), which also suggested that the expression status of BICD1 had better prognostic value than the mutated status of TP53 and ATRX.
Currently, the 2016 WHO classification of CNS tumors suggests the combined utilization of IDH1 status, 1p19q codeleted status, and histological subtypes to provide more objective diagnosis and classification of CNS tumors [8]. However, there is still variation in clinical outcomes of patients who have the same IDH1 or 1p19q codeleted status. Therefore, we attempted to incorporate BICD1 expression with IDH1 status to classify LGG patients into further distinct subgroups. With the combined utilization of IDH1 status and BICD1 expression, LGG patients with IDH1 mutations could be stratified into two distinct subgroups with significant difference in their overall survival, and those with downregulation of BICD1 had a significantly better overall survival than those with upregulation of BICD1 (Figure 5D and Figure 7D). More importantly, LGG patients with IDH1 mutations and downregulation of BICD1 had a significantly better overall survival (Figure 5D) than those only with IDH1 mutations (Figure 5B), and those with IDH1 mutations and upregulation of BICD1 had a significantly worse overall survival (Figure 7D) than those only with IDH1 mutations (Figure 7C). Our results confirmed the prognostic value of BICD1 expression as it could facilitate IDH1 status to classify LGG patients into further clinically distinct subgroups, which may provide more accurate prognosis prediction of LGG patients than using IDH1 status alone.
Despite the fact that IDH1 status is the most well-known and powerful marker of LGGs, in our results, EGFR status was shown to have the highest impact on the overall survival of LGG patients (Figure 2B). In univariate Cox’s regression analyses, EGFR status (HR = 5.06), IDH1 status (HR = 4.445), the WHO grade (HR = 3.314), patient age (HR = 2.889), and BICD1 expression (HR = 2.731) were shown to have highly significant impact on the overall survival of LGG patients (Supplementary Table S4). In multivariate Cox’s regression analyses, patient age (HR = 2.673, p = 0.000011), the WHO grade (HR = 2.201, p = 0.000335), and BICD1 expression (HR = 1.896, p = 0.004547) still had a significant impact on the overall survival of patients, which confirmed BICD1 downregulation as an independent factor for a longer survival time in LGG patients (Supplementary Table S5). However, in multivariate Cox’s regression analyses, IDH1 (HR = 1.687, p = 0.086014) and EGFR status (HR = 1.054, p = 0.857723) did not have a significant impact on the overall survival of LGG patients even though they had a highly significant impact on the overall survival of LGG patients in univariate Cox’s regression analyses. More interestingly, even though 1p19q codeleted status did not have a strong impact on the overall survival of LGG patients in univariate Cox’s regression analyses (HR = 2.602, p = 0.000067) (Supplementary Table S4), it presented the highest impact (HR = 3.787, p = 0.000041) on the overall survival of LGG patients among all variables in multivariate Cox’s regression analyses (Supplementary Table S5).
The underlying mechanism by which downregulation of BICD1 resulted in a favorable outcome in LGG patients remains unclear. Based on the previously published study, upregulation of BICD1, which promotes the nuclear translocation of HIF1A and eventually enhances the transcriptional activity of HIF1A [15], could be a possible mechanism. To explore other possible mechanisms, we attempted to analyze the correlation of BICD1 downregulation with a couple of markers involved in various pathways associated with cancer progression, including the immune checkpoint, MET, STAT, and MTOR pathways, in the TCGA LGG cohort. In our results, we observed positive and highly significant correlations of BICD1 downregulation with decreased levels of CD274 (PD-L1), GSK3B, HGF, and STAT3 (Figure 6B,C,D), which may partially explain why LGG patients with downregulation of BICD1 had a favorable outcome. Our findings were also validated in the CGGA (Figure 7E) and CCLE datasets (Figure 7F). It is important to identify the highly significant correlation between the expression level of BICD1 and that of CD274 (PD-L1). The CD274 gene encodes the protein, Programmed Cell Death 1 Ligand 1 (PD-L1), which inactivates cytotoxic T-cells and helps tumor cells escape from immune damage by cytotoxic T-cells. Overexpression of CD274 (PD-L1) has been identified as a poor prognostic marker in many types of human cancers, including colon cancer [31] and renal cell carcinoma [32,33]. Although its prognostic significance (HR = 1.767, p = 0.002327) was not as high as that of BICD1 (HR = 2.731, p = 0.000002) in LGGs (Figure 2B), the strong correlation between BICD1 downregulation and a decreased level of CD274 (PD-L1) still highlighted the possibility that BICD1 downregulation contributed to a favorable outcome in LGGs, which might be associated with an enhanced immune surveillance in cancer patients. Another interesting finding is that BICD1 expression was shown to highly but negatively correlate with ALDH2 expression (Pearson’s r = −0.5531, p = 4.875 × 10−42) (Figure 6A,J). ALDH2 is an important tumor suppression gene in the pathogenesis of hepatocellular carcinoma [34], which may give us a hint that the favorable outcome of LGG patients with BICD1 downregulation is probably due to upregulation of the tumor suppression gene, ALDH2.
A systemic review reported by Arash Ghaffari-Rafi and George Samandouras in 2020 showed that patients with oligodendroglioma have a better overall and progression-free survival on the basis of molecular subtypes of WHO grade II diffuse gliomas [35]. Accordingly, in multivariate Cox’s regression analyses, we found that patients with oligodendrogliomas had a significantly better overall survival than those with astrocytomas (p = 0.002872) (Figure 2B). Nevertheless, the statistical significance was not stronger than the impact of BICD1 expression (p = 0.000002). Although BICD1 expression in oligodendrogliomas was detected to be slightly higher than that of astrocytomas (Figure 3A), the difference was not statistically significant (p = 0.6061). Similarly, the correlation between the proportion of lower and higher BICD1 expression detected in the different histological subtypes of LGGs was not significant (Supplementary Table S2). Based on the results from Figure 2B, Figure 3A, Figure 6A, and Supplementary Table S2, we suggest that the impact of BICD1 downregulation on a better overall survival in LGG patients is probably associated with a decreased level of PD-L1, GSK3B, HGF, or STAT3 and is independent of LGG histological subtypes.

5. Conclusions

Our analyses suggested that BICD1 downregulation could be a potential biomarker for indicating a favorable prognosis of LGG patients. Moreover, BICD1 downregulation might be associated with an enhanced immune surveillance, in contrast to PD-L1-mediated immune suppression, and the suppressions of several signaling pathways, such as JAK-STAT3-SOCS3, GSK3β-β-catenin, MTOR-S6K, HIF1A, HGF-MET, IDH1, and EGFR in LGGs (Figure 8). These findings might provide hints for understanding the mechanism regarding the pathogenesis and progression in LGGs.

Supplementary Materials

The following are available online at https://www.mdpi.com/article/10.3390/biology10080701/s1, Figure S1: The prognostic significance of HIF1A expression in the TCGA LGG cohort, Figure S2: The correlation between BICD1 expression and patient age in LGG patients in the CGGA dataset, Table S1: 34 representative genes associated with the HIF1A pathway and their biological effects, Table S2: Correlations of BICD1 expression with the clinicopathological features of patients in the TCGA LGG cohort, Table S3: Correlations of the KPS with BICD1 expression and the clinicopathological features of patients in the TCGA LGG cohort, Table S4: Univariate Cox’s regression analysis for comparing the prognostic significance between BICD1 expression and the clinicopathological features of patients in the TCGA LGG cohort, Table S5: Multivariate Cox’s regression analysis for comparing the prognostic significance between BICD1 expression and the clinicopathological features of patients in the TCGA LGG cohort.

Author Contributions

Conceptualization: W.-M.C. and Y.-F.L.; Data curation: S.-P.H. and C.-H.L.; Formal analysis: S.-P.H.; Funding acquisition: W.-M.C. and Y.-F.L.; Investigation: S.-P.H., C.-H.L., W.-M.C. and Y.-F.L.; Methodology: S.-P.H.; Writing—original draft: S.-P.H. All authors have read and agreed to the published version of the manuscript.

Funding

This study was supported by the Ministry of Science and Technology, Taiwan (MOST 108-2320-B-038-017-MY3 to Yuan-Feng Lin.

Institutional Review Board Statement

Not applicable.

Informed Consent Statement

Not applicable.

Data Availability Statement

The clinicopathological data of patients in the TCGA LGG and CCGA cohort were downloaded from the TCGA Portal (http://www.xenabrowser.net/) and the CGGA website (http://www.cgga.org.cn/). The gene sequencing profiles of LGG cell lines in the CCLE dataset were also downloaded from the TCGA Portal (http://www.xenabrowser.net/). The cell lines we used in this manuscript were rechecked in the Cancer Model Passport website (https://cellmodelpassports.sanger.ac.uk/) to ensure all of them are LGG cell lines.

Acknowledgments

Not applicable.

Conflicts of Interest

The authors declare no conflict of interest.

References

  1. Ostrom, Q.T.; Gittleman, H.; Fulop, J.; Liu, M.; Blanda, R.; Kromer, C.; Wolinsky, Y.; Kruchko, C.; Barnholtz-Sloan, J.S. CBTRUS Statistical Report: Primary Brain and Central Nervous System Tumors Diagnosed in the United States in 2008-2012. Neuro-Oncology 2015, 17, iv1–iv62. [Google Scholar] [CrossRef]
  2. Bourne, T.D.; Schiff, D. Update on molecular findings, management and outcome in low-grade gliomas. Nat. Rev. Neurol. 2010, 6, 695–701. [Google Scholar] [CrossRef] [PubMed]
  3. Mahaley, M.S.; Mettlin, C.; Natarajan, N.; Laws, E.R.; Peace, B.B. National survey of patterns of care for brain-tumor patients. J. Neurosurg. 1989, 71, 826–836. [Google Scholar] [CrossRef] [PubMed]
  4. Kalinina, J.; Peng, J.; Ritchie, J.C.; Van Meir, E.G. Proteomics of gliomas: Initial biomarker discovery and evolution of technology. Neuro-Oncology 2011, 13, 926–942. [Google Scholar] [CrossRef] [PubMed]
  5. Haynes, H.R.; Ecamelo-Piragua, S.; Kurian, K.M. Prognostic and Predictive Biomarkers in Adult and Pediatric Gliomas: Toward Personalized Treatment. Front. Oncol. 2014, 4, 47. [Google Scholar] [CrossRef] [PubMed] [Green Version]
  6. The Cancer Genome Atlas Research Network. Comprehensive, Integrative Genomic Analysis of Diffuse Lower-Grade Gliomas. N. Engl. J. Med. 2015, 372, 2481–2498. [Google Scholar] [CrossRef] [Green Version]
  7. Wen, P.Y.; Reardon, D.A. Progress in glioma diagnosis, classification and treatment. Nat. Rev. Neurol. 2016, 12, 69–70. [Google Scholar] [CrossRef]
  8. Louis, D.N.; Perry, A.; Reifenberger, G.; von Deimling, A.; Figarella-Branger, D.; Cavenee, W.K.; Ohgaki, H.; Wiestler, O.D.; Kleihues, P.; Ellison, D.W. The 2016 World Health Organization Classification of Tumors of the Central Nervous System: A summary. Acta Neuropathol. 2016, 131, 803–820. [Google Scholar] [CrossRef] [PubMed] [Green Version]
  9. Galanis, E.; Wu, W.; Sarkaria, J.; Chang, S.M.; Colman, H.; Sargent, D.; Reardon, D.A. Incorporation of Biomarker Assessment in Novel Clinical Trial Designs: Personalizing Brain Tumor Treatments. Curr. Oncol. Rep. 2011, 13, 42–49. [Google Scholar] [CrossRef] [Green Version]
  10. Ludwig, J.A.; Weinstein, J.N. Biomarkers in Cancer Staging, Prognosis and Treatment Selection. Nat. Rev. Cancer 2005, 5, 845–856. [Google Scholar] [CrossRef]
  11. Fleming, I.N.; Manavaki, R.; Blower, P.; West, C.; Williams, K.J.; Harris, A.; Domarkas, J.; Lord, S.J.; Baldry, C.W.; Gilbert, F.J. Imaging tumour hypoxia with positron emission tomography. Br. J. Cancer 2015, 112, 238–250. [Google Scholar] [CrossRef] [Green Version]
  12. Jubb, A.M.; Buffa, F.; Harris, A.L. Assessment of tumour hypoxia for prediction of response to therapy and cancer prognosis. J. Cell. Mol. Med. 2009, 14, 18–29. [Google Scholar] [CrossRef] [PubMed]
  13. Hong, S.-S.; Lee, H.; Kim, K.-W. HIF-1α: A Valid Therapeutic Target for Tumor Therapy. Cancer Res. Treat. 2004, 36, 343. [Google Scholar] [CrossRef] [Green Version]
  14. Semenza, G.L. HIF-1: Upstream and downstream of cancer metabolism. Curr. Opin. Genet. Dev. 2010, 20, 51–56. [Google Scholar] [CrossRef] [PubMed] [Green Version]
  15. Lee, H.J.; Jung, Y.H.; Oh, J.Y.; Choi, G.E.; Chae, C.W.; Kim, J.S.; Lim, J.R.; Kim, S.Y.; Lee, S.-J.; Seong, J.K.; et al. BICD1 mediates HIF1α nuclear translocation in mesenchymal stem cells during hypoxia adaptation. Cell Death Differ. 2019, 26, 1716–1734. [Google Scholar] [CrossRef] [PubMed] [Green Version]
  16. Baens, M.; Marynen, P. A Human Homologue (BICD1) of theDrosophila Bicaudal-DGene. Genomics 1997, 45, 601–606. [Google Scholar] [CrossRef]
  17. Mahone, M.; Saffman, E.; Lasko, P. Localized Bicaudal-C RNA encodes a protein containing a KH domain, the RNA binding motif of FMR1. EMBO J. 1995, 14, 2043–2055. [Google Scholar] [CrossRef] [PubMed]
  18. Mohler, J.; Wieschaus, E.F. Dominant Maternal-Effect Mutations of Drosophila Melanogaster Causing the Production of Double-Abdomen Embryos. Genetics 1986, 112, 803–822. [Google Scholar] [CrossRef]
  19. Terenzio, M.; Schiavo, G. The more, the better: The BICD family gets bigger. EMBO J. 2010, 29, 1625–1626. [Google Scholar] [CrossRef]
  20. Mangino, M.; Brouilette, S.; Braund, P.; Tirmizi, N.; Vasa-Nicotera, M.; Thompson, J.R.; Samani, N.J. A regulatory SNP of the BICD1 gene contributes to telomere length variation in humans. Hum. Mol. Genet. 2008, 17, 2518–2523. [Google Scholar] [CrossRef] [Green Version]
  21. Kong, X.; Cho, M.H.; Anderson, W.; Coxson, H.O.; Müller, N.; Washko, G.; Hoffman, E.A.; Bakke, P.; Gulsvik, A.; Lomas, D.A.; et al. Genome-wide Association Study IdentifiesBICD1as a Susceptibility Gene for Emphysema. Am. J. Respir. Crit. Care Med. 2011, 183, 43–49. [Google Scholar] [CrossRef] [Green Version]
  22. Hoogenraad, C.C.; Akhmanova, A. Bicaudal D Family of Motor Adaptors: Linking Dynein Motility to Cargo Binding. Trends Cell Biol. 2016, 26, 327–340. [Google Scholar] [CrossRef] [PubMed]
  23. Matanis, T.; Akhmanova, A.; Wulf, P.S.; Del Nery, E.; Weide, T.; Stepanova, T.; Galjart, N.; Grosveld, F.; Goud, B.; De Zeeuw, C.I.; et al. Bicaudal-D regulates COPI-independent Golgi–ER transport by recruiting the dynein–dynactin motor complex. Nat. Cell Biol. 2002, 4, 986–992. [Google Scholar] [CrossRef] [PubMed]
  24. Matarredona, E.R.; Pastor, A.M. Extracellular Vesicle-Mediated Communication between the Glioblastoma and Its Microenvironment. Cells 2019, 9, 96. [Google Scholar] [CrossRef] [PubMed] [Green Version]
  25. Lee, H.J.; Han, H.J. Role of Microtubule-Associated Factors in HIF1α Nuclear Translocation. Adv. Exp. Med. Biol. 2020, 1232, 271–276. [Google Scholar] [CrossRef]
  26. Huang, S.-P.; Chang, Y.-C.; Low, Q.H.; Wu, A.T.; Chen, C.-L.; Lin, Y.-F.; Hsiao, M. BICD1 expression, as a potential biomarker for prognosis and predicting response to therapy in patients with glioblastomas. Oncotarget 2017, 8, 113766–113791. [Google Scholar] [CrossRef] [PubMed] [Green Version]
  27. Jiang, Y.; Yao, B.; Chen, T.; Mo, H.; Chen, S.; Liu, Q.; Sun, Y. BICD1 functions as a prognostic biomarker and promotes hepatocellular carcinoma progression. Pathol. Res. Pr. 2020, 216, 152858. [Google Scholar] [CrossRef]
  28. Yan, H.; Parsons, D.W.; Jin, G.; McLendon, R.; Rasheed, B.A.; Yuan, W.; Kos, I.; Batinic-Haberle, I.; Jones, S.; Riggins, G.J.; et al. IDH1andIDH2Mutations in Gliomas. N. Engl. J. Med. 2009, 360, 765–773. [Google Scholar] [CrossRef] [PubMed]
  29. Parsons, D.W.; Jones, S.; Zhang, X.; Lin, J.C.-H.; Leary, R.J.; Angenendt, P.; Mankoo, P.; Carter, H.; Siu, I.-M.; Gallia, G.L.; et al. An Integrated Genomic Analysis of Human Glioblastoma Multiforme. Science 2008, 321, 1807–1812. [Google Scholar] [CrossRef] [PubMed] [Green Version]
  30. Ichimura, K. Molecular pathogenesis of IDH mutations in gliomas. Brain Tumor Pathol. 2012, 29, 131–139. [Google Scholar] [CrossRef] [PubMed]
  31. Masugi, Y.; Nishihara, R.; Yang, J.; Mima, K.; Da Silva, A.; Shi, Y.; Inamura, K.; Cao, Y.; Song, M.; A Nowak, J.; et al. Tumour CD274 (PD-L1) expression and T cells in colorectal cancer. Gut 2017, 66, 1463–1473. [Google Scholar] [CrossRef] [PubMed]
  32. Choueiri, T.K.; Figueroa, D.J.; Fay, A.P.; Signoretti, S.; Liu, Y.; Gagnon, R.; Deen, K.; Carpenter, C.; Benson, P.; Ho, T.; et al. Correlation of PD-L1 Tumor Expression and Treatment Outcomes in Patients with Renal Cell Carcinoma Receiving Sunitinib or Pazopanib: Results from COMPARZ, a Randomized Controlled Trial. Clin. Cancer Res. 2015, 21, 1071–1077. [Google Scholar] [CrossRef] [PubMed] [Green Version]
  33. Zhou, Q.-H.; Li, K.-W.; Chen, X.; He, H.-X.; Peng, S.-M.; Peng, S.-R.; Wang, Q.; Li, Z.-A.; Tao, Y.-R.; Cai, W.-L.; et al. HHLA2 and PD-L1 co-expression predicts poor prognosis in patients with clear cell renal cell carcinoma. J. Immunother. Cancer 2019, 8, e000157. [Google Scholar] [CrossRef] [Green Version]
  34. Seo, W.; Gao, Y.; He, Y.; Sun, J.; Xu, H.; Feng, D.; Park, S.H.; Cho, Y.-E.; Guillot, A.; Ren, T.; et al. ALDH2 deficiency promotes alcohol-associated liver cancer by activating oncogenic pathways via oxidized DNA-enriched extracellular vesicles. J. Hepatol. 2019, 71, 1000–1011. [Google Scholar] [CrossRef] [PubMed]
  35. Ghaffari-Rafi, A.; Samandouras, G. Effect of Treatment Modalities on Progression-Free Survival and Overall Survival in Molecularly Subtyped World Health Organization Grade II Diffuse Gliomas: A Systematic Review. World Neurosurg. 2020, 133, 366–380.e2. [Google Scholar] [CrossRef]
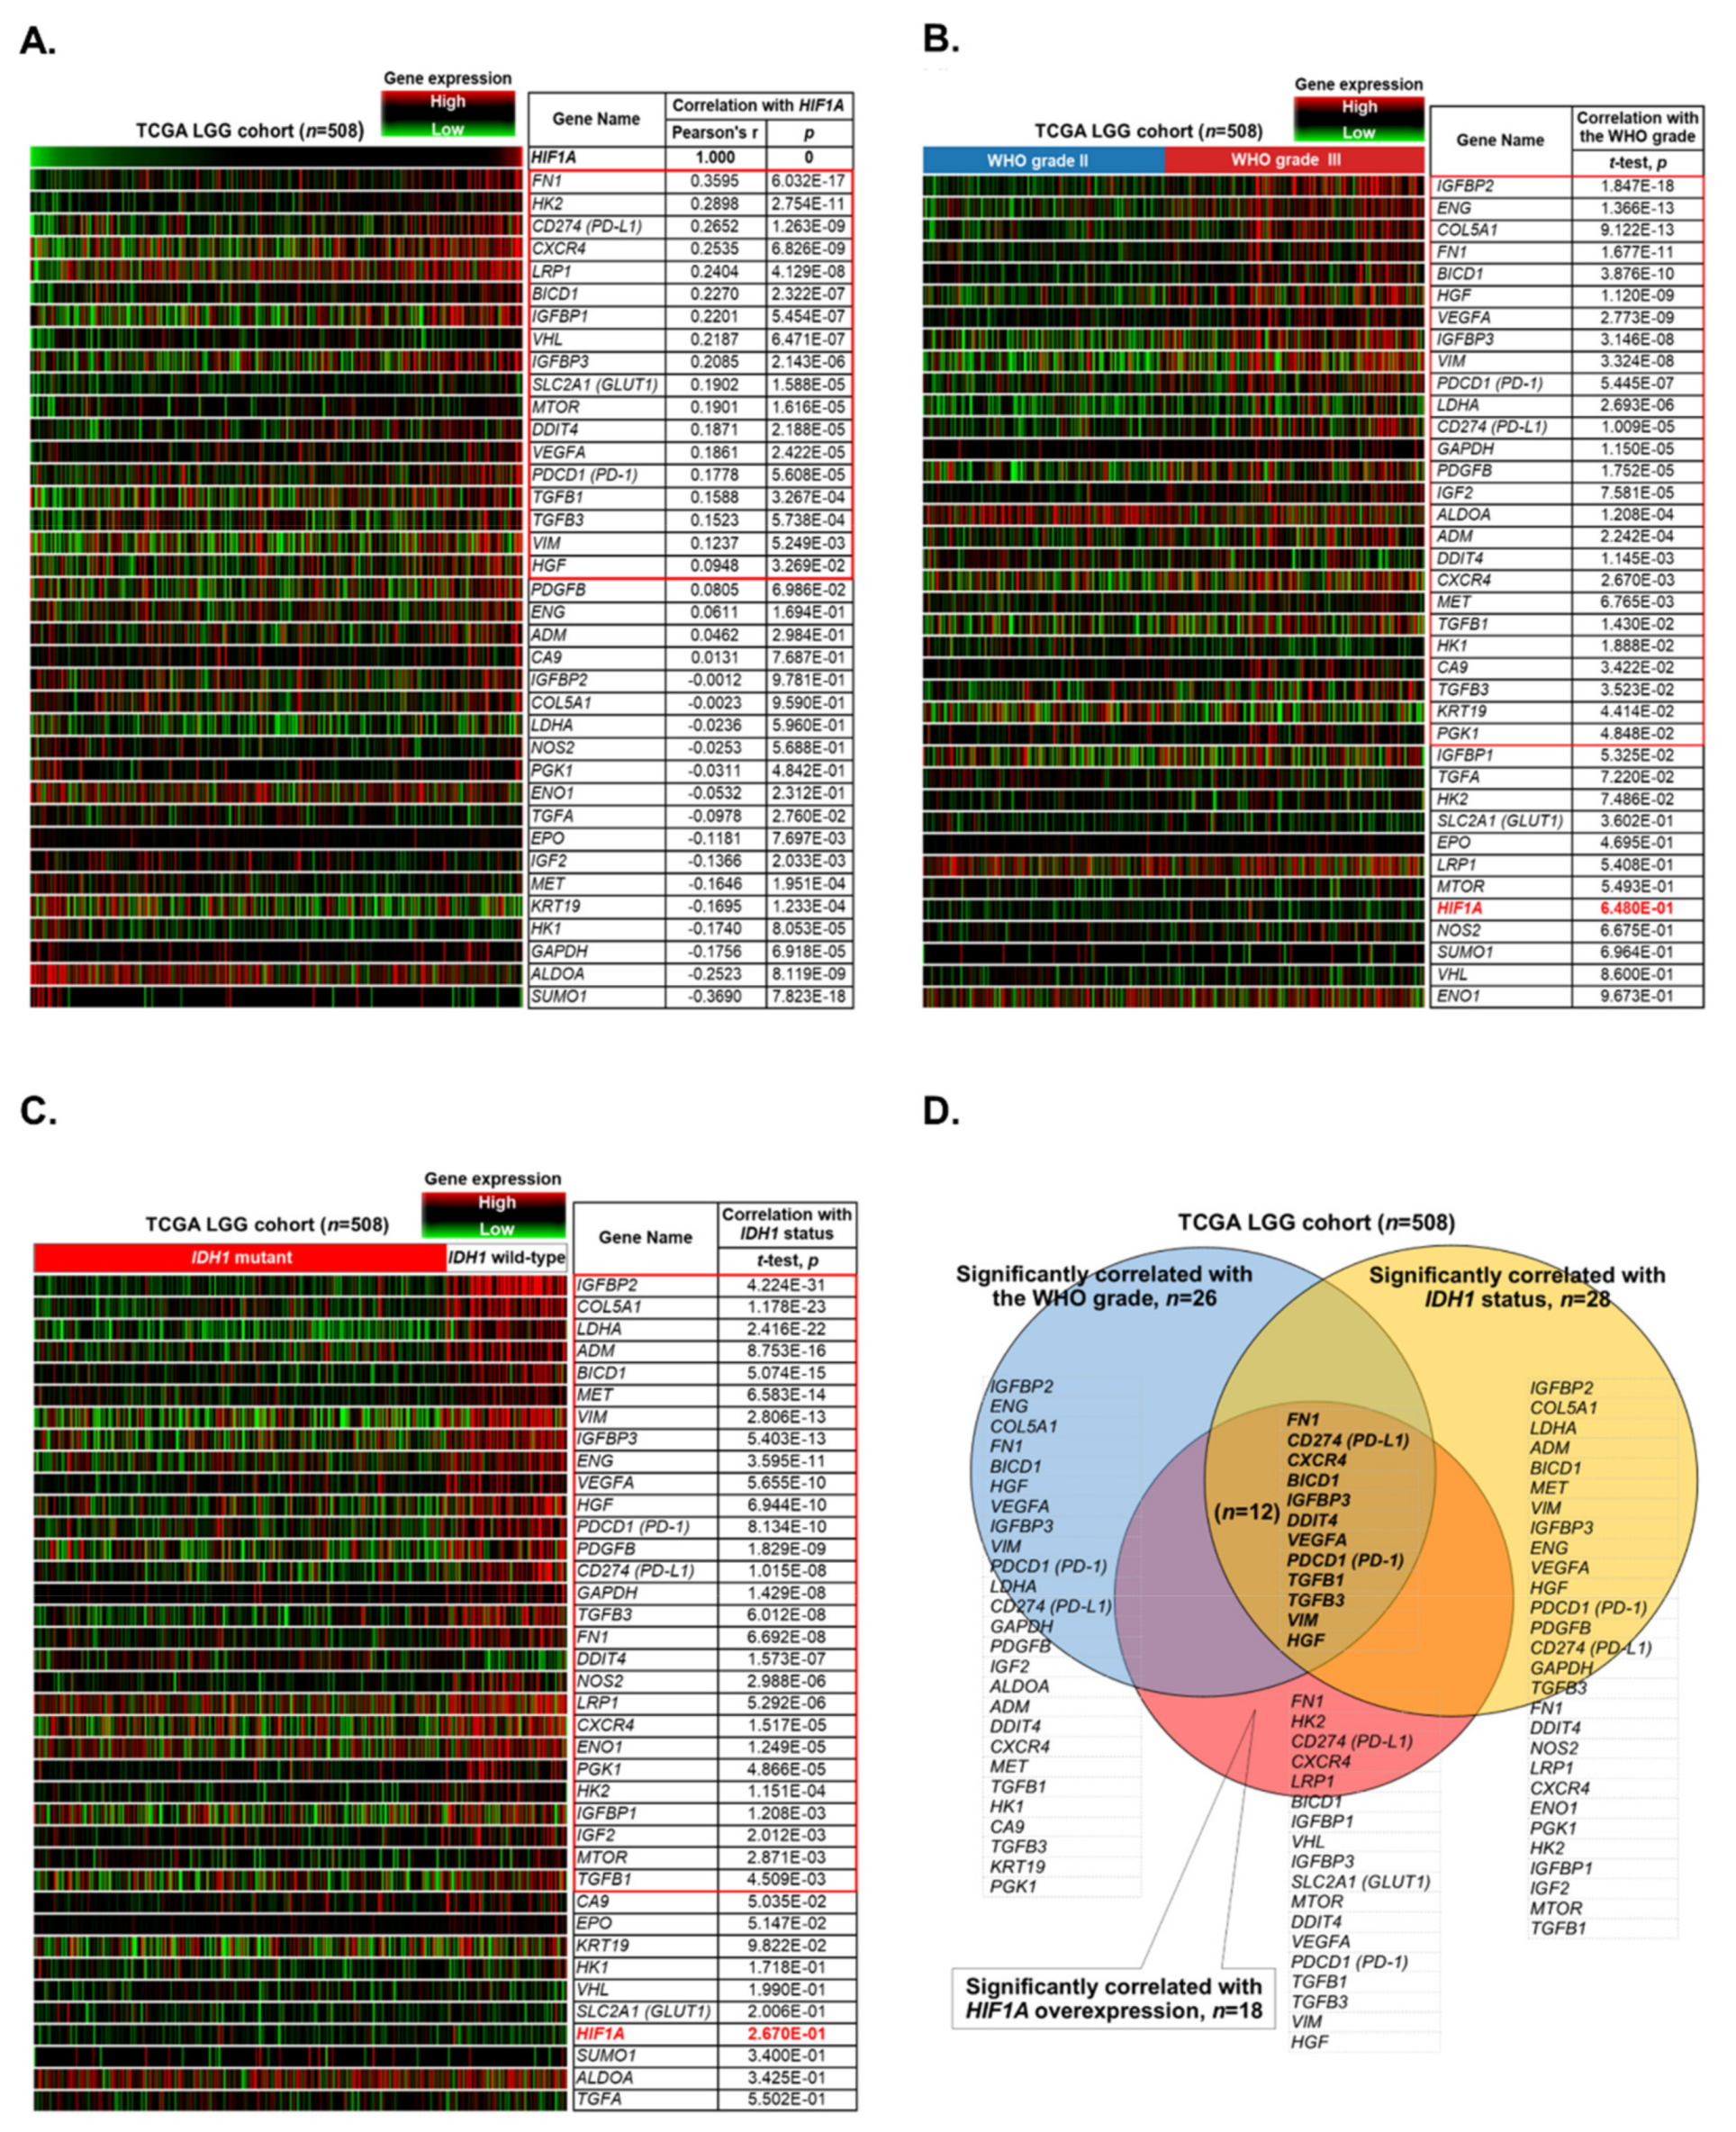
Figure 1. Identification of candidate biomarkers in the TCGA LGG database. (A). The heatmap revealed the correlations between the expression levels of 34 candidate genes and that of HIF1A. Those that were significantly and positively correlated with HIF1A upregulation were selected as candidate markers. (B). The heatmap revealed the correlations between the expression levels of 34 candidate genes and the WHO grade. Those that were significantly and differentially upregulated in grade III gliomas were selected as candidate markers. (C). The heatmap revealed the correlations between the expression levels of 34 candidate genes and IDH1 status. Those that were significantly and differentially upregulated in LGGs with wild-type IDH1 were selected as candidate markers. (D). The hierarchical method revealed the most qualified candidate markers that were compatible with all of our criteria.
Biology 10 00701 g001
Figure 2. Identification of the putative marker that was upregulated in patients with a shorter overall survival and had highly prognostic significance in LGGs. (A). The heatmap revealed the correlations of patients’ overall survival with the clinicopathological features and the expression levels of the 12 candidate markers in the TCGA LGG cohort. (B). The prognostic significance and the hazard ratios of the 12 candidate markers were compared with those of the clinicopathological features to identify the putative marker. The median value of gene expression levels was used as a cutoff value to define high and low expressions of specific genes.
Biology 10 00701 g002
Figure 3. The correlations of BICD1 downregulation with the WHO grade, histological subtypes, and the KPS of LGG patients. (A). The heatmap and the t-test analyses revealed the correlations of BICD1 downregulation with the WHO grade and the histological subtypes of LGGs in the TCGA LGG cohort. (B). The heatmap and the t-test analysis revealed the correlations between the expression levels of BICD1 and the KPS of patients in the TCGA LGG cohort.
Biology 10 00701 g003
Figure 4. The correlations of BICD1 downregulation with chromosome 1p19q codeleted status, the mutation status of IDH1, TP53, ATRX, and EGFR, patient age, gender, and the survival status of LGG patients. (A). The heatmap revealed the correlations of BICD1 downregulation with 1p19q codeleted status, the mutation status of IDH1, TP53, ATRX, and EGFR, patient age, gender, and the survival status of patients in the TCGA LGG cohort. (B). The t-test analyses revealed the correlations between the expression levels of BICD1 and the mutation status of IDH1, TP53, ATRX, and EGFR. (C). The t-test analyses revealed the correlation between the expression levels of BICD1 and 1p19q codeleted status. The expression levels of BICD1 were also demonstrated in four subgroups of LGGs stratified according to their IDH1 status, 1p19q codeleted status, and EGFR status. * According to the 2016 WHO classification of CNS tumors, LGGs with wild-type IDH1 and mutant EGFR could be considered to be glioblastoma (grade IV glioma) rather than LGGs (grade II and III gliomas). (D). The t-test and Pearson’s correlation analyses revealed the correlations of BICD1 expression with patient age, gender, and their survival status.
Biology 10 00701 g004
Figure 5. The prognostic role and significance of BICD1 downregulation and the improvement in prognostic accuracy when BICD1 expression was incorporated with IDH1 or EGFR mutation status to stratify LGG patients. (A). The Kaplan–Meier survival analyses revealed the prognostic role and significance of BICD1 downregulation when patients in the TCGA LGG cohort were stratified into two groups depending on their BICD1 expression (50% high vs. 50% low, 33.1% high vs. 66.9% low, 20.1% high vs. 79.9% low, and 10.0% high vs. 90.0% low, respectively). (B). The prognostic role and significance of IDH1 status in LGGs. (C). The prognostic role and significance of EGFR status in LGGs. (D). The improvement in prognostic accuracy when BICD1 expression was incorporated with IDH1 status to stratify LGG patients into four subgroups. The four subgroups of LGGs stratified by IDH1 status and BICD1 expression were ranked according to their HRs. (E). The improvement in prognostic accuracy when BICD1 expression was incorporated with EGFR status to stratify LGG patients into four subgroups. The four subgroups of LGGs stratified by EGFR status and BICD1 expression were ranked according to their HRs. In (D,E), the symbols “*” and “***” denote statistical p < 0.05 and 0.001, respectively.
Biology 10 00701 g005
Figure 6. The correlations of BICD1 downregulation with the well-known pathways associated with cancer progression. (A). The heatmap revealed the correlations of BICD1 downregulation with the expression status of a couple of markers involved in various pathways associated with cancer progression in the TCGA LGG cohort. (B). Pearson’s correlation analysis revealed the correlation between the expression levels of BICD1 and those of CD274 (PD-L1). (C). The correlation between BICD1 expression and GSK3B expression. (D). The correlations of BICD1 expression with HGF expression and MET expression. (E). The correlations of BICD1 expression with JAK2 expression, STAT3 expression, and SOCS3 expression. (F). The correlation between BICD1 expression and MTOR expression. (G). The correlation between BICD1 expression and EGFR expression. (H). The correlation between BICD1 expression and IDH1 expression. (I). The correlation between BICD1 expression and HIF1A expression. (J). The correlation between BICD1 expression and ALDH2 expression.
Biology 10 00701 g006
Figure 7. Validating the prognostic role and significance of BICD1 downregulation and its correlations with the clinicopathological features in other LGG datasets. (A). The t-test analyses revealed the correlations of BICD1 expression with the WHO grade, IDH1 status, 1p19q codeleted status, and survival status in LGGs in the CGGA dataset. The differential expression of BICD1 in LGG subgroups stratified by their IDH1 status and 1p19q codeleted status is also shown. (B). The Kaplan–Meier survival analyses revealed the prognostic role and significance of BICD1 downregulation in LGGs in the CGGA dataset. (C). The prognostic role and significance of IDH1 status in LGGs in the CGGA dataset. (D). The improvement in prognostic accuracy when BICD1 expression was incorporated with IDH1 status to stratify LGG patients into four subgroups. The four LGG subgroups stratified by IDH1 status and BICD1 expression were ranked according to their HRs. The symbol “***” denotes statistical p < 0.001. (E). Pearson’s correlation analyses revealed the correlation between the expression level of BICD1 and that of CD274 (PD-L1) in LGGs in the CGGA dataset. (F). The expression levels of BICD1 and CD274 (PD-L1) in eight LGG cell lines in the CCLE dataset. Pearson’s correlation analysis revealed the correlation between the expression level of BICD1 and that of CD274 (PD-L1).
Biology 10 00701 g007
Figure 8. Possible pathways associated with BICD1 downregulation in LGGs. A summary of the high correlations between BICD1 downregulation and several well-known pathways associated with cancer progression.
Biology 10 00701 g008
Publisher’s Note: MDPI stays neutral with regard to jurisdictional claims in published maps and institutional affiliations.