Article

Assessment of Various Toxicity Endpoints in Duckweed (Lemna minor) at the Physiological, Biochemical, and Molecular Levels as a Measure of Diuron Stress

1
Department of Marine Science, Incheon National University, 119 Academy-ro, Yeonsu-gu, Incheon 22012, Korea
2
Ghent University Global Campus, 119-5 Songdomunhwa-ro, Yeonsu-gu, Incheon 21985, Korea
3
Water Environmental Engineering Research Division, National Institute of Environmental Research, 42 Hwangyeong-ro, Seo-gu, Incheon 22689, Korea
4
Division of Life Sciences, Incheon National University, 119 Academy-ro, Yeonsu-gu, Incheon 22012, Korea
*
Author to whom correspondence should be addressed.
Biology 2021, 10(7), 684; https://doi.org/10.3390/biology10070684
Submission received: 13 June 2021 / Revised: 8 July 2021 / Accepted: 15 July 2021 / Published: 20 July 2021
(This article belongs to the Section Toxicology)

Abstract

:

Simple Summary

The presence of diuron in a variety of environments has been reported worldwide to exert serious harm to human health and the ecosystem. HPLC and mass spectrometry are highly specific and sensitive methods for herbicide detection, but they have several drawbacks including complex sample preparation procedures, the need for expensive chemicals and equipment, and interference from secondary contaminants during analysis. In addition, these purely chemical approaches do not provide ecologically meaningful information on temporal changes in terms of exposure or the interactive effects of pollutants. In order to compensate for these limitations, biological assays have been used to assess pollutant-induced ecological risks. Lemna minor is an attractive experimental model organism that has been used for decades for the prospective risk assessment of pesticides. In the current study, we examined the effects of diuron on L. minor using different endpoints at the physiological (growth and photosynthetic efficiency), biochemical (pigment biosynthesis and reactive oxygen species (ROS) levels), and molecular (gene transcription) levels. Our findings provide important insight into the relative sensitivity of different endpoints for diuron toxicity assessment. In addition, they shed light on the toxicity mechanisms of diuron in a model aquatic macrophyte species.

Abstract

The common, broad-spectrum herbicide diuron poses some risks to the environment due to its long persistence and high toxicity. Therefore, the effective monitoring of diuron residues will inform efforts to assess its impacts on ecosystems. In this study, we evaluated the toxicity targets of diuron in the model aquatic macrophyte Lemna minor at the physiological (growth and photosynthetic efficiency), biochemical (pigment biosynthesis and reactive oxygen species (ROS) levels), and molecular (rbcL transcript) levels. The toxicity of diuron was detectable after 48 h of exposure and the order of sensitivity of toxicity endpoints was gene transcription > maximum electron transport rate (ETRmax) > non-photochemical quenching (NPQ) > maximum quantum yield (Fv/Fm) > ROS > fresh weight > chlorophyll b > chlorophyll a > total frond area > carotenoids. Under diuron stress, pigment, ROS, and gene transcript levels increased while frond area, fresh weight, and photosynthesis (Fv/Fm and ETRmax) gradually decreased with the increasing duration of exposure. Notably, ROS levels, Fv/Fm, frond area, and fresh weight were highly correlated with diuron concentration. The growth endpoints (frond area and fresh weight) showed a strong negative correlation with ROS levels and a positive correlation with Fv/Fm and ETRmax. These findings shed light on the relative sensitivity of different endpoints for the assessment of diuron toxicity.

1. Introduction

Herbicides have widespread applications in agriculture, horticulture, and the maintenance of green spaces such as parks, golf courses, and sports fields [1]. However, 99.7% of the applied load of herbicides is dispersed as residues that enter the aquatic environment through runoff and leaching [2,3]. This can have both direct and indirect negative effects on the aquatic biota and these effects are detectable at multiple levels of biological organization, such as from the molecular to the ecosystem level. There is increasing public awareness of the potential risks that herbicides pose not only to water quality and non-target organisms, but also to human health [4]. Therefore, effective monitoring and management strategies must be developed to maintain the integrity of aquatic ecosystems. Such strategies must be underpinned by accurate quantitative data on both the detection of herbicides in aquatic ecosystems and their risks to aquatic life.
One of the most common herbicides, which is the phenylurea herbicide diuron {3-(3,4-dichlorophenyl)-1,1-dimethylurea)}, has been used in agriculture for over 50 years to inhibit the growth of various annual and perennial weeds, mosses, and agricultural crops [5,6]. Diuron can spread throughout aquatic systems through soil leaching and causes severe environmental pollution and ecological hazards in nearby water bodies [7]. Diuron is a photosystem II (PSII) inhibitor that restricts photosynthetic activity in plants by binding to the D1 protein in thylakoids and strongly blocks re-oxidation of the primary electron acceptor (QA) [8,9]. This PSII inhibitor causes oxidative damage within plant cells via the production of reactive oxygen species (ROS), such as superoxide, hydroxyl radicals, and H2O2, and reduces CO2 fixation and plant growth [10,11,12]. Inhibition of the photosynthetic apparatus by diuron can result in changes in community composition by altering the pigment content (even at low concentrations) and reducing the biomass of important primary producers [13].
The presence of diuron in a variety of environments has been reported worldwide, with concentrations ranging from 0.1–12 ng L−1 in seawater to 4,620 ng L−1 in freshwater near farmlands and an average of 46.6 × 10³ ng L−1 in sewage treatment plant sludge [14,15,16]. The half-life of diuron is more than 300 days in groundwater, surface water, and soil as it has relatively stable phenylurea properties [17,18]. In addition, due to the presence of chlorinated groups, diuron has strong toxicity and resistance to biochemical degradation as well as long-term environmental subsistence and high bioaccumulation, resulting in serious harm to human health and the ecosystem [19,20,21]. Due to its high ecotoxicity, the US Environmental Protection Agency and the European Commission have classified diuron as a priority pollutant [22]. Therefore, effective monitoring of diuron residues in aquatic environments is of increasing interest [6].
Sophisticated analytical methods such as high-performance liquid chromatography (HPLC) and mass spectrometry are commonly used to measure herbicide residues. However, chemical analysis is a highly specific and sensitive method for herbicide detection, that has several drawbacks including complex sample preparation procedures, the need for expensive chemicals and equipment, and interference from secondary contaminants during analysis [23]. In addition, this purely chemical approach does not provide ecologically meaningful information on temporal changes in exposure or the interactive effects of pollutants [24]. In order to compensate for these limitations, biological assays have been used to assess pollutant-induced ecological risks. In particular, aquatic bioassays are important tools to assess the quality of water containing mixtures and unknown pollutants and to provide safety standards for water management in an ecological context that cannot be expected from conventional chemical analysis-based management since the latter method relies on measurements of single and standardized chemicals. The choice of a model organism for toxicity testing depends on its sensitivity to specific pollutants.
Aquatic macrophytes belonging to the family Lemnaceae, which are commonly known as duckweeds, are attractive experimental model organisms for several reasons; these include their simple structure, homogeneity, ease of culture, and high growth rates [25,26]. They are small vascular plants consisted of floating leaves and submerged roots and they usually grow in stagnant or slow-flowing nutrient-rich water [27,28]. In addition, these plants play an important ecological role as primary producers, are widely distributed in freshwater ecosystems, and are highly sensitive to organic and inorganic substances such as herbicides, pharmaceuticals, and metals [25,29,30]. Therefore, duckweeds have been used for decades in the United States and Europe to assess the effects of a wide range of pollutants [31]. In particular, Lemna minor is a preferred test species because it is a model for ecotoxicology, relative metabolomics studies have been conducted, and the toxic potential of biologically active compounds in the aquatic environment has been demonstrated using this species [32,33,34,35]. The International Organization for Standardization (ISO) and the Organization for Economic Co-operation and Development (OECD) have developed a standard growth inhibition test using L. minor.
The ultimate goal of bioassay testing is to provide representative and inclusive criteria for exposure conditions, thereby improving risk assessment and water quality management. In this respect, multiple rather than single endpoint testing shows greater potential for more comprehensive risk assessment of toxics. Such an approach provides important insight into the mechanisms underlying toxicity, as well as the relative sensitivity of measured endpoints to toxicant concentration and/or exposure duration, thereby identifying specific endpoints that can effectively detect perturbations by specific phytotoxicants [36]. Many endpoints have been applied to Lemna, including frond number, plant number, root number, dry or fresh biomass, frond diameter or area, root length, carbon uptake, chlorophyll content, and so on [30].
In the current study, we examined the effects of diuron on L. minor using different endpoints at the physiological (growth and photosynthetic efficiency), biochemical (pigment biosynthesis and reactive oxygen species (ROS) levels), and molecular (gene transcription) levels. Our findings provide important insight into the relative sensitivity of different endpoints for diuron toxicity assessment. In addition, they shed light on the toxicity mechanisms of diuron in a model aquatic macrophyte species.

2. Materials and Methods

2.1. Plant Materials and Culture Conditions

L. minor was collected from a shallow pond in Donam-dong, Sangju-si, Korea (36°26′48″ N, 128°15′22″ E). The Lemna stock culture was maintained in the laboratory at 25 ± 2 °C under 30–40 μmol photons m−2 s−1 of continuous light provided by square white LED (Light Emitting Diode) panel lights (340 × 500 × 10 mm; Daewon, Bucheon, Korea). The cultures were maintained in Steinberg growth medium [37] in polypropylene containers (103 × 78.6 mm).

2.2. Diuron Toxicity Testing

The diuron toxicity test was carried out in a controlled environment chamber at 25 ± 2 °C and continuous light of 100 ± 10 μmol photons m−2 s−1. The test vessels were 6-well plastic plates (well dimension 34.8 mm in diameter, SPL, Seoul, Korea). Each well contained 10.0 mL of test solution and five Lemna minor plants, each comprising two fronds (n = 3 plates). Diuron stock solutions were prepared in dimethyl sulfoxide (DMSO; ≥99.9%; CAS No. 67-68-5; Sigma-Aldrich, St. Louis, MO, USA) and were diluted to the desired concentrations (50 × 103 ng L−1 and 50 × 104 ng L−1) with Steinberg medium.
Plants were harvested for measurement of the different endpoints after 24, 48, and 72 h of exposure.

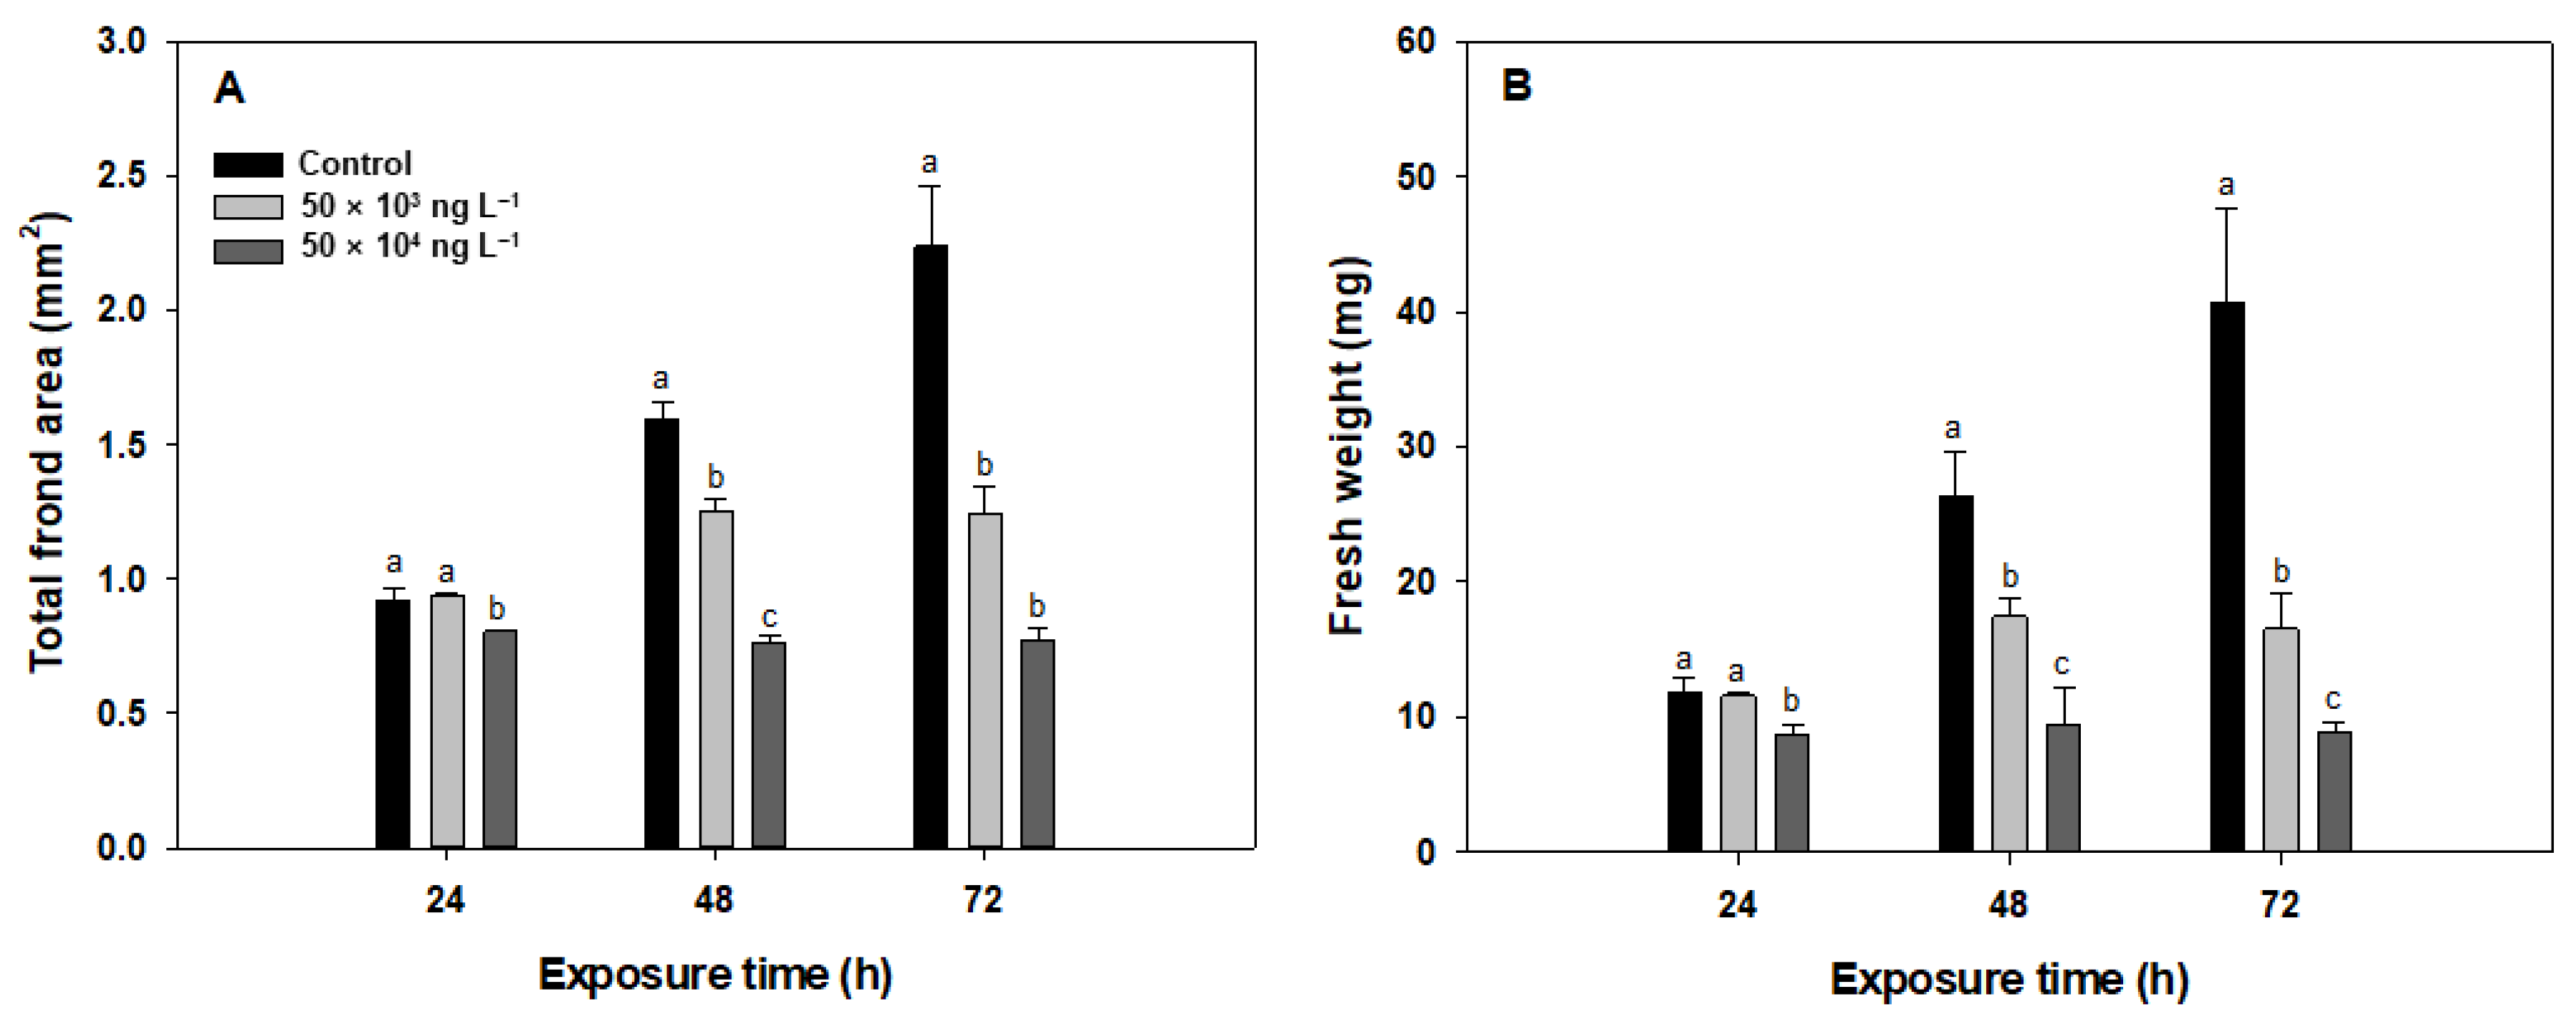
2.2.1. Measuring Total Frond Area and Fresh Weight

Following 24, 48, and 72 h of exposure to different concentrations of diuron, the changes in surface area of the plants were measured with an image analyzer. The fronds were then dried on a paper towel and weighed to determine their fresh biomass.

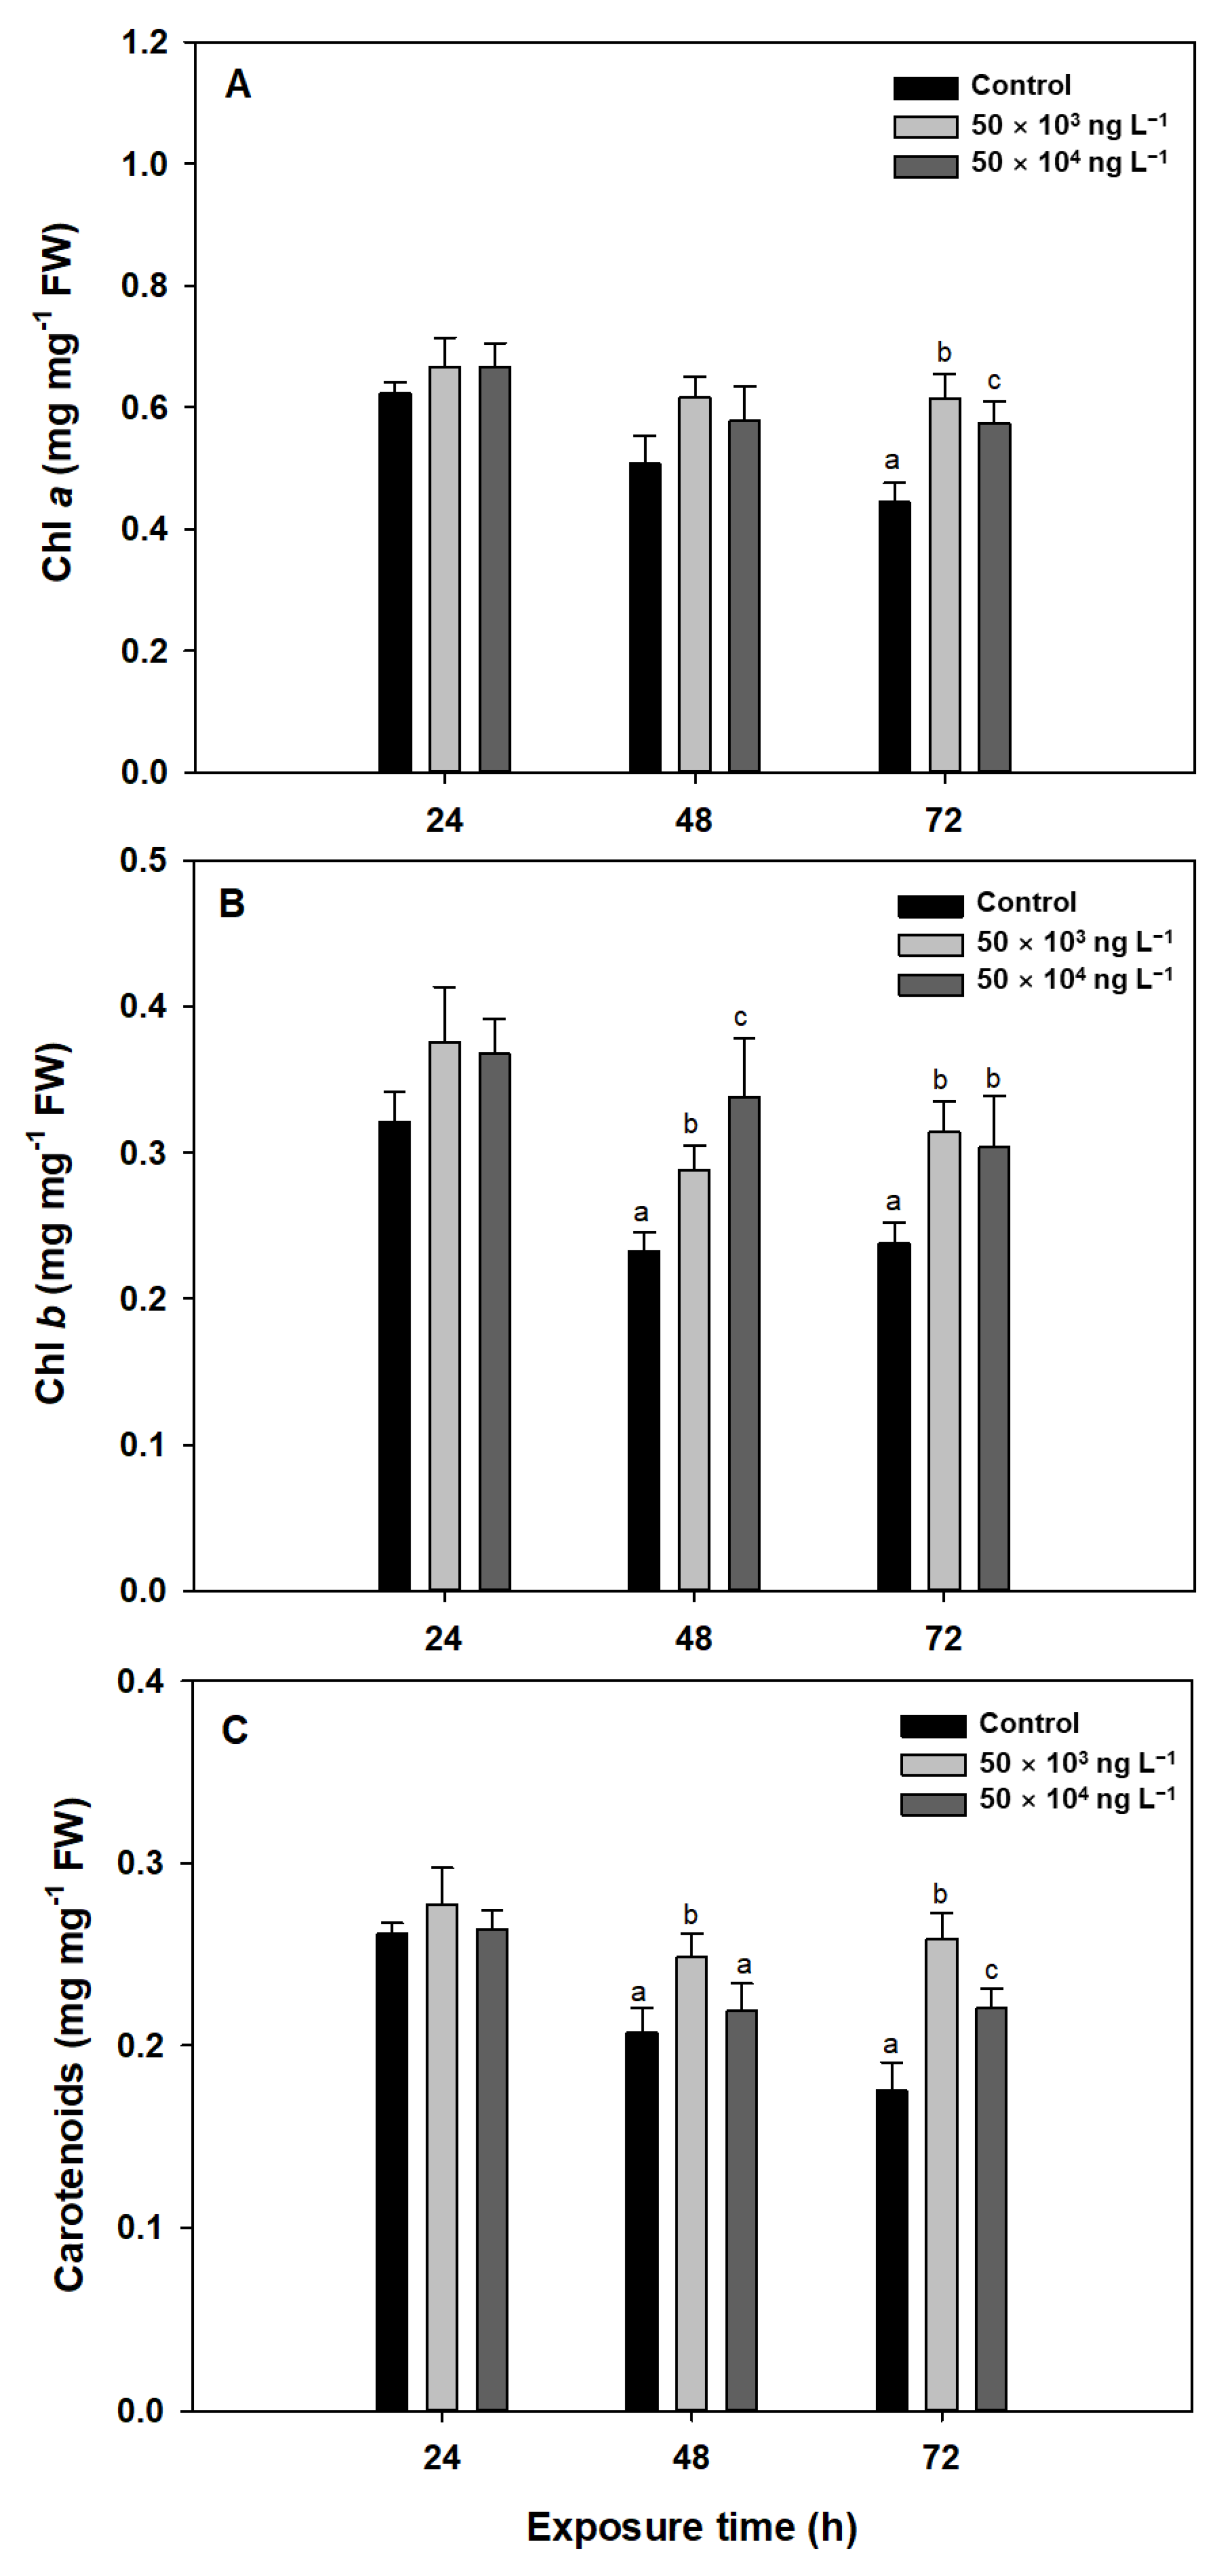
2.2.2. Pigment Contents

Chlorophyll a and b (Chl a and b) and carotenoids were extracted from approximately five L. minor plants in 1 mL methanol (CH3OH; ≥99.9%; CAS No. 67-56-1; Sigma-Aldrich, Co., St. Louis, MO, USA) for 24 h in the dark at 4 °C. The absorption of the supernatant of the methanolic extract was measured using a Scinco S-3100 PDA UV-Vis spectrophotometer at 666 nm (Chl a), 653 nm (Chl b), and 470 nm (carotenoids). Chl a, Chl b, and carotenoid contents were estimated using the equations described in Lichtenthaler [38]

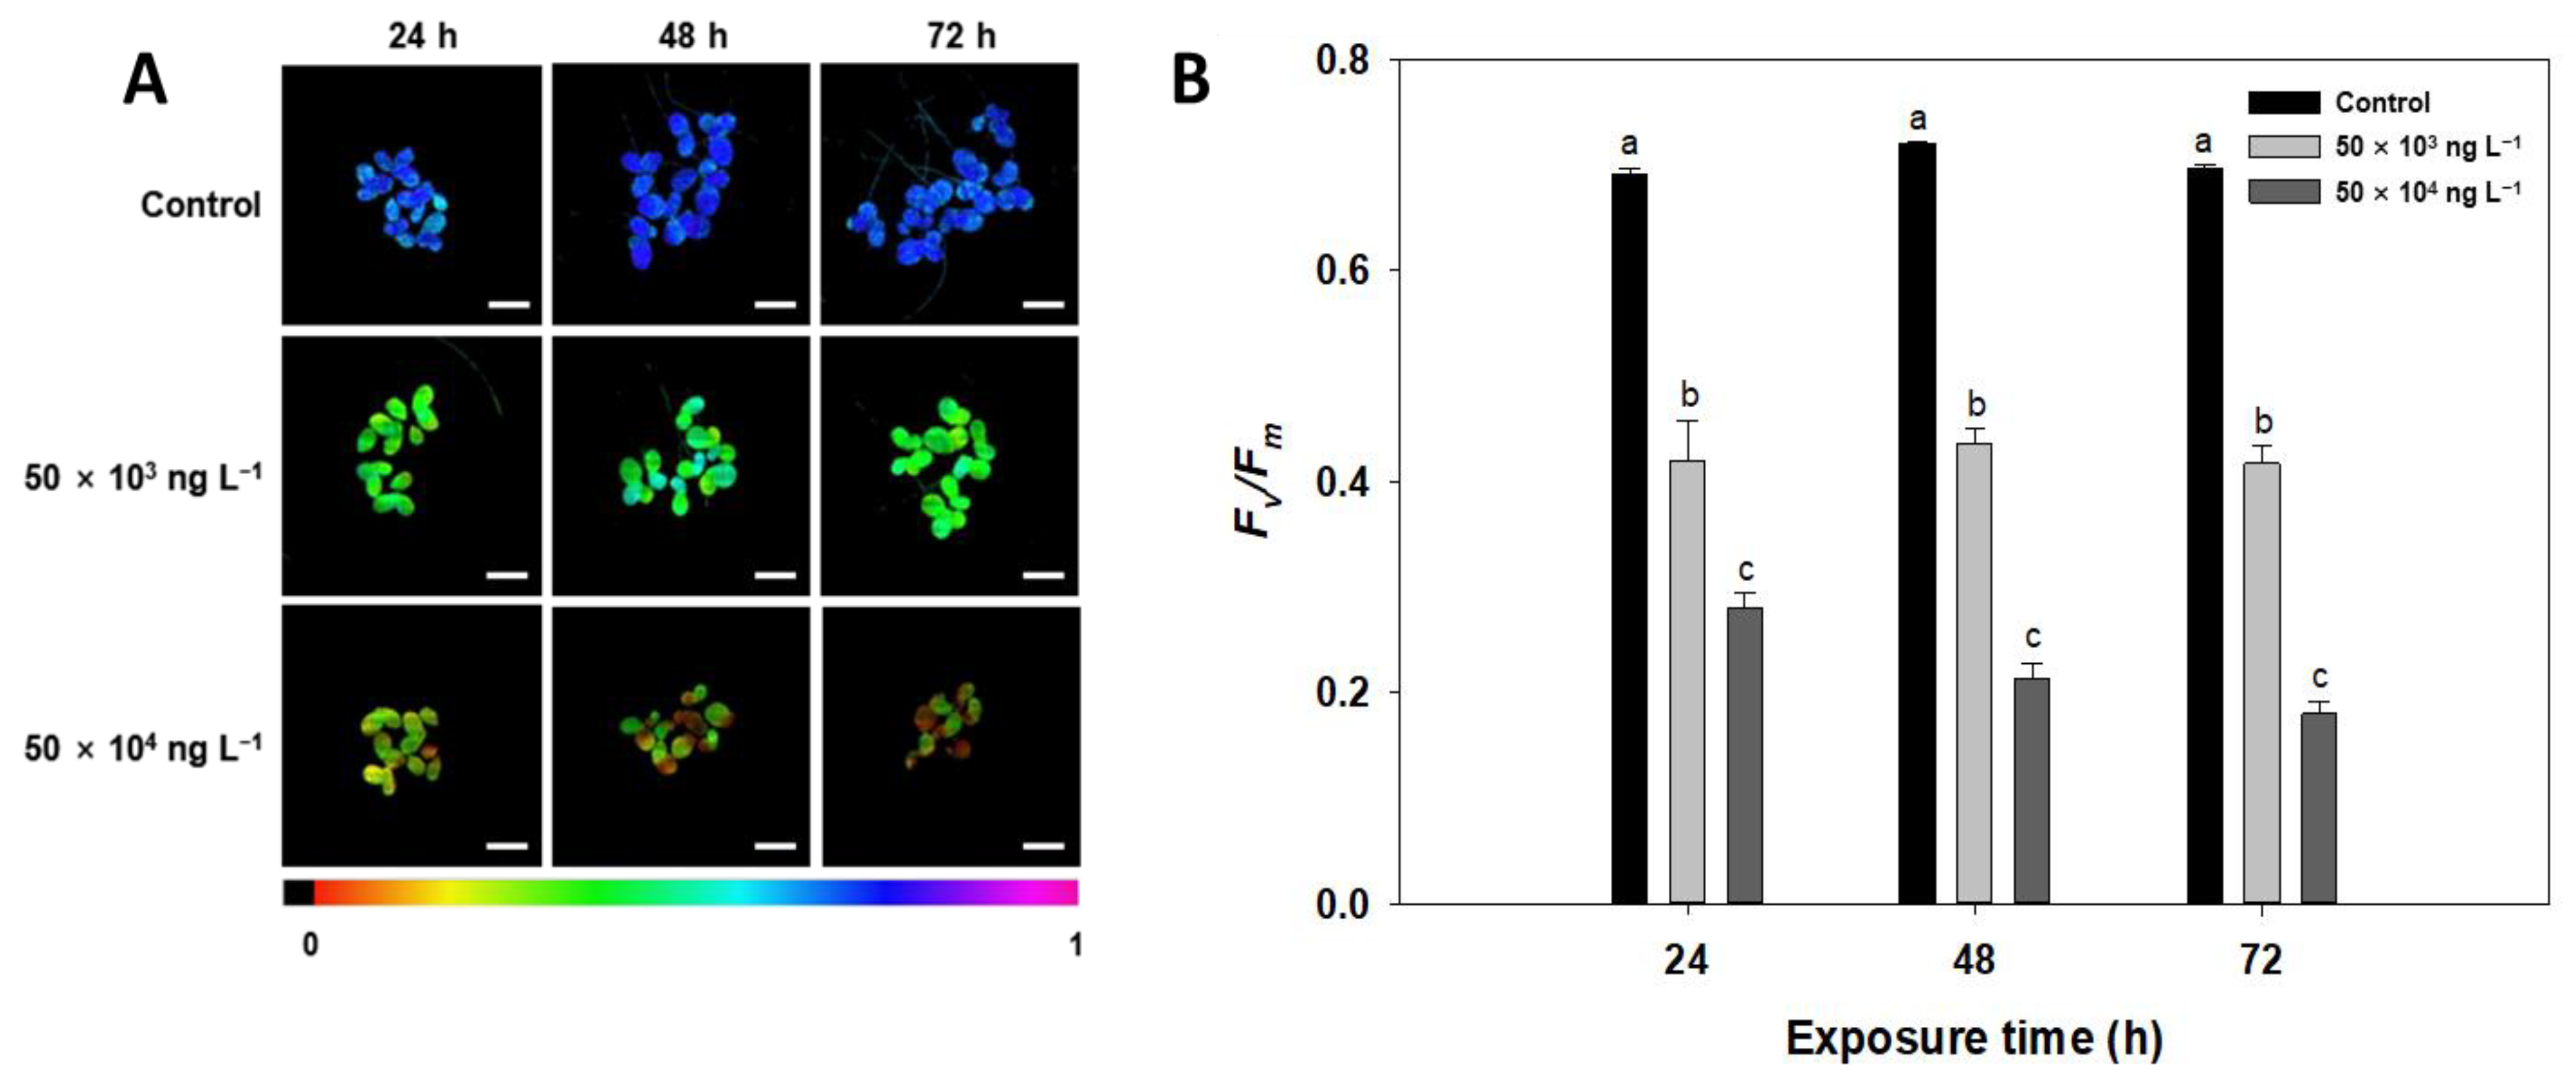
2.2.3. Chlorophyll a Fluorescence

Chl a fluorescence was measured using a pulse amplitude modulated imaging fluorometer (I-PAM, Walz, Effeltrich, Germany). After 24, 48, and 72 of exposure, the samples were dark-adapted for 15 min and exposed to LED light pulses (0.15 µmol photons m−2 s−1) to determine the initial fluorescence yield (Fo). The maximum fluorescence yield (Fm) was measured by applying a saturation pulse of approximately 5000 µmol photons m−2 s−1 emitted from the built-in halogen lamp. The maximum PSII quantum yield (Fv/Fm) was calculated using the following equation.
Fv/Fm = (FmFo)/Fm
Rapid light curves (RLCs) were derived using 10 s pulses of actinic light that increased stepwise from 0 to 1517 μmol photons m−2 s−1 [39]. The maximum electron transport rate (ETRmax) was derived from the hyperbolic tangent equation adapted from Platt et al. [40]:
ETRmax = (1 exp (α × I/Pt)) × exp (−β × I/Pt)
where α represents the rate of electron transport under light-constrained conditions, Pt is a theoretical parameter and β is an inhibition coefficient.
Non-photochemical quenching (NPQ) was quantified following Bilger and Björkman in the following equation [41].
NPQ = (Fm − Fm)/Fm
where Fm represents the maximum fluorescence yield of a light acclimated state.

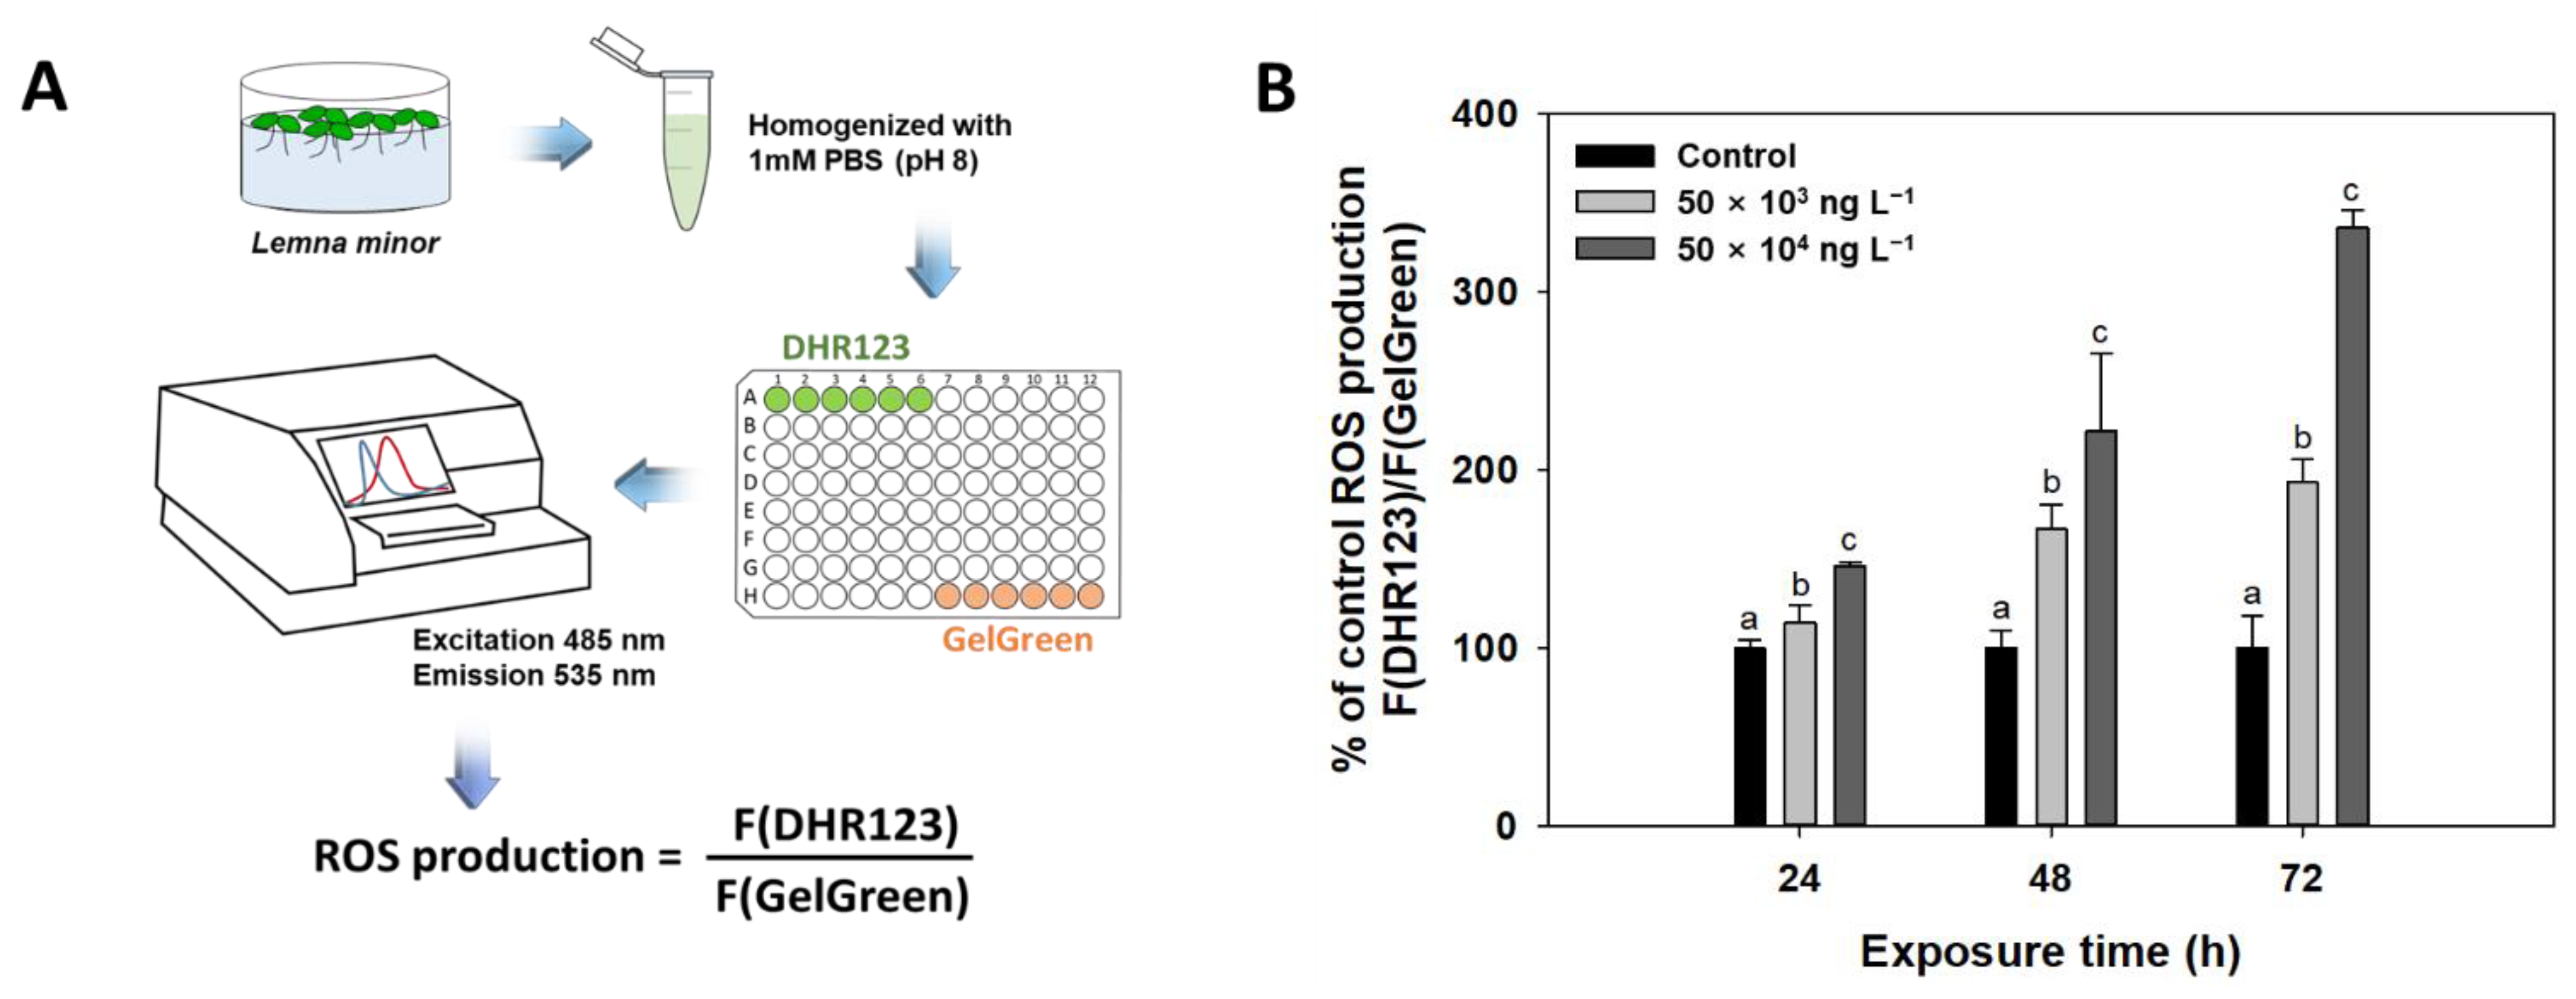
2.2.4. Reactive Oxygen Species (ROS) Measurements

ROS production was measured using DHR123 (dihydrorhodamine; Life Technologies, Carlsbad, CA, USA), which is oxidized to a fluorescent compound (rhodamine 123) upon reaction with ROS [42,43]. Briefly, supernatants from L. minor homogenates containing 1 mM phosphate-buffered saline (PBS; pH 8) were incubated with 30 μM DHR-123 for 20 min at room temperature. Fluorescence was measured at an excitation wavelength of 485 nm and an emission wavelength of 535 nm. ROS production in each sample was quantified based on the amount of DNA measured by GelGreen (Biotium, Fremont, CA, USA) nucleic acid staining.

2.2.5. RNA Extraction, cDNA Synthesis, and RT-PCR Analysis

Whole plants with fronds and roots were harvested, ground in liquid nitrogen, and total RNA was extracted from the samples using a RNeasy Plant Mini Kit (Qiagen, Hilden, Germany) as per the manufacturer’s protocol. RNA concentrations were determined using a Nanodrop UV spectrophotometry (Thermo Fisher Scientific, Waltham, MA, USA). cDNA was generated from 1 μg of total RNA from L. minor using a Diastar RT Kit (SolGent Co., Ltd, Daejeon, Korea).
Primers for quantitative reverse-transcription PCR (qRT-PCR) are summarized in Table 1. qRT-PCR was performed using a CFX Connect Real-Time PCR Detection System (Bio-Rad, Hercules, CA, US). Each 10 μL reaction mixture contained 5 μL of 2X RT PCR Smart Mix (with SYBR Green) (SolGent Co., Ltd, Daejeon, Korea), 10 nM of each primer, and 1 μL of diluted first-strand cDNA. The cycling conditions were as follows: 95 °C for 5 min followed by 40 cycles of 94 °C for 30 s, 57 °C for 30 s, and 70 °C for 10 s in 96-well optical reaction plates. Cycle threshold (CT) values were determined for three biological replicates, with three technical replicates for each value. The expression levels of the reference gene (18S rRNA) and target gene (rbcL) tested were determined based on the Ct values and were calculated using the 2△△CT method [44].

2.3. Statistical Analysis

Data were analyzed by one-way analysis of variance (ANOVA) and post-hoc comparisons were performed via the least significant difference (LSD) test to determine differences among treatments. Correlation analysis between 10 endpoints and diuron concentration was performed using the R package ggplot2 (R version 4.0.5). For all tests, p < 0.05 was considered statistically significant.

3. Results and Discussion

3.1. Total Frond Area and Fresh Weight

The most commonly measured endpoint in Lemna tests is the frond area. Therefore, we compared the sensitivity of frond area to diuron with that of other endpoints. Total frond area and fresh weight of L. minor decreased significantly (p < 0.05) as a function of exposure time and concentration of diuron. Diuron has been reported to inhibit plant growth by interfering with electron flow in photosystem II during photosynthesis, resulting in reduced carbon uptake and cessation of carbohydrate production [46]. Both the total frond area and fresh weight are considered to be a result of the overall response to the toxicant and, therefore, follow the changes in the biochemical and physiological processes at cellular and tissue levels.
As shown in Figure 1, total frond area and fresh weight decreased by approximately 2% compared to the control after 24 h of exposure to both concentrations of diuron. After 48 and 72 h of diuron exposure, the decreases in the total frond area were 20% (159 mm2 to 126 mm2) and 43% (223 mm2 to 124 mm2) at 50 × 103 ng L−1 and 52% (159 mm2 to 76 mm2) and 65% (223 mm2 to 77 mm2) at 50 × 104 ng L−1 diuron, respectively (Figure 1A). For fresh weight, 34% (26 mg to 17 mg) and 59% (41 mg to 17 mg) inhibitions were observed at 50 × 103 ng L−1 diuron after 48 and 72 h of exposure, respectively, and reductions of 64% (26 mg to 9.0 mg) and 78% (41 mg to 9.0 mg) were observed after 48 and 72 h of exposure, respectively, at 50 × 104 ng L−1 (Figure 1B).

3.2. Photosynthetic Pigments

Short-term acute reactions to diuron, as revealed by fluorescent indicators, are potentially reversible, but the diuron can destroy chlorophyll and carotenoids (such as xanthophyll) along with cell membranes upon prolonged exposure which causes irreversible damage [47]. This damage can increase the overall leaf spectral reflectance and the ratio of accessory pigments to chlorophyll [47]. The contents of chlorophylls and carotenoids after exposure to diuron are shown in Figure 2. After 72 h of exposure to 50 × 103 and 50 × 104 ng L−1 diuron, Chl a content increased significantly by 38% (0.44 mg mg−1 FW to 0.61 mg mg−1 FW) and 29% (0.44 mg mg−1 FW to 0.57 mg mg−1 FW), respectively (Figure 2A). However, Chl a content was not significantly affected by 24 or 48 h diuron treatment (Figure 2A). The Chl b content increased in response to 48 and 72 h of diuron exposure. The amount of Chl b was 23% (0.23 mg mg−1 FW to 0.29 mg mg−1 FW) (48 h exposure) and 32% (0.24 mg mg−1 FW to 0.31 mg mg−1 FW) (72 h exposure) higher at a diuron concentration of 50 × 103 ng L−1 compared to the control (Figure 2B). The carotenoid content also increased significantly after 48 and 72 h of diuron exposure. Even at a diuron concentration of 50 × 103 ng L−1, carotenoid levels were increased by 19% (0.21 to 0.25) and 47% (0.18 to 0.26) when compared to levels in the control after 48 and 72 h of exposure, respectively (Figure 2C).
In plants exposed to diuron-type herbicides, an increase in chlorophyll content was observed, which was attributed to the induction of shade-type chloroplast formation by these herbicides [48]. Shade-type chloroplasts have ultrastructural modifications, such as wider grana and higher thylakoid stacks [49], which may have accommodated more pigments in the chloroplasts. Thus, the reason for the higher chlorophyll content in L. minor exposed to diuron than in the control L. minor could be due to the formation of shade-type chloroplasts with an accompanying increase in pigment content in diuron-exposed L. minor. For carotenoids, it is possible that carotenoids with antioxidant properties were increased in response to ROS production. Macinnis-Ng and Ralph [50] also reported that the total chlorophyll content of seagrass (Zostera capricorni) significantly increased after diuron treatment compared to the control group.

3.3. Chlorophyll a Fluorescence

In vivo Chl a fluorescence is a non-destructive, simple, and rapid quantitative indicator of changes in PSII activity caused directly or indirectly by stress [26,51]. The effect of diuron on PSII photochemical activity has been reported in several studies [10,26,52,53]. Accordingly, derivatives of diuron in water induceed a change in the Chl a fluorescence yield of PSII, which is quantitatively correlated with the concentration of this phenylurea herbicide. Fv/Fm reflects the integrity of the photosystem II/light-harvesting complex II (PSII/LHCII) complex or the intactness of the thylakoid membranes, indicating the intrinsic photochemical efficiency of PSII [54,55]. In the current study, by 24 h diuron exposure had already caused a significant reduction in Fv/Fm within the tested concentration range, to 39% (0.69 to 0.42) and 59% (0.69 to 0.28) of the control at 50 × 103 and 50 × 104 ng L−1, respectively. After 48 h of treatment, the Fv/Fm values decreased even further (Figure 3A,B). These results suggest that PSII/LHCII or thylakoid membranes are affected by diuron. Kumar and Han [24] also detected a significant decrease in Fv/Fm with increasing diuron concentration in L. minor (p < 0.001).
The photosynthetic electron transport rate (ETR) in a plant varies depending on the rate of photon absorption and the efficiency of PSII [56]. Diuron binds to the exchangeable quinine (QB) site of the D1 protein and blocks electron transport beyond the 1-electron reduction in the bound quinone QA, the first stable electron acceptor [24]. In the current study, the maximum electron transport rate (ETRmax) of L. minor exposed to diuron was significantly (p < 0.05) suppressed (by greater than ~90%) after 24 h of exposure (Table 2). This reduction in ETR may not only reduce ATP content but also nicotinamide adenine dinucleotide phosphate hydrogen (NADPH) content and plant growth [46]. Park et al. [26] showed that ETRmax is the most sensitive endpoint for diuron toxicity in L. minor.
Non-photochemical quenching (NPQ) is the fraction of excess energy dissipated as heat by the NPQ photo-protective mechanism [57]. Due to its high sensitivity and rapid response, NPQ is one of the most appropriate indicators of phytotoxicity [58]. Significant reductions in NPQ have been reported in L. minor, especially in the presence of 12.5 × 10³ ng L−1 diuron [24]. Han et al. [59] suggested that a toxicant (i.e., copper (Cu)) may reduce the rate of reactions in the P680-pheophytin-QA-QB pathway or the electron transport chain. Furthermore, according to Brack and Frank [60], urea herbicides simultaneously reduce photochemical and non-photochemical quenching due to blockages in the electron transport chain. Thus, non-photochemical quenching is also reduced since the proton motive force cannot be built up without electron transport. Therefore, the decrease in NPQ in L. minor observed in the current study is likely due to the decrease in the ETR. NPQ values decreased from 0.6 to 0.3 in response to all diuron treatments after 48 and 72 h of exposure (Table 2).

3.4. Reactive Oxygen Species (ROS)

ROS produced by plants subjected to biological and abiotic stress induce oxidative stress [61]. ROS inhibit chloroplast development in plants, reduce seed survival and root growth, stimulate frond separation and desiccation, and trigger peroxidation of essential membrane lipids in intracellular plasma membranes and organelles [24,62]. Here, we observed a concentration-dependent increase in ROS levels in response to diuron exposure (Figure 4A). As shown in Figure 4B, the ROS concentrations in L. minor increased with increasing diuron concentration. Compared to the control, 50 × 103 and 50 × 104 ng L−1 diuron increased ROS levels 1.1-fold (100% to 115%) and 1.5-fold (100% to 153%), respectively, after 24 h of exposure; 1.4-fold (100% to 136%) and 2.3-fold (100% to 228%), respectively, after 48 h of exposure; and 2.1-fold (100% to 207%) and 3.6-fold (100% to 363%), respectively, after 72 h of exposure. In addition, diuron causes the depletion of ascorbate, which is a major non-enzymatic antioxidant, and weakens antioxidant enzyme activity in L. minor [63].

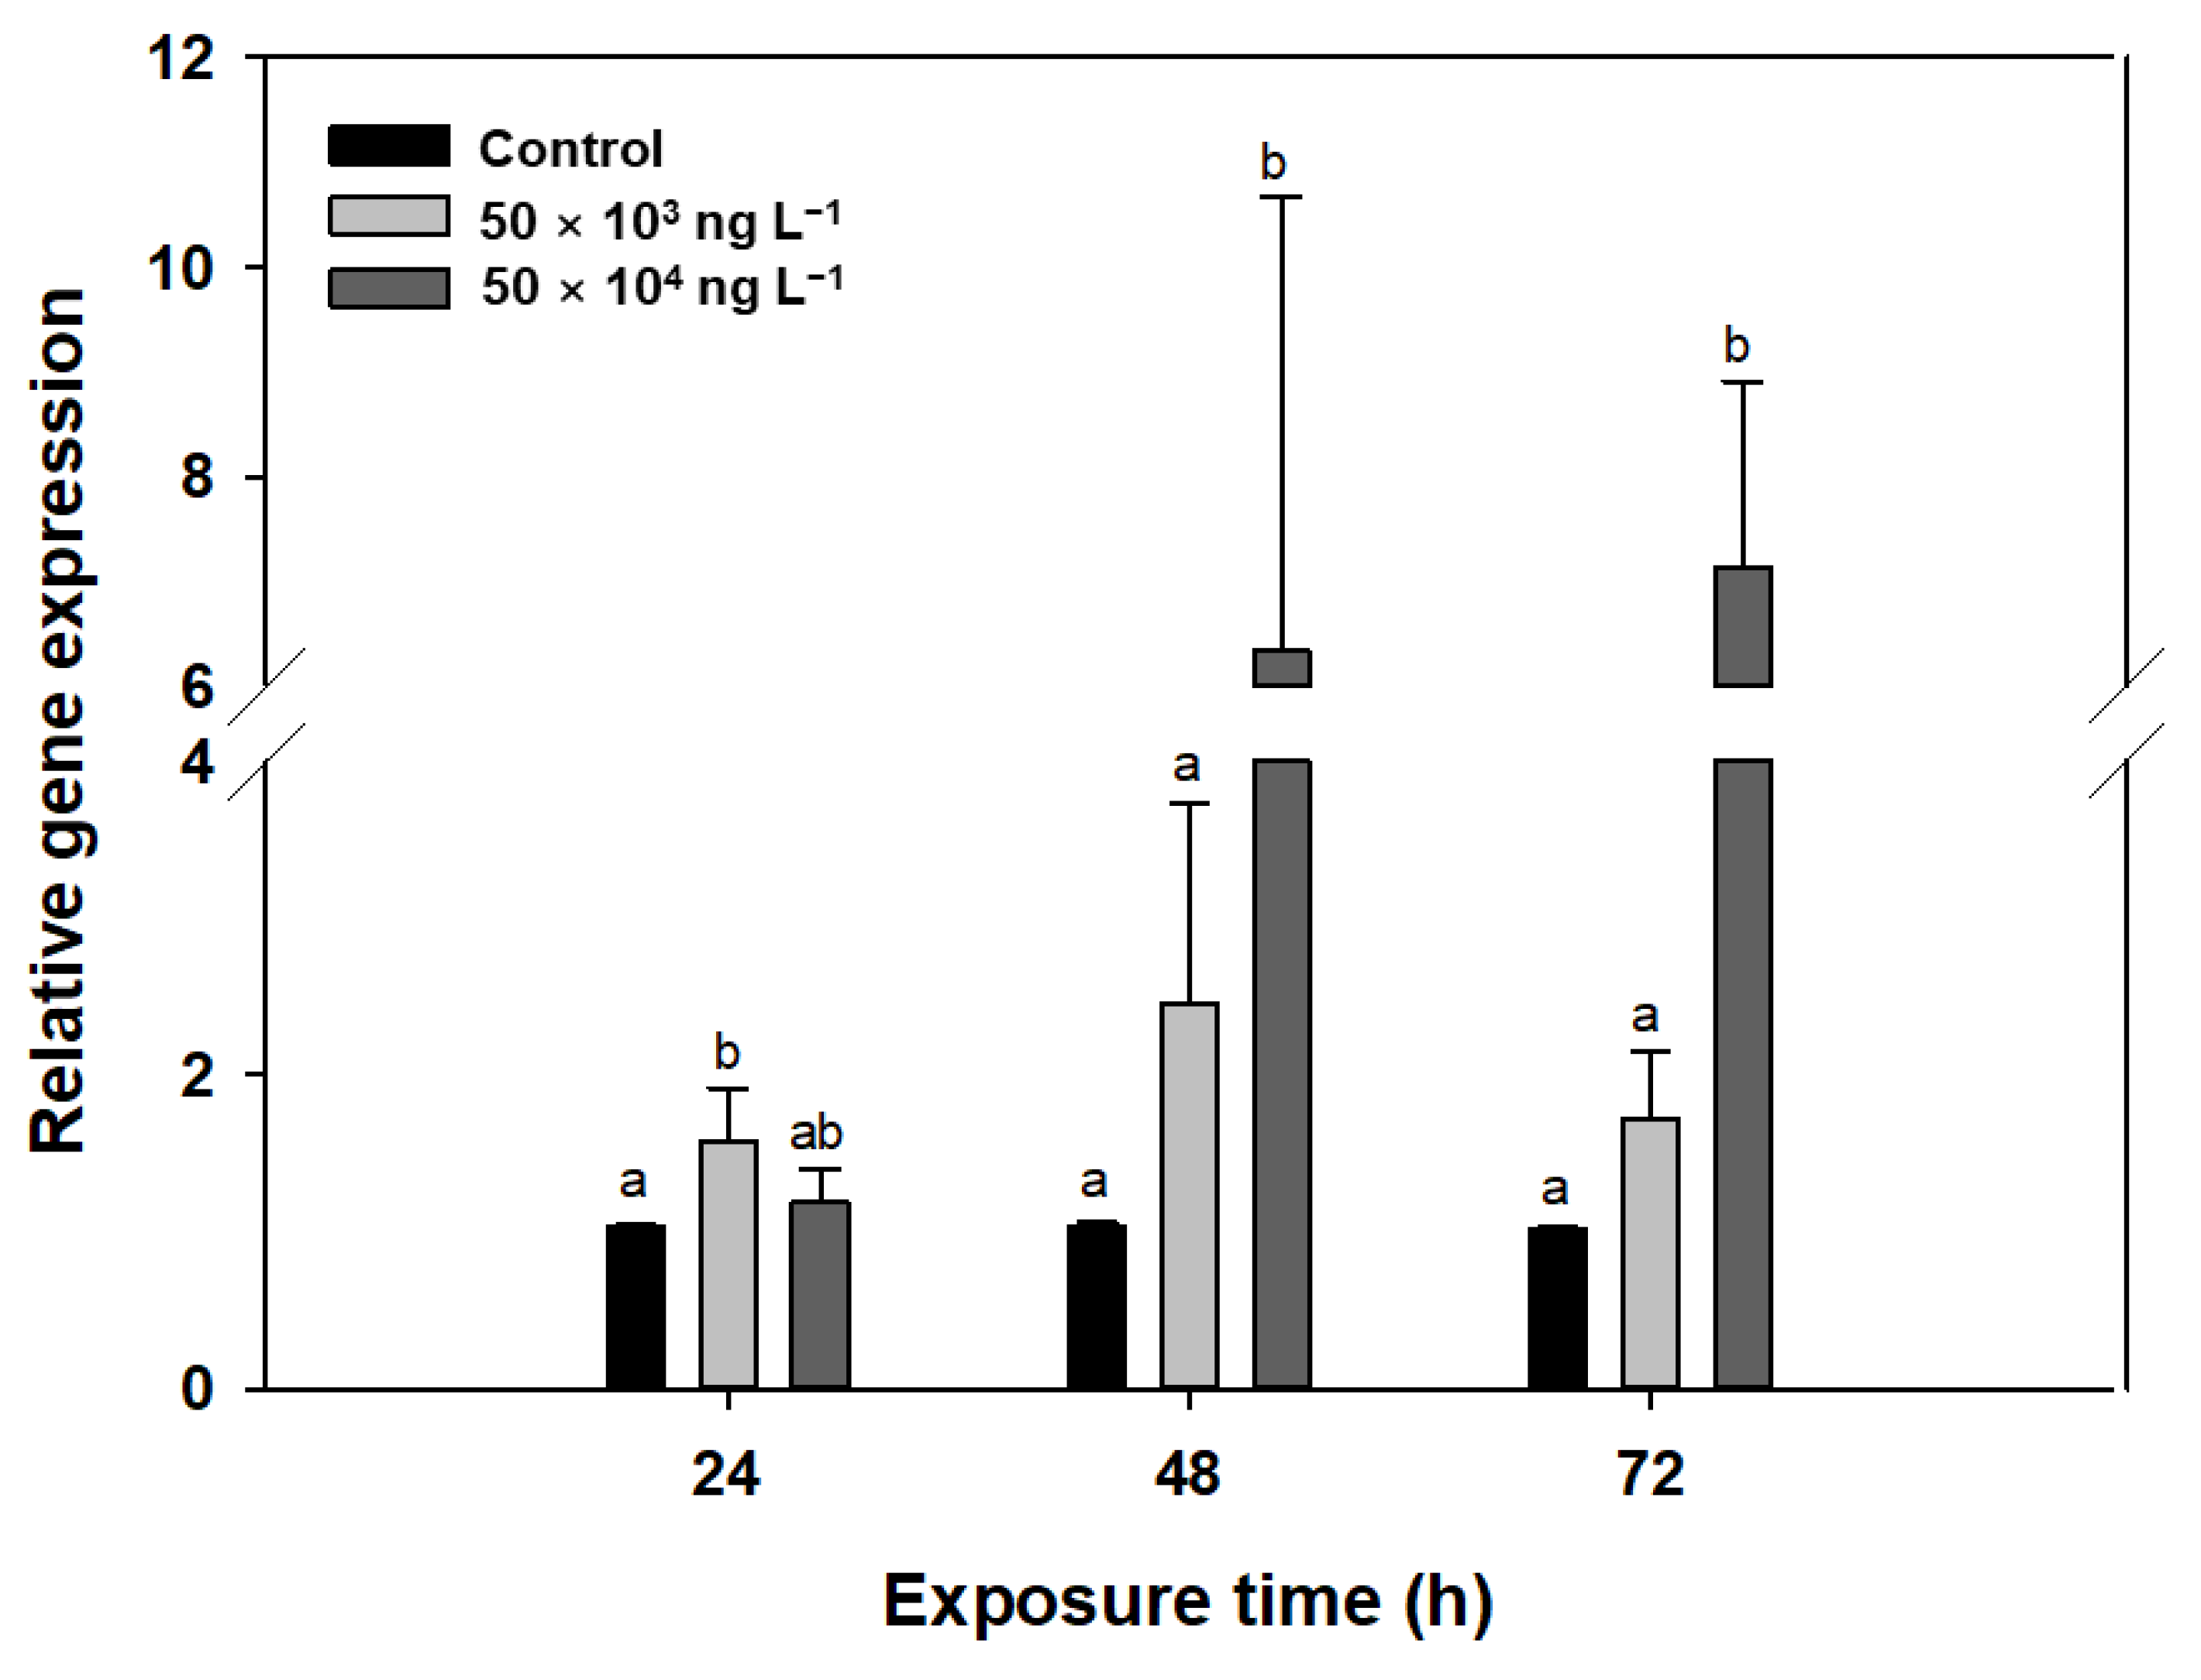
3.5. Gene Transcription

The transcript levels of rbcL, which is the gene encoding Rubisco [64], were significantly higher than those in the control after 48 and 72 h of exposure to diuron, reaching 236% (1.0 to 2.5) and 169% (1.0 to 1.7) of the mean transcript levels in the control following exposure to 50 × 103 ng L−1 diuron and 610% (1.0 to 6.3) and 702% (1.0 to 7.1) following exposure to 50 × 104 ng L−1 diuron, respectively (Figure 5). Perhaps this upregulation of gene transcription represents the plant’s response to this phytotoxic substance to help maintain photosynthesis and survival. However, this increase may result in more severe oxidative damage via increased ROS production [65]. Further studies are required to support this hypothesis.
The levels of 18S rRNA can be highly dynamic in response to stress; therefore, it seems worthwhile to use a second reference gene from the L. minor genome, which will render the analysis much more reliable.
Figure 6 shows the correlative relationships between 10 endpoints and diuron concentrations (p < 0.05). Under diuron stress, pigment, ROS, and gene transcript levels increased while frond area, fresh weight, and photosynthetic endpoints (Fv/Fm and ETRmax) gradually decreased over the duration of exposure (Figure 6A–C). Notably, the ROS levels, Fv/Fm, frond area, and fresh weight were highly correlated with diuron concentration in all the time points examined. The growth endpoints (frond area and fresh weight) showed a strong negative correlation with ROS levels and positive correlations with Fv/Fm and ETRmax (Figure 6B,C). A high correlation was also detected between NPQ and ETRmax (Figure 6A–C).
Diuron toxicity was detectable at all endpoints after 48 h of exposure. The order of sensitivity based on the quantitative responses (inhibition or stimulation) of the different endpoints measured after 48 h of exposure to 50 × 103 ng L−1 diuron relative to the control was as follows: Gene transcription (136%) > ETRmax (95%) > NPQ (51%) > Fv/Fm (39%) > ROS (36%) > Fresh weight (33%) > Chl b (23%) > Chl a (21%) > Total frond area (20%) > Carotenoids (19%).

4. Conclusions

The current results provide new insight into the mechanism of diuron toxicity in duckweed (L. minor) and the sensitivity of different endpoints at the physiological, biochemical, and molecular levels. The most sensitive and least sensitive endpoints in L. minor that can be used to assess diuron toxicity are gene transcription (molecular endpoint) and carotenoid content (biochemical endpoint), respectively.
The relatively significant increase in rbcL gene transcription in response to 48 h of exposure to diuron represents the plant’s response to this phytotoxic compound even though it may result in more severe oxidative damage due to increased ROS production. This excessive ROS production significantly reduces plant growth since the growth endpoints (frond area and fresh weight) showed a strong negative correlation with ROS levels. In the P680-pheophytin QA-QB pathway, the ETR can be reduced by xenobiotics such as diuron, which can subsequently interfere with the assembly of PSII and results in decreased NPQ. In this sense, the high correlation between the ETR and NPQ detected in the current study is noteworthy.

Author Contributions

Conceptualization, H.L., S.D., K.S., S.C., G.K., Y.H.L., J.T.P., T.H. and J.P.; methodology, H.L., S.D., K.S., S.C., G.K., Y.H.L., J.T.P., T.H. and J.P.; validation, H.L., S.D., K.S., S.C., G.K., Y.H.L., J.T.P., T.H. and J.P.; formal analysis, H.L., S.D., K.S., S.C., G.K., Y.H.L., J.T.P., T.H., and J.P.; investigation, H.L., S.D., K.S., S.C., G.K., Y.H.L., J.T.P., T.H. and J.P.; data curation, H.L., S.D., K.S., S.C., G.K., Y.H.L., J.T.P., T.H. and J.P.; writing—original draft preparation, H.L., K.S., S.C., G.K., and Y.H.L.; writing—review and editing, S.D., J.T.P., T.H. and J.P.; visualization, H.L., S.D., K.S., S.C., G.K., Y.H.L., J.T.P., T.H. and J.P.; supervision, S.D., J.T.P., T.H. and J.P.; project administration, S.D., J.T.P., T.H. and J.P.; funding acquisition, K.S. All authors have read and agreed to the published version of the manuscript.

Funding

This research was supported by the National Institute of Environment Research (NIER) and funded by the Ministry of Environment (MOE) of the Republic of Korea (NIER-2020-03-01-010).

Institutional Review Board Statement

Not applicable.

Informed Consent Statement

Not applicable.

Data Availability Statement

All the results found are available in this manuscript.

Conflicts of Interest

The authors declare no conflict of interest. The funders had no role in the design of the study; in the collection, analyses, or interpretation of data; in the writing of the manuscript, or in the decision to publish the results.

References

  1. Fatima, M.; Mandiki, S.; Douxfils, J.; Silvestre, F.; Coppe, P.; Kestemont, P. Combined effects of herbicides on biomarkers reflecting immune–endocrine interactions in goldfish: Immune and antioxidant effects. Aquat. Toxicol. 2007, 81, 159–167. [Google Scholar] [CrossRef]
  2. Klöppel, H.; Kördel, W.; Stein, B. Herbicide transport by surface runoff and herbicide retention in a filter strip—rainfall and runoff simulation studies. Chemosphere 1997, 35, 129–141. [Google Scholar] [CrossRef]
  3. Prado, R.; Rioboo, C.; Herrero, C.; Cid, A. The herbicide paraquat induces alterations in the elemental and biochemical composition of non-target microalgal species. Chemosphere 2009, 76, 1440–1444. [Google Scholar] [CrossRef] [Green Version]
  4. Hernández, A.F.; Parrón, T.; Tsatsakis, A.M.; Requena, M.; Alarcón, R.; López-Guarnido, O. Toxic effects of pesticide mixtures at a molecular level: Their relevance to human health. Toxicology 2013, 307, 136–145. [Google Scholar] [CrossRef] [PubMed]
  5. Kumar, K.S.; Choo, K.-s.; Yea, S.S.; Seo, Y.; Han, T. Effects of the phenylurea herbicide diuron on the physiology of Saccharina japonica aresch. Toxicol. Environ. Health Sci. 2010, 2, 188–199. [Google Scholar] [CrossRef]
  6. Duan, Q.; Duan, L.; Liu, Y.; Naidu, R.; Zhang, H.; Lei, Y. A novel in-situ passive sampling technique in the application of monitoring diuron in the aquatic environment. Environ. Technol. Innov. 2020, 20, 101073. [Google Scholar] [CrossRef]
  7. Giacomazzi, S.; Cochet, N. Environmental impact of diuron transformation: A review. Chemosphere 2004, 56, 1021–1032. [Google Scholar] [CrossRef] [PubMed]
  8. Ralph, P.J. Herbicide toxicity of Halophila ovalis assessed by chlorophyll a fluorescence. Aquat. Bot. 2000, 66, 141–152. [Google Scholar] [CrossRef]
  9. Murata, N.; Takahashi, S.; Nishiyama, Y.; Allakhverdiev, S.I. Photoinhibition of photosystem II under environmental stress. Biochim. Biophys. Acta (BBA) Bioenerg. 2007, 1767, 414–421. [Google Scholar] [CrossRef] [Green Version]
  10. Guo, Y.; Lu, Y.; Goltsev, V.; Strasser, R.J.; Kalaji, H.M.; Wang, H.; Wang, X.; Chen, S.; Qiang, S. Comparative effect of tenuazonic acid, diuron, bentazone, dibromothymoquinone and methyl viologen on the kinetics of Chl a fluorescence rise OJIP and the MR820 signal. Plant Physiol. Biochem. 2020, 156, 39–48. [Google Scholar] [CrossRef] [PubMed]
  11. Singh, S.; Tiwari, S. Responses of plants to herbicides: Recent advances and future prospectives. In Plant Life Under Changing Environment: Responses and Management; Tripathi, D.K., Singh, V.P., Chauhan, D.K., Sharma, S., Prasad, S.M., Dubey, N.K., Ramawat, N., Eds.; Academic Press: Cambridge, MA, USA, 2020; pp. 237–250. [Google Scholar]
  12. Kusumayuni, E.; Sriyani, N.; Hapsoro, D.; Utomo, S. Long-term application of diuron herbicides caused Eleusine indica weeds to become resistant to diuron. IOP Conf. Ser. Earth Environ. Sci. 2021, 739, 12034. [Google Scholar] [CrossRef]
  13. Jones, R. The ecotoxicological effects of photosystem II herbicides on corals. Mar. Pollut. Bull. 2005, 51, 495–506. [Google Scholar] [CrossRef] [PubMed]
  14. Ghanem, A.; Bados, P.; Estaun, A.R.; de Alencastro, L.F.; Taibi, S.; Einhorn, J.; Mougin, C. Concentrations and specific loads of glyphosate, diuron, atrazine, nonylphenol and metabolites thereof in French urban sewage sludge. Chemosphere 2007, 69, 1368–1373. [Google Scholar] [CrossRef] [PubMed]
  15. Camenzuli, L.; Scheringer, M.; Gaus, C.; Ng, C.A.; Hungerbühler, K. Describing the environmental fate of diuron in a tropical river catchment. Sci. Total Environ. 2012, 440, 178–185. [Google Scholar] [PubMed]
  16. Kaonga, C.C.; Takeda, K.; Sakugawa, H. Diuron, Irgarol 1051 and fenitrothion contamination for a river passing through an agricultural and urban area in Higashi Hiroshima City, Japan. Sci. Total Environ. 2015, 518, 450–458. [Google Scholar] [CrossRef]
  17. Bamba, D.; Atheba, P.; Robert, D.; Trokourey, A.; Dongui, B. Photocatalytic degradation of the diuron pesticide. Environ. Chem. Lett. 2008, 6, 163–167. [Google Scholar]
  18. Tan, C.; Gao, N.; Deng, Y.; An, N.; Deng, J. Heat-activated persulfate oxidation of diuron in water. Chem. Eng. J. 2012, 203, 294–300. [Google Scholar] [CrossRef]
  19. Macounová, K.; Krýsová, H.; Ludvík, J.; Jirkovský, J. Kinetics of photocatalytic degradation of diuron in aqueous colloidal solutions of Q-TiO2 particles. J. Photochem. Photobiol. A Chem. 2003, 156, 273–282. [Google Scholar] [CrossRef]
  20. Oturan, M.A.; Edelahi, M.C.; Oturan, N.; Aaron, J.-J. Kinetics of oxidative degradation/mineralization pathways of the phenylurea herbicides diuron, monuron and fenuron in water during application of the electro-Fenton process. Appl. Catal. B Environ. 2010, 97, 82–89. [Google Scholar] [CrossRef]
  21. Tomlin, C. The Pesticide Manual; British Crop Protection Council: Surrey, UK, 1997. [Google Scholar]
  22. Richardson, S.D.; Ternes, T.A. Water analysis: Emerging contaminants and current issues. Anal. Chem. 2018, 90, 398–428. [Google Scholar] [CrossRef]
  23. Park, J.-S.; Brown, M.T.; Han, T. Phenol toxicity to the aquatic macrophyte Lemna paucicostata. Aquat. Toxicol. 2012, 106, 182–188. [Google Scholar] [CrossRef] [PubMed]
  24. Kumar, K.S.; Han, T. Physiological response of Lemna species to herbicides and its probable use in toxicity testing. Toxicol. Environ. Health Sci. 2010, 2, 39–49. [Google Scholar] [CrossRef]
  25. Lahive, E.; O’Halloran, J.; Jansen, M. Differential sensitivity of four Lemnaceae species to zinc sulphate. Environ. Exp. Bot. 2011, 71, 25–33. [Google Scholar] [CrossRef]
  26. Park, J.; Brown, M.T.; Depuydt, S.; Kim, J.K.; Won, D.-S.; Han, T. Comparing the acute sensitivity of growth and photosynthetic endpoints in three Lemna species exposed to four herbicides. Environ. Pollut. 2017, 220, 818–827. [Google Scholar] [CrossRef] [Green Version]
  27. Landolt, E.; Kandeler, R. Biosystematic investigations in the family of duckweeds (Lemnaceae), Vol. 4: The family of Lemnaceae-a monographic study, Vol. 2 (phytochemistry, physiology, application, bibliography). Veroeffentlichungen Geobot. Inst. ETH Stiftung Ruebel 1987, 95, 638. [Google Scholar]
  28. Landolt, E. Lemnaceae duckweed family. J. Ariz. Nev. Acad. Sci. 1992, 26, 10–14. [Google Scholar]
  29. Scherr, C.; Simon, M.; Spranger, J.; Baumgartner, S. Test system stability and natural variability of a Lemna gibba L. bioassay. PLoS ONE 2008, 3, e3133. [Google Scholar] [CrossRef] [PubMed]
  30. Wang, W. Literature review on duckweed toxicity testing. Environ. Res. 1990, 52, 7–22. [Google Scholar] [CrossRef]
  31. Giddings, J.M.; Arts, G.; Hommen, U. The relative sensitivity of macrophyte and algal species to herbicides and fungicides: An analysis using species sensitivity distributions. Integr. Environ. Assess. Manag. 2013, 9, 308–318. [Google Scholar] [CrossRef] [PubMed] [Green Version]
  32. Aliferis, K.A.; Materzok, S.; Paziotou, G.N.; Chrysayi-Tokousbalides, M. Lemna minor L. as a model organism for ecotoxicological studies performing 1H NMR fingerprinting. Chemosphere 2009, 76, 967–973. [Google Scholar] [CrossRef]
  33. Mkandawire, M.; Teixeira da Silva, J.A.; Dudel, E.G. The Lemna bioassay: Contemporary issues as the most standardized plant bioassay for aquatic ecotoxicology. Crit. Rev. Environ. Sci. Technol. 2014, 44, 154–197. [Google Scholar] [CrossRef]
  34. Kummerová, M.; Zezulka, Š.; Babula, P.; Tříska, J. Possible ecological risk of two pharmaceuticals diclofenac and paracetamol demonstrated on a model plant Lemna minor. J. Hazard. Mater. 2016, 302, 351–361. [Google Scholar] [CrossRef] [PubMed]
  35. Kostopoulou, S.; Ntatsi, G.; Arapis, G.; Aliferis, K.A. Assessment of the effects of metribuzin, glyphosate, and their mixtures on the metabolism of the model plant Lemna minor L. applying metabolomics. Chemosphere 2020, 239, 124582. [Google Scholar] [CrossRef] [PubMed]
  36. Nestler, H.; Groh, K.J.; Schönenberger, R.; Behra, R.; Schirmer, K.; Eggen, R.I.; Suter, M.J.-F. Multiple-endpoint assay provides a detailed mechanistic view of responses to herbicide exposure in Chlamydomonas reinhardtii. Aquat. Toxicol. 2012, 110, 214–224. [Google Scholar] [CrossRef] [PubMed]
  37. Steinberg, R.A. Mineral requirements of Lemna minor. Plant Physiol. 1946, 21, 42–48. [Google Scholar] [CrossRef] [PubMed] [Green Version]
  38. Lichtenthaler, H.K. Chlorophyll fluorescence signatures of leaves during the autumnal chlorophyll breakdown. J. Plant Physiol. 1987, 131, 101–110. [Google Scholar] [CrossRef]
  39. Schreiber, U.; Quayle, P.; Schmidt, S.; Escher, B.I.; Mueller, J.F. Methodology and evaluation of a highly sensitive algae toxicity test based on multiwell chlorophyll fluorescence imaging. Biosens. Bioelectron. 2007, 22, 2554–2563. [Google Scholar] [CrossRef]
  40. Platt, T.; Gallegos, C.; Harrison, W.G. Photoinhibition of photosynthesis in natural assemblages of marine phytoplankton. J. Mar. Res. 1981, 38, 687–701. [Google Scholar]
  41. Bilger, W.; Björkman, O. Role of the xanthophyll cycle in photoprotection elucidated by measurements of light-induced absorbance changes, fluorescence and photosynthesis in leaves of Hedera canariensis. Photosynth. Res. 1990, 25, 173–185. [Google Scholar] [CrossRef] [PubMed]
  42. Kang, H.T.; Park, J.T.; Choi, K.; Choi, H.J.C.; Jung, C.W.; Kim, G.R.; Lee, Y.S.; Park, S.C. Chemical screening identifies ROCK as a target for recovering mitochondrial function in Hutchinson-Gilford progeria syndrome. Aging Cell 2017, 16, 541–550. [Google Scholar] [CrossRef] [PubMed]
  43. Ito, S.-i.; Ihara, T.; Tamura, H.; Tanaka, S.; Ikeda, T.; Kajihara, H.; Dissanayake, C.; Abdel-Motaal, F.F.; El-Sayed, M.A. α-Tomatine, the major saponin in tomato, induces programmed cell death mediated by reactive oxygen species in the fungal pathogen Fusarium oxysporum. FEBS Lett. 2007, 581, 3217–3222. [Google Scholar] [CrossRef] [PubMed] [Green Version]
  44. Livak, K.J.; Schmittgen, T.D. Analysis of relative gene expression data using real-time quantitative PCR and the 2− ΔΔCT method. Methods 2001, 25, 402–408. [Google Scholar] [CrossRef] [PubMed]
  45. Wang, W.; Li, R.; Zhu, Q.; Tang, X.; Zhao, Q. Transcriptomic and physiological analysis of common duckweed Lemna minor responses to NH4+ toxicity. BMC Plant Biol. 2016, 16, 1–13. [Google Scholar] [CrossRef] [PubMed] [Green Version]
  46. Kleczkowski, L.A. Inhibitors of photosynthetic enzymes/carriers and metabolism. Annu. Rev. Plant Biol. 1994, 45, 339–367. [Google Scholar] [CrossRef]
  47. Williams, S.L.; Carranza, A.; Kunzelman, J.; Datta, S.; Kuivila, K.M. Effects of the herbicide diuron on cordgrass (Spartina foliosa) reflectance and photosynthetic parameters. Estuaries Coasts 2009, 32, 146–157. [Google Scholar] [CrossRef]
  48. Lichtenthaler, H.; Meier, D.; Retzlaff, G.; Hamm, R. Distribution and effects of bentazon in crop plants and weeds. Zeitschrift für Naturforschung C 1982, 37, 889–897. [Google Scholar] [CrossRef]
  49. Lichtenthaler, H.K. Chloroplast biogenesis, its inhibition and modification by new herbicide compounds. Zeitschrift für Naturforschung C 1984, 39, 492–499. [Google Scholar] [CrossRef]
  50. Macinnis-Ng, C.M.; Ralph, P.J. Short-term response and recovery of Zostera capricorni photosynthesis after herbicide exposure. Aquat. Bot. 2003, 76, 1–15. [Google Scholar] [CrossRef]
  51. Percival, G.C. The use of chlorophyll fluorescence to identify chemical and environmental stress in leaf tissue of three oak (Quercus) species. J. Arboric. 2005, 31, 215. [Google Scholar]
  52. Bai, X.; Sun, C.; Xie, J.; Song, H.; Zhu, Q.; Su, Y.; Qian, H.; Fu, Z. Effects of atrazine on photosynthesis and defense response and the underlying mechanisms in Phaeodactylum tricornutum. Environ. Sci. Pollut. Res. 2015, 22, 17499–17507. [Google Scholar] [CrossRef] [PubMed]
  53. Thomas, M.C.; Flores, F.; Kaserzon, S.; Reeks, T.A.; Negri, A.P. Toxicity of the herbicides diuron, propazine, tebuthiuron, and haloxyfop to the diatom Chaetoceros muelleri. Sci. Rep. 2020, 10, 1–14. [Google Scholar]
  54. DeEll, J.R.; van Kooten, O.; Prange, R.K.; Murr, D.P. Applications of chlorophyll fluorescence techniques in postharvest physiology. Hortic. Rev. 1999, 23, 69–107. [Google Scholar]
  55. Björkman, O.; Demmig, B. Photon yield of O2 evolution and chlorophyll fluorescence characteristics at 77 K among vascular plants of diverse origins. Planta 1987, 170, 489–504. [Google Scholar] [CrossRef]
  56. Snel, J.F.; Vos, J.H.; Gylstra, R.; Brock, T.C. Inhibition of photosystem II (PSII) electron transport as a convenient endpoint to assess stress of the herbicide linuron on freshwater plants. Aquat. Ecol. 1998, 32, 113–123. [Google Scholar] [CrossRef]
  57. Klughammer, C.; Schreiber, U. Complementary PS II quantum yields calculated from simple fluorescence parameters measured by PAM fluorometry and the saturation pulse method. PAM Appl. Notes 2008, 1, 201–247. [Google Scholar]
  58. Frankart, C.; Eullaffroy, P.; Vernet, G. Comparative effects of four herbicides on non-photochemical fluorescence quenching in Lemna minor. Environ. Exp. Bot. 2003, 49, 159–168. [Google Scholar] [CrossRef]
  59. Han, T.; Han, Y.-S.; Park, C.Y.; Jun, Y.S.; Kwon, M.J.; Kang, S.-H.; Brown, M.T. Spore release by the green alga Ulva: A quantitative assay to evaluate aquatic toxicants. Environ. Pollut. 2008, 153, 699–705. [Google Scholar] [CrossRef] [PubMed]
  60. Brack, W.; Frank, H. Chlorophyll a fluorescence: A tool for the investigation of toxic effects in the photosynthetic apparatus. Ecotoxicol. Environ. Saf. 1998, 40, 34–41. [Google Scholar] [CrossRef] [PubMed]
  61. Gomes, M.P.; Juneau, P. Oxidative stress in duckweed (Lemna minor L.) induced by glyphosate: Is the mitochondrial electron transport chain a target of this herbicide? Environ. Pollut. 2016, 218, 402–409. [Google Scholar] [CrossRef] [PubMed]
  62. Philosoph-Hadas, S.; Meir, S.; Akiri, B.; Kanner, J. Oxidative defense systems in leaves of three edible herb species in relation to their senescence rates. J. Agric. Food Chem. 1994, 42, 2376–2381. [Google Scholar] [CrossRef]
  63. Teisseire, H.; Vernet, G. Ascorbate and glutathione contents in duckweed, Lemna minor, as biomarkers of the stress generated by copper, folpet and diuron. Biomarkers 2000, 5, 263–273. [Google Scholar] [CrossRef] [PubMed]
  64. Eichelmann, H.; Talts, E.; Oja, V.; Padu, E.; Laisk, A. Rubisco in planta kcat is regulated in balance with photosynthetic electron transport. J. Exp. Bot. 2009, 60, 4077–4088. [Google Scholar] [CrossRef] [PubMed] [Green Version]
  65. Wei, Y.; Zhu, N.; Lavoie, M.; Wang, J.; Qian, H.; Fu, Z. Copper toxicity to Phaeodactylum tricornutum: A survey of the sensitivity of various toxicity endpoints at the physiological, biochemical, molecular and structural levels. Biometals 2014, 27, 527–537. [Google Scholar] [CrossRef] [PubMed]
Figure 1. Total frond area (A) and fresh weight (B) of Lemna minor exposed to diuron (50 × 103 and 50 × 104 ng L−1) for 24, 48, and 72 h. Data represent mean values of three replicates. Standard deviations are indicated by error bars. Different letters indicate statistically significant differences at p < 0.05 (one-way ANOVA, LSD).
Biology 10 00684 g001
Figure 2. Levels (all in mg mg−1 FW) of chlorophyll a (A), chlorophyll b (B), and carotenoids (C) in Lemna minor exposed to diuron (50 × 103 and 50 × 104 ng L−1) for 24, 48, and 72 h. Data represent means of three replicates. Standard deviations are indicated by error bars. Different letters indicate statistically significant differences at p < 0.05 (one-way ANOVA, LSD). Absence of a letter in a column indicates no statistical difference.
Biology 10 00684 g002
Figure 3. Effects of diuron (50 × 103 and 50 × 104 ng L−1) on maximum quantum yield (Fv/Fm). (A) Images of the chlorophyll a fluorescence parameter Fv/Fm in L. minor under diuron stress. Chlorophyll fluorescence images were obtained using Imaging PAM (I-PAM, Walz, Effeltrich, Germany). (B) The average values of Fv/Fm in L. minor. Values are mean ± standard deviation (n = 3). Different letters indicate statistically significant differences at p < 0.05. Scale bar, 5 mm.
Biology 10 00684 g003
Figure 4. Experimental procedure used to assess ROS levels as DHR123 values normalized to DNA content. Supernatants from Lemna minor homogenates containing 1 mM phosphate-buffered saline (PBS; pH 8) were incubated with 30 μM DHR-123 for 20 min at room temperature (A). Reactive oxygen species (ROS) production in L. minor exposed to increasing concentrations of diuron (0, 50 × 103, 50 × 104 ng L−1) for 24, 48, and 72 h (B). Bars represent the mean ± standard deviation of three replicates. Different letters indicate statistically significant differences at p < 0.05 (one-way ANOVA, LSD).
Biology 10 00684 g004
Figure 5. Relative rbcL expression in Lemna minor under diuron stress. L. minor was exposed to different concentrations of diuron (50 × 103 and 50 × 104 ng L−1). Data are the means of three replicates (± standard deviation). Different letters indicate statistically significant differences at p < 0.05 (one-way ANOVA, LSD).
Biology 10 00684 g005
Figure 6. Correlation between 10 endpoints and diuron concentrations in L. minor at 24 (A), 48 (B), and 72 h of exposure (C). Only indicators showing statistical significance at the 5% level are shown in circles. The color and size of the circle indicate the strength of the correlation. The color bar on the right indicates the scale of the correlation coefficients. Light blue, blue, and navy blue indicate the correlation coefficients > 0.5, 0.7, and 0.9, respectively, while light pink, orange, and red indicate correlation coefficients < 0.5. The numbers in the boxes are the correlation coefficients. Note that for the sake of clarity, all correlation matrix views show only the upper part of the matrix to avoid duplication. Diuron, diuron concentration; FA, frond area; FW, fresh weight; Chl a, chlorophyll a content; Chl b, chlorophyll b content; Car, carotenoid content; Fv/Fm, maximum quantum yield; ETRmax, the maximum electron transport rate; NPQ, non-photochemical quenching; ROS, reactive oxygen species production; Gene, relative rbcL gene expression.
Biology 10 00684 g006
Table 1. Primers used in this study.
GenesSequence
18S Rrna *
(housekeeping gene)
Forward: 5′AGAGGAACAGTCGGGGGCATT-3′
Reverse: 5′-CGGCATCGTTTACGGTTGAGA-3′
rbcLForward: 5′-GTCCATGTACCAGTAGAAGATTCGGC-3′
Reverse: 5′-ATGTCACCACAAACAGAGACTAAAGC-3′
* The sequence cited from [45].
Table 2. Effect of diuron (50 × 103 and 50 × 104 ng L−1) on induced chlorophyll a fluorescence parameters including maximum electron transport rate (ETRmax) and non-photochemical quenching (NPQ) in Lemna minor exposed for 24, 48, and 72 h. Data represent mean ± standard deviation of three replicates. Different letters indicate statistically significant differences at p < 0.05 (one-way ANOVA, LSD).
Diuron
(ng L−1)
24 h Exposure48 h Exposure72 h Exposure
ETRmaxNPQETRmaxNPQETRmaxNPQ
034 a ± 0.710.55 a ± 0.00134 a ± 0.990.59 a ± 0.00635 a ± 1.90.56 a ± 0.02
50 × 1030.75 b ± 0.090.47 b ± 0.021.5 b ± 0.120.28 b ± 0.0041.5 b ± 0.240.31 b ± 0.01
50 × 1040.12 b ± 0.090.45 b ± 0.020.01 b ± 0.000.36 c ± 0.010.01 b ± 0.000.38 b ± 0.04
Publisher’s Note: MDPI stays neutral with regard to jurisdictional claims in published maps and institutional affiliations.

