
Female Mice Are Protected from Metabolic Decline Associated with Lack of Skeletal Muscle HuR

Abstract
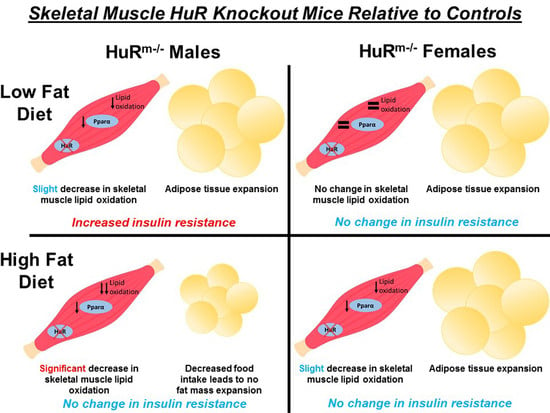
Simple Summary
Abstract
1. Introduction
2. Materials and Methods
2.1. Animals
2.2. Animal Procedures
2.3. RNA and DNA Isolation
2.4. Insulin Analysis
2.5. Quantitative RT-PCR
2.6. Substrate Oxidation Assays
2.7. Study Approval
2.8. Statistics
3. Results
3.1. Dietary Fat Content Influences Fat Mass Accumulation Relative to Controls in HuRm−/− Males but Not Females
3.2. Food Intake Decreases as Dietary Fat Increases in Male but Not Female HuRm−/− Mice
3.3. Female HuRm−/− Mice Show Enhanced Glucose Clearance Relative to Controls, While Increased Fat Mass Contributes to Decreased Glucose Clearance in HuRm−/− Males
3.4. HuRm−/− Mice Exhibit Decreased Lipid Oxidation Relative to Controls in Skeletal Muscle as Dietary Fat Increases More Abundantly in Males than in Females
3.5. Skeletal Muscle Levels of Pgc1α but Not Pparα Are Increased Relative to Controls in HuRm−/− Male Mice, While Female HuRm−/− Mice Show Little Difference in These Markers
4. Discussion
5. Concluding Summary
Supplementary Materials
Author Contributions
Funding
Institutional Review Board Statement
Informed Consent Statement
Data Availability Statement
Acknowledgments
Conflicts of Interest
References
- Goodpaster, B.H.; Sparks, L.M. Metabolic Flexibility in Health and Disease. Cell Metab. 2017, 25, 1027–1036. [Google Scholar] [CrossRef]
- Kelley, D.E.; Mandarino, L.J. Fuel selection in human skeletal muscle in insulin resistance: A reexamination. Diabetes 2000, 49, 677–683. [Google Scholar] [CrossRef]
- Galgani, J.E.; Heilbronn, L.K.; Azuma, K.; Kelley, D.E.; Albu, J.B.; Pi-Sunyer, X.; Smith, S.R.; Ravussin, E. Metabolic flexibility in response to glucose is not impaired in people with type 2 diabetes after controlling for glucose disposal rate. Diabetes 2008, 57, 841–845. [Google Scholar] [CrossRef]
- Song, J.D.; Perry, R.J.; Munk, A.; Zhang, Y.; Zhang, D.Y.; Shulman, G.I. Metabolic Inflexibility Revisited-Muscle Substrate Oxidation Is Mechanistically Dissociated from Muscle Insulin Resistance in Rats. Diabetes 2018, 67. [Google Scholar] [CrossRef]
- Begaye, B.; Vinales, K.L.; Hollstein, T.; Ando, T.; Walter, M.; Bogardus, C.; Krakoff, J.; Piaggi, P. Impaired Metabolic Flexibility to High-Fat Overfeeding Predicts Future Weight Gain in Healthy Adults. Diabetes 2020, 69, 181–192. [Google Scholar] [CrossRef] [PubMed]
- Mynatt, R.L.; Noland, R.C.; Elks, C.M.; Vandanmagsar, B.; Bayless, D.S.; Stone, A.C.; Ghosh, S.; Ravussin, E.; Warfel, J.D. The RNA binding protein HuR influences skeletal muscle metabolic flexibility in rodents and humans. Metabolism 2019, 97, 40–49. [Google Scholar] [CrossRef] [PubMed]
- Li, J.; Gong, L.; Liu, S.; Zhang, Y.; Zhang, C.; Tian, M.; Lu, H.; Bu, P.; Yang, J.; Ouyang, C.; et al. Adipose HuR protects against diet-induced obesity and insulin resistance. Nat. Commun. 2019, 10. [Google Scholar] [CrossRef]
- Shi, Q.; Lee, D.Y.; Feliers, D.; Abboud, H.E.; Bhat, M.A.; Gorin, Y. Interplay between RNA-binding protein HuR and Nox4 as a novel therapeutic target in diabetic kidney disease. Mol. Metab. 2020, 36. [Google Scholar] [CrossRef]
- Ghosh, M.; Aguila, H.L.; Michaud, J.; Ai, Y.; Wu, M.T.; Hemmes, A.; Ristimaki, A.; Guo, C.; Furneaux, H.; Hla, T. Essential role of the RNA-binding protein HuR in progenitor cell survival in mice. J. Clin. Investig. 2009, 119, 3530–3543. [Google Scholar] [CrossRef]
- Bothe, G.W.; Haspel, J.A.; Smith, C.L.; Wiener, H.H.; Burden, S.J. Selective expression of Cre recombinase in skeletal muscle fibers. Genesis 2000, 26, 165–166. [Google Scholar] [CrossRef]
- Warfel, J.D.; Vandanmagsar, B.; Wicks, S.E.; Zhang, J.; Noland, R.C.; Mynatt, R.L. A low fat diet ameliorates pathology but retains beneficial effects associated with CPT1b knockout in skeletal muscle. PLoS ONE 2017, 12, e0188850. [Google Scholar] [CrossRef] [PubMed]
- Wicks, S.E.; Vandanmagsar, B.; Haynie, K.R.; Fuller, S.E.; Warfel, J.D.; Stephens, J.M.; Wang, M.; Han, X.; Zhang, J.; Noland, R.C.; et al. Impaired mitochondrial fat oxidation induces adaptive remodeling of muscle metabolism. Proc. Natl. Acad. Sci. USA 2015, 112, E3300–E3309. [Google Scholar] [CrossRef] [PubMed]
- Singh, B.; Saxena, A. Surrogate markers of insulin resistance: A review. World J. Diabetes 2010, 1, 36–47. [Google Scholar] [CrossRef] [PubMed]
- Noland, R.C.; Woodlief, T.L.; Whitfield, B.R.; Manning, S.M.; Evans, J.R.; Dudek, R.W.; Lust, R.M.; Cortright, R.N. Peroxisomal-mitochondrial oxidation in a rodent model of obesity-associated insulin resistance. Am. J. Physiol. Endocrinol. Metab. 2007, 293, E986–E1001. [Google Scholar] [CrossRef] [PubMed]
- Fisher, R.A. Statistical Methods for Research Workers, 5th ed.; Oliver and Boyd: Edinburgh, UK, 1932; 319p. [Google Scholar]
- Weir, J.B.D. New Methods for Calculating Metabolic Rate with Special Reference to Protein Metabolism. J. Physiol. 1949, 109, 1–9. [Google Scholar] [CrossRef] [PubMed]
- Janice Sanchez, B.; Tremblay, A.K.; Leduc-Gaudet, J.P.; Hall, D.T.; Kovacs, E.; Ma, J.F.; Mubaid, S.; Hallauer, P.L.; Phillips, B.L.; Vest, K.E.; et al. Depletion of HuR in murine skeletal muscle enhances exercise endurance and prevents cancer-induced muscle atrophy. Nat. Commun. 2019, 10. [Google Scholar] [CrossRef]
- Kaiyala, K.J.; Morton, G.J.; Leroux, B.G.; Ogimoto, K.; Wisse, B.; Schwartz, M.W. Identification of body fat mass as a major determinant of metabolic rate in mice. Diabetes 2010, 59, 1657–1666. [Google Scholar] [CrossRef] [PubMed]
- Lundsgaard, A.M.; Kiens, B. Gender differences in skeletal muscle substrate metabolism—Molecular mechanisms and insulin sensitivity. Front. Endocrinol. 2014, 5. [Google Scholar] [CrossRef]
- Regitz-Zagrosek, V.; Lehmkuhl, E.; Weickert, M.O. Gender differences in the metabolic syndrome and their role for cardiovascular disease. Clin. Res. Cardiol. 2006, 95, 136–147. [Google Scholar] [CrossRef]
- Hocking, S.; Samocha-Bonet, D.; Milner, K.L.; Greenfield, J.R.; Chisholm, D.J. Adiposity and insulin resistance in humans: The role of the different tissue and cellular lipid depots. Endocr. Rev. 2013, 34, 463–500. [Google Scholar] [CrossRef]
- Yoon, M. PPARalpha in Obesity: Sex Difference and Estrogen Involvement. PPAR Res. 2010, 2010. [Google Scholar] [CrossRef]
- Kraft, C.S.; LeMoine, C.M.; Lyons, C.N.; Michaud, D.; Mueller, C.R.; Moyes, C.D. Control of mitochondrial biogenesis during myogenesis. Am. J. Physiol. Cell Physiol. 2006, 290, C1119–C1127. [Google Scholar] [CrossRef]
- Liu, Y.; Bai, H.; Guo, F.; Thai, P.N.; Luo, X.; Zhang, P.; Yang, C.; Feng, X.; Zhu, D.; Guo, J.; et al. PGC-1alpha activator ZLN005 promotes maturation of cardiomyocytes derived from human embryonic stem cells. Aging 2020, 12, 7411–7430. [Google Scholar] [CrossRef] [PubMed]
- Toye, A.A.; Lippiat, J.D.; Proks, P.; Shimomura, K.; Bentley, L.; Hugill, A.; Mijat, V.; Goldsworthy, M.; Moir, L.; Haynes, A.; et al. A genetic and physiological study of impaired glucose homeostasis control in C57BL/6J mice. Diabetologia 2005, 48, 675–686. [Google Scholar] [CrossRef]
- Sharma, G.; Prossnitz, E.R. G-Protein-Coupled Estrogen Receptor (GPER) and Sex-Specific Metabolic Homeostasis. Adv. Exp. Med. Biol. 2017, 1043, 427–453. [Google Scholar] [CrossRef]
- Palmisano, B.T.; Zhu, L.; Stafford, J.M. Role of Estrogens in the Regulation of Liver Lipid Metabolism. Adv. Exp. Med. Biol. 2017, 1043, 227–256. [Google Scholar] [CrossRef] [PubMed]
- Sparks, L.M.; Pasarica, M.; Sereda, O.; deJonge, L.; Thomas, S.; Loggins, H.; Xie, H.; Miles, J.M.; Smith, S.R. Effect of adipose tissue on the sexual dimorphism in metabolic flexibility. Metabolism 2009, 58, 1564–1571. [Google Scholar] [CrossRef] [PubMed]
- Gordon, C.J. The mouse thermoregulatory system: Its impact on translating biomedical data to humans. Physiol. Behav. 2017, 179, 55–66. [Google Scholar] [CrossRef] [PubMed]
- Johnson, T.S.; Murray, S.; Young, J.B.; Landsberg, L. Restricted food intake limits brown adipose tissue hypertrophy in cold exposure. Life Sci. 1982, 30, 1423–1426. [Google Scholar] [CrossRef]
- Labbe, S.M.; Mouchiroud, M.; Caron, A.; Secco, B.; Freinkman, E.; Lamoureux, G.; Gelinas, Y.; Lecomte, R.; Bosse, Y.; Chimin, P.; et al. mTORC1 is Required for Brown Adipose Tissue Recruitment and Metabolic Adaptation to Cold. Sci. Rep. 2016, 6. [Google Scholar] [CrossRef]
- McAinch, A.J.; Lee, J.S.; Bruce, C.R.; Tunstall, R.J.; Hawley, J.A.; Cameron-Smith, D. Dietary regulation of fat oxidative gene expression in different skeletal muscle fiber types. Obes. Res. 2003, 11, 1471–1479. [Google Scholar] [CrossRef] [PubMed]
- Edgerton, V.R.; Smith, J.L.; Simpson, D.R. Muscle fibre type populations of human leg muscles. Histochem. J. 1975, 7, 259–266. [Google Scholar] [CrossRef] [PubMed]
- Schiaffino, S.; Reggiani, C. Fiber types in mammalian skeletal muscles. Physiol. Rev. 2011, 91, 1447–1531. [Google Scholar] [CrossRef]
- Fernandez-Vizarra, E.; Enriquez, J.A.; Perez-Martos, A.; Montoya, J.; Fernandez-Silva, P. Tissue-specific differences in mitochondrial activity and biogenesis. Mitochondrion 2011, 11, 207–213. [Google Scholar] [CrossRef]
- Ventura-Clapier, R.; Piquereau, J.; Veksler, V.; Garnier, A. Estrogens, Estrogen Receptors Effects on Cardiac and Skeletal Muscle Mitochondria. Front. Endocrinol. 2019, 10. [Google Scholar] [CrossRef] [PubMed]
- Ing, N.H.; Massuto, D.A.; Jaeger, L.A. Estradiol up-regulates AUF1p45 binding to stabilizing regions within the 3′-untranslated region of estrogen receptor alpha mRNA. J. Biol. Chem. 2008, 283, 1764–1772. [Google Scholar] [CrossRef]


Publisher’s Note: MDPI stays neutral with regard to jurisdictional claims in published maps and institutional affiliations. |
© 2021 by the authors. Licensee MDPI, Basel, Switzerland. This article is an open access article distributed under the terms and conditions of the Creative Commons Attribution (CC BY) license (https://creativecommons.org/licenses/by/4.0/).
Share and Cite
Stone, A.C.; Noland, R.C.; Mynatt, R.L.; Velasquez, S.E.; Bayless, D.S.; Ravussin, E.; Warfel, J.D. Female Mice Are Protected from Metabolic Decline Associated with Lack of Skeletal Muscle HuR. Biology 2021, 10, 543. https://doi.org/10.3390/biology10060543
Stone AC, Noland RC, Mynatt RL, Velasquez SE, Bayless DS, Ravussin E, Warfel JD. Female Mice Are Protected from Metabolic Decline Associated with Lack of Skeletal Muscle HuR. Biology. 2021; 10(6):543. https://doi.org/10.3390/biology10060543
Chicago/Turabian StyleStone, Allison C., Robert C. Noland, Randall L. Mynatt, Samuel E. Velasquez, David S. Bayless, Eric Ravussin, and Jaycob D. Warfel. 2021. "Female Mice Are Protected from Metabolic Decline Associated with Lack of Skeletal Muscle HuR" Biology 10, no. 6: 543. https://doi.org/10.3390/biology10060543
APA StyleStone, A. C., Noland, R. C., Mynatt, R. L., Velasquez, S. E., Bayless, D. S., Ravussin, E., & Warfel, J. D. (2021). Female Mice Are Protected from Metabolic Decline Associated with Lack of Skeletal Muscle HuR. Biology, 10(6), 543. https://doi.org/10.3390/biology10060543