Article

Parasites, Drugs and Captivity: Blastocystis-Microbiome Associations in Captive Water Voles

1
Laboratory of Molecular and Evolutionary Parasitology, RAPID Group, School of Biosciences, University of Kent, Canterbury CT2 7NJ, UK
2
Wildwood Trust, Herne Common, Herne Bay CT6 7LQ, UK
3
School of Animal, Rural and Environmental Sciences, Brackenhurst Campus, Nottingham Trent University, Nottinghamshire NG1 4FQ, UK
4
School of Mathematics, Statistics and Actuarial Science, University of Kent, Canterbury CT2 7NJ, UK
5
School of Science and Human Gut Microbiome for Health Research Unit, Mae Fah Luang University, Chiang Rai 57100, Thailand
*
Authors to whom correspondence should be addressed.
Biology 2021, 10(6), 457; https://doi.org/10.3390/biology10060457
Submission received: 16 March 2021 / Revised: 17 May 2021 / Accepted: 19 May 2021 / Published: 22 May 2021
(This article belongs to the Special Issue Blastocystis in Health and Disease)

Abstract

:

Simple Summary

The last decade has seen a large increase into research on the microbiome and its roles in health and disease. The majority of this work has focused primarily on the bacterial component of the microbiome. However, there is evidence to suggest that microbial eukaryotes colonising the gastrointestinal tract may have roles in the shaping and structuring of the microbiota and are thus likely to influence disease outcomes and host health. The aim of this study was to investigate the questionable pathogen Blastocystis and expand the number of studies on non-primate hosts, which address its associations with bacterial communities in the gut. Herein we examined the bacterial gut microbiota of Blastocystis positive and negative water voles. Results demonstrate no association of Blastocystis, bacterial richness and community composition. Nonetheless, the abundance of some taxa was affected in Blastocystis positive samples. The lack of significant shifts in community abundance between Blastocystis carriers and non-carriers indicates that this microbe may not be having a profound impact on bacterial communities in the gut of these animals.

Abstract

(1) Background: Blastocystis is a microbial eukaryote inhabiting the gastrointestinal tract of a broad range of animals including humans. Several studies have shown that the organism is associated with specific microbial profiles and bacterial taxa that have been deemed beneficial to intestinal and overall health. Nonetheless, these studies are focused almost exclusively on humans, while there is no similar information on other animals. (2) Methods: Using a combination of conventional PCR, cloning and sequencing, we investigated presence of Blastocystis along with Giardia and Cryptosporidium in 16 captive water voles sampled twice from a wildlife park. We also characterised their bacterial gut communities. (3) Results: Overall, alpha and beta diversities between water voles with and without Blastocystis did not differ significantly. Differences were noted only on individual taxa with Treponema and Kineothrix being significantly reduced in Blastocystis positive water voles. Grouping according to antiprotozoal treatment and presence of other protists did not reveal any differences in the bacterial community composition either. (4) Conclusion: Unlike human investigations, Blastocystis does not seem to be associated with specific gut microbial profiles in water voles.

1. Introduction

The gastrointestinal tract is a dynamic and varied ecosystem made up of trillions of bacteria, viruses, protozoa, fungi and archaea that co-evolved with the host [1]. As a result, mutually beneficial interactions have developed over a prolonged period of time. Recently, there has been an explosion of studies focusing on the microbiome and its role in host health and disease. Nonetheless, such studies are largely anthropocentric and focus mainly on bacterial microbiota [2,3,4,5,6]. Microbiome-based research of non-human vertebrates mainly encompasses livestock [7,8,9], companion animals [10,11] and other notable species, such as those at risk of extinction [12,13]. A common objective of animal studies has been to explore the extent of bacterial community perturbations in the gut caused by anthropogenic intervention and investigate resulting ramifications on animal fitness and longevity [13,14,15,16,17,18]. Recent investigations have focused on comparing gut microbiota of captive animals and their wild counterparts in order to assess links to the captive lifestyle [14,19,20,21]. Roles of microbiota on host survival upon release have also been examined. Collectively, these studies support monitoring of the microbiota of animals involved in re-introduction and/or translocation projects. Regrettably, the majority of studies fail to include intestinal protozoa, even though emerging evidence suggests that some species persist as asymptomatic colonisers of the intestinal tract [13,22,23,24,25,26,27,28]. Recent studies have showcased that water voles constitute an attractive model for examining these questions [22,23].
The European water vole (Arvicola amphibius) is a semi-aquatic rodent that was widespread across Britain in the early 1900s. However, in the past few decades its population has decreased drastically, disappearing from over 89% of previously occupied sites. This has been attributed mainly to habitat destruction and an invasive alien species (IAS), the American mink (Neovison vison) [29]. In the UK, attempts are being made to repair fractured populations and re-introduce this mammal into protected wetlands [30,31]. An emerging factor in achieving both of these objectives is the gut microbiota, whose composition in water voles has not been explored. Despite this, previous studies have demonstrated high prevalence and co-occurrence of several eukaryotic microbes in the stool of water voles, hinting at potentially important roles as well [23]. Specifically, the prevalence of protozoan parasites in captive and wild water voles and their associated gut flora remain little explored. The few studies that have examined gut protists in these animals have shown that the most common organism is Blastocystis, a microbial eukaryote of questionable pathogenicity.
Herein we investigate the gut microbiota of captive water voles, some of which are involved in re-introductory and breeding schemes. Our annotation and characterisation of the gut microbiota encompassed not only the bacterial component, but also included the protozoan parasites Cryptosporidium, Giardia, and the questionable pathogen Blastocystis. Information on the prokaryotic and eukaryotic components was collectively considered in order to explore their associations in the gut of voles. This study provides the first investigation on association of Blastocystis with bacterial communities in the gut of captive water voles. This type of information can assist in re-shaping the strategies for re-introduction programmes of voles into the wild.

2. Materials and Methods

2.1. Study Site, Animals and Sample Preparation

A conservation park situated in the Southeast, United Kingdom was the subject of this study; Wildwood Trust, Herne Bay, Kent, United Kingdom (51°19′54.1″ N 1°07′10.1″ E) is a wildlife park that houses native British wildlife, housing vertebrate and invertebrate species, that also includes a selection of non-native species that assist with the organisation’s education programme. The park aims to educate the general public on the ecology and status of resident animals in addition to participating in several conservation programmes aiming to ‘re-wild’ Britain. The park is actively involved in breeding, re-introduction and mitigation services for the European water vole (Arvicola amphibius) and in recent years has been involved in the release of several individuals. There are over 60 of these rodents currently housed within the park, and their health and breeding status are closely monitored by a licenced veterinarian and keepers. The animals are also monitored for presence of infectious disease agents. During one of these health screenings, Giardia was detected in a large number of water voles. Thus, the animals were categorised as either infected or non-infected with Giardia and housed accordingly; non-infected and suspected infected individuals were housed in separate enclosures. To minimise risk of transmission, enclosures housing non-infected individuals are cleaned first using separate housekeeping equipment. Following the screening, definitive diagnosis for giardiasis was made by the park veterinarian as follows: faecal samples were collected from three adjacent cages at a time and collated faecal samples were examined for Giardia by direct smear. The veterinarian would group collated faecal from three adjacent cages at a time and screen for Giardia spp. If they tested positive, all individuals were placed on anti-protozoal treatment with either metronidazole or fenbendazole. Metronidazole treatment lasted 5 days; the dosage was 0.8 mL of a 5 mg/mL injectable solution (approximately 4 mg/vole). Fenbendazole treatments varied in duration; dosage was typically 0.25 mL of a 20% dilution (200 mg/mL original concentration) per 200 g vole. All drug treatments had ended between 10 and 14 days prior to sample collection.

2.2. Sample Collection

In this study, a total of 16 water voles housed within the park were sampled between 18 January 2019 and 20 February 2019. A total of 29 faecal samples were collected. Sampling successfully occurred across two collection dates for 12 voles, and a single sample collection took place for four of the voles (R4, Q49, R95 and R34); this was due to no suitable faecal sample for R4 (first collection), Q49 and R95 (second collection), and the death of R34 before the second collection. R13 also died on the morning of the second collection; however, a faecal sample for this vole was obtained before the enclosure was cleaned. Therefore, a total of 12 voles had two successful collections. Samples were collected shortly after enclosures had been cleaned and with the guidance of the park keepers. Only fresh faecal samples were collected. Upon collection, samples were placed in sterile tubes and stored at 4 °C within one hour of collection. At the time of study all voles were considered healthy as stated by a licenced veterinarian and lacked symptoms of gastrointestinal disease.

2.3. DNA Extraction, Polymerase Chain Reaction, Cloning

Genomic DNA was extracted directly from approximately 250 mg of the fresh faecal sample using the Microbiome DNA Purification Kit, Purelink (Fisher, California, USA) according to the manufacturer’s instructions. DNA was eluted in 100 μL elution buffer and the working stock stored at −20 °C. Genomic DNA was used for polymerase chain reaction (PCR) with primers targeting gene regions of Blastocystis, Cryptosporidium and Giardia according to previously described protocols [23] (Appendix A Table A1). The purified gel extracts were eluted, of which 1.5 μL was used for cloning with the pGEM-T easy vector system I (Promega, Madison, WI, USA). Between five and ten colonies per transformation were inoculated and grown overnight in 5 mL LB media. The plasmid DNA was extracted using the GeneJet Plasmid Miniprep Kit and clones were confirmed as positive using EcoRI (Promega) restriction digestion. Positive clones were sent for sequencing using the T7 and/or SP6 universal primers (Eurofins, Ebersberg Germany).

2.4. Amplicon Sequencing of 16S rRNA

Twenty-eight genomic DNA samples were used for microbiome profiling analysis using the Illumina platform (paired-end sequencing). Bacterial taxonomic profiling was carried out by targeting the V1–V3 hypervariable regions of the 16S rRNA gene using the following primers: forward sequence fD2: AGAGTTTGATCATGGCTCAG [32] and reverse sequence S-D-Bact-0008-a-S-20, S-*-Univ-0519-a-A-18: GTATTACCGCGGCTGCTG [33]. All data have been submitted to GenBank under Bioproject number SUB9442672.

2.5. Microbiome and Statistical Analysis

Initial bioinformatics analysis was performed using the INVIEW Microbiome Profiling 3.0. Reads with ambiguous bases were removed and chimeric sequences were detected and removed based on the algorithm of UCHIME via the VSEARCH package [34,35]. Where necessary, reads were merged using FLASH software (Baltimore, Maryland) (V2.2.00 http://ccb.jhu.edu/software/FLASH/—access date: February 2020) [36]. Primer and adaptor sequences were removed using Cutadapt [37]. High-quality reads were processed using Minimum Entropy Decomposition (MED) [38,39]. Taxonomy assignment of OTUs was carried using the NCBI sequence database (version 10 October 2019). The most specific taxonomic assignment for each OTU was then transferred from the best-matching reference sequence set and a sequence identity of 70% across a minimum of 80% of representative sequences was the threshold for consideration of a reference sequence (representing a 97% threshold). Further processing of OTUs and taxonomy assignments as part of the INVIEW Microbiome Profiling pipeline was performed using QIIME (Arizona, USA) (version 1.9.1 http://qiime.org/, accessed on 1 February 2020) and OTU abundance normalisation was employed using CopyRighter [40].
All subsequent analyses, including microbial diversity analysis, were performed using the MicrobiomeAnalyst pipeline [41]. Data filtering of OTU data consisted of low count filtering to remove reads with low counts across few samples this was set to a minimum count of four with a prevalence of 20% in samples. Data variance was measured using the inter-quartile range (IQR) and low-variance filtering was implemented to remove features that were close to constant throughout the dataset. Data normalisation was used to facilitate data comparison and to account for unevenness in sampling sparsity and depth; normalisation approaches considered herein included rarefaction to even sequencing depth, data scaling and data transformation.
Microbial diversity was analysed at different taxonomic levels between infected and uninfected voles taking into consideration collection date and protist. Specifically, microbial communities of voles infected with only Blastocystis, Cryptosporidium, or Giardia were compared against uninfected control voles. Moreover, voles infected with more than one protist were also compared against the controls.
Diversity analysis included alpha (within sample) and beta (between samples) measures. Alpha diversity was measured using the Observed species (OS), Chao1 and Shannon indices accounting for OTU richness and evenness. Corresponding statistical significance was determined using the Mann-Whitney U test. The results were displayed using boxplots. Beta diversity was measured using Bray-Curtis Index distance. Corresponding statistical significance was assessed via Permutational Multivariate Analysis of Variance Using Distance Matrices (PERMANOVA). The results were presented as principal coordinates analysis plots (PCoA) to illustrate relationships between the vole microbiomes based on infection category.
To assess the microbial community abundances between different experimental variables, we employed two analyses to identify differentially abundant communities. Classical univariate analysis was used to identify differentially abundant community profiles using Mann-Whitney U (two variables) and Kruskal-Wallis (three variables) analysis based on a single grouping experimental variable. Bioconductor MetagenomeSeq analysis [42], accessed via the Microbiomeanalyst platform, was also used to account for the effects of normalisation and under-sampling of microbial communities. This method was implemented in addition to classical univariate analysis as it is specifically designed to address normalisation and biases in measurements across taxonomic features by way of a zero-inflated Gaussian distribution model to account for the variety in sequencing depth. This method is beneficial, as it aids in the detection of differentially abundant rare taxa.
LEfSE (Linear discriminant analysis Effect Size) was used to perform non-parametric factorial Kruskal-Wallis sum-rank test to identify which community abundance features were significantly different with regard to the experimental factor and most likely to explain differences between experimental variables.

3. Results

3.1. Occurrence of Intestinal Protists

Of the 29 faecal samples collected from 16 voles, DNA was successfully extracted from 28 of these and was screened for Cryptosporidium, Giardia and Blastocystis (Table 1). Blastocystis was detected in 7/16 voles (44%) and in 9/28 samples (32%). A total of 39 clones were sent for sequencing and 16/39 were positive (41%). Of the 28 successfully extracted faecal samples, 5/28 and 4/16 (25%) voles were sequence positive for Giardia A total of 95 clones were sent for sequencing, of which 11/95 (12%) were sequence positive. A total of 5/28 (18%) samples and 5/16 voles (31%) were sequence positive for Cryptosporidium and generated 11/68 positive clones (16%).

3.2. Characterisation of Bacterial Communities in the Stool

A total of 2,469,175 reads were obtained from 16S rRNA amplicon sequencing. After quality filtering and processing, the total read count measured at 1,509,628, with an average of 53,915 reads per sample. The maximum and minimum counts per sample were 76,169 and 34,050, respectively. The final operational taxonomic unit (OTU) number was 778. Low count filtering was applied, with a minimum count of four reads at a 20% prevalence across the samples. Data normalisation was used to account for the large variability of total read counts between samples. The library was not rarefied, in order to reduce loss of possibly significant data from high sequence counts due to the relatively small difference in library sizes (<10×). Variance filtering screened out features that were close to constant and was measured using the inter-quartile range, which was set to a 10% threshold. A total of 162 low-abundance features were removed based on low read count and 20 low-variance features were removed based on the inter-quartile range; 171 features remained. The data were scaled via total sum scaling to address uneven sequencing depth.

3.3. Taxonomic Composition Diversity and Community Profiling

There are few overall observable differences in the taxonomic composition of the samples in the present study. OTUs spanned seven phyla and all but one sample was dominated by Bacteroidetes (63% relative abundance across all samples) followed by Firmicutes (31% relative abundance across all samples), with the exception of four samples, which were dominated by Firmicutes. Actinobacteria, Cyanobacteria, Proteobacteria and Tenericutes were observed. Excluding Bacteroidetes and Firmicutes, the remaining phyla accounted for less than 10% of overall abundance. Vole R13 notably varied at the phylum level and was dominated by Proteobacteria at a relative abundance of 32% compared with the 1% relative abundance average for the rest of the voles in the second time point (Figure 1).
Overall, less than 2% of reads were not assigned at the phylum level. At the family level, the number of unassigned OTUs was 50%, while at the genus level this was over 60%. At the genus level, approximately 38% of the remaining (relative) abundance was composed of members of Duncaniella, followed by Ruminococcus (7%), Alistipes (5%), Allobaculum (5%), Muribaculum (4%), Christensenella (4%), Prevotella (3%), Bacteroides (3%), Clostridium (2%), Coprococcus (2%), Anaeromassilibacillus (2%), Flavonifractor (2%), Alloprevotella (1%), Anaerotignum (1%), Dubosiella (1%), Eisenbergiella (1%), Eubacterium (1%), Lactobacillus (1%), Prarprevotella (1%), Pedobacter (1%) (Figure 1).
Abundances did not differ in terms of sampling time points, with the following exceptions: at the phylum level, the relative abundance of Proteobacteria in vole R13 in the first collection (R13.1; Figure 1a) was <1%, while this increased to approximately 32% in the second collection (R13.2; Figure 1a). At the genus level, the vole Q88 had an average abundance of Christensenella of 7% in the first collection (Q88.1; Figure 1b), yet its abundance was greatly increased to over 40% in the second collection (Q88.2; Figure 1b).
Relative abundances of OTUs between B+, which were negative for other protozoa (n = 5), were also compared against the B− samples, Cryptosporidium and Giardia (n = 14) (Table A2). To minimise the impact of co-parasitism, results herein for Blastocystis are based on comparisons made between these two groups.
The relative abundances for B+ and B− voles at the phylum level (Figure 2a) and the genus level (Figure 2b) are displayed below, using the selected data detailed in Table A1.
We also performed a treated- versus untreated-animals analysis, but no significant differences were found (data not shown), either due to the small sample size (Metronidazole-treated animals = 3; Fenbendazole-treated animals = 5) or a result of the amount of time elapsed following treatment. This was the result of the treatment regimens implemented by the veterinary practice.

3.4. Microbial Diversity Measures

Alpha diversity was quantified using three methods: Observed species, Chao1, and Shannon indices. The Shapiro-Wilk test for normality classified the data as non-normally distributed; thus, non-parametric tests were used for all statistical analyses. For each result, between-group variations were measured using Mann-Whitney U test. Overall, no significant difference in OTU richness was observed between B+ and B− voles (Table A3, Figure 3).
Beta diversity measures were implemented using the Bray-Curtis dissimilarity index. This was accompanied by a PERMANOVA test to determine if centroids differed between variables of interest. Analysis was visualised with 2D ordination plots based on principal coordinate analysis (PCoA) (Table A4, Figure A1). The results showed no significant difference between the microbial communities of positive voles against negative voles (p < 0.05).

3.5. Microbial Community Comparison and Classification

To calculate the microbial community abundance, we used classical univariate analysis and MetagenomeSeq. Classical univariate analysis revealed no significant differences between B+ and B− voles (p < 0.05). MetagenomeSeq identified a total of 19 significant results when B+ was compared against B− (Table A5) (p < 0.05) and community abundance across different OTUs, as displayed in Table A6. Members of the Spirochaetes lineage were most notably negatively associated with the presence of Blastocystis, where a significant decrease was observed from the phylum to the genus Treponema. Members of the Betaproteobacteria lineage were also decreased in the presence of Blastocystis, and included the genus Variovorax. A total of nine genera decreased in the presence of Blastocystis, with Anaerocella being the only taxa to increase. Figure 4 displays boxplots for the log transformed count of significant OTUs visually representing the data presented in Table A6, including bacteria belonging to the same taxonomic lineages. All identified OTUs were significantly decreased in B+ voles, only the genus Anaerocella was significantly increased (Figure A2).
Lastly, Linear Discriminant Analysis (LDA) Effect Size (LEfSe) was implemented to investigate community comparisons. This method determines which OTU was most likely to explain the differences between classes by using standard statistical significance tests with additional tests to consider biological consistency and effect relevance. LEfSe using FDR-adjusted data (p value cut-off = 0.1) demonstrated that no significant taxa were observed when B+ voles were compared against B− voles.

4. Discussion

This pilot study provides the first investigation exploring the association of Blastocystis with bacterial communities in the gut of captive water voles (Arvicola amphibius) presenting no gastrointestinal symptoms at the time of collection. Twenty-nine samples were collected over two time points and the microbiome of twenty-eight of these was characterised. Of these, 44% were Blastocystis positive and were subsequently subtyped, and associations with bacterial microbiome were examined for the first time in this rodent.
Several studies on other rodents do exist, including those of the subfamily Arvicolinae [43,44,45]. Generally, the core Arvicolinae microbiota was made up predominantly of Firmicutes and Bacteroidetes, and this was the case here, with the majority of the water voles reporting Bacteroidetes and Firmicutes as the two dominant phyla, reflecting results across other mammalian studies [46]. Specifically, the abundance of Bacteroidetes was higher (65%) in comparison to that of Firmicutes. Previous vole-based studies of captive and wild-captured cohorts have shown similar abundances [43]. In general, studies in humans and rodents have shown that Bacteroidetes-driven microbiota may be the result of low fat/high fibre diet [47,48,49,50]. Nonetheless, rats showed a less than 10% abundance of Bacteroidetes, possibly reflecting their omnivorous nature [51]. The water voles in this study were fed a diet rich in fibrous material including fruits, legumes, willow leaves and bark, which likely accounts towards the high abundance of Bacteroidetes [45]. Besides the two dominant phyla, the bacterial communities of the water voles diversified further at the lower taxonomic levels, in accordance with numerous microbiome-based studies [52,53]. More research investigating composition of the bacterial community and abundance of individual taxa in a wide range of vole species will help establish the gut microbiome makeup of these small rodents.
An exception to the above was noted in one water vole, which displayed a markedly different abundance profile from the rest during the second collection. Specifically, this water vole (R13) had a drastic change in the relative abundance of Proteobacteria between collections, with the value increasing from <1% in the first collection to over 30% in just one month. This alteration was also accompanied by a decrease in the relative abundance of Bacteroidetes from 85% to 49% between collections. The water vole that died from unknown causes on the morning of the second collection had a high abundance of Proteobacteria, which is often associated with dysbiosis in animal studies including humans, where it has been linked to both intestinal related diseases, such as Crohn’s disease, as well as extra-intestinal disease possibly indicating a disruption of enteric homeostasis [54,55,56,57,58]. This implies a use for Proteobacteria as a biomarker for intestinal dysbiosis in captive water voles.
In recent years, hypotheses regarding the association of opportunistic protists with distinct microbial profiles have been brought forth [59,60,61,62,63]. Among those, the most-studied protist is Blastocystis, which has been suggested to be an “ecosystem engineer” [64]. Presence of Blastocystis has been associated with an increase in overall bacterial diversity and richness. A negative association with Bacteroides and presence of Blastocystis has been consistently found across human studies [64,65,66,67]. Positive associations with Roseburia and Faecalibacterium, which are often associated with eubiosis, have also been noted [68,69]. Presence of this protist has also been linked to a decrease in Hymenolepis nana, which has been associated with alterations in the microbiota [70,71], these results led to the hypothesis that Blastocystis is part of the healthy intestinal microbiome in humans. Contrary to this, a single study focusing on chimpanzees demonstrated that bearing Blastocystis was associated with decreased microbial richness and decline in the ‘protective’ species Faecalibacterium prausnitzii and increase in Enterobacteriaceae, a marker of poor intestinal health in humans [62]. Herein, contrary to the human studies, we found no significant differences between the microbial profiles of water voles with and without Blastocystis. A possible explanation could be that the presence of Blastocystis in water voles might not have the same associations as those observed in humans. Other possible hypotheses could be the homogenisation of bacterial taxa due to captivity and/or disturbances due to drug administration. Due to the small size (16 individuals, <30 samples), we cannot at this point draw a definitive conclusion.
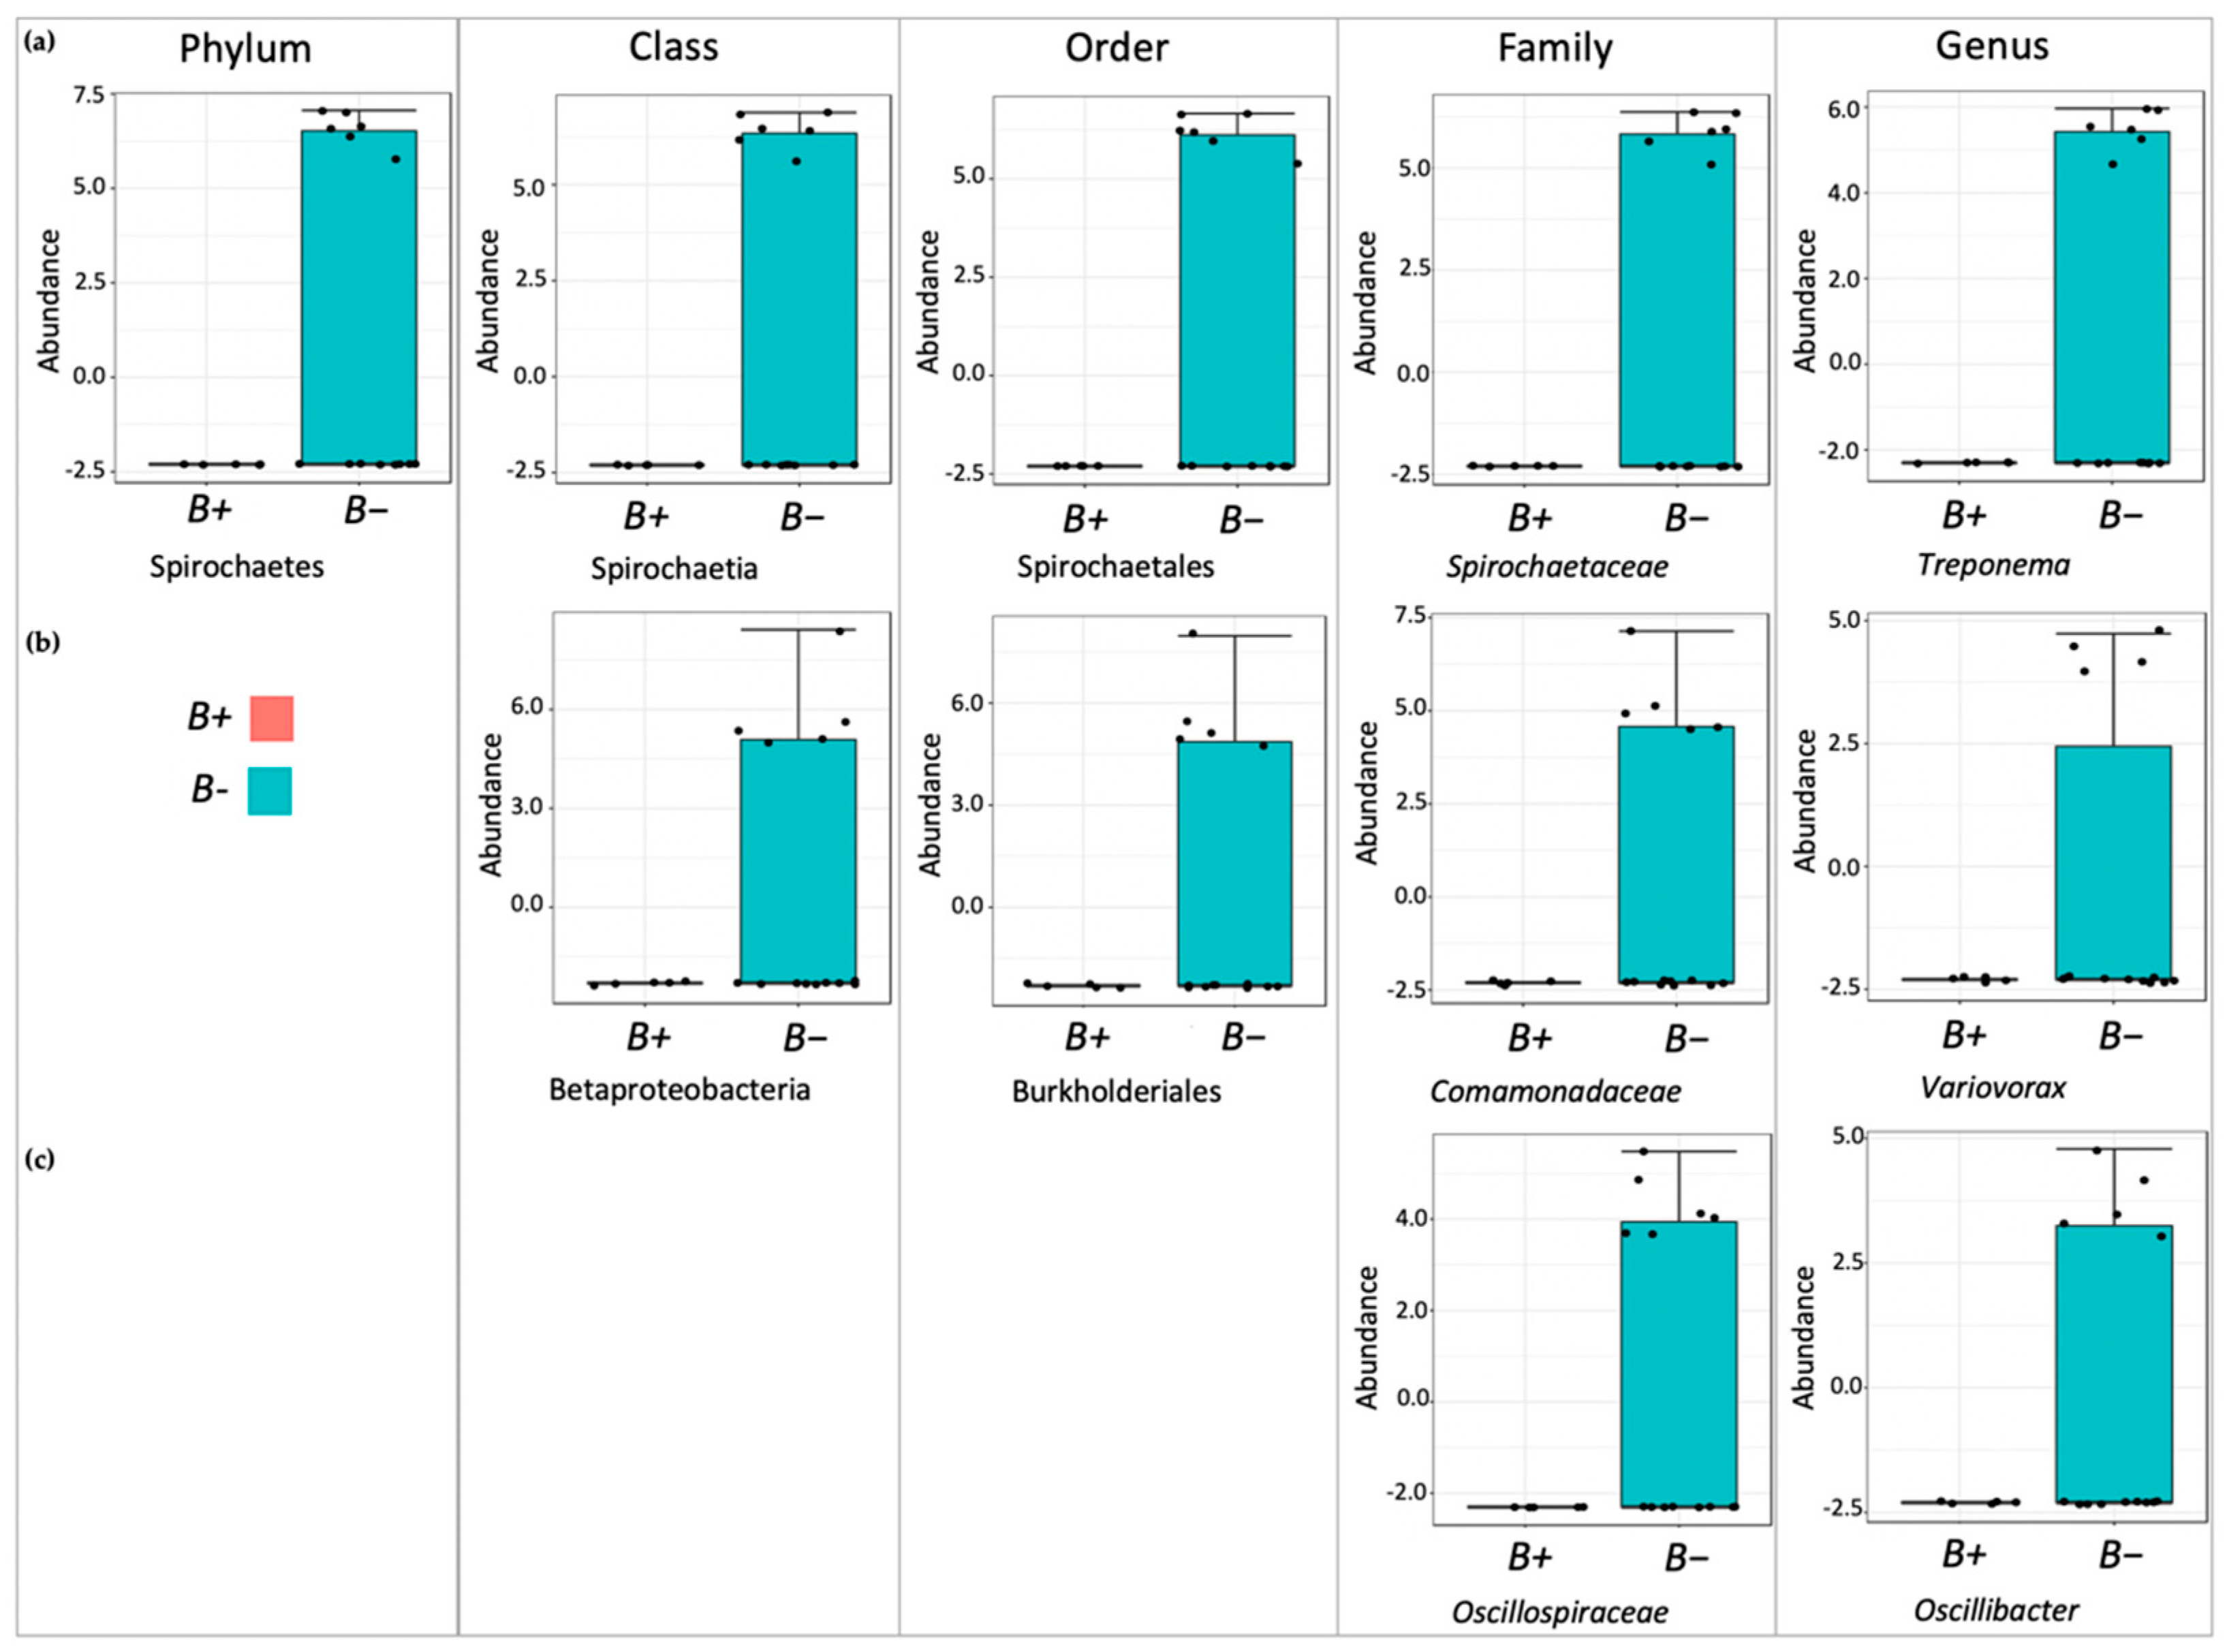
Although the overall microbial community richness was similar in water voles with and without Blastocystis, closer inspection of community comparisons indicated that reductions in Treponema and Kineothrix were strongly associated with Blastocystis presence. Treponema has been associated with degradation of plant materials in the rumen [72]. In support of this, Treponema has been found in significantly higher abundances in the gut of humans living in rural areas and eating fibre-rich diets, while it is typically absent in urbanites consuming fibre-poor diets [73,74]. The bacterium has also been associated with the vole microbiota, where it likely has similar roles [44]. Nonetheless, it is worth noting that other common degraders, such as Prevotella, Ruminococcus and Oscillospira, were not significantly decreased in Blastocystis carriers herein. This suggests that the observed decline in Treponema likely does not impair the ability of the water vole to degrade plant materials. Kineothrix was also significantly decreased in positive voles, this bacterium produces butyrate, a metabolite that serves as energy source of enterocytes and has notable anti-inflammatory and immunomodulatory properties [75]. Furthermore, the Firmicutes genera Thermoclostridium, Anaeromassilibacillus and Anaerotignum were also decreased in positive water voles; however, most of these have uncharacterised roles in the murine microbiota. Nonetheless, Firmicutes are generally associated with fermentation of dietary fibre and production of short-chain fatty acids [76]. Overall, the observed significant reductions of specific bacterial taxa may represent the beginnings of a disturbed gut, which is a hallmark of the transition from free-living to a more confined lifestyle. Nonetheless, definitive conclusions cannot be drawn, as there was redundancy of function in the gut, which may be enhanced by the presence of Blastocystis, as the organism has been associated with increased species richness in the gut [67,77,78,79]. Alternatively, the observed shifts might be associated with an as-yet-unidentified factor other than Blastocystis.
Several of the water voles were also colonised with either Giardia or Cryptosporidium and in several cases with more than just one of these microbial eukaryotes. Notably, the water voles also received the antiprotozoal drugs fenbendazole and metronidazole against Giardia and treatments had ended by the time of sampling. Despite this, there were no differences in either alpha or beta diversities in any of these groups. This, along with the absence of diarrhoea or other GI symptoms, suggests that the water voles might be carriers of these parasites.

5. Conclusions

In conclusion, these results provide an insight into the prevalence of Blastocystis and its association with bacterial communities present in the gut of captive water voles. The apparent lack of symptoms in the cohort and lack of overall shift in community richness and diversity of positive voles indicates that Blastocystis may not be associated with a detrimental effect on the gut microbiota. One could also raise questions regarding the necessity of antiprotozoal treatments in asymptomatic animals. Clearly, anthropogenic-focused microbiome studies do not reflect those of animals. Therefore, further investigations into the presence of Blastocystis and associated microbial profiles across a range of host taxa in captivity and wild populations will hopefully shed light on the roles of protozoal colonisation and resulting impacts this may pose for conservation efforts.

Author Contributions

Conceptualisation, A.D.T. and E.L.B.; methodology, E.L.B., S.H., L.T. and J.R.B.; formal analysis, E.L.B., A.D., E.M. and E.G.; investigation, A.D.T., E.G., and E.L.B.; resources, H.R., K.T., V.B., A.I.C. and A.D.T.; writing—original draft preparation, E.L.B.; writing—review and editing, A.D.T. and E.G.; supervision, A.D.T.; funding acquisition, A.D.T. All authors have read and agreed to the published version of the manuscript.

Funding

This research was funded by BBSRC, grant number BB/M009971/1.

Institutional Review Board Statement

Some water voles in this study were part of a re-introduction project with a wildlife trust and other partners. A mandatory component of any release project conducted within the UK is that individuals have to go through a pre-release health screening as part of the Natural England/APHA release protocol (Natural England Ref: 2016-26280-SCI-SCI-1). This pre-release health screening and any resulting medication requirements/protocols were all advised on and conducted by an external veterinary practice. This study piggybacked on the health screening process and was not in control of it or provided any interventions either. This study was only focusing on the collection of the faecal samples from selected voles and there were no ethical implications. Consequently, there was no need for perusal of any further ethical approvals.

Informed Consent Statement

Not applicable.

Data Availability Statement

All data have been submitted to GenBank under Bioproject number SUB9442672.

Acknowledgments

We thank members of the Tsaousis laboratory and the zookeepers from Wildwood Trust for assisting with sample collection and accommodating us during our visitations.

Conflicts of Interest

The authors declare no conflict of interest.

Appendix A

Table A1. Summary of PCR primers used in this study.
Target OrganismGenePrimer PairReference
Blastocystis18s rRNARD3 / RD5[80,81]
Blastocystis18s rRNARD5F / BhRDr
Cryptosporidium18s rRNACRY F1 / CRY R1[82]
Cryptosporidium18s rRNARDY F2 / CRY R2
GiardiagdhGDHeF / GDHiF[83]
GiardiagdhGDHeF / GDHiR
Table A2. Summary of the voles that will be included in subsequent analysis for Blastocystis-related investigation. Previous drug treatment (ending 10+ days prior to collection) was also recorded.
Water Vole IDCollection DateBlastocystis PositivePrior Drug Treatment
C318.01.19YesYes
C420.02.19YesNo
R1220.02.19YesNo
Q9920.02.19YesYes
Q8420.02.19YesYes
Q5118.01.19NoNo
Q5120.02.19NoNo
Q75A18.01.19NoNo
Q75A20.02.19NoNo
R2220.02.19NoNo
Q85A18.01.19NoNo
Q8818.01.19NoNo
Q8820.02.19NoNo
R1218.01.19NoNo
R1320.02.19NoNo
R420.02.19NoNo
R9518.01.19NoNo
Q8418.01.19NoYes
Q9918.01.19NoYes
Table A3. Alpha diversity results for Blastocystis positive (B+) voles compared with negative (B-) voles. Diversity was measured using three methods: Observed, Chao1 and Shannon indices at each taxonomic level. No statistically significant results were identified (p < 0.05).
Experimental FactorTaxonomic LevelDiversity Measurep-ValueMann-Whitney Statistic
BlastocystisPhylumObserved0.5511141.5
Chao10.5511141.5
Shannon0.391325
ClassObserved0.3437345.5
Chao10.3437345.5
Shannon0.219321
OrderObserved0.4555243.5
Chao10.4555243.5
Shannon0.219321
FamilyObserved0.6761540
Chao10.6761540
Shannon0.3426224
GenusObserved0.8894137
Chao10.8894137
Shannon0.6867930
Table A4. Beta diversity results for Blastocystis positive (B+) voles compared with negative (B-) voles. Diversity was measured using Bray-Curtis dissimilarity index with Permutational Multivariate Analysis of Variance Using Distance Matrices (PERMANOVA). No significant results were identified (p < 0.05).
Experimental FactorTaxonomic LevelF-ValueR-Squared Valep-Value
BlastocystisPhylum1.12080.061854<0.311
Class0.820660.046051<0.44
Order0.818180.045918<0.444
Family0.722350.040759<0.597
Genus0.823720.046215<0.519
Table A5. Significant OTUs identified by MetagenomeSeq as differentially abundant between B+ and B- samples (p < 0.05). A total of 19 significant results were identified here, the observed difference in community abundance summarises the observed change between B+ and B- for each OUT.
Experimental FactorOTU NameObserved Difference in Community Abundancep-ValueFDR
BlastocystisPhylumSpirochaetesDecrease in infected5.43 × 10−94.35 × 10⁻⁸
ClassSpirochaetiaDecrease in infected1.15 × 10−91.49 × 10⁻⁸
ClassBetaproteobacteriaDecrease in infected3.48 × 10−72.26 × 10⁻⁶
ClassEpsilonproteobacteriaDecrease in infected4.43 × 10−51.92 × 10⁻⁴
OrderSpirochaetalesDecrease in infected3.86 × 10−85.78 × 10⁻⁷
OrderBurkholderialesDecrease in infected1.37 × 10−61.03 × 10⁻⁵
FamilySpirochaetaceaeDecrease in infected 1.26 × 10−83.03 × 10−7
FamilyOscillospiraceaeDecrease in infected 8.01 × 10−79.61 × 10−6
FamilyComamonadaceaeDecrease in infected4.38 × 10−63.50 × 10⁻⁵
GenusTreponemaDecrease in infected 1.90 × 10−88.35 × 10−7
GenusVariovoraxDecrease in infected 2.17 × 10−64.77 × 10−5
GenusKineothrixDecrease in infected 5.33 × 10−56.99 × 10−4
GenusOscillibacterDecrease in infected 6.36 × 10−56.99 × 10−4
GenusRobinsoniellaDecrease in infected 4.30 × 10−43.79 × 10−3
GenusThermoclostridiumDecrease in infected 1.40 × 10−31.03 × 10−2
GenusKiloniellaDecrease in infected 3.06 × 10−31.92 × 10−2
GenusAnaeromassilibacillusDecrease in infected 5.77 × 10−32.99 × 10−2
GenusAnaerotignumDecrease in infected 6.11 × 10−32.99 × 10−2
GenusAnaerocellaIncrease in infected7.99 × 10−33.52 × 10⁻²
Table A6. Taxa table showing the relationships between identified OTUs via MetagenomeSeq. The observed change in OTU abundance in B+ voles compared with B- voles is summarised in the ‘Result’ column.
PhylumClassOrderFamilyGenusResult
SpirochaetesSpirochaetiaSpirochaetalesSpirochaetaceaeTreponemaDecrease
BetaproteobacteriaBurkholderialesComamonadaceaeVariovoraxDecrease
Epsilonproteobacteria Decrease
OscillospiraceaeOscillibacterDecrease
KineothrixDecrease
RobinsoniellaDecrease
ThermoclostridiumDecrease
KiloniellaDecrease
AnaeromassilibacillusDecrease
AnaerotignumDecrease
AnaerocellaIncrease
Figure A1. Principal Coordinate Analysis (PCoA) plots of the beta diversity of B+ voles (red) and B- voles (blue) based on Bray-Curtis dissimilarity index (a) shows the Beta-diversity PCoA plot at the phylum level and (b) shows the Beta-diversity PCoA at the genus level.
Biology 10 00457 g0a1
Figure A2. Box-plots showing the filtered count and log transformed counts from MetagenomeSeq data of the genus Anaerocella. This was the only bacterial taxon positively associated with Blastocystis colonisation in the study cohort (p < 0.05). Red plots reflect B+ data, and blue plots represent B- data.
Biology 10 00457 g0a2

References

  1. Foster, K.R.; Schluter, J.; Coyte, K.Z.; Rakoff-Nahoum, S. The Evolution of the Host Microbiome as an Ecosystem on a Leash. Nature 2017, 548, 43–51. [Google Scholar] [CrossRef] [Green Version]
  2. Arumugam, M.; Raes, J.; Pelletier, E.; Le Paslier, D.; Yamada, T.; Mende, D.R.; Fernandes, G.R.; Tap, J.; Bruls, T.; Batto, J.-M.; et al. Enterotypes of the Human Gut Microbiome. Nature 2011, 473, 174–180. [Google Scholar] [CrossRef]
  3. Falony, G.; Joossens, M.; Vieira-Silva, S.; Wang, J.; Darzi, Y.; Faust, K.; Kurilshikov, A.; Bonder, M.J.; Valles-Colomer, M.; Vandeputte, D.; et al. Population-Level Analysis of Gut Microbiome Variation. Science 2016, 352, 560–564. [Google Scholar] [CrossRef] [PubMed]
  4. Geva-Zatorsky, N.; Sefik, E.; Kua, L.; Pasman, L.; Tan, T.G.; Ortiz-Lopez, A.; Yanortsang, T.B.; Yang, L.; Jupp, R.; Mathis, D.; et al. Mining the Human Gut Microbiota for Immunomodulatory Organisms. Cell 2017, 168, 928–943.e11. [Google Scholar] [CrossRef] [PubMed] [Green Version]
  5. Rinninella, E.; Raoul, P.; Cintoni, M.; Franceschi, F.; Miggiano, G.A.D.; Gasbarrini, A.; Mele, M.C. What Is the Healthy Gut Microbiota Composition? A Changing Ecosystem across Age, Environment, Diet, and Diseases. Microorganisms 2019, 7. [Google Scholar] [CrossRef] [PubMed] [Green Version]
  6. Qin, N.; Yang, F.; Li, A.; Prifti, E.; Chen, Y.; Shao, L.; Guo, J.; Le Chatelier, E.; Yao, J.; Wu, L.; et al. Alterations of the Human Gut Microbiome in Liver Cirrhosis. Nature 2014, 513, 59–64. [Google Scholar] [CrossRef]
  7. Henderson, G.; Cox, F.; Ganesh, S.; Jonker, A.; Young, W.; Janssen, P.H. Rumen Microbial Community Composition Varies with Diet and Host, but a Core Microbiome Is Found across a Wide Geographical Range. Sci. Rep. 2015, 5, 14567. [Google Scholar] [CrossRef] [PubMed]
  8. Jami, E.; White, B.A.; Mizrahi, I. Potential Role of the Bovine Rumen Microbiome in Modulating Milk Composition and Feed Efficiency. PLoS ONE 2014, 9, e85423. [Google Scholar] [CrossRef] [PubMed]
  9. Jami, E.; Israel, A.; Kotser, A.; Mizrahi, I. Exploring the Bovine Rumen Bacterial Community from Birth to Adulthood. ISME J. 2013, 7, 1069–1079. [Google Scholar] [CrossRef] [Green Version]
  10. Coelho, L.P.; Kultima, J.R.; Costea, P.I.; Fournier, C.; Pan, Y.; Czarnecki-Maulden, G.; Hayward, M.R.; Forslund, S.K.; Schmidt, T.S.B.; Descombes, P.; et al. Similarity of the Dog and Human Gut Microbiomes in Gene Content and Response to Diet. Microbiome 2018, 6, 72. [Google Scholar] [CrossRef]
  11. Jha, A.R.; Shmalberg, J.; Tanprasertsuk, J.; Perry, L.; Massey, D.; Honaker, R.W. Characterization of Gut Microbiomes of Household Pets in the United States Using a Direct-to-Consumer Approach. PLoS ONE 2020, 15. [Google Scholar] [CrossRef] [PubMed] [Green Version]
  12. Cheng, Y.; Fox, S.; Pemberton, D.; Hogg, C.; Papenfuss, A.T.; Belov, K. The Tasmanian Devil Microbiome—Implications for Conservation and Management. Microbiome 2015, 3, 76. [Google Scholar] [CrossRef] [PubMed] [Green Version]
  13. Chong, R.; Grueber, C.E.; Fox, S.; Wise, P.; Barrs, V.R.; Hogg, C.J.; Belov, K. Looking like the Locals-Gut Microbiome Changes Post-Release in an Endangered Species. Anim. Microbiome 2019, 1, 8. [Google Scholar] [CrossRef] [Green Version]
  14. Clayton, J.B.; Vangay, P.; Huang, H.; Ward, T.; Hillmann, B.M.; Al-Ghalith, G.A.; Travis, D.A.; Long, H.T.; Tuan, B.V.; Minh, V.V.; et al. Captivity Humanizes the Primate Microbiome. Proc. Natl. Acad. Sci. USA 2016, 113, 10376–10381. [Google Scholar] [CrossRef] [PubMed] [Green Version]
  15. Kohl, K.D.; Dearing, M.D. Wild-Caught Rodents Retain a Majority of Their Natural Gut Microbiota upon Entrance into Captivity. Environ. Microbiol. Rep. 2014, 6, 191–195. [Google Scholar] [CrossRef] [PubMed]
  16. Mathews, F.; Orros, M.; McLaren, G.; Gelling, M.; Foster, R. Keeping Fit on the Ark: Assessing the Suitability of Captive-Bred Animals for Release. Biol. Conserv. 2005, 121, 569–577. [Google Scholar] [CrossRef]
  17. McKenzie, V.J.; Song, S.J.; Delsuc, F.; Prest, T.L.; Oliverio, A.M.; Korpita, T.M.; Alexiev, A.; Amato, K.R.; Metcalf, J.L.; Kowalewski, M.; et al. The Effects of Captivity on the Mammalian Gut Microbiome. Integr. Comp. Biol. 2017, 57, 690–704. [Google Scholar] [CrossRef] [Green Version]
  18. Zhang, B.; Ren, J.; Yang, D.; Liu, S.; Gong, X. Comparative Analysis and Characterization of the Gut Microbiota of Four Farmed Snakes from Southern China. PeerJ 2019, 7. [Google Scholar] [CrossRef]
  19. Gibson, K.M.; Nguyen, B.N.; Neumann, L.M.; Miller, M.; Buss, P.; Daniels, S.; Ahn, M.J.; Crandall, K.A.; Pukazhenthi, B. Gut Microbiome Differences between Wild and Captive Black Rhinoceros–Implications for Rhino Health. Sci. Rep. 2019, 9, 7570. [Google Scholar] [CrossRef] [Green Version]
  20. Oliveira, B.C.M.; Murray, M.; Tseng, F.; Widmer, G. The Fecal Microbiota of Wild and Captive Raptors. Anim. Microbiome 2020, 2, 15. [Google Scholar] [CrossRef]
  21. Tang, G.-S.; Liang, X.-X.; Yang, M.-Y.; Wang, T.-T.; Chen, J.-P.; Du, W.-G.; Li, H.; Sun, B.-J. Captivity Influences Gut Microbiota in Crocodile Lizards (Shinisaurus crocodilurus). Front. Microbiol. 2020, 11. [Google Scholar] [CrossRef] [PubMed]
  22. Betts, E.L.; Gentekaki, E.; Thomasz, A.; Breakell, V.; Carpenter, A.I.; Tsaousis, A.D. Genetic Diversity of Blastocystis in Non-Primate Animals. Parasitology 2018, 145, 1228–1234. [Google Scholar] [CrossRef] [PubMed] [Green Version]
  23. Betts, E.L.; Gentekaki, E.; Tsaousis, A.D. Exploring Micro-Eukaryotic Diversity in the Gut: Co-Occurrence of Blastocystis Subtypes and Other Protists in Zoo Animals. Front. Microbiol. 2020, 11. [Google Scholar] [CrossRef]
  24. Gelling, M.; Zochowski, W.; Macdonald, D.W.; Johnson, A.; Palmer, M.; Mathews, F. Leptospirosis Acquisition Following the Reintroduction of Wildlife. Vet. Rec. 2015, 177, 440. [Google Scholar] [CrossRef] [PubMed]
  25. Leighton, F.A. Health Risk Assessment of the Translocation of Wild Animals. Rev. Sci. Tech. Int. Off. Epizoot. 2002, 21, 187–195. [Google Scholar]
  26. Mathews, F.; Moro, D.; Strachan, R.; Gelling, M.; Buller, N. Health Surveillance in Wildlife Reintroductions. Biol. Conserv. 2006, 131, 338–347. [Google Scholar] [CrossRef]
  27. Redford, K.H.; Segre, J.A.; Salafsky, N.; del Rio, C.M.; McAloose, D. Conservation and the Microbiome. Conserv. Biol. J. Soc. Conserv. Biol. 2012, 26, 195–197. [Google Scholar] [CrossRef] [PubMed] [Green Version]
  28. Seddon, P.J.; Armstrong, D.P.; Maloney, R.F. Developing the Science of Reintroduction Biology. Conserv. Biol. 2007, 21, 303–312. [Google Scholar] [CrossRef]
  29. MacPherson, J.L.; Bright, P.W. Metapopulation Dynamics and a Landscape Approach to Conservation of Lowland Water Voles (Arvicola amphibius). Landsc. Ecol. 2011, 26, 1395–1404. [Google Scholar] [CrossRef]
  30. Gow, D.; Holder, K.; Jeffrey, C. The Relevance of Captive Breeding as a Successful Component in Water Vole (Arvicola Terrestris) Translocation Projects. Ecol. Environ. Manag. Pract. 2004, 44, 14–17. [Google Scholar]
  31. Gow, D. Water Vole Reintroduction Projects–the Lessons and the Success Factors. ECOS Br. Assoc. Nat. Conserv. 2007, 28, 98. [Google Scholar]
  32. Weisburg, W.G.; Barns, S.M.; Pelletier, D.A.; Lane, D.J. 16S Ribosomal DNA Amplification for Phylogenetic Study. J. Bacteriol. 1991, 173, 697–703. [Google Scholar] [CrossRef] [PubMed] [Green Version]
  33. Leser, T.D.; Amenuvor, J.Z.; Jensen, T.K.; Lindecrona, R.H.; Boye, M.; Møller, K. Culture-Independent Analysis of Gut Bacteria: The Pig Gastrointestinal Tract Microbiota Revisited. Appl. Environ. Microbiol. 2002, 68, 673–690. [Google Scholar] [CrossRef] [PubMed] [Green Version]
  34. Edgar, R.C.; Haas, B.J.; Clemente, J.C.; Quince, C.; Knight, R. UCHIME Improves Sensitivity and Speed of Chimera Detection. Bioinformatics 2011, 27, 2194–2200. [Google Scholar] [CrossRef] [PubMed] [Green Version]
  35. Rognes, T.; Flouri, T.; Nichols, B.; Quince, C.; Mahé, F. VSEARCH: A Versatile Open Source Tool for Metagenomics. PeerJ 2016, 4, e2584. [Google Scholar] [CrossRef]
  36. Magoč, T.; Salzberg, S.L. FLASH: Fast Length Adjustment of Short Reads to Improve Genome Assemblies. Bioinformatics 2011, 27, 2957–2963. [Google Scholar] [CrossRef] [PubMed]
  37. Martin, M. Cutadapt Removes Adapter Sequences from High-Throughput Sequencing Reads. EMBnet. J. 2011, 17, 10–12. [Google Scholar] [CrossRef]
  38. Eren, A.M.; Morrison, H.G.; Lescault, P.J.; Reveillaud, J.; Vineis, J.H.; Sogin, M.L. Minimum Entropy Decomposition: Unsupervised Oligotyping for Sensitive Partitioning of High-Throughput Marker Gene Sequences. ISME J. 2015, 9, 968–979. [Google Scholar] [CrossRef]
  39. Eren, A.M.; Maignien, L.; Sul, W.J.; Murphy, L.G.; Grim, S.L.; Morrison, H.G.; Sogin, M.L. Oligotyping: Differentiating between Closely Related Microbial Taxa Using 16S RRNA Gene Data. Methods Ecol. Evol. 2013, 4. [Google Scholar] [CrossRef] [Green Version]
  40. Angly, F.E.; Dennis, P.G.; Skarshewski, A.; Vanwonterghem, I.; Hugenholtz, P.; Tyson, G.W. CopyRighter: A Rapid Tool for Improving the Accuracy of Microbial Community Profiles through Lineage-Specific Gene Copy Number Correction. Microbiome 2014, 2, 11. [Google Scholar] [CrossRef]
  41. Dhariwal, A.; Chong, J.; Habib, S.; King, I.L.; Agellon, L.B.; Xia, J. MicrobiomeAnalyst: A Web-Based Tool for Comprehensive Statistical, Visual and Meta-Analysis of Microbiome Data. Nucleic Acids Res. 2017, 45, W180–W188. [Google Scholar] [CrossRef] [PubMed]
  42. Paulson, J.N.; Stine, O.C.; Bravo, H.C.; Pop, M. MetagenomeSeq: Statistical Analysis for Sparse High-Throughput Sequncing. Bioconductor Package. Nat. Methods 2013, 10, 1200–1202. [Google Scholar] [CrossRef] [PubMed] [Green Version]
  43. Allan, N.; Knotts, T.A.; Pesapane, R.; Ramsey, J.J.; Castle, S.; Clifford, D.; Foley, J. Conservation Implications of Shifting Gut Microbiomes in Captive-Reared Endangered Voles Intended for Reintroduction into the Wild. Microorganisms 2018, 6, 94. [Google Scholar] [CrossRef] [Green Version]
  44. Bo, T.-B.; Zhang, X.-Y.; Wen, J.; Deng, K.; Qin, X.-W.; Wang, D.-H. The Microbiota–Gut–Brain Interaction in Regulating Host Metabolic Adaptation to Cold in Male Brandt’s Voles (Lasiopodomys brandtii). ISME J. 2019, 13, 3037–3053. [Google Scholar] [CrossRef]
  45. Curtis, J.T.; Assefa, S.; Francis, A.; Köhler, G.A. Fecal Microbiota in the Female Prairie Vole (Microtus ochrogaster). PLoS ONE 2018, 13, e0190648. [Google Scholar] [CrossRef] [PubMed]
  46. Ley, R.E.; Lozupone, C.A.; Hamady, M.; Knight, R.; Gordon, J.I. Worlds within Worlds: Evolution of the Vertebrate Gut Microbiota. Nat. Rev. Microbiol. 2008, 6, 776–788. [Google Scholar] [CrossRef] [PubMed] [Green Version]
  47. Čoklo, M.; Maslov, D.R.; Kraljević Pavelić, S. Modulation of Gut Microbiota in Healthy Rats after Exposure to Nutritional Supplements. Gut Microbes 2020, 12, 1–28. [Google Scholar] [CrossRef] [PubMed]
  48. Evans, C.C.; LePard, K.J.; Kwak, J.W.; Stancukas, M.C.; Laskowski, S.; Dougherty, J.; Moulton, L.; Glawe, A.; Wang, Y.; Leone, V.; et al. Exercise Prevents Weight Gain and Alters the Gut Microbiota in a Mouse Model of High Fat Diet-Induced Obesity. PLoS ONE 2014, 9, e92193. [Google Scholar] [CrossRef] [PubMed]
  49. Ferrario, C.; Statello, R.; Carnevali, L.; Mancabelli, L.; Milani, C.; Mangifesta, M.; Duranti, S.; Lugli, G.A.; Jimenez, B.; Lodge, S. How to Feed the Mammalian Gut Microbiota: Bacterial and Metabolic Modulation by Dietary Fibers. Front. Microbiol. 2017, 8, 1749. [Google Scholar] [CrossRef]
  50. Simões, C.D.; Maukonen, J.; Kaprio, J.; Rissanen, A.; Pietiläinen, K.H.; Saarela, M. Habitual Dietary Intake Is Associated with Stool Microbiota Composition in Monozygotic Twins. J. Nutr. 2013, 143, 417–423. [Google Scholar] [CrossRef]
  51. Li, D.; Chen, H.; Mao, B.; Yang, Q.; Zhao, J.; Gu, Z.; Zhang, H.; Chen, Y.Q.; Chen, W. Microbial Biogeography and Core Microbiota of the Rat Digestive Tract. Sci. Rep. 2017, 7. [Google Scholar] [CrossRef] [PubMed]
  52. Parfrey, L.W.; Lahr, D.J.G.; Knoll, A.H.; Katz, L.A. Estimating the Timing of Early Eukaryotic Diversification with Multigene Molecular Clocks. Proc. Natl. Acad. Sci. USA 2011, 108, 13624–13629. [Google Scholar] [CrossRef] [PubMed] [Green Version]
  53. Parfrey, L.W.; Walters, W.A.; Lauber, C.L.; Clemente, J.C.; Berg-Lyons, D.; Teiling, C.; Kodira, C.; Mohiuddin, M.; Brunelle, J.; Driscoll, M.; et al. Communities of Microbial Eukaryotes in the Mammalian Gut within the Context of Environmental Eukaryotic Diversity. Front. Microbiol. 2014, 5. [Google Scholar] [CrossRef] [PubMed]
  54. Carvalho, F.A.; Koren, O.; Goodrich, J.K.; Johansson, M.E.V.; Nalbantoglu, I.; Aitken, J.D.; Su, Y.; Chassaing, B.; Walters, W.A.; González, A.; et al. Transient Inability to Manage Proteobacteria Promotes Chronic Gut Inflammation in TLR5-Deficient Mice. Cell Host Microbe 2012, 12, 139–152. [Google Scholar] [CrossRef] [PubMed] [Green Version]
  55. Frank, D.N.; St. Amand, A.L.; Feldman, R.A.; Boedeker, E.C.; Harpaz, N.; Pace, N.R. Molecular-Phylogenetic Characterization of Microbial Community Imbalances in Human Inflammatory Bowel Diseases. Proc. Natl. Acad. Sci. USA 2007, 104, 13780–13785. [Google Scholar] [CrossRef] [Green Version]
  56. Maharshak, N.; Packey, C.D.; Ellermann, M.; Manick, S.; Siddle, J.P.; Huh, E.Y.; Plevy, S.; Sartor, R.B.; Carroll, I.M. Altered Enteric Microbiota Ecology in Interleukin 10-Deficient Mice during Development and Progression of Intestinal Inflammation. Gut Microbes 2013, 4, 316–324. [Google Scholar] [CrossRef]
  57. Rizzatti, G.; Lopetuso, L.R.; Gibiino, G.; Binda, C.; Gasbarrini, A. Proteobacteria: A Common Factor in Human Diseases. Available online: https://www.hindawi.com/journals/bmri/2017/9351507/ (accessed on 14 December 2020).
  58. Vester-Andersen, M.K.; Mirsepasi-Lauridsen, H.C.; Prosberg, M.V.; Mortensen, C.O.; Träger, C.; Skovsen, K.; Thorkilgaard, T.; Nøjgaard, C.; Vind, I.; Krogfelt, K.A.; et al. Increased Abundance of Proteobacteria in Aggressive Crohn’s Disease Seven Years after Diagnosis. Sci. Rep. 2019, 9, 13473. [Google Scholar] [CrossRef] [Green Version]
  59. Berry, A.S.F.; Johnson, K.; Martins, R.; Sullivan, M.C.; Amorim, C.F.; Putre, A.; Scott, A.; Wang, S.; Lindsay, B.; Baldassano, R.N.; et al. Natural Infection with Giardia Is Associated with Altered Community Structure of the Human and Canine Gut Microbiome. mSphere 2020, 5. [Google Scholar] [CrossRef]
  60. McKenney, E.A.; Greene, L.K.; Drea, C.M.; Yoder, A.D. Down for the Count: Cryptosporidium Infection Depletes the Gut Microbiome in Coquerel’s Sifakas. Microb. Ecol. Health Dis. 2017, 28, 1335165. [Google Scholar] [CrossRef] [Green Version]
  61. Ras, R.; Huynh, K.; Desoky, E.; Badawy, A.; Widmer, G. Perturbation of the Intestinal Microbiota of Mice Infected with Cryptosporidium parvum. Int. J. Parasitol. 2015, 45, 567–573. [Google Scholar] [CrossRef]
  62. Renelies-Hamilton, J.; Noguera-Julian, M.; Parera, M.; Paredes, R.; Pacheco, L.; Dacal, E.; Saugar, J.M.; Rubio, J.M.; Poulsen, M.; Köster, P.C.; et al. Exploring Interactions between Blastocystis sp., Strongyloides spp. and the Gut Microbiomes of Wild Chimpanzees in Senegal. Infect. Genet. Evol. 2019, 74, 104010. [Google Scholar] [CrossRef] [PubMed]
  63. Yanagawa, Y.; Nagata, N.; Yagita, K.; Watanabe, K.; Okubo, H.; Kikuchi, Y.; Gatanaga, H.; Oka, S.; Watanabe, K. Clinical Features and Gut Microbiome of Asymptomatic Entamoeba histolytica Infection. Clin. Infect. Dis. 2020. [Google Scholar] [CrossRef] [PubMed]
  64. Laforest-Lapointe, I.; Arrieta, M.-C. Microbial Eukaryotes: A Missing Link in Gut Microbiome Studies. mSystems 2018, 3. [Google Scholar] [CrossRef] [PubMed] [Green Version]
  65. Audebert, C.; Even, G.; Cian, A.; Loywick, A.; Merlin, S.; Viscogliosi, E.; Chabé, M. Colonization with the Enteric Protozoa Blastocystis Is Associated with Increased Diversity of Human Gut Bacterial Microbiota. Sci. Rep. 2016, 6, 1–11. [Google Scholar] [CrossRef]
  66. Nieves-Ramírez, M.E.; Partida-Rodríguez, O.; Laforest-Lapointe, I.; Reynolds, L.A.; Brown, E.M.; Valdez-Salazar, A.; Morán-Silva, P.; Rojas-Velázquez, L.; Morien, E.; Parfrey, L.W.; et al. Asymptomatic Intestinal Colonization with Protist Blastocystis Is Strongly Associated with Distinct Microbiome Ecological Patterns. mSystems 2018, 3. [Google Scholar] [CrossRef] [Green Version]
  67. Tito, R.Y.; Chaffron, S.; Caenepeel, C.; Lima-Mendez, G.; Wang, J.; Vieira-Silva, S.; Falony, G.; Hildebrand, F.; Darzi, Y.; Rymenans, L.; et al. Population-Level Analysis of Blastocystis Subtype Prevalence and Variation in the Human Gut Microbiota. Gut 2019, 68, 1180–1189. [Google Scholar] [CrossRef] [Green Version]
  68. Sokol, H.; Pigneur, B.; Watterlot, L.; Lakhdari, O.; Bermúdez-Humarán, L.G.; Gratadoux, J.-J.; Blugeon, S.; Bridonneau, C.; Furet, J.-P.; Corthier, G.; et al. Faecalibacterium prausnitzii Is an Anti-Inflammatory Commensal Bacterium Identified by Gut Microbiota Analysis of Crohn Disease Patients. Proc. Natl. Acad. Sci. USA 2008, 105, 16731–16736. [Google Scholar] [CrossRef] [Green Version]
  69. Tamanai-Shacoori, Z.; Smida, I.; Bousarghin, L.; Loreal, O.; Meuric, V.; Fong, S.B.; Bonnaure-Mallet, M.; Jolivet-Gougeon, A. Roseburia spp.: A Marker of Health? Available online: https://www.futuremedicine.com/doi/abs/10.2217/fmb-2016-0130 (accessed on 25 February 2021).
  70. Aivelo, T.; Norberg, A. Parasite–Microbiota Interactions Potentially Affect Intestinal Communities in Wild Mammals. J. Anim. Ecol. 2018, 87, 438–447. [Google Scholar] [CrossRef] [Green Version]
  71. Nourrisson, C.; Scanzi, J.; Pereira, B.; NkoudMongo, C.; Wawrzyniak, I.; Cian, A.; Viscogliosi, E.; Livrelli, V.; Delbac, F.; Dapoigny, M.; et al. Blastocystis Is Associated with Decrease of Fecal Microbiota Protective Bacteria: Comparative Analysis between Patients with Irritable Bowel Syndrome and Control Subjects. PLoS ONE 2014, 9, e111868. [Google Scholar] [CrossRef]
  72. Bekele, A.Z.; Koike, S.; Kobayashi, Y. Phylogenetic Diversity and Dietary Association of Rumen Treponema Revealed Using Group-Specific 16S RRNA Gene-Based Analysis. FEMS Microbiol. Lett. 2011, 316, 51–60. [Google Scholar] [CrossRef]
  73. Angelakis, E.; Bachar, D.; Yasir, M.; Musso, D.; Djossou, F.; Gaborit, B.; Brah, S.; Diallo, A.; Ndombe, G.M.; Mediannikov, O.; et al. Treponema Species Enrich the Gut Microbiota of Traditional Rural Populations but Are Absent from Urban Individuals. New Microbes New Infect. 2018, 27, 14–21. [Google Scholar] [CrossRef] [PubMed]
  74. Bittar, F.; Keita, M.B.; Lagier, J.-C.; Peeters, M.; Delaporte, E.; Raoult, D. Gorilla gorilla gorilla Gut: A Potential Reservoir of Pathogenic Bacteria as Revealed Using Culturomics and Molecular Tools. Sci. Rep. 2014, 4, 7174. [Google Scholar] [CrossRef] [PubMed]
  75. Canani, R.B.; Costanzo, M.D.; Leone, L.; Pedata, M.; Meli, R.; Calignano, A. Potential Beneficial Effects of Butyrate in Intestinal and Extraintestinal Diseases. World J. Gastroenterol. 2011, 17, 1519–1528. [Google Scholar] [CrossRef] [PubMed]
  76. Simpson, H.L.; Campbell, B.J. Review Article: Dietary Fibre–Microbiota Interactions. Aliment. Pharmacol. Ther. 2015, 42, 158–179. [Google Scholar] [CrossRef] [PubMed] [Green Version]
  77. Andersen, L.O.; Bonde, I.; Nielsen, H.B.; Stensvold, C.R. A Retrospective Metagenomics Approach to Studying Blastocystis. FEMS Microbiol. Ecol. 2015, 91. [Google Scholar] [CrossRef] [Green Version]
  78. Beghini, F.; Pasolli, E.; Truong, T.D.; Putignani, L.; Cacciò, S.M.; Segata, N. Large-Scale Comparative Metagenomics of Blastocystis, a Common Member of the Human Gut Microbiome. ISME J. 2017, 11, 2848–2863. [Google Scholar] [CrossRef]
  79. Nash, A.K.; Auchtung, T.A.; Wong, M.C.; Smith, D.P.; Gesell, J.R.; Ross, M.C.; Stewart, C.J.; Metcalf, G.A.; Muzny, D.M.; Gibbs, R.A.; et al. The Gut Mycobiome of the Human Microbiome Project Healthy Cohort. Microbiome 2017, 5, 153. [Google Scholar] [CrossRef]
  80. Clark, C.G. Extensive Genetic Diversity in Blastocystis hominis. Mol. Biochem. Parasitol. 1997, 87, 79–83. [Google Scholar] [CrossRef]
  81. Scicluna, S.M.; Tawari, B.; Clark, C.G. DNA Barcoding of Blastocystis. Protist 2006, 157, 77–85. [Google Scholar] [CrossRef]
  82. Ziegler, P.E.; Santucci, F.; Lindergard, G.; Nydam, D.V.; Wade, S.E.; Schaaf, S.L.; Chang, Y.-F.; Mohammed, H.O. Evaluation of Polymerase Chain Reaction Diagnosis of Cryptosporidium Spp in Dairy Cattle and Wildlife. Vet. Ther. Res. Appl. Vet. Med. 2007, 8, 148–159. [Google Scholar]
  83. Rayani, M.; Zasmy Unyah, N.; Hatam, G. Molecular Identification of Giardia duodenalis Isolates from Fars Province, Iran. Iran. J. Parasitol. 2014, 9, 70–78. [Google Scholar] [PubMed]
Figure 1. Relative abundance of OTUs across the sample population. (a) Relative taxa abundance of the sampled water voles at the phylum level. Across the majority of voles, Bacteroidetes (orange) dominate. These are followed by the Firmicutes (yellow), which collectively account for over 90% of the out abundance at the phylum level. R13.1 shows a significant increase in Proteobacteria (light blue). “p-” signifies all mergoutOTU phylum data that have a relative abundance that is below 1% across samples. (b) Relative taxa abundance of the sampled water voles at the genus level. Across the majority of voles, the relative abundance of OTUs at the genus level is consistent. One notable observed difference is the relative increase in Christensenella (dark grey) in Q88.1. “g-” signifies all merged OTU genus data that have a relative abundance that is below 1% across samples.
Biology 10 00457 g001
Figure 2. Relative abundance of OTUs separating Blastocystis and negative samples. (a) Relative taxa abundance of Blastocystis positive voles B+ and Blastocystis negative voles B− at the phylum level. Between the two groups, the relative abundance of OTUs at the phylum level are consistent. (b) Relative taxa abundance of Blastocystis positive voles B+ and Blastocystis negative voles B− at Table 1 across all samples, where g_ signifies all merged OTU genus data that have a relative abundance that is below 1% across all samples.
Biology 10 00457 g002
Figure 3. Boxplots showing alpha diversity (Observed, Chao1, and Shannon indices). Blue plots represent the negative (B−) samples and plots in red represent positive (B+) voles. (a) Alpha diversity boxplots at the phylum level; (b) results at the genus level.
Biology 10 00457 g003
Figure 4. Boxplots showing the log transformed counts of distinguished OTUs identified by MetagenomeSeq analysis (p < 0.05). This includes multiple taxa belonging to the same lineage: (a) OTUs belonging to the Spirochaetes lineage; (b) OTUs belonging to the Betaproteobacteria lineage; (c) OTUs belonging to the Oscillospiraceae lineage. Plots in blue represent the data from B− voles, red plots are from B+ voles.
Biology 10 00457 g004
Table 1. Protozoa screening results from the study cohort. Screened parasites included Blastocystis, which was the main focus of this study, in addition to Cryptosporidium sp. and Giardia intestinalis. G. intestinalis was being monitored in the vole population prior to this study, and several of the voles were undergoing treatment for Giardia infection.
Sample No.Vole IDCol. DateMicrobiome Profile IDDrug Treatment Prior to SamplingVet Diagnosis for GiardiaScreening ResultSample No.Vole IDCol. DateMicrobiome Profile IDDrug Treatment Prior to SamplingVet Diagnosis for GiardiaScreening Result
GiardiaCryptosporidiumBlastocystisGiardiaCryptosporidiumBlastocystis
1C318.01.19C3.1Fenbendazole+ 41C320.02.19C3.2None++ 4
1C418.01.19C4.1Fenbendazole+ +41C420.02.19C4.2None+ 4
1Q8418.01.19Q84.1Metronidazole+ 1Q8420.02.19Q84.2Fenbendazole+ 1
1R2218.01.19R22.1Fenbendazole+ +41R2220.02.19R22.2None+
1R3418.01.19R34.1Metronidazole+ +
1Q9918.01.19Q99.1Metronidazole+ 1Q9920.02.19Q99.2Fenbendazole+ 4, B.lapemi
1Q4918.01.19Q49.1None+++
1Q5118.01.19Q51.1None+ 1Q5120.02.19Q51.2None+
1R1318.01.19R13.1None+ + 1R1320.02.19R13.2None+
1Q5218.01.19Q52.1None-+ 1Q5220.02.19Q52.2None-+ B. lapemi
1Q75A18.01.19Q75A.1None- 1Q75A20.02.19Q75A.2None-
1Q85A18.01.19Q85A.1None- 1Q85A20.02.19Q85A.2None-+
1Q8818.01.19Q88.1None- 1Q8820.02.19Q88.2None-
1R1218.01.19R12.1None- 1R1220.02.19R12.2None- 1, 4
1R9518.01.19R95.1None-
1R420.02.19R4.2None-
Publisher’s Note: MDPI stays neutral with regard to jurisdictional claims in published maps and institutional affiliations.

