
Integration of Multiple Resolution Data in 3D Chromatin Reconstruction Using ChromStruct


Abstract
1. Introduction
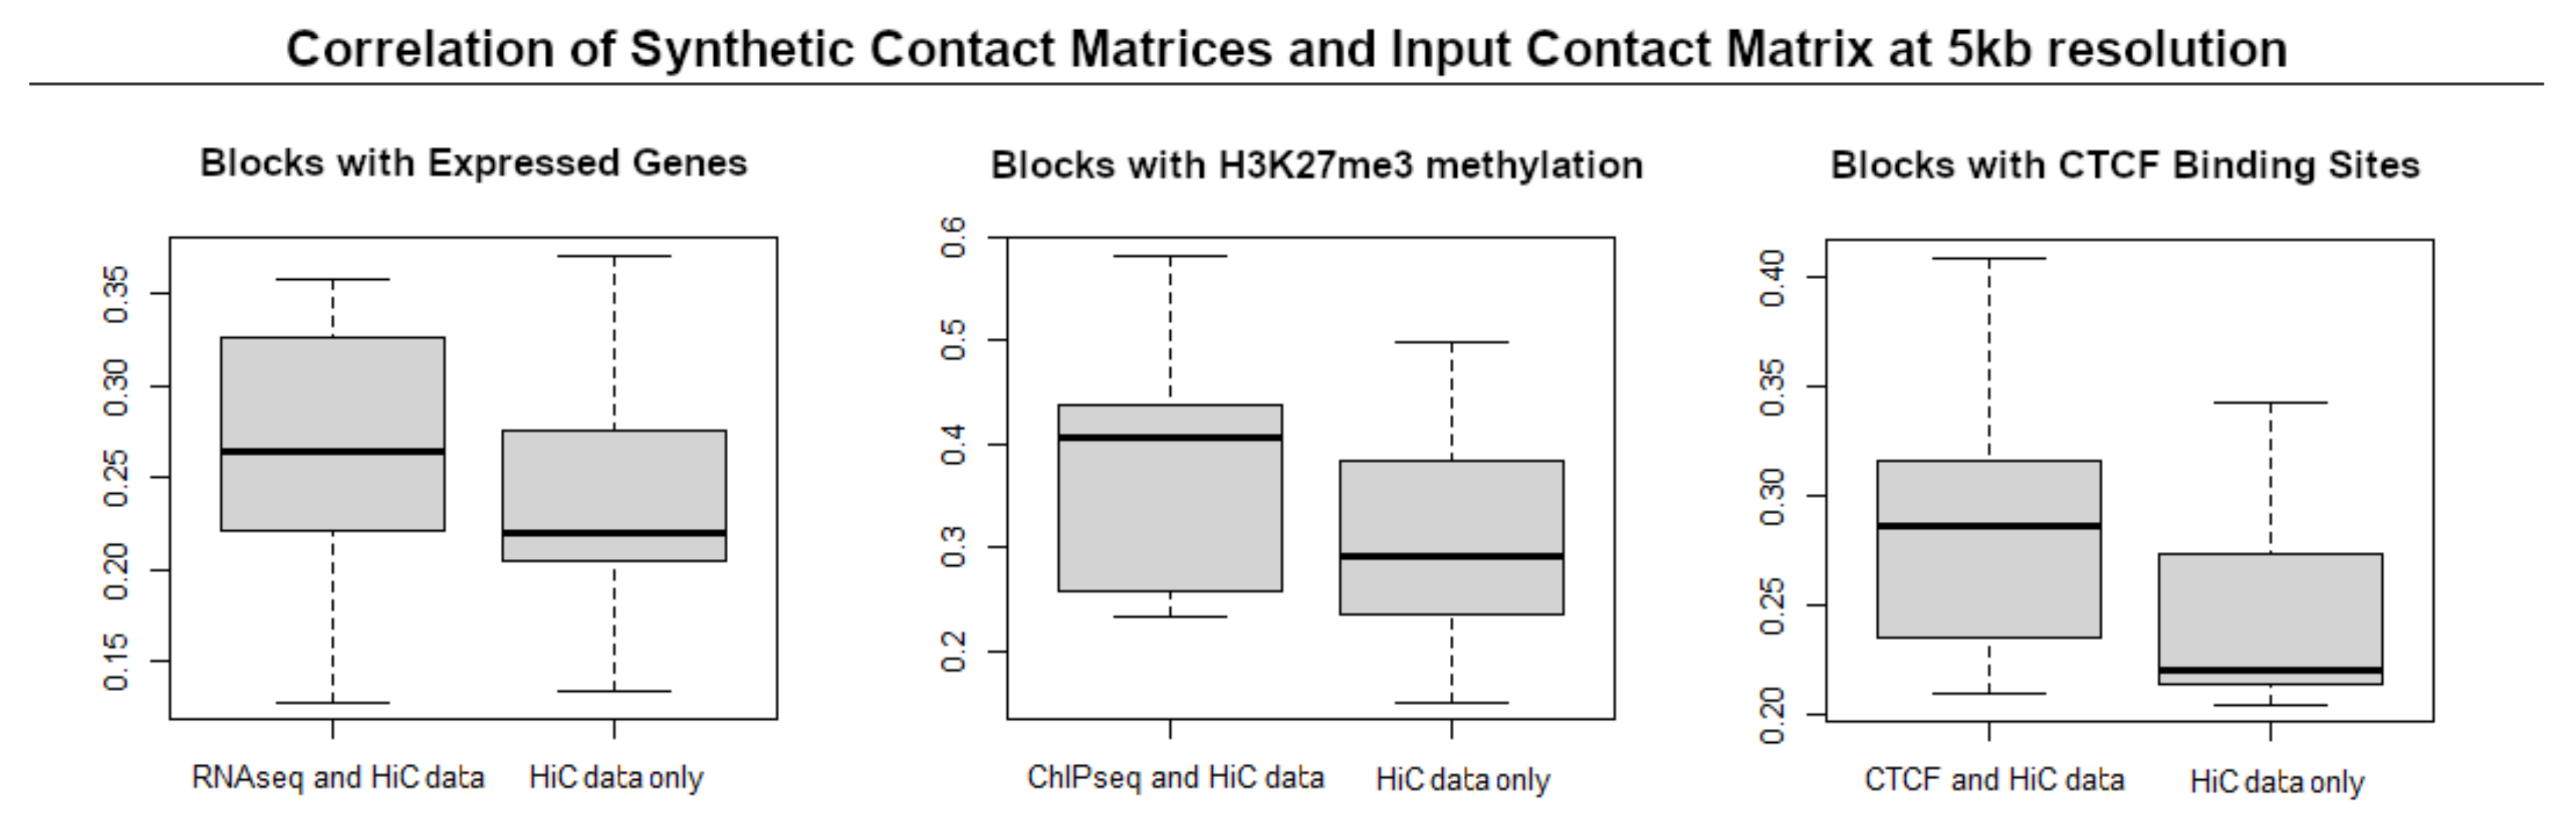
2. Results
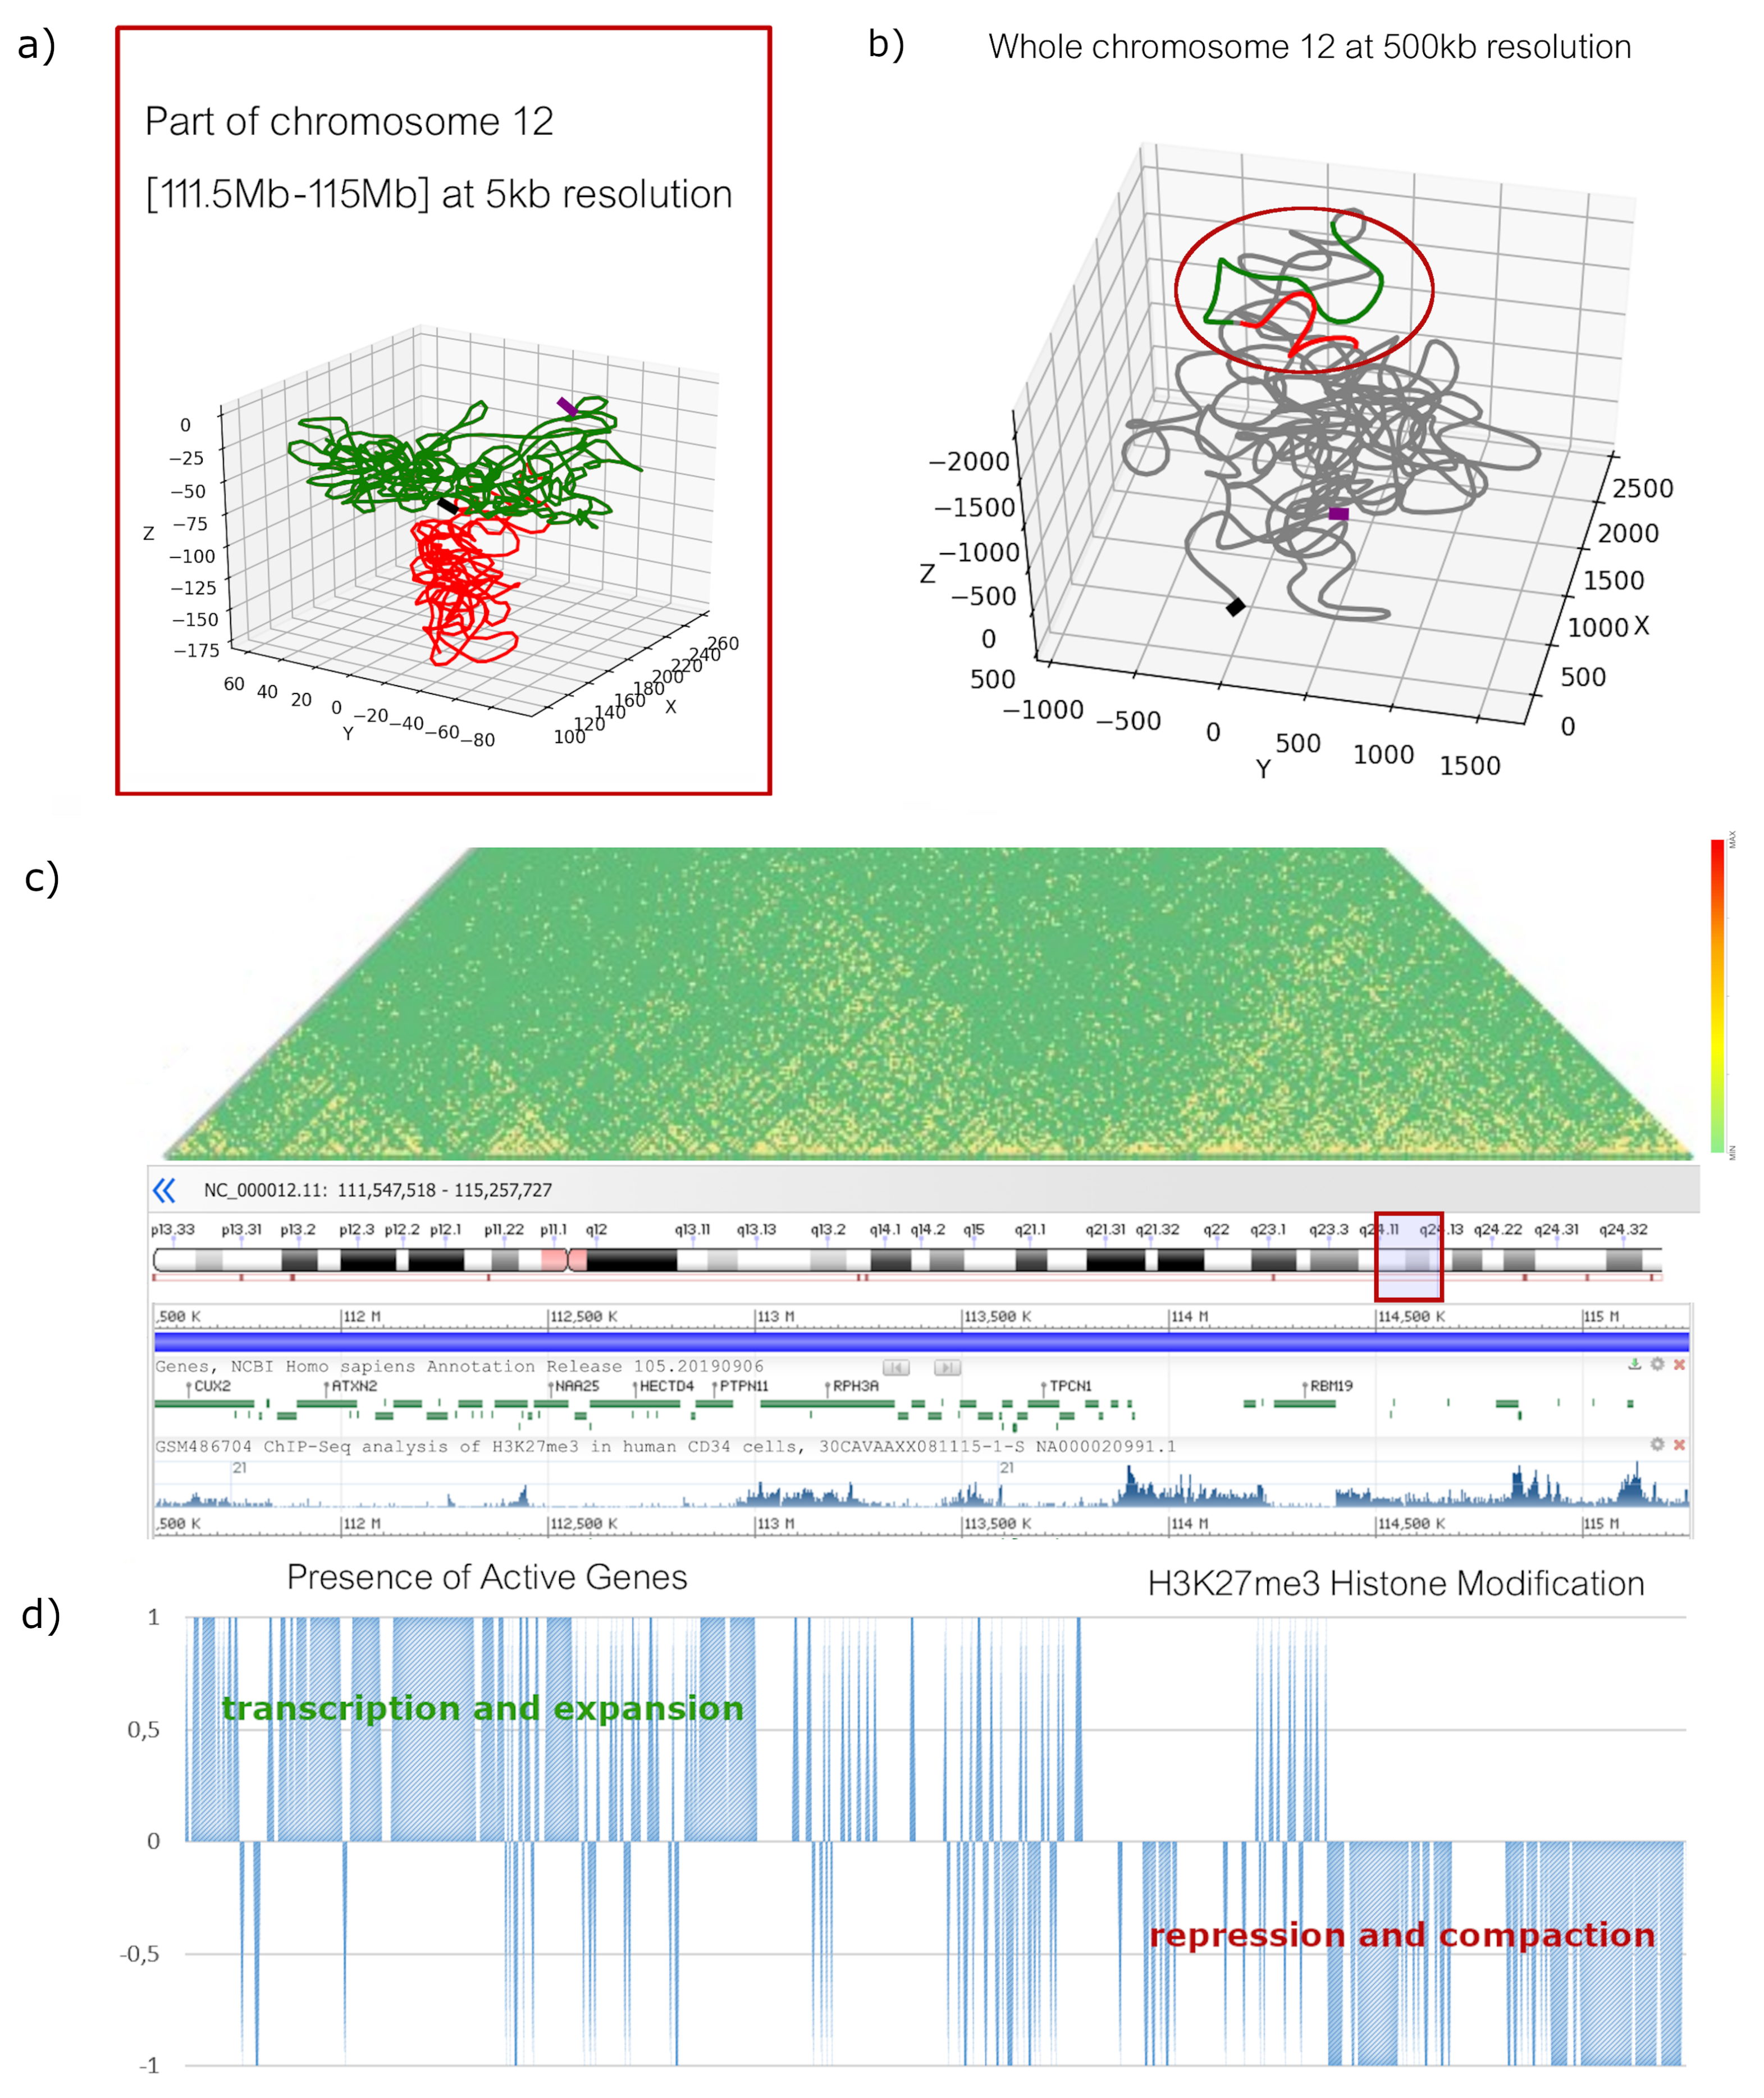
2.1. High-Resolution Configurations
2.2. Low-Resolution Configurations
3. Discussion
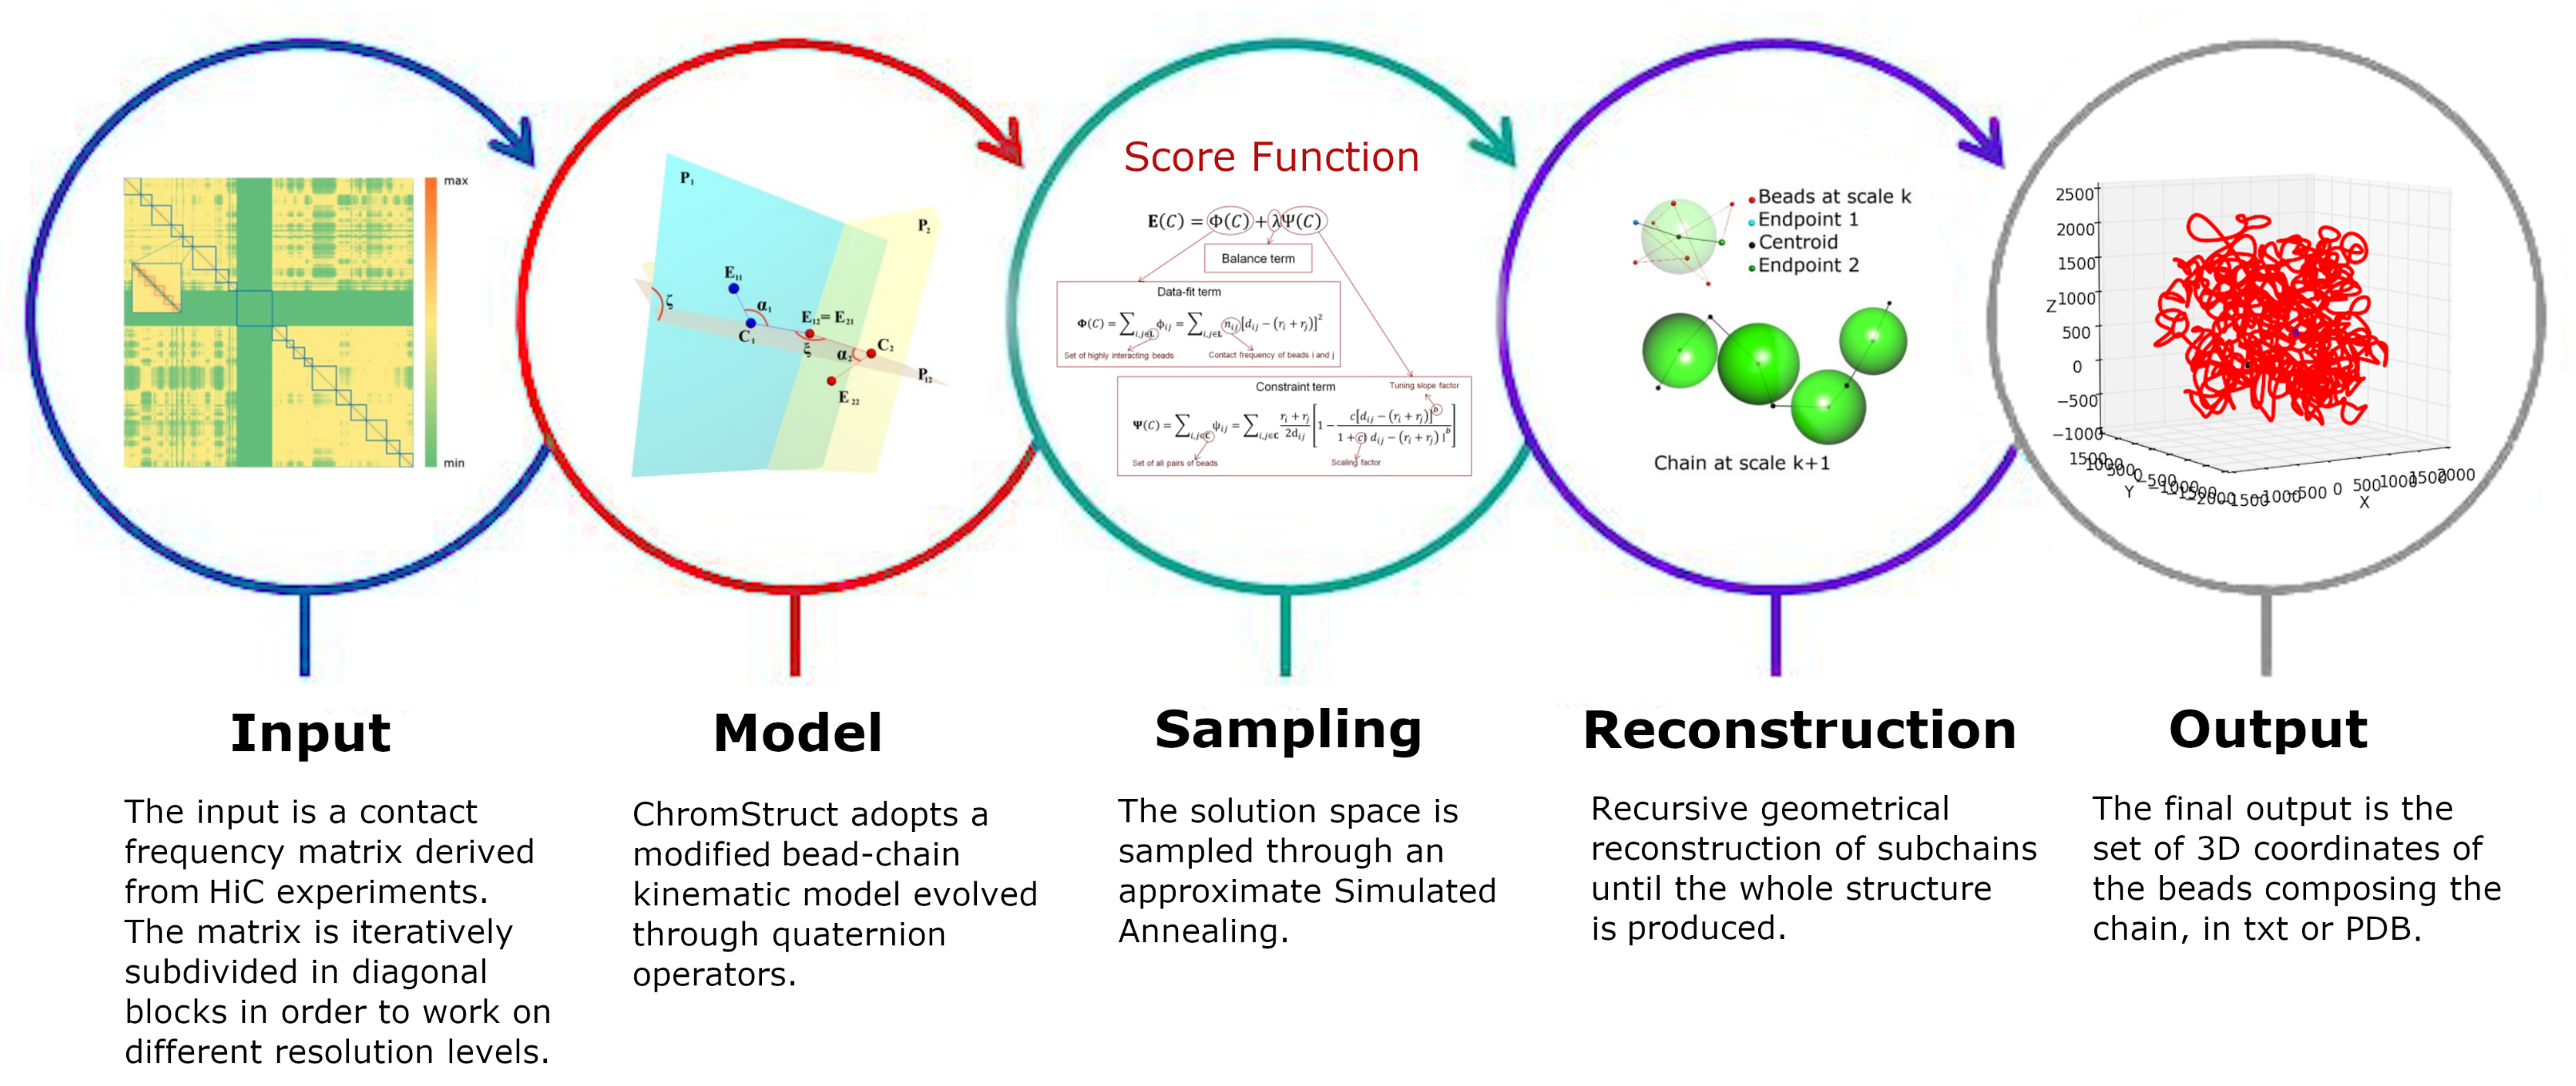
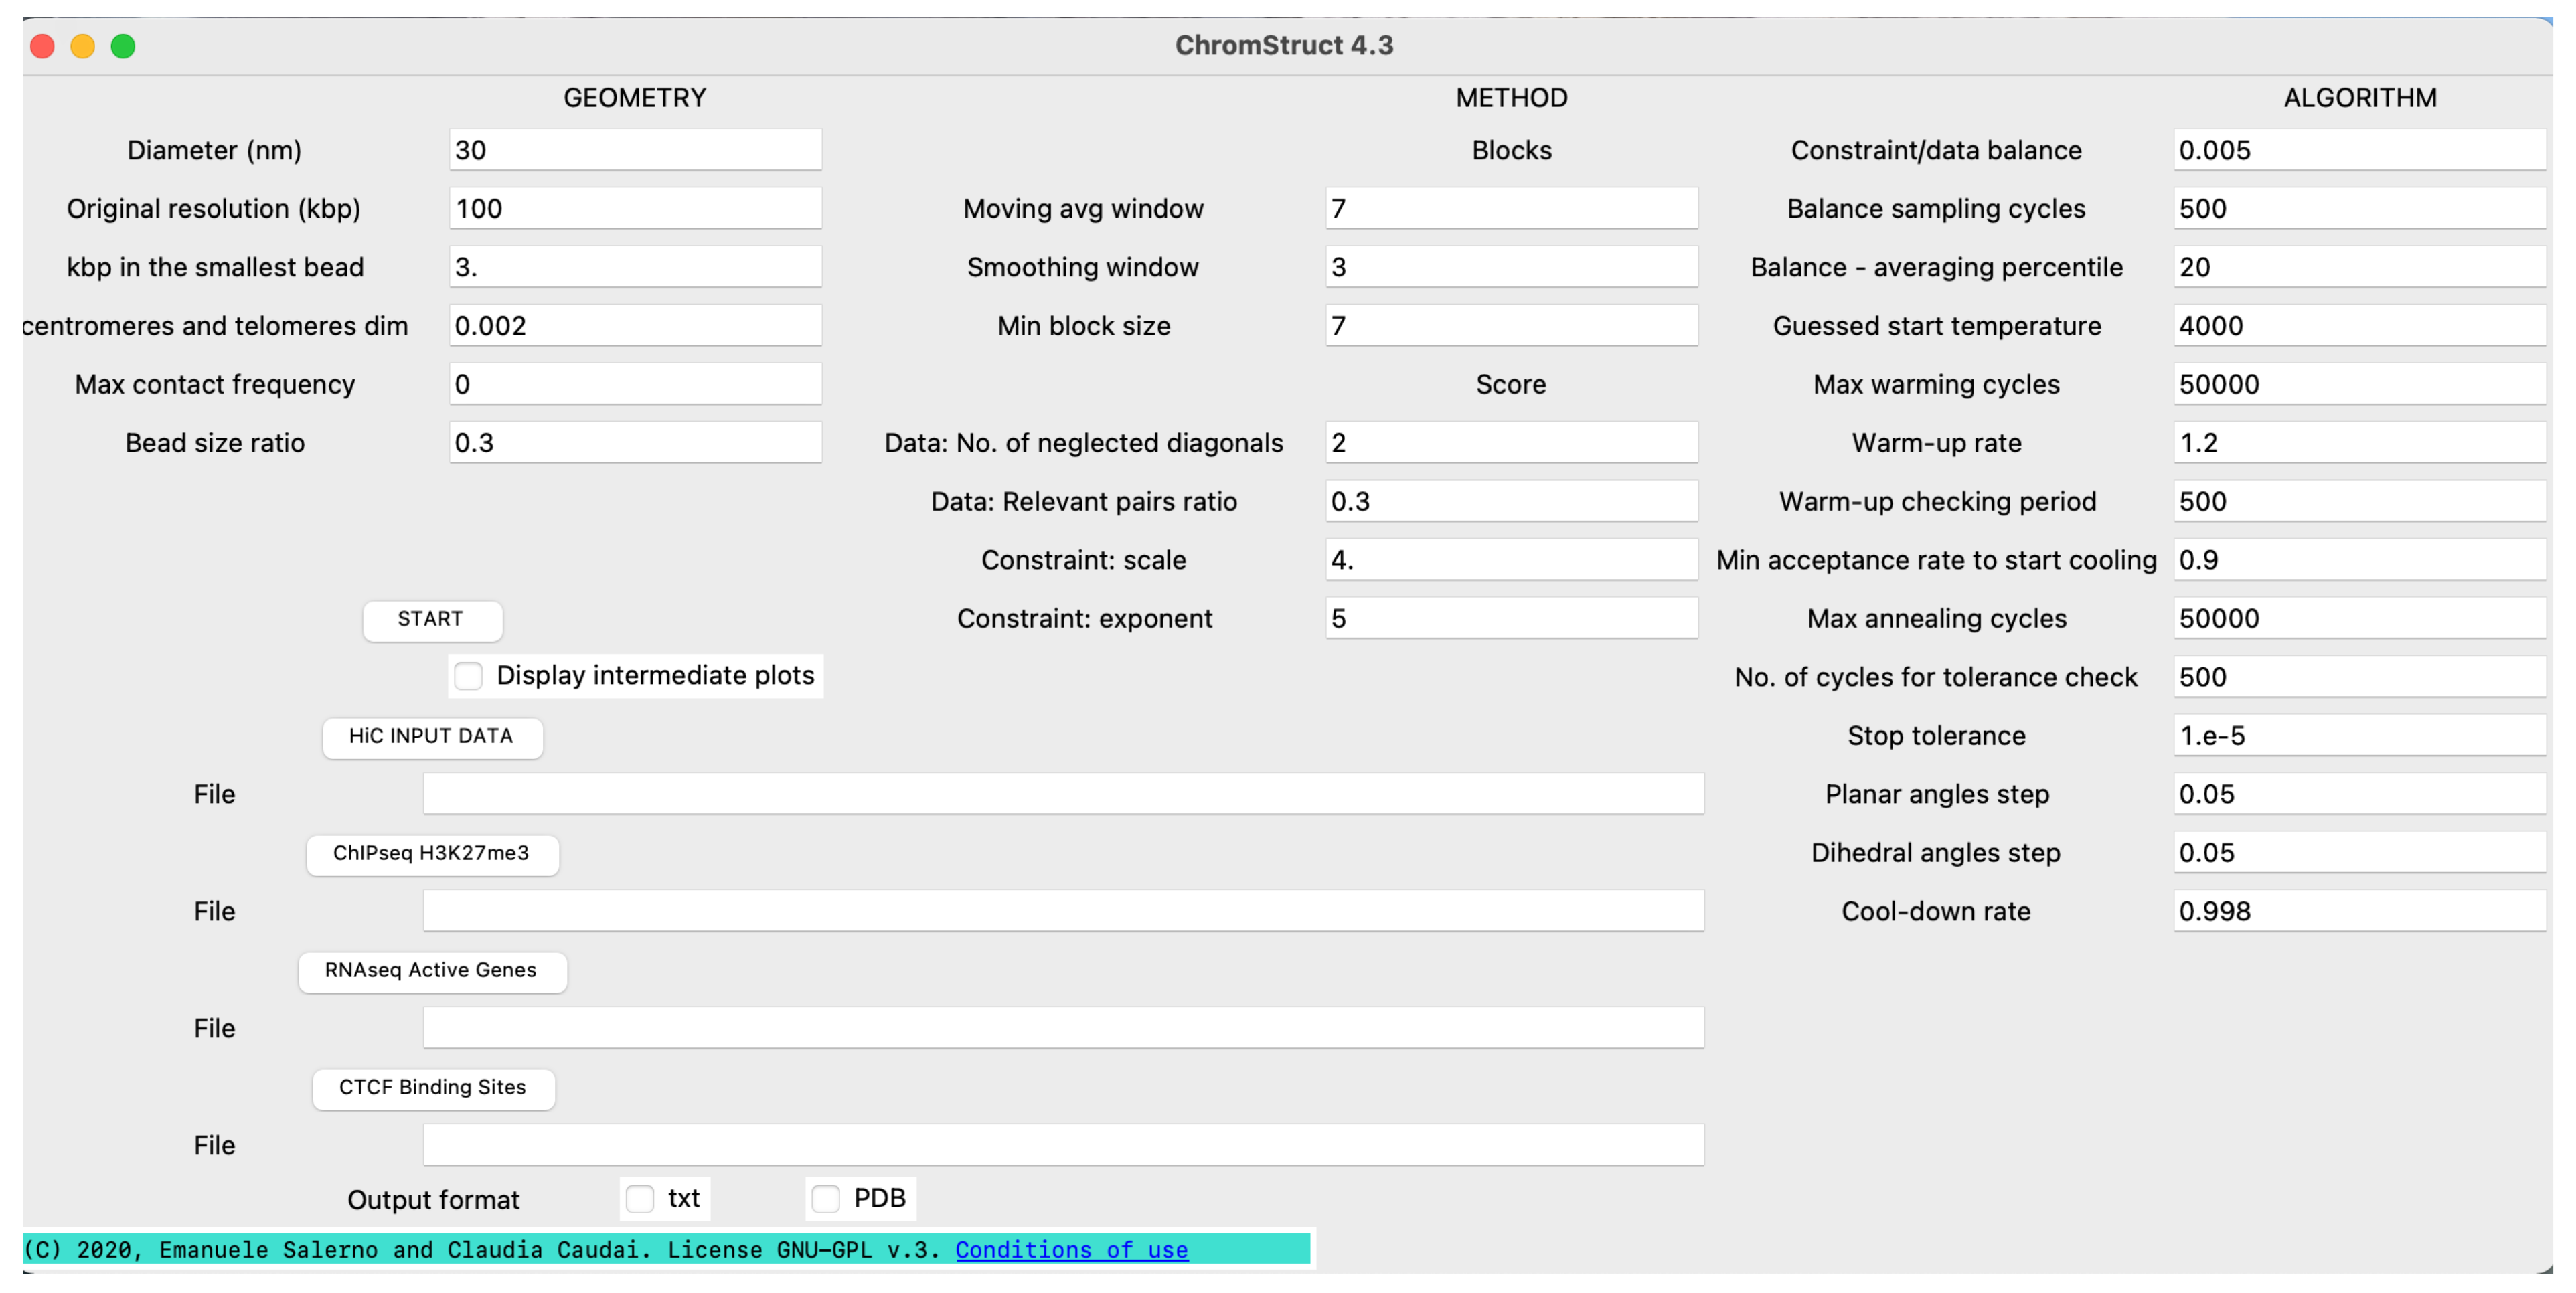
4. Materials and Methods
4.1. Data Origin and Treatment
4.2. Volume Considerations
4.3. Solution Space Sampling
5. Conclusions
Supplementary Materials
Author Contributions
Funding
Institutional Review Board Statement
Informed Consent Statement
Data Availability Statement
Acknowledgments
Conflicts of Interest
Code Availability
References
- Schuster, S. Next-generation sequencing transforms today’s biology. Nat. Methods 2008, 5, 16–18. [Google Scholar] [CrossRef]
- Van Berkum, N.L.; Lieberman-Aiden, E.; Williams, L.; Imakaev, M.; Gnirke, A.; Mirny, L.A.; Dekker, J.; Lander, E.S. Hi-C: A Method to Study the Three-dimensional Architecture of Genomes. J. Vis. Exp. 2010, 39, e1869. [Google Scholar] [CrossRef]
- Dixon, J.R.; Selvaraj, S.; Yue, F.; Kim, A.; Li, Y.; Shen, Y.; Hu, M.; Liu, J.S.; Ren, B. Topological domains in mammalian genomes identified by analysis of chromatin interactions. Nature 2012, 485, 376–380. [Google Scholar] [CrossRef] [PubMed]
- Wang, S.; Su, J.H.; Beliveau, B.J.; Bintu, B.; Moffitt, J.R.; Wu, C.T.; Zhuang, X. Spatial organization of chromatin domains and compartments in single chromosomes. Science 2016, 353, 598–602. [Google Scholar] [CrossRef] [PubMed]
- Bártová, E.; Krejcí, J.; Harnicarová, A.; Galiová, G.; Kozubek, S. Histone Modifications and Nuclear Architecture: A Review. J. Histochem. Cytochem. 2008, 56, 711–721. [Google Scholar] [CrossRef] [PubMed]
- Marti-Renom, M.A.; Mirny, L.A. Bridging the Resolution Gap in Structural Modeling of 3D Genome Organization. PLoS Comput. Biol. 2011, 7, e1002125. [Google Scholar] [CrossRef]
- Romano, O.; Peano, C.; Tagliazucchi, G.M.; Petiti, L.; Poletti, V.; Cocchiarella, F.; Rizzi, E.; Severgnini, M.; Cavazza, A.; Rossi, C.; et al. Transcriptional, epigenetic and retroviral signatures identify regulatory regions involved in hematopoietic lineage commitment. Sci. Rep. 2016, 6, 24724. [Google Scholar] [CrossRef] [PubMed]
- Mifsud, B.; Tavares-Cadete, F.; Young, A.C.; Sugar, R.; Schoenfelder, S.; Ferreira, L.; Wingett, S.; Andrews, S.; Grey, W.; Ewels, P.; et al. Mapping long-range promoter contacts in human cells with high-resolution capture Hi-C. Nat. Genet. 2015, 47, 598–606. [Google Scholar] [CrossRef]
- Javierre, B.M.; Burren, O.S.; Wilder, S.P.; Kreuzhuber, R.; Hill, S.M.; Sewitz, S.; Cairns, J.; Wingett, S.W.; Várnai, C.; Thiecke, M.J.; et al. Lineage-Specific Genome Architecture Links Enhancers and Non-coding Disease Variants to Target Gene Promoters. Cell 2016, 167, 1369–1384. [Google Scholar] [CrossRef]
- Sefer, E.; Kingsford, C. Semi-nonparametric modeling of topological domain formation from epigenetic data. Algorithms Mol. Biol. 2019, 14, 4. [Google Scholar] [CrossRef]
- Lieberman-Aiden, E.; van Berkum, N.L.; Williams, L.; Imakaev, M.; Ragoczy, T.; Telling, A.; Amit, I.; Lajoie, B.R.; Sabo, P.J.; Dorschner, M.O.; et al. Comprehensive Mapping of Long-Range Interactions Reveals Folding Principles of the Human Genome. Science 2009, 326, 289–293. [Google Scholar] [CrossRef]
- Kuksa, P.P.; Amlie-Wolf, A.; Hwang, Y.C.; Valladares, O.; Gregory, B.D.; Wang, L.S. HIPPIE2: A method for fine-scale identification of physically interacting chromatin regions. NAR Genom. Bioinform. 2020, 2, lqaa022. [Google Scholar] [CrossRef] [PubMed]
- Barski, A.; Cuddapah, S.; Cui, K.; Roh, T.; Schones, D.E.; Wang, Z.; Wei, G.; Chepelev, I.; Zhao, K. High-Resolution Profiling of Histone Methylations in the Human Genome. Cell 2007, 129, 823–837. [Google Scholar] [CrossRef] [PubMed]
- Varoquaux, N.; Ay, F.; Noble, W.S.; Vert, J.P. A statistical approach for inferring the 3D structure of the genome. Bioinformatics 2014, 30, i26–i33. [Google Scholar] [CrossRef] [PubMed]
- Nowotny, J.; Ahmed, S.; Xu, L.; Oluwadare, O.; Chen, H.; Hensley, N.; Trieu, T.; Cao, R.; Cheng, J. Iterative reconstruction of three-dimensional models of human chromosomes from chromosomal contact data. BMC Bioinform. 2015, 16, 338. [Google Scholar] [CrossRef] [PubMed]
- Hu, M.; Deng, K.; Qin, Z.; Dixon, J.; Selvaraj, S.; Fang, J.; Ren, B.; Liu, J.S. Bayesian Inference of Spatial Organizations of Chromosomes. PLoS Comput. Biol. 2013, 9, e1002893. [Google Scholar] [CrossRef]
- Rousseau, M.; Fraser, J.; Ferraiuolo, M.A.; Dostie, J.; Blanchette, M. Three-dimensional modeling of chromatin structure from interaction frequency data using Markov chain Monte Carlo sampling. BMC Bioinform. 2011, 12, 414. [Google Scholar] [CrossRef]
- Caudai, C.; Salerno, E.; Zoppè, M.; Tonazzini, A. A statistical approach to infer 3D chomatin structure. In Mathematical Models in Biology; Zazzu, V., Ed.; Springer International Publishing: Cham, Switzerland, 2015; pp. 161–171. [Google Scholar]
- Duggal, G.; Patro, R.; Sefer, E.; Wang, H.; Filippova, D.; Khuller, S.; Kingsford, C. Resolving spatial inconsistencies in chromosome conformation measurements. Algorithms Mol. Biol. 2013, 8, 8. [Google Scholar] [CrossRef] [PubMed]
- Caudai, C.; Salerno, E.; Zoppè, M.; Tonazzini, A. Estimation of the Spatial Chromatin Structure Based on a Multiresolution Bead-Chain Model. IEEE ACM Trans. Comput. Biol. Bioinform. 2019, 16, 550–559. [Google Scholar] [CrossRef]
- Caudai, C.; Salerno, E.; Zoppè, M.; Merelli, I.; Tonazzini, A. ChromStruct 4: A Python Code to Estimate the Chromatin Structure from Hi-C Data. IEEE ACM Trans. Comput. Biol. Bioinform. 2018, 16, 1867–1878. [Google Scholar] [CrossRef]
- Li, G.; Fullwood, M.; Xu, H.; Mulawadi, F.; Velkov, S.; Vega, V.; Ariyaratne, P.; Mohamed, Y.B.; Ooi, H.S.; Tennakoon, C.; et al. ChIA-PET tool for comprehensive chromatin interaction analysis with paired-end tag sequencing. Genome Biol. 2009, 11, R22. [Google Scholar] [CrossRef]
- Lajoie, B.; Dekker, J.; Kaplan, N. The Hitchhiker’s guide to Hi-C analysis: Practical guidelines. Methods 2015, 72, 65–75. [Google Scholar] [CrossRef]
- Caudai, C.; Salerno, E.; Zoppè, M.; Tonazzini, A. Inferring 3D chromatin structure using a multiscale approach based on quaternions. BMC Bioinform. 2015, 16, 234. [Google Scholar] [CrossRef] [PubMed]
- Serra, F.; Baù, D.; Goodstadt, M.; Castillo, D.; Filion, G.; Martí-Renom, M.A. Automatic analysis and 3D-modelling of Hi-C data using TADbit reveals structural features of the fly chromatin colors. PLoS Comput. Biol. 2017, 13, e1005665. [Google Scholar] [CrossRef] [PubMed]
- Xie, W.J.; Meng, L.; Liu, S.; Zhang, L.; Cai, X.; Gao, Y. Structural Modeling of Chromatin Integrates Genome Features and Reveals Chromosome Folding Principle. Sci. Rep. 2017, 7, 1–11. [Google Scholar] [CrossRef] [PubMed]
- Giorgetti, L.; Galupa, R.; Nora, E.; Piolot, T.; Lam, F.; Dekker, J.; Tiana, G.; Heard, E. Predictive Polymer Modeling Reveals Coupled Fluctuations in Chromosome Conformation and Transcription. Cell 2014, 157, 950–963. [Google Scholar] [CrossRef]
- Imakaev, M.; Fudenberg, G.; McCord, R.; Naumova, N.; Goloborodko, A.; Lajoie, B.; Dekker, J.; Mirny, L. Iterative Correction of Hi-C Data Reveals Hallmarks of Chromosome Organization. Nat. Methods 2012, 9, 999–1003. [Google Scholar] [CrossRef]
- Abbas, A.; He, X.; Niu, J.; Zhou, B.; Zhu, G.; Ma, T.; Song, J.; Gao, J.; Zhang, M.Q.; Zeng, J. Integrating Hi-C and FISH data for modeling of the 3D organization of chromosomes. Nat. Commun. 2019, 10, 2049. [Google Scholar] [CrossRef]
- Paulsen, J.; Sekelja, M.; Oldenburg, A.R.; Barateau, A.; Briand, N.; Delbarre, E.; Shah, A.; Sørensen, A.L.; Vigouroux, C.; Buendia, B.; et al. Chrom3D: Three-dimensional genome modeling from Hi-C and nuclear lamin-genome contacts. Genome Biol. 2017, 18, 21. [Google Scholar] [CrossRef]
- Qi, Y.; Zhang, B. Predicting three-dimensional genome organization with chromatin states. PLoS Comput. Biol. 2019, 15, e1007024. [Google Scholar] [CrossRef]
- Trieu, T.; Oluwadare, O.; Cheng, J. Hierarchical Reconstruction of High-Resolution 3D Models of Large Chromosomes. Sci. Rep. 2019, 9, 1–12. [Google Scholar] [CrossRef] [PubMed]
- ENCODE Consortium. An Integrated Encyclopedia of DNA Elements in the Human Genome. Nature 2012, 489, 57–74. [Google Scholar] [CrossRef]
- Lun, A.T.L.; Smyth, G. diffHic: A Bioconductor package to detect differential genomic interactions in Hi-C data. BMC Bioinform. 2015, 16, 1–11. [Google Scholar] [CrossRef]
- Simes, R. An improved Bonferroni procedure for multiple tests of significance. Biometrika 1986, 73, 751–754. [Google Scholar] [CrossRef]
- Tie, F.; Banerjee, R.; Stratton, C.A.; Prasad-Sinha, J.; Stepanik, V.; Zlobin, A.; Diaz, M.O.; Scacheri, P.C.; Harte, P.J. CBP-mediated acetylation of histone H3 lysine 27 antagonizes Drosophila Polycomb silencing. Development 2009, 136, 3131–3141. [Google Scholar] [CrossRef] [PubMed]
- Ou, H.D.; Phan, S.; Deerinck, T.J.; Thor, A.; Ellisman, M.H.; O’Shea, C.C. ChromEMT: Visualizing 3D chromatin structure and compaction in interphase and mitotic cells. Science 2017, 357, eaag0025. [Google Scholar] [CrossRef] [PubMed]


| Block | Dimension (kb) | Tot Contacts | Data | Corr 1 | Corr 2 |
|---|---|---|---|---|---|
| 1750 | 75 | 272 | Expr genes | 0.128 | 0.134 |
| 1751 | 50 | 102 | Expr genes | 0.489 | 0.428 |
| 1752 | 65 | 295 | Expr genes | 0.246 | 0.191 |
| 1753 | 55 | 142 | Expr genes | 0.264 | 0.217 |
| 1754 | 100 | 133 | Expr genes, CTCF | 0.219 | 0.219 |
| 1755 | 70 | 41 | Expr genes, CTCF | 0.251 | 0.242 |
| 1756 | 65 | 158 | Expr genes | 0.358 | 0.295 |
| 1757 | 85 | 128 | Expr genes, CTCF | 0.286 | 0.217 |
| 1758 | 100 | 211 | Expr genes | 0.222 | 0.204 |
| 1759 | 45 | 89 | Expr genes | 0.320 | 0.371 |
| 1760 | 70 | 247 | Expr genes | 0.325 | 0.341 |
| 1761 | 70 | 153 | 0.113 | 0.185 | |
| 1762 | 50 | 149 | 0.137 | 0.280 | |
| 1763 | 55 | 178 | 0.322 | 0.364 | |
| 1764 | 70 | 168 | 0.056 | 0.119 | |
| 1765 | 100 | 228 | 0.133 | 0.161 | |
| 1766 | 50 | 81 | Expr genes | 0.154 | 0.186 |
| 1767 | 45 | 163 | Expr genes | 0.346 | 0.255 |
| 1768 | 40 | 343 | 0.164 | 0.201 | |
| 1769 | 55 | 268 | 0.222 | 0.160 | |
| 1770 | 50 | 78 | Expr genes, CTCF | 0.326 | 0.204 |
| 1771 | 60 | 38 | Expr genes | 0.178 | 0.244 |
| 1772 | 110 | 389 | Expr genes | 0.303 | 0.235 |
| 1773 | 70 | 90 | 0.041 | 0.136 | |
| 1774 | 100 | 637 | 0.230 | 0.178 | |
| 1775 | 50 | 86 | 0.184 | 0.163 | |
| 1776 | 80 | 383 | H3K27M3 | 0.233 | 0.236 |
| 1777 | 45 | 77 | H3K27M3 | 0.582 | 0.499 |
| 1778 | 60 | 143 | 0.306 | 0.318 | |
| 1779 | 65 | 179 | CTCF | 0.408 | 0.342 |
| 1780 | 55 | 77 | 0.428 | 0.443 | |
| 1781 | 85 | 66 | CTCF | 0.305 | 0.304 |
| 1782 | 105 | 249 | 0.324 | 0.241 | |
| 1783 | 50 | 39 | 0.473 | 0.443 | |
| 1784 | 85 | 218 | 0.330 | 0.313 | |
| 1785 | 63 | 45 | CTCF | 0.209 | 0.210 |
| 1786 | 70 | 123 | 0.230 | 0.257 | |
| 1787 | 45 | 104 | H3K27M3 | 0.423 | 0.291 |
| 1788 | 70 | 283 | 0.145 | 0.131 | |
| 1789 | 70 | 142 | 0.081 | 0.123 | |
| 1790 | 45 | 80 | 0.202 | 0.224 | |
| 1791 | 35 | 30 | 0.220 | 0.258 | |
| 1792 | 65 | 185 | H3K27M3 | 0.425 | 0.392 |
| 1793 | 70 | 208 | H3K27M3 | 0.407 | 0.303 |
| 1794 | 50 | 53 | −0.05 | 0.014 | |
| 1795 | 40 | 168 | H3K27M3 | 0.449 | 0.373 |
| 1796 | 140 | 1659 | H3K27M3 | 0.250 | 0.286 |
| 1797 | 70 | 240 | H3K27M3 | 0.266 | 0.155 |
| 1798 | 60 | 289 | H3K27M3 | 0.233 | 0.150 |
| 1799 | 65 | 264 | 0.141 | 0.063 |
| HI-C Contacts | RNA-seq | CHIP-seq | CTCF-Binding | Nr of Runs | Correlation | |
|---|---|---|---|---|---|---|
| Experiment 1 | ✓ | 100 | 0.7188371 | |||
| Experiment 2 | ✓ | ✓ | ✓ | ✓ | 100 | 0.6963284 |
Publisher’s Note: MDPI stays neutral with regard to jurisdictional claims in published maps and institutional affiliations. |
© 2021 by the authors. Licensee MDPI, Basel, Switzerland. This article is an open access article distributed under the terms and conditions of the Creative Commons Attribution (CC BY) license (https://creativecommons.org/licenses/by/4.0/).
Share and Cite
Caudai, C.; Zoppè, M.; Tonazzini, A.; Merelli, I.; Salerno, E. Integration of Multiple Resolution Data in 3D Chromatin Reconstruction Using ChromStruct. Biology 2021, 10, 338. https://doi.org/10.3390/biology10040338
Caudai C, Zoppè M, Tonazzini A, Merelli I, Salerno E. Integration of Multiple Resolution Data in 3D Chromatin Reconstruction Using ChromStruct. Biology. 2021; 10(4):338. https://doi.org/10.3390/biology10040338
Chicago/Turabian StyleCaudai, Claudia, Monica Zoppè, Anna Tonazzini, Ivan Merelli, and Emanuele Salerno. 2021. "Integration of Multiple Resolution Data in 3D Chromatin Reconstruction Using ChromStruct" Biology 10, no. 4: 338. https://doi.org/10.3390/biology10040338
APA StyleCaudai, C., Zoppè, M., Tonazzini, A., Merelli, I., & Salerno, E. (2021). Integration of Multiple Resolution Data in 3D Chromatin Reconstruction Using ChromStruct. Biology, 10(4), 338. https://doi.org/10.3390/biology10040338