Article

Prognostic and Functional Significant of Heat Shock Proteins (HSPs) in Breast Cancer Unveiled by Multi-Omics Approaches

1
Department of Biological Chemical and Pharmaceutical Sciences and Technologies (STEBICEF), University of Palermo, 90128 Palermo, Italy
2
Experimental Center of Onco Biology (COBS), 90145 Palermo, Italy
*
Author to whom correspondence should be addressed.
These authors contributed equally to this work.
Biology 2021, 10(3), 247; https://doi.org/10.3390/biology10030247
Submission received: 24 February 2021 / Revised: 13 March 2021 / Accepted: 18 March 2021 / Published: 22 March 2021

Abstract

:

Simple Summary

In this study, we investigated the expression pattern and prognostic significance of the heat shock proteins (HSPs) family members in breast cancer (BC) by using several bioinformatics tools and proteomics investigations. Our results demonstrated that, collectively, HSPs were deregulated in BC, acting as both oncogene and onco-suppressor genes. In particular, two different HSP-clusters were significantly associated with a poor or good prognosis. Interestingly, the HSPs deregulation impacted gene expression and miRNAs regulation that, in turn, affected important biological pathways involved in cell cycle, DNA replication, and receptors-mediated signaling. Finally, the proteomic identification of several HSPs members and isoforms revealed much more complexity of HSPs roles in BC and showed that their expression is quite variable among patients. In conclusion, we elaborated two panels of HSPs that could be further explored as potential biomarkers for BC progression and prognosis.

Abstract

Heat shock proteins (HSPs) are a well-characterized molecular chaperones protein family, classified into six major families, according to their molecular size. A wide range of tumors have been shown to express atypical levels of one or more HSPs, suggesting that they could be used as biomarkers. However, the collective role and the possible coordination of HSP members, as well as the prognostic significance and the functional implications of their deregulated expression in breast cancer (BC) are poorly investigated. Here, we used a systematic multi-omics approach to assess the HSPs expression, the prognostic value, and the underlying mechanisms of tumorigenesis in BC. By using data mining, we showed that several HSPs were deregulated in BC and significantly correlated with a poor or good prognosis. Functional network analysis of HSPs co-expressed genes and miRNAs highlighted their regulatory effects on several biological pathways involved in cancer progression. In particular, these pathways concerned cell cycle and DNA replication for the HSPs co-expressed genes, and miRNAs up-regulated in poor prognosis and Epithelial to Mesenchymal Transition (ETM), as well as receptors-mediated signaling for the HSPs co-expressed genes up-regulated in good prognosis. Furthermore, the proteomic expression of HSPs in a large sample-set of breast cancer tissues revealed much more complexity in their roles in BC and showed that their expression is quite variable among patients and confined into different cellular compartments. In conclusion, integrative analysis of multi-omics data revealed the distinct impact of several HSPs members in BC progression and indicate that collectively they could be useful as biomarkers and therapeutic targets for BC management.

Graphical Abstract

1. Introduction

Breast cancer (BC) represents the most common type and the leading cause of death of cancer among females and accounts for ~16% of all cancers [1]. The etiology of BC is quite complex, involving several genetic and epigenetic changes [2]. Consequently, breast cancer is a heterogeneous disease with several subtypes of different cellular compositions, molecular alterations, as well as clinical behavior [3,4]. Several factors, such as histological grade, type and size of the tumor, lymph node metastasis, estrogen receptor (ER), progesterone receptor (PR), and human epidermal growth factor receptor 2 (HER), are generally considered as prognostic factors, but are insufficient to provide useful information for clinical management [5,6]. Despite the achieved improvements, the prognosis of BC patients is still a poor predictor and the identification of more reliable biomarkers must be explored.
Heat shock proteins (HSPs) are one of the largest groups of molecular chaperones that assist the correct folding of partially folded or denatured proteins and prevent the formation of potential aggregates in the cells, promoting their proteasomal degradation [7]. HSPs were first discovered as stress-inducible proteins against physical (temperature elevation) or chemical (increase or decrease in pH, salinity, or oxygen concentration) stressors, performing a wide range of functional activities: Modulation of their synthesis, regulation of kinases activation, participation in signal transduction pathways and rRNA processing [8]. Under physiological conditions, HSPs perform chaperone functions on a broad array of client proteins, including transcription factors, nuclear hormone receptors, viral proteins and signaling mediators. Depending on their molecular weight and main functions, six major subfamilies of HSPs have been reported: HSP110, HSP90, HSP70, HSP60 (chaperonins), HSP40 (DNAJ-class proteins), and HSP20 (small heat shock proteins) [9]. Within each subfamily, some members are constitutively expressed, inducible regulated, and/or targeted to different compartments [7,10,11]. Genes encoding HSPs are also transcriptionally regulated by a variety of physiologic processes not typically associated with cell stress, including cell cycle, cell proliferation, and differentiation [12].
Aberrant expression of HSPs has been reported in a wide range of human tumors, including breast, endometrial, ovarian, colon, lung, and prostate [13,14]. In cancer cells, the HSPs network is extensively remodeled and could participate in the functional metabolism of tumor cells, protect them from harmful factors, provide an immunogenic context and allow tumor cells to tolerate genetic alterations, which would otherwise be fatal [15,16,17]. The expression of HSPs has been associated with tumor cell proliferation and differentiation, as well as with resistance to apoptosis and poor prognosis [18]. These observations, while intriguing, have not resolved whether the association between cancer evolution and HSPs is causal or correlative.
Here, we aimed to more precisely estimate the relationship between HSP expression and prognosis in breast cancer, and highlight the functional implications of their deregulation by using a multi-omics integrative analysis.
An in silico analysis on differential expression of HSP family members in breast and other tumors was firstly performed, and the differentially expressed members (50 up-regulated and 26 down-regulated) were checked for genetic alterations and promoter methylation status. The prognostic value of HSP members and association with clinical variables were also assessed. Next, to highlight the important biological pathways deregulated as a consequence of HSPs expression, the lists of HSPs co-expressed genes and miRNAs extracted by different cross-platforms were used to perform functional analyses. Finally, proteomics investigations on a large sample set of breast cancer tissues showed additional complexity of the HSPs network in BC, with different protein isoforms identified for each HSP gene, probably performing additional functions and/or interactions. Our findings identified two distinct HSP-clusters with opposite functions in breast cancer: The first one with 19 members, was significantly associated with a poor prognosis and affected both cell cycle and DNA replication. The second HSP-cluster included 10 members associated with good prognosis, presumably affecting receptor signaling and Epithelial to Mesenchymal Transition (ETM). Interestingly, the HSPs-network involved also several miRNAs and protein isoforms that, in turn, could add new perspectives on HSPs contribution to BC. To the best of our knowledge, this is the first attempt exploring the potential mechanisms of the HSPs-mRNAs-miRNAs-proteins network, underlining that HSP-based regulation of BC progression is a multi-level process. We propose that the identified HSP-clusters can be used to stratify patients according to their predicted clinical outcome.

2. Materials and Methods

2.1. Expression Analysis of HSP Members Using UALCAN and Oncomine

The mRNA expression levels of each HSP member in tumors and their normal tissue counterparts were analyzed using UALCAN (https://ualcan.path.uab.edu/, accessed date 26 February 2021) and Oncomine database (https://www.oncomine.org/resource/login.html, accessed date 26 February 2021). UALCAN is a comprehensive, user-friendly, and interactive web resource for analyzing cancer OMICS data (TCGA, MET500, and CPTAC) [19]. For each query, the database provides graphs and plots depicting the expression profile of protein and miRNAs between normal and cancer tissues and evaluates epigenetic regulation of gene expression by promoter methylation. The expression level of HSP members was normalized as transcript per million reads, and a p-value of no more than 0.01 calculated through the Student’s t-test was considered to be significant. Oncomine, an online microarray database, can analyze the mRNA expression differences between tumor and normal tissues in 20 different human cancers. The thresholds were set as follows: p-value: 0.01; fold change: 2; gene rank: 10%; analysis type: cancer vs. normal analysis; data type: mRNA.

2.2. Genetic Alterations and Epigenetic Regulation of HSP Members Using cBioPortal and UALCAN

The frequency of HSPs alterations (amplification, deep deletion, and missense mutations) in BC patients was assessed using the OncoPrint tool of cBioPortal (http://www.cbioportal.org, accessed date 26 February 2021). cBioportal is an interactive open-source platform, that provides large-scale cancer genomics data sets database [20]. Promoter methylation status was analyzed using UALCAN.

2.3. Evaluation of the Prognostic Value of HSP Members Using KM Plotter Database and Human Protein Atlas

The correlation between the mRNA expression levels of HSP members and the survival probability of BC patients was analyzed using the Kaplan-Meier Plotter database (http://kmplot.com/analysis/, accessed date 26 February 2021) [21]. For each HSP gene, Distant Metastasis Free Survival (DMFS), Overall Survival (OS), and Relapse Free Survival were assessed. The Affimetrix ID probes were entered into the database by using the multigene classifier. Patients were divided into high and low expression groups by using the best cutoff of mRNA expression. The database provided statistical plots for individual genes. The correlation between HSPs protein expression levels via immunohistochemistry analysis and overall survival of BC patients was analyzed using the Human Protein Atlas (https://www.proteinatlas.org/, accessed date 26 February 2021) [22]. For each HSP protein, the immunohistochemical staining was evaluated and scored based on staining intensity (negative, weak, moderate, or strong) and the fraction of stained cells (<25%, 25~75%, >75%). The staining quantity of each protein via IHC was determined as the percentage of stained cells in 10 high-power fields. All annotation data and immunohistochemistry images analyzed in the present investigation and all anti-body validation data are publicly available at https://www.proteinatlas.org/, accessed date 26 February 2021.

2.4. Relationship between HSP Members and Clinical-Pathological Parameters Using Bc-GenExMiner and GOBO

The correlation between the mRNA expression of HSP members and different clinical-pathological parameters, such as ER/PR/HER receptor status and lymph node (N) involvement, were evaluated using the Breast cancer Gene-Expression Miner v4.5 database (bcGenExMiner v4.5) [23], an on-line statistical mining tool (http://bcgenex.ico.unicancer.fr, accessed date 26 February 2021) of published annotated BC transcriptomic data (DNA microarrays [n = 10,716] and RNA-seq [n = 4712]). bcGenExMiner offers the possibility to explore gene expression, prognostic and correlation analyses, providing various kinds of plots. The association between HSP members and grading (G1/G2/G3) was performed by Gene expression-based Outcome for Breast cancer Online (GOBO database) [24]. GOBO (http://co.bmc.lu.se/gobo, accessed date 26 February 2021) enables a rapid assessment of gene expression levels, the identification of co-expressed genes and association with the outcome for single genes, gene sets, or gene signatures in an 1881-sample breast cancer data set, generated on Affymetrix U133A microarrays.

2.5. Analysis of HSPs Co-Expressed Genes and Pathways Enrichment Analysis

The co-expression profiles of the HSPs associated with poor and good prognosis were retrieved using three different online platforms, namely UALCAN (https://ualc an.path.uab.edu/, accessed date 26 February 2021), GOBO (http://co.bmc.lu.se/gobo/coexpressed_genes.pl, accessed date 26 February 2021) and bcGenExMiner (http://bcgenex.centregauducheau.fr/BC-GEM/GEM-Requete.php?mode=5, accessed date 26 February 2021). Results were statistically analyzed using Pearson’s correlation coefficient (p ≥ 0.4 and p ≤ −0.4). Positive and negative HSPs co-expressed genes were properly sorted to obtain two lists of up-regulated genes in poor prognosis (positive co-expressed genes for HSPs correlated with poor prognosis and negative co-expressed genes for HSPs correlated with good prognosis) and up-regulated in good prognosis (positive co-expressed genes for HSPs correlated with good prognosis and negative co-expressed genes for HSPs correlated with poor prognosis). Each gene list was submitted into the FunRich database [25], (http://www.funrich.org/, accessed date 26 February 2021) a stand-alone software tool used mainly for functional enrichment and interaction network analysis of genes and miRNA. Enriched biological pathways were ranked by p-value and the top six significant pathways were exhibited as bar charts. A p-value < 0.05 was regarded as statistically significant.

2.6. Interactome Construction Using STRING Database

STRING (https://string-db.org, accessed date 26 February 2021) is a database of known and predicted protein-protein interactions. The interactions include direct (physical) and indirect (functional) associations derived from computational prediction, knowledge transfer between organism, and interactions aggregated from other (primary) databases analysis [26].

2.7. HSP-Mediated Regulatory Network of miRNAs-mRNAs

The list of HSPs co-expressed miRNAs was retrieved using bcGenExMiner. Pearson’s correlation coefficient was considered significant when p ≥ 0.4 and p ≤ −0.4. Positive and negative HSPs co-expressed miRNAs were properly sorted to obtain two lists of up-regulated miRNAs in a poor and in good prognosis. Within each list, only the miRNAs recurring at least three times were selected for miRNAs-mRNAs network construction using miRNet (www.mirnet.ca, accessed date 26 February 2021), an easy-to-use web-based tool designed for creation, customization, visual exploration, and functional interpretation of miRNA-target interaction networks [27]. miRNet was also used to predict miRNAs acting on HSP-cluster associated with poor and good prognosis.

2.8. Identification of HSP Proteins and Isoforms in Breast Cancer Tissues

Two-dimensional (2D)-IPG electrophoresis was performed on 63 protein extracts from breast cancer tissues obtained following surgical interventions during the years 2004–2010 at the “La Maddalena” Hospital of Palermo, as previously described [28,29,30,31,32,33]. Briefly, the surgical samples homogenated overnight at 4 °C with RIPA buffer, were centrifugated, and the supernatants were dialyzed against ultrapure distilled water, lyophilized and resuspended in ISOT buffer. Aliquots of 45 μg of total proteins were rehydrated in rehydration buffer containing 8 M urea, 2% CHAPS, 10 mM DTE, and 0.5% carrier ampholytes (Resolyte 3.5–10). The electrophoretic separation was performed on 18 cm long strips with a pH range of 3–10. The strips were then equilibrated in a solution containing 50 mM Tris-HCl pH 6.8, 6 M urea, 0.5% SDS, 30% Glycerol, 130 mM DTE and 135 mM Iodoacetamide and then separated on 9–16% linear gradient polyacrylamide gels (SDS-PAGE), with a constant current of 20 mA/gel, as previously described [34,35,36]. The gels were silver stained and analyzed with the dedicated Image-Master 2D Platinum software. Proteins of interest were excised from the gel and the identity was assigned by peptide mass fingerprinting using the Voyager DE MALDI-TOF mass spectrometer as described [37,38,39,40,41,42]. The expression level of protein spots was calculated as the volume of the spots (i.e., integration of optical density over the spot area), relative to the sum of the volume of all spots on each gel (% Vol). Measurements of relative expression levels of individual protein spots were normalized in each proteomic map for actin content (N % V), as previously reported [43].

3. Results

We systematically analyzed by data mining 95 heat shock genes (and the protein members that they encode), grouped into 6 sub-families (Table 1): (1) HSP 110 (HSPH) with 2 genes; (2) HSP90 (HSPC) with 4 genes; (3) HSP70 (HSPA) with 15 genes; (4) HSP60 (Chaperonins) with 14 genes; (5) HSP20 (HSPB), with 11 genes; (6) HSP40 (DNAJ) with 49 genes.

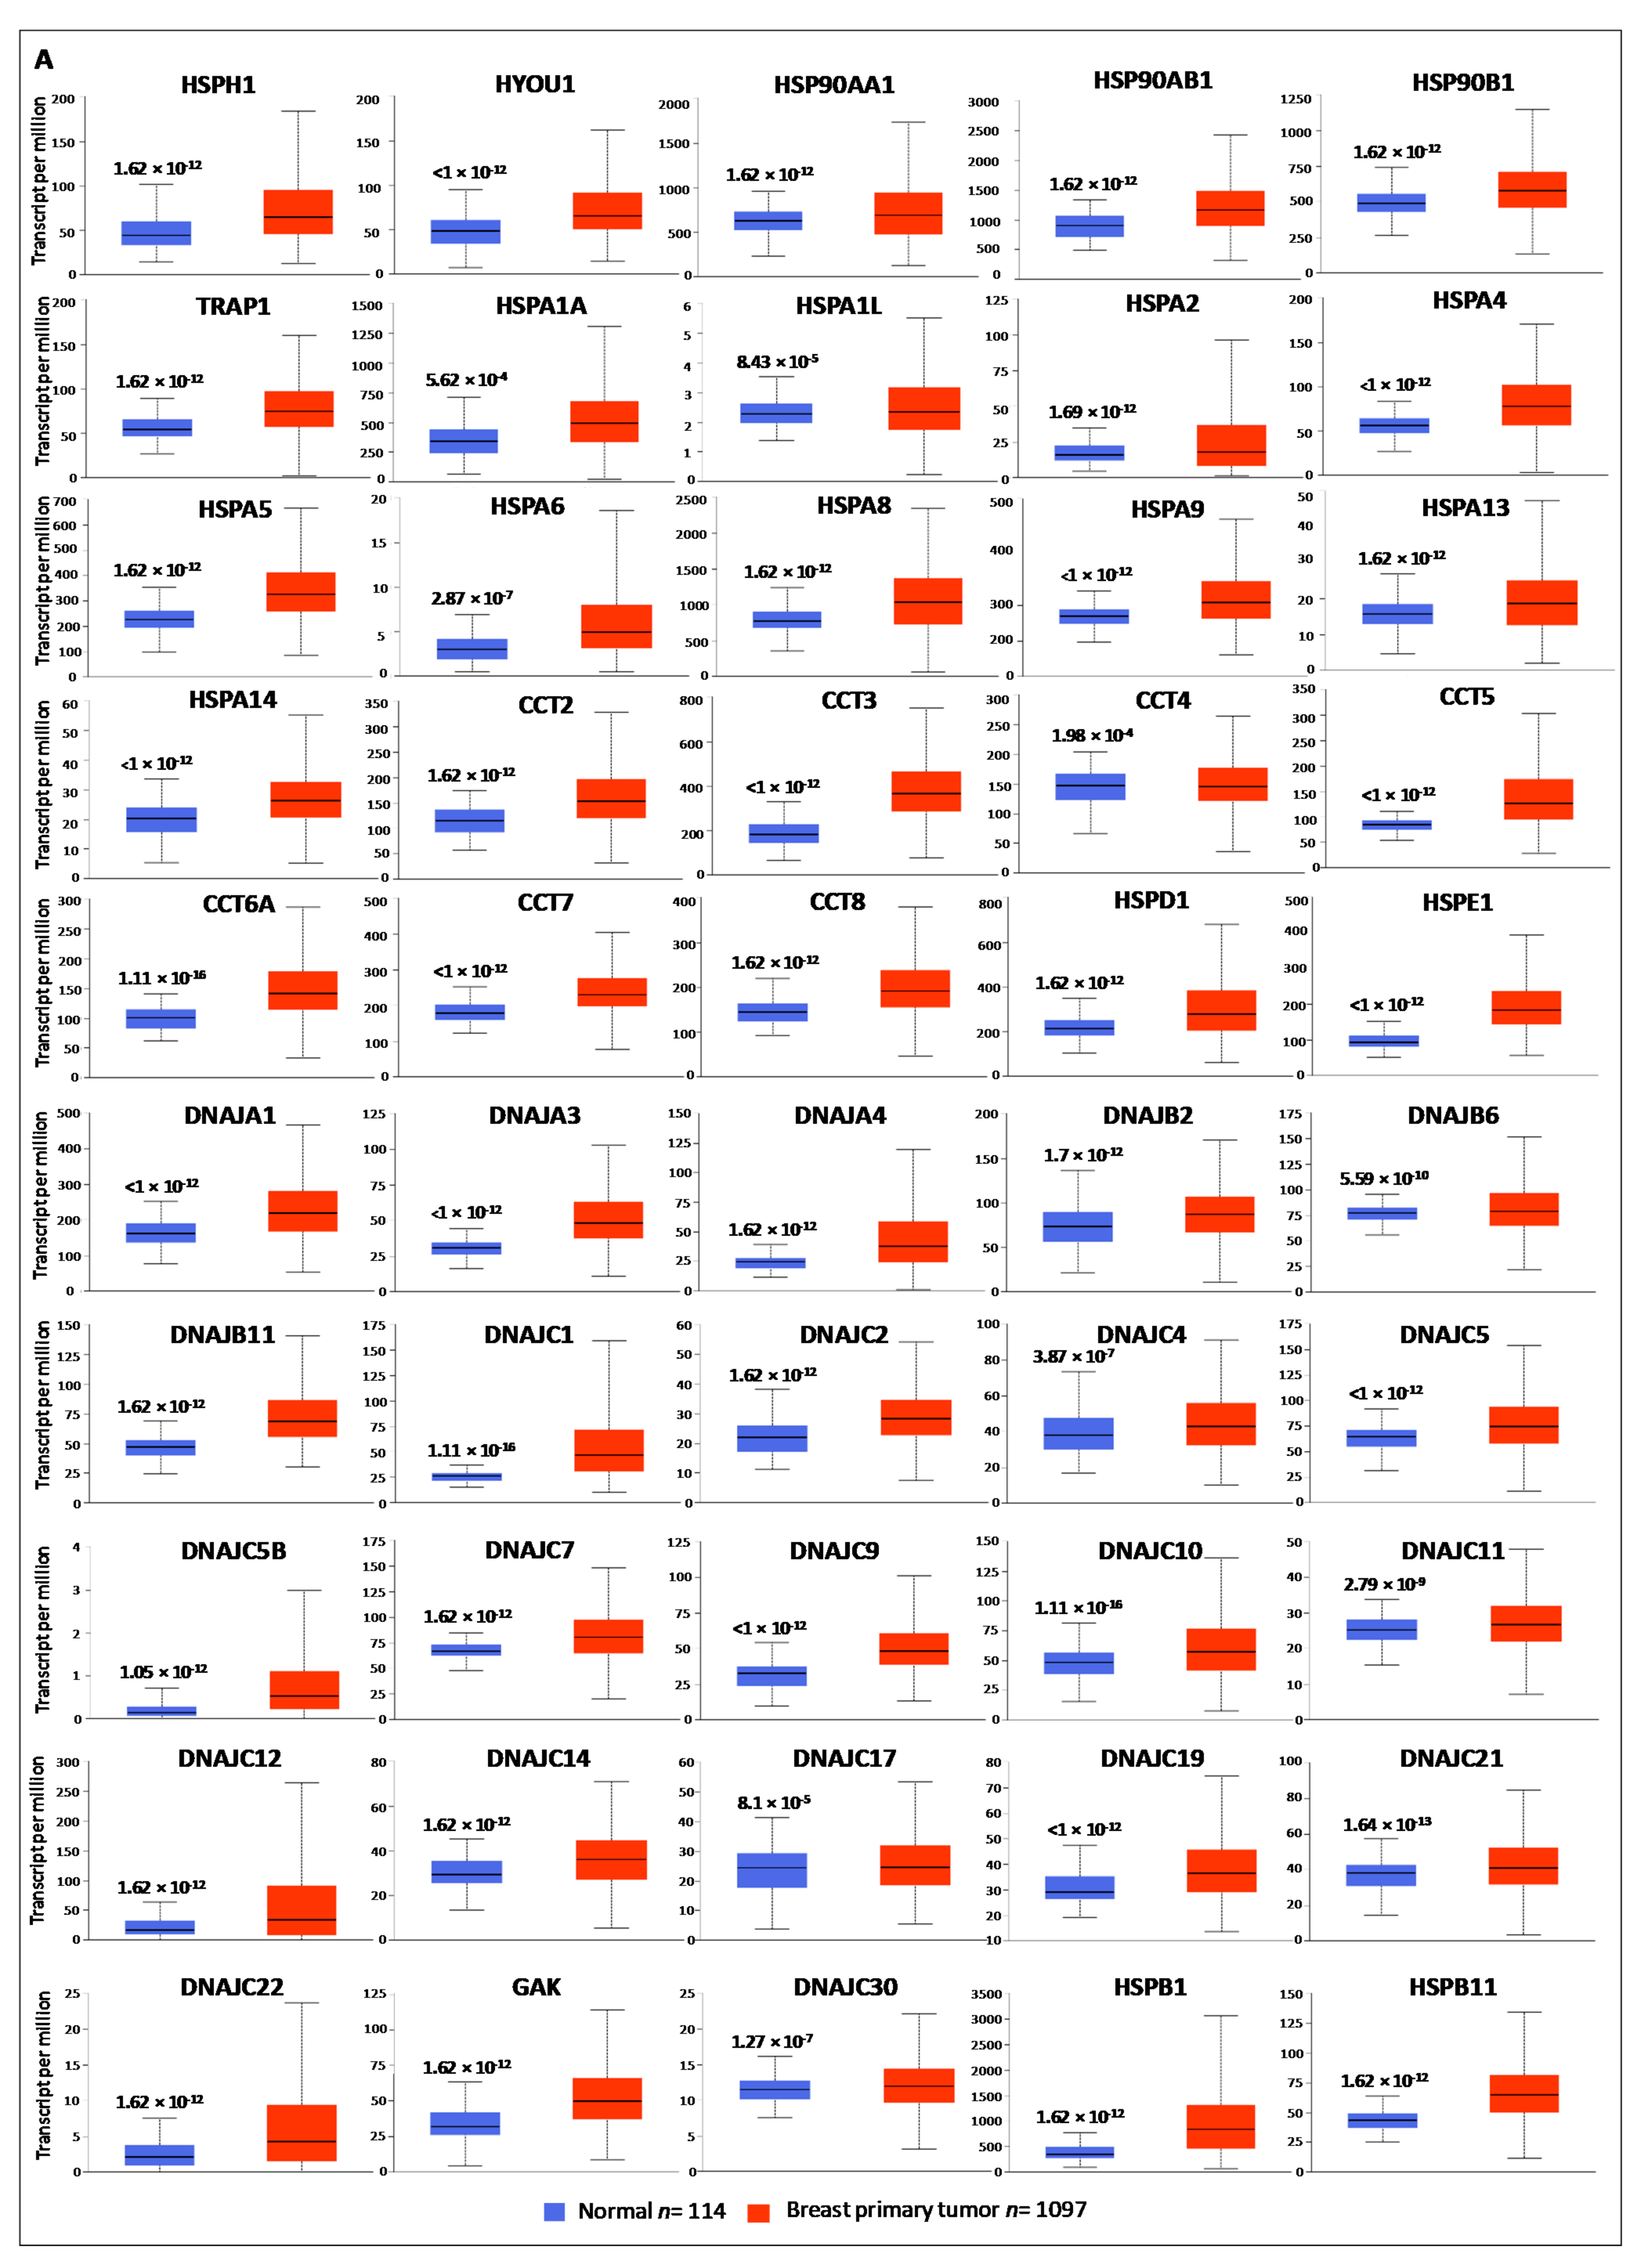
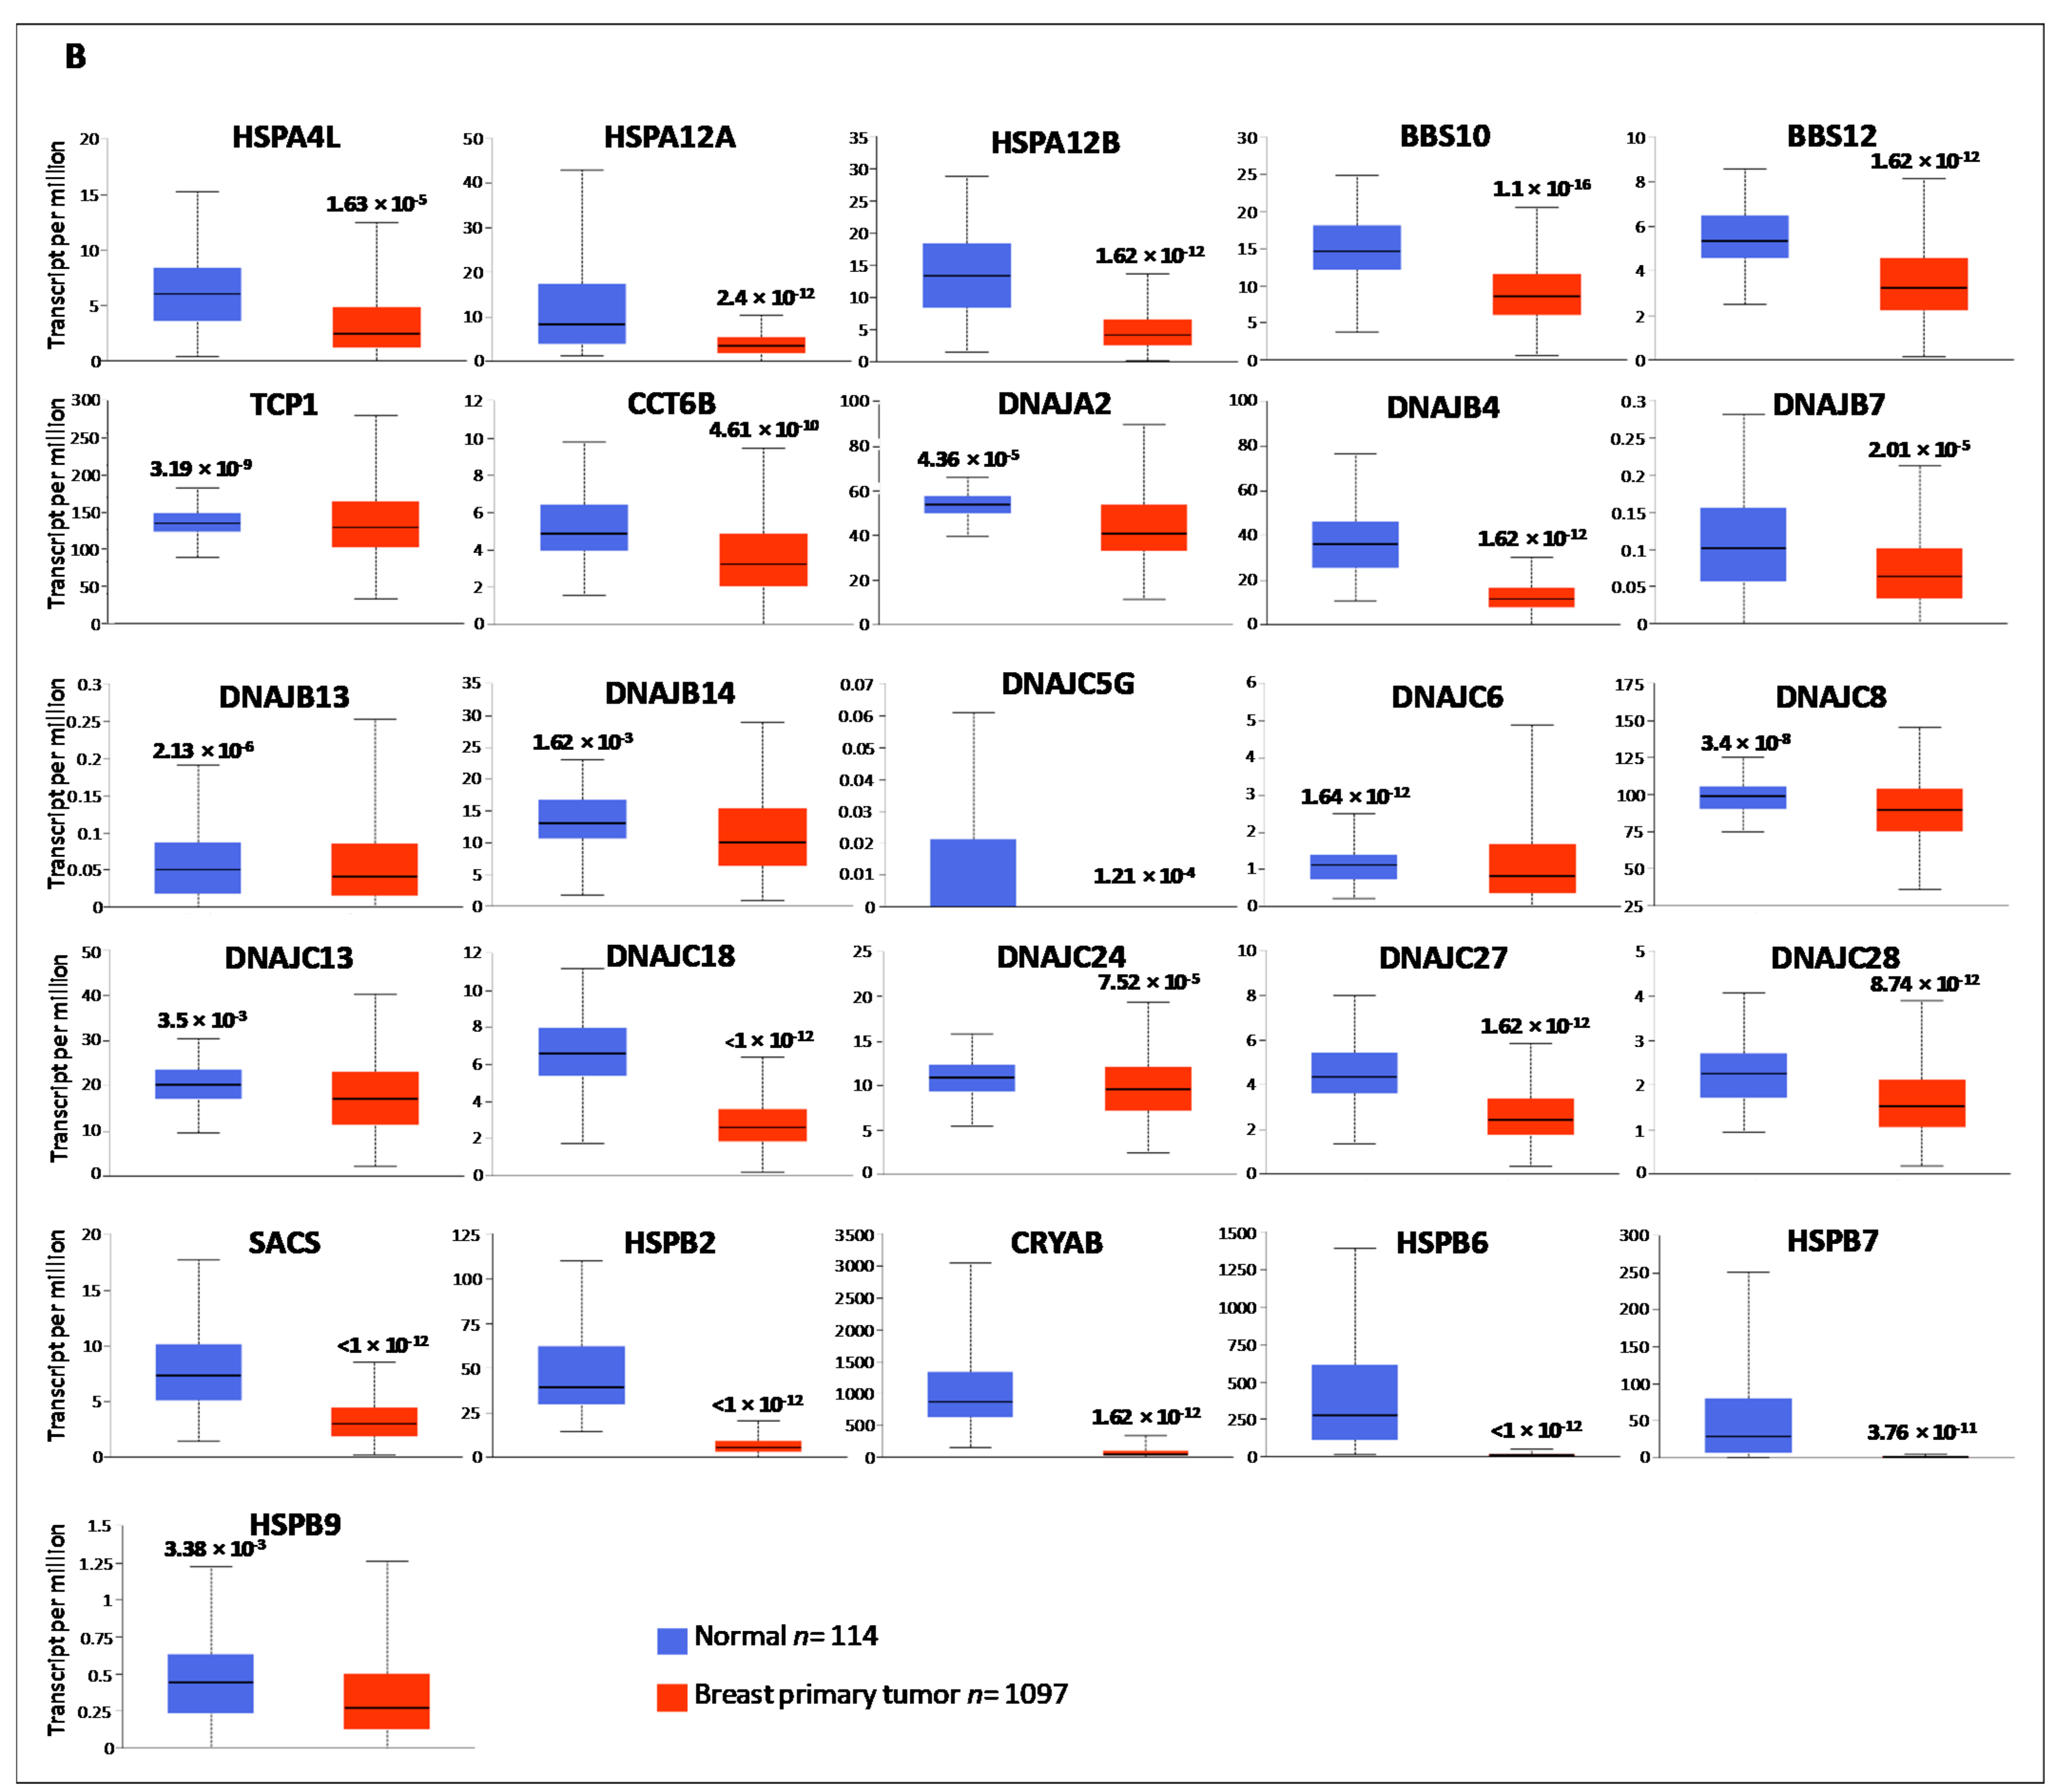
3.1. Gene Expression Analysis of HSP Family Members between Normal and Cancer Tissues

The expression profiles of HSP family members in breast cancer were determined using UALCAN database. Among the 95 HSP members, 76 were significantly deregulated in cancer tissues when compared to the corresponding normal tissues. In particular, 50 HSPs, were found up-regulated (Figure 1A, Table 2) while 26 HSPs, were found down-regulated in breast cancer than normal tissues (Figure 1B, Table 2). Interestingly, the number of transcripts, per million, was spanning between 0.07 for DNAJA5G and 3500 for HSPB1 and CRYAB, suggesting that some members are expressed at very low levels (HSPA1L, HSPB9, DNAJB7, DNAJ5B, DNAJC6, DNAJC27, and DNAJC28) while others are expressed at high levels (HSPA1A, HSPA8, HSPB6, HSP90AA1, HSP90AB1, and HSP90B1). Next, Oncomine meta-analysis was employed to assess the comprehensive expression of HSP members across 20 cancer types (Figure S1). The database compared the HSPs gene expression levels in cancer versus normal samples across a wide variety of datasets in different cancer types. A total of 1460 analyses showed a significant statistical difference for mRNA expression in cancer versus normal samples (the selected thresholds for the analyses were: p-value: 1 × 10⁻⁴; fold change: 2; gene rank: top 10%; data type: mRNA; sample type: clinical specimens). Overlapping results were recorded between UALCAN and Oncomine platforms except for HSPA1A, HSPA1L, HSPA2, DNAJA4, DNAJB2, DNAJC4, DNAJC11, DNAJC21 and GAK found up-regulated in breast cancer but collectively down-regulated in the other tumors, and DNAJC8, DNAJC24, SACS and HSPB6 down-regulated in breast cancer and collectively up-regulated in other tumors. The obtained results clearly indicated that the HSP members are involved in carcinogenesis, acting both as oncogenes or suppressor genes, and suggested that some of them could exert specific roles in different cancer types. Moreover, a high agreement was obtained using different bioinformatics platforms, supporting the robustness of the results.

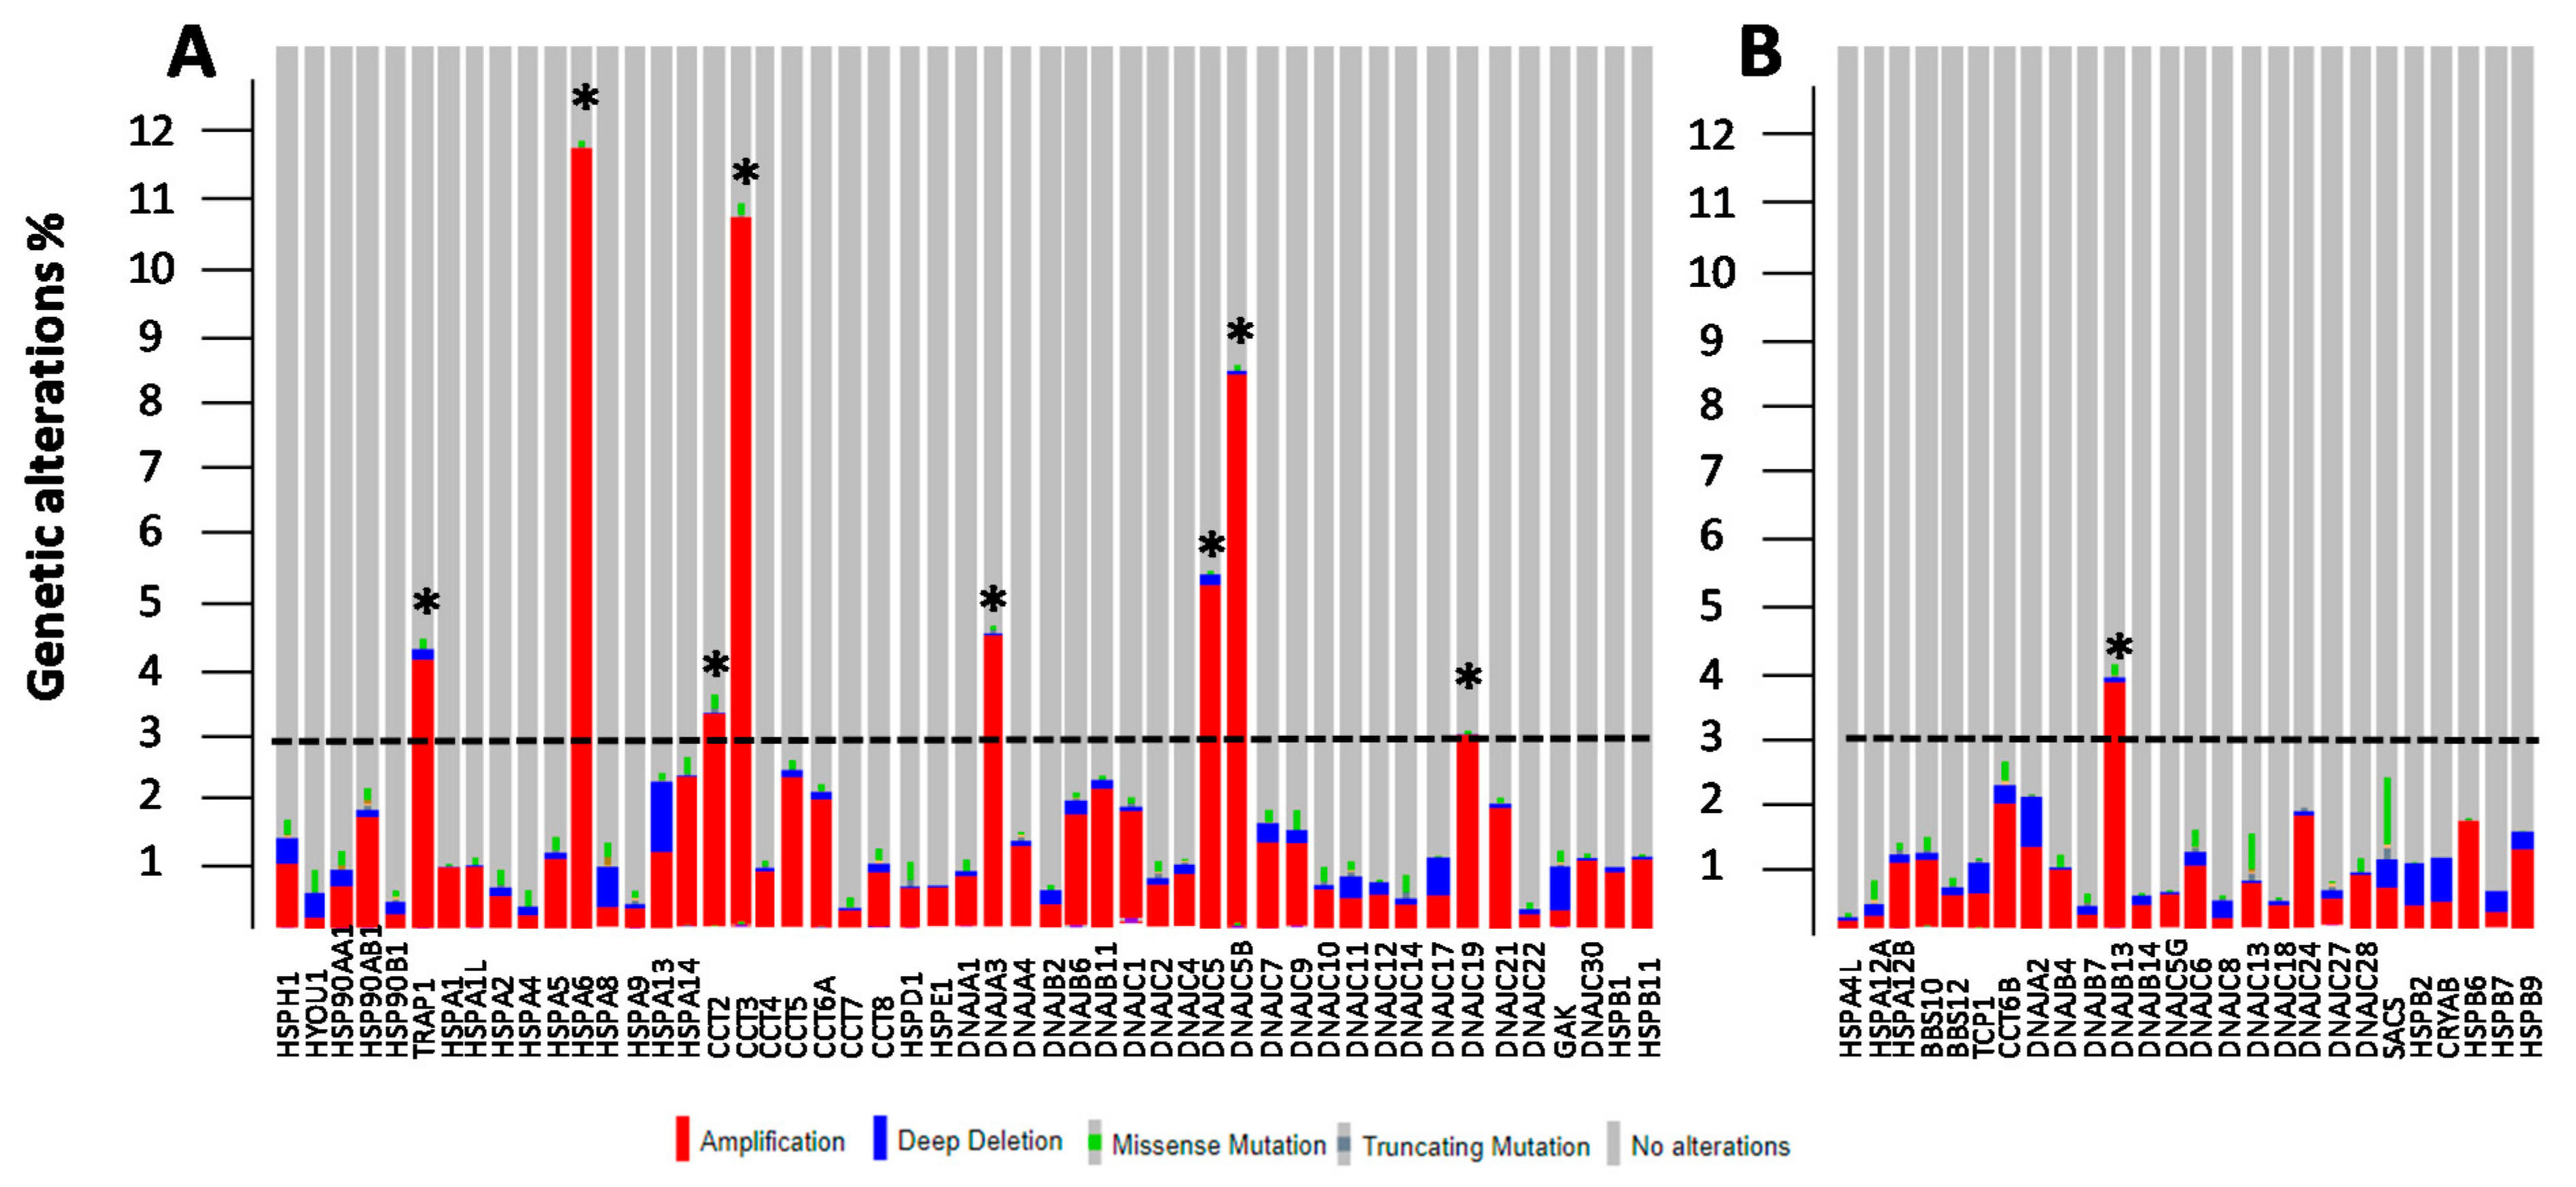
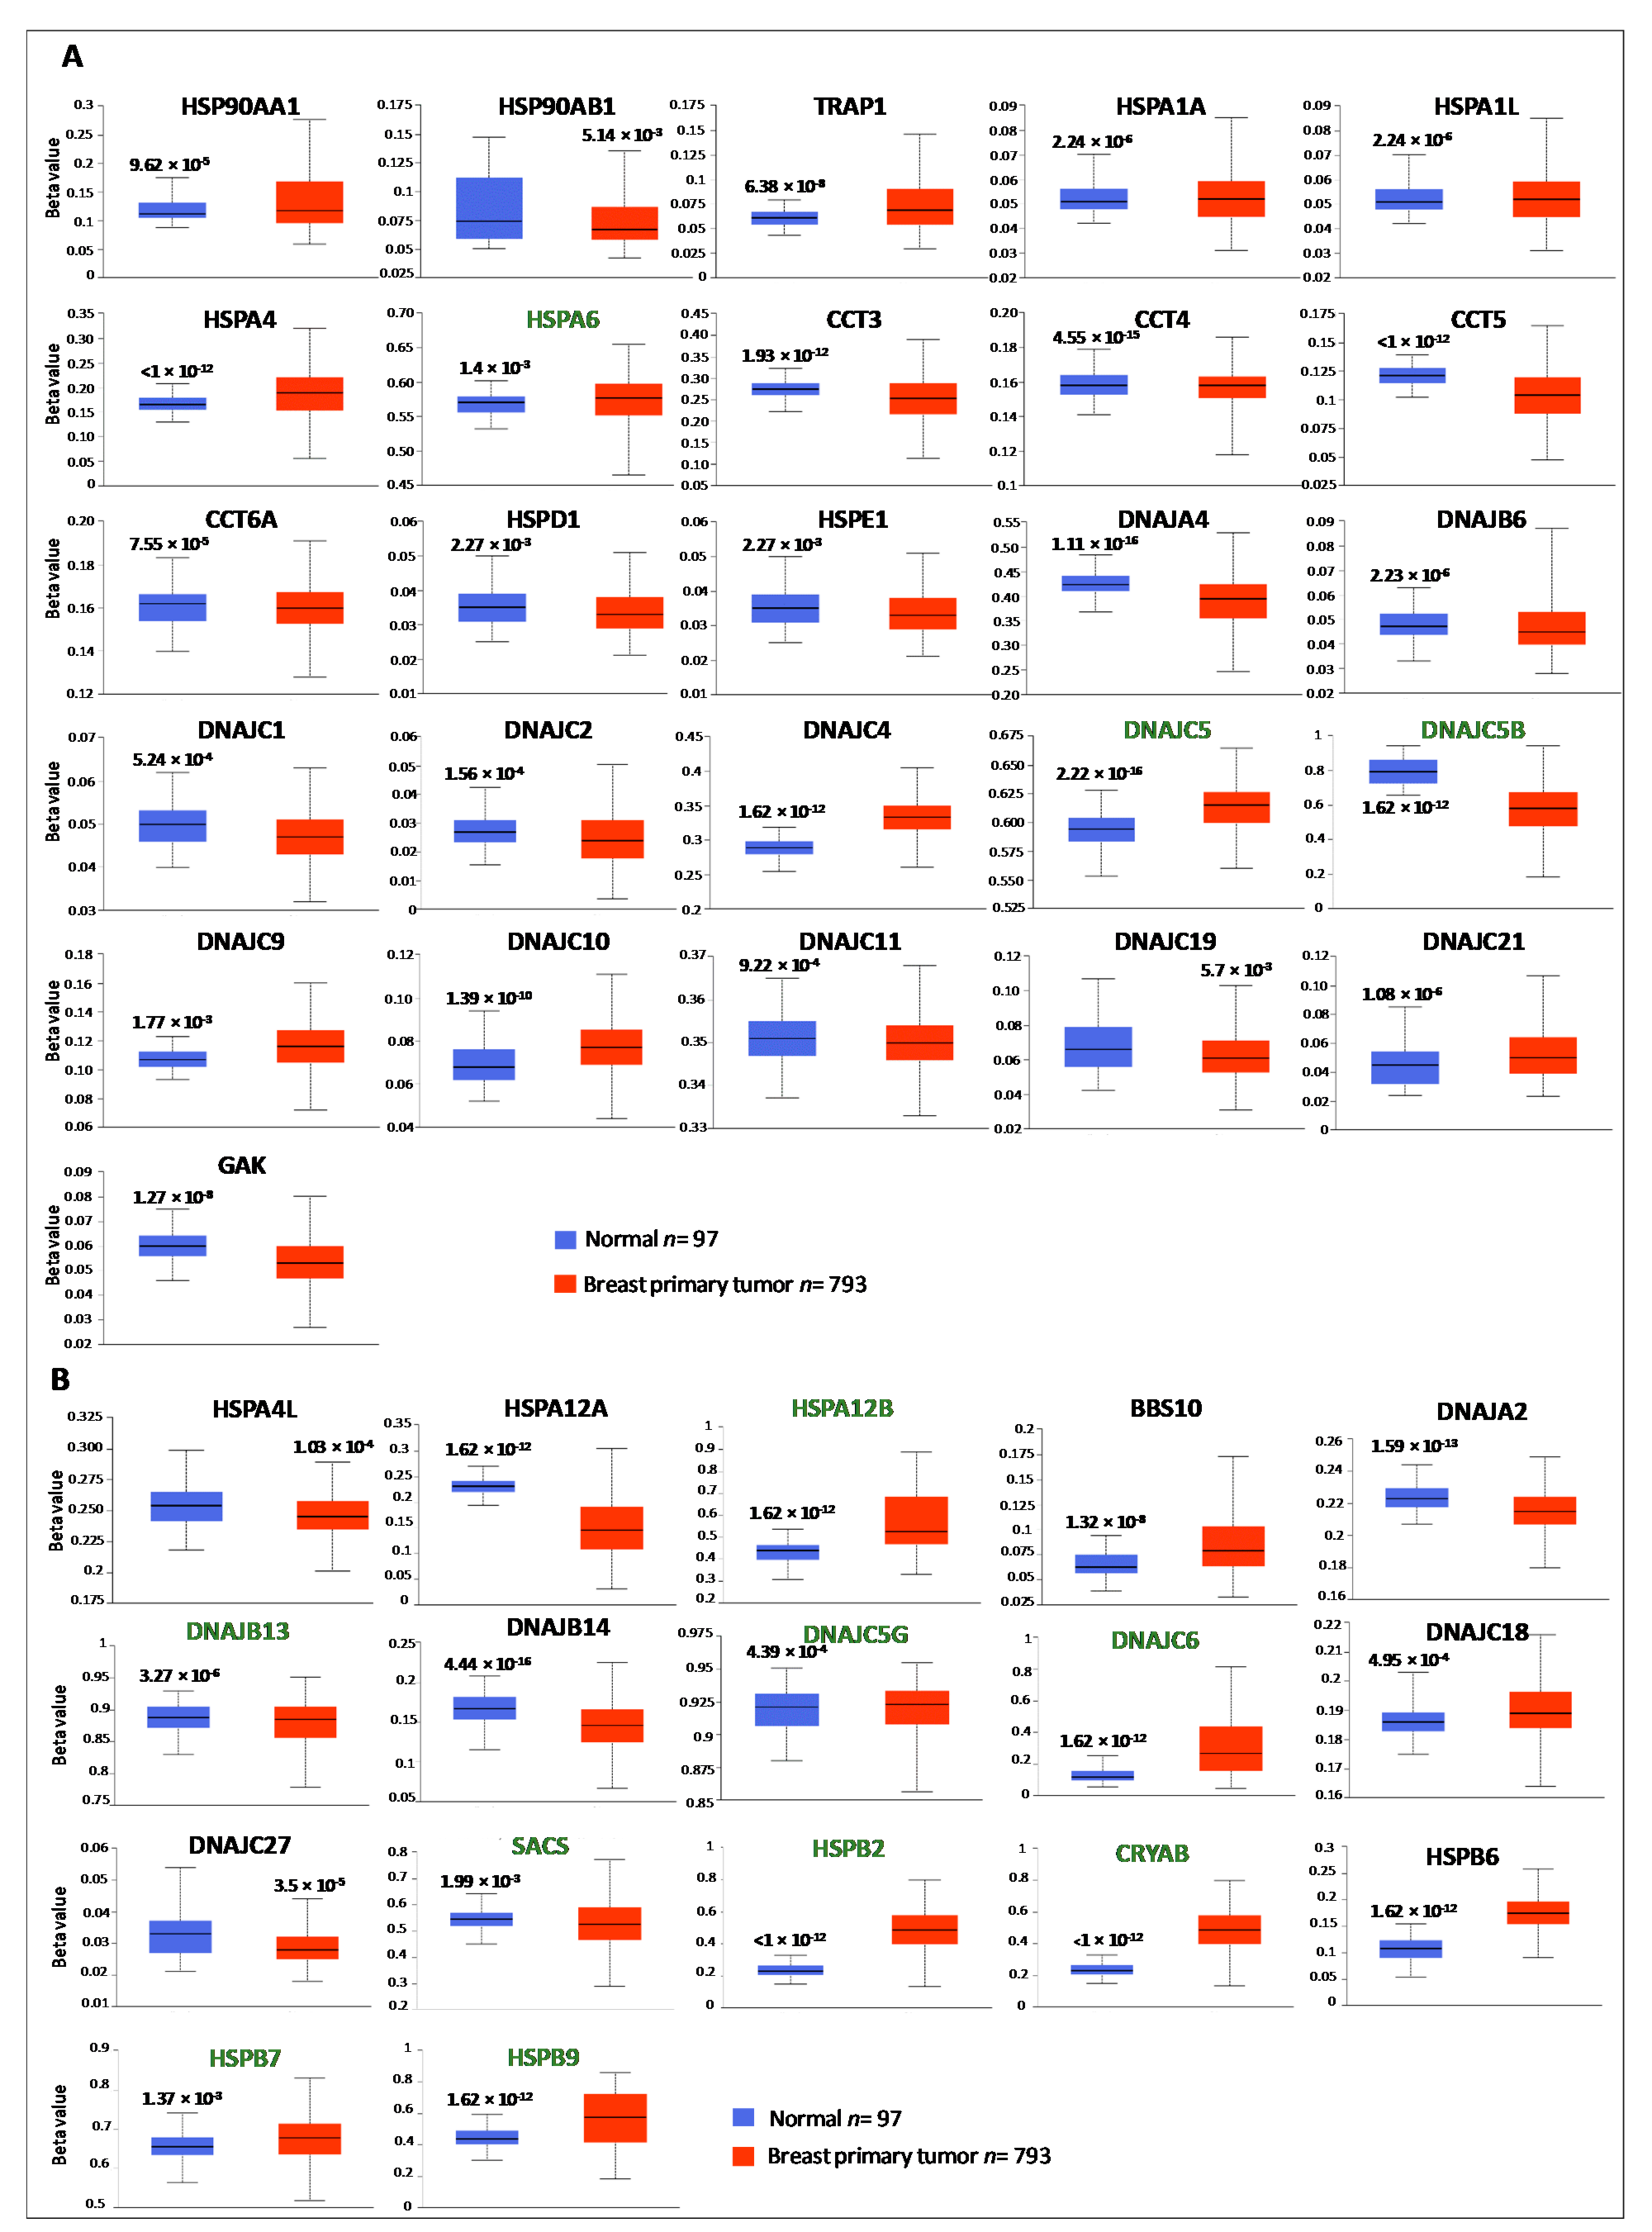
3.2. Genetic and Epigenetic Alterations of HSP Members

It is well-recognized that the expression levels of selected genes could depend on genetic (amplifications or deletions) and epigenetic (promotor methylation status) alterations. To verify whether the deregulated expression of HSP members in breast cancer could be caused by one or a combination of these factors, the genetic mutations of HSP members, in a cohort of breast cancer patients using cBioPortal web, were analyzed. The mutation rate was higher for the HSP members up-regulated in BC (Figure 2A), spanning from 0.4% to 12%. Among these, TRAP1, HSPA6, CCT2, CCT3, DNAJA3, DNAJC5, DNAJC5B and DNAJC19 showed a percentage of alterations higher than 3%. A lower mutation rate was recorded for HSP members down-regulated in BC (Figure 2B), spanning from 0.2% to 4%. Among these, only DNAJB13 showed a percentage of alteration higher than 3%. Concerning the type of HSPs alteration, amplification was the major one, followed by deletion. A very low percentage of missense mutations was detected in all the analyzed samples. Promoter methylation status was analyzed from TCGA data through UALCAN database. Among the differentially expressed HSPs, 26 over 50 up-regulated (Figure 3A) and 17 over 26 down-regulated (Figure 3B), showed statistical differences in promoter methylation status between normal and breast cancer samples. Different beta value cut-off indicates hyper-methylation [beta value: 0.7–0.5] or hypo-methylation [beta-value: 0.3–0.25]. Interestingly, based on beta values, 23/26 HSPs were found with the hypo-methylated promoter and 9/17 HSPs were validated with the hyper-methylated promoter. According to expression pattern analysis among the HSPs up-regulated in BC, 15/26 showed lower promoter methylation while among the HSPs down-regulated in BC, 10/17 showed higher promoter methylation in tumor samples compared with normal samples. These data suggested that the deregulated HSPs gene expression associated with BC may be partly due to genetic and epigenetic alterations.

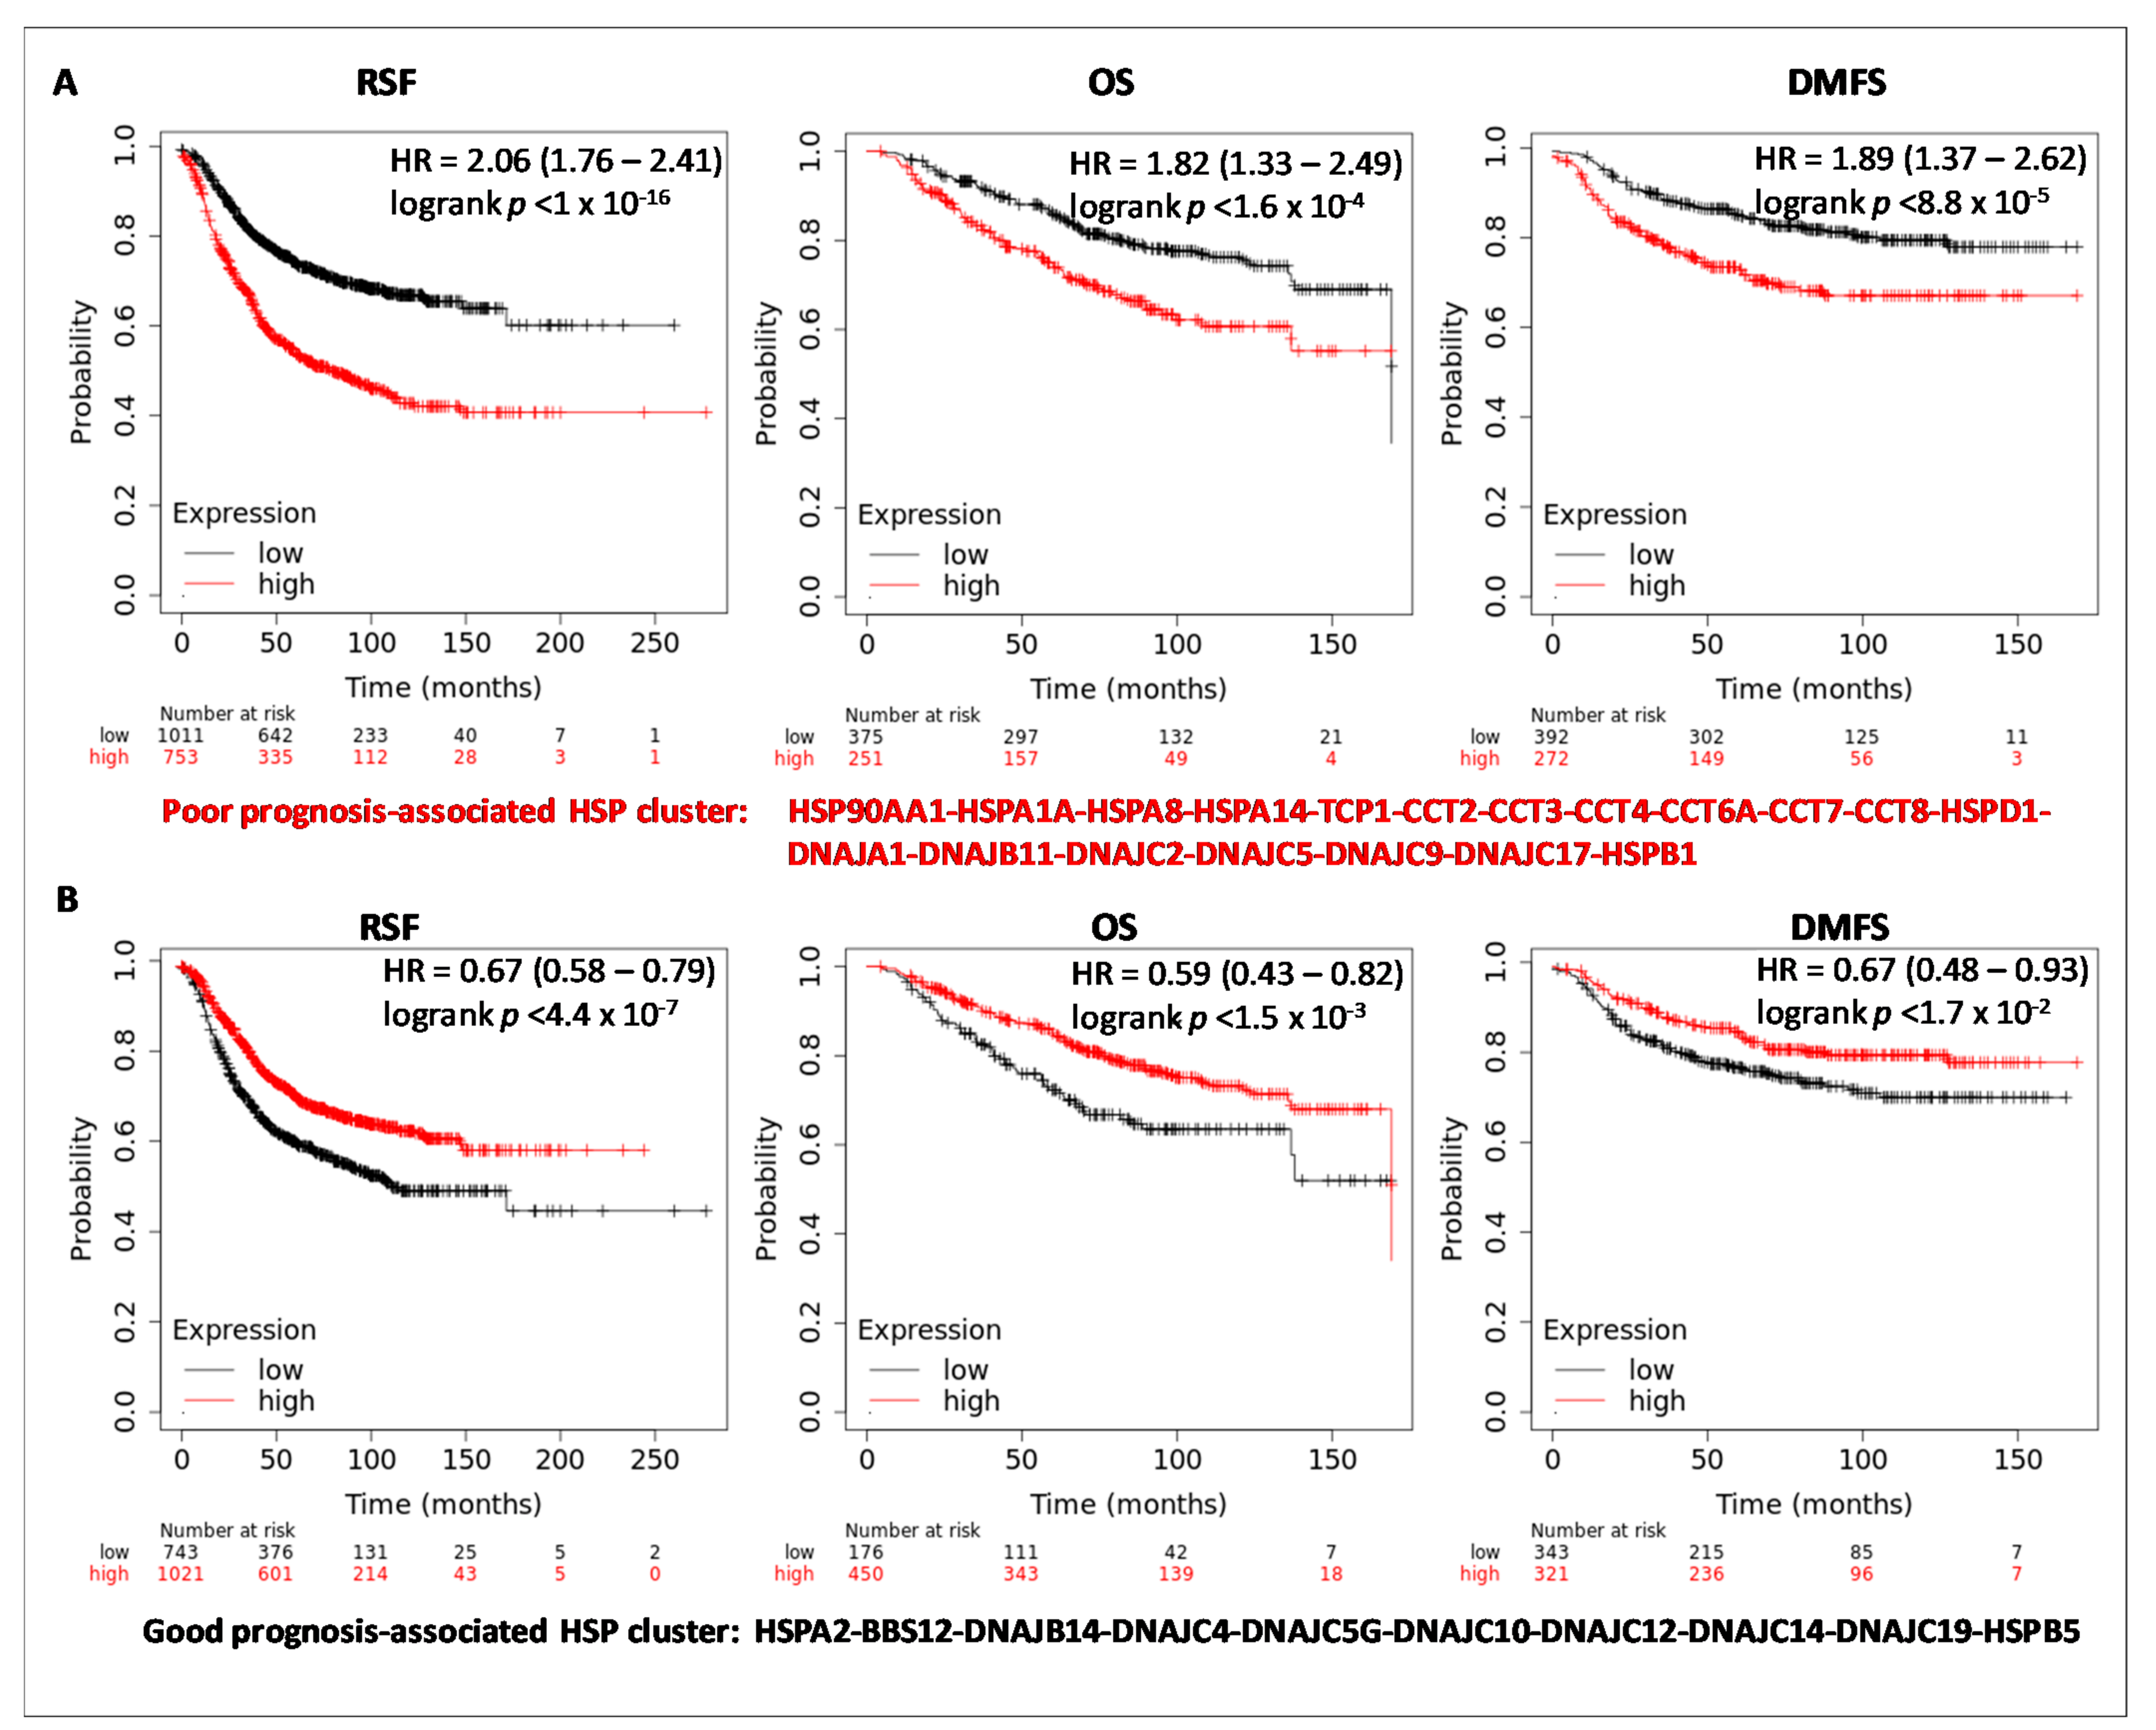
3.3. HSPs Expression and Clinical Outcome

To analyze the prognostic value of the HSP members, Kaplan Meier-plotter database restricted to BC was searched. For each HSP gene (using the Affimetrix ID probe listed in Table 1), the survival outcomes were evaluated as Relapse Free Survival (RSF), Distant Metastasis Free Survival (DMFS), and Overall Survival (OS), (Table S1). Patients were divided into two groups (high and low) based on the expression levels of individual HSPs by selecting the best cut-off. In this case, the software computed all possible cut-off values between the lower and the upper quartiles and the best performing threshold was used as the cut-off value. HSPs expression levels were considered as significantly associated with prognosis when all survival outcomes (RSF, DMSF, and OS) were coherently significant (Table 3, Figure S2). The increased expression levels of 21 HSPs were significantly associated with a worse prognosis, whereas high transcriptional levels of 13 HSPs favored a good prognosis. Among these, only HSPA1B, DNAJB1, DNAJB8, DNAJB12, and DNAJC16 were not differentially expressed in BC, and thus, not further considered. Interestingly, when the survival analyses were re-evaluated, including the panel of worse prognosis-associated HSPs, better prognostic values than the individual ones were obtained (Figure 4A). Similar results (Figure 4B) were obtained including the panel of good prognosis-associated HSPs. These results revealed that collectively, the selected clusters of 19 HSPs and 10 HSPs could be represent robust biomarkers for poor and good prognosis in breast cancer, than individual members.

3.4. Relationship between HSP Members and Clinical-Pathological Parameters

The relationship between the expression levels of HSP-clusters differentially associated with prognosis and current clinical-pathological parameters was assessed using bcGeneXMiner and GOBO databases (Table 4). Clinical parameters included immuno-cytochemical expression of estrogen receptor (ER), progesterone receptor (ER), human epidermal growth receptor 2 (HER), lymph node (N) metastases, and grading (G1-G2-G3). The HSP-cluster associated with poor prognosis showed significant correlations with ER-/PR-, HER+, N+, and G3 tumors, which clinically identify more aggressive tumors. On the contrary, for the HSP-cluster associated with a good prognosis, an inverse trend of correlation with ER+/PR+, HER- N- and G1 tumors was found. Accordingly, it is well known that HER-, N- and G1 tumors are less aggressive. The obtained results confirm that the identified clusters can group patients with homogeneous clinical characteristics and underline their robustness in predicting prognosis in subgroups of patients.

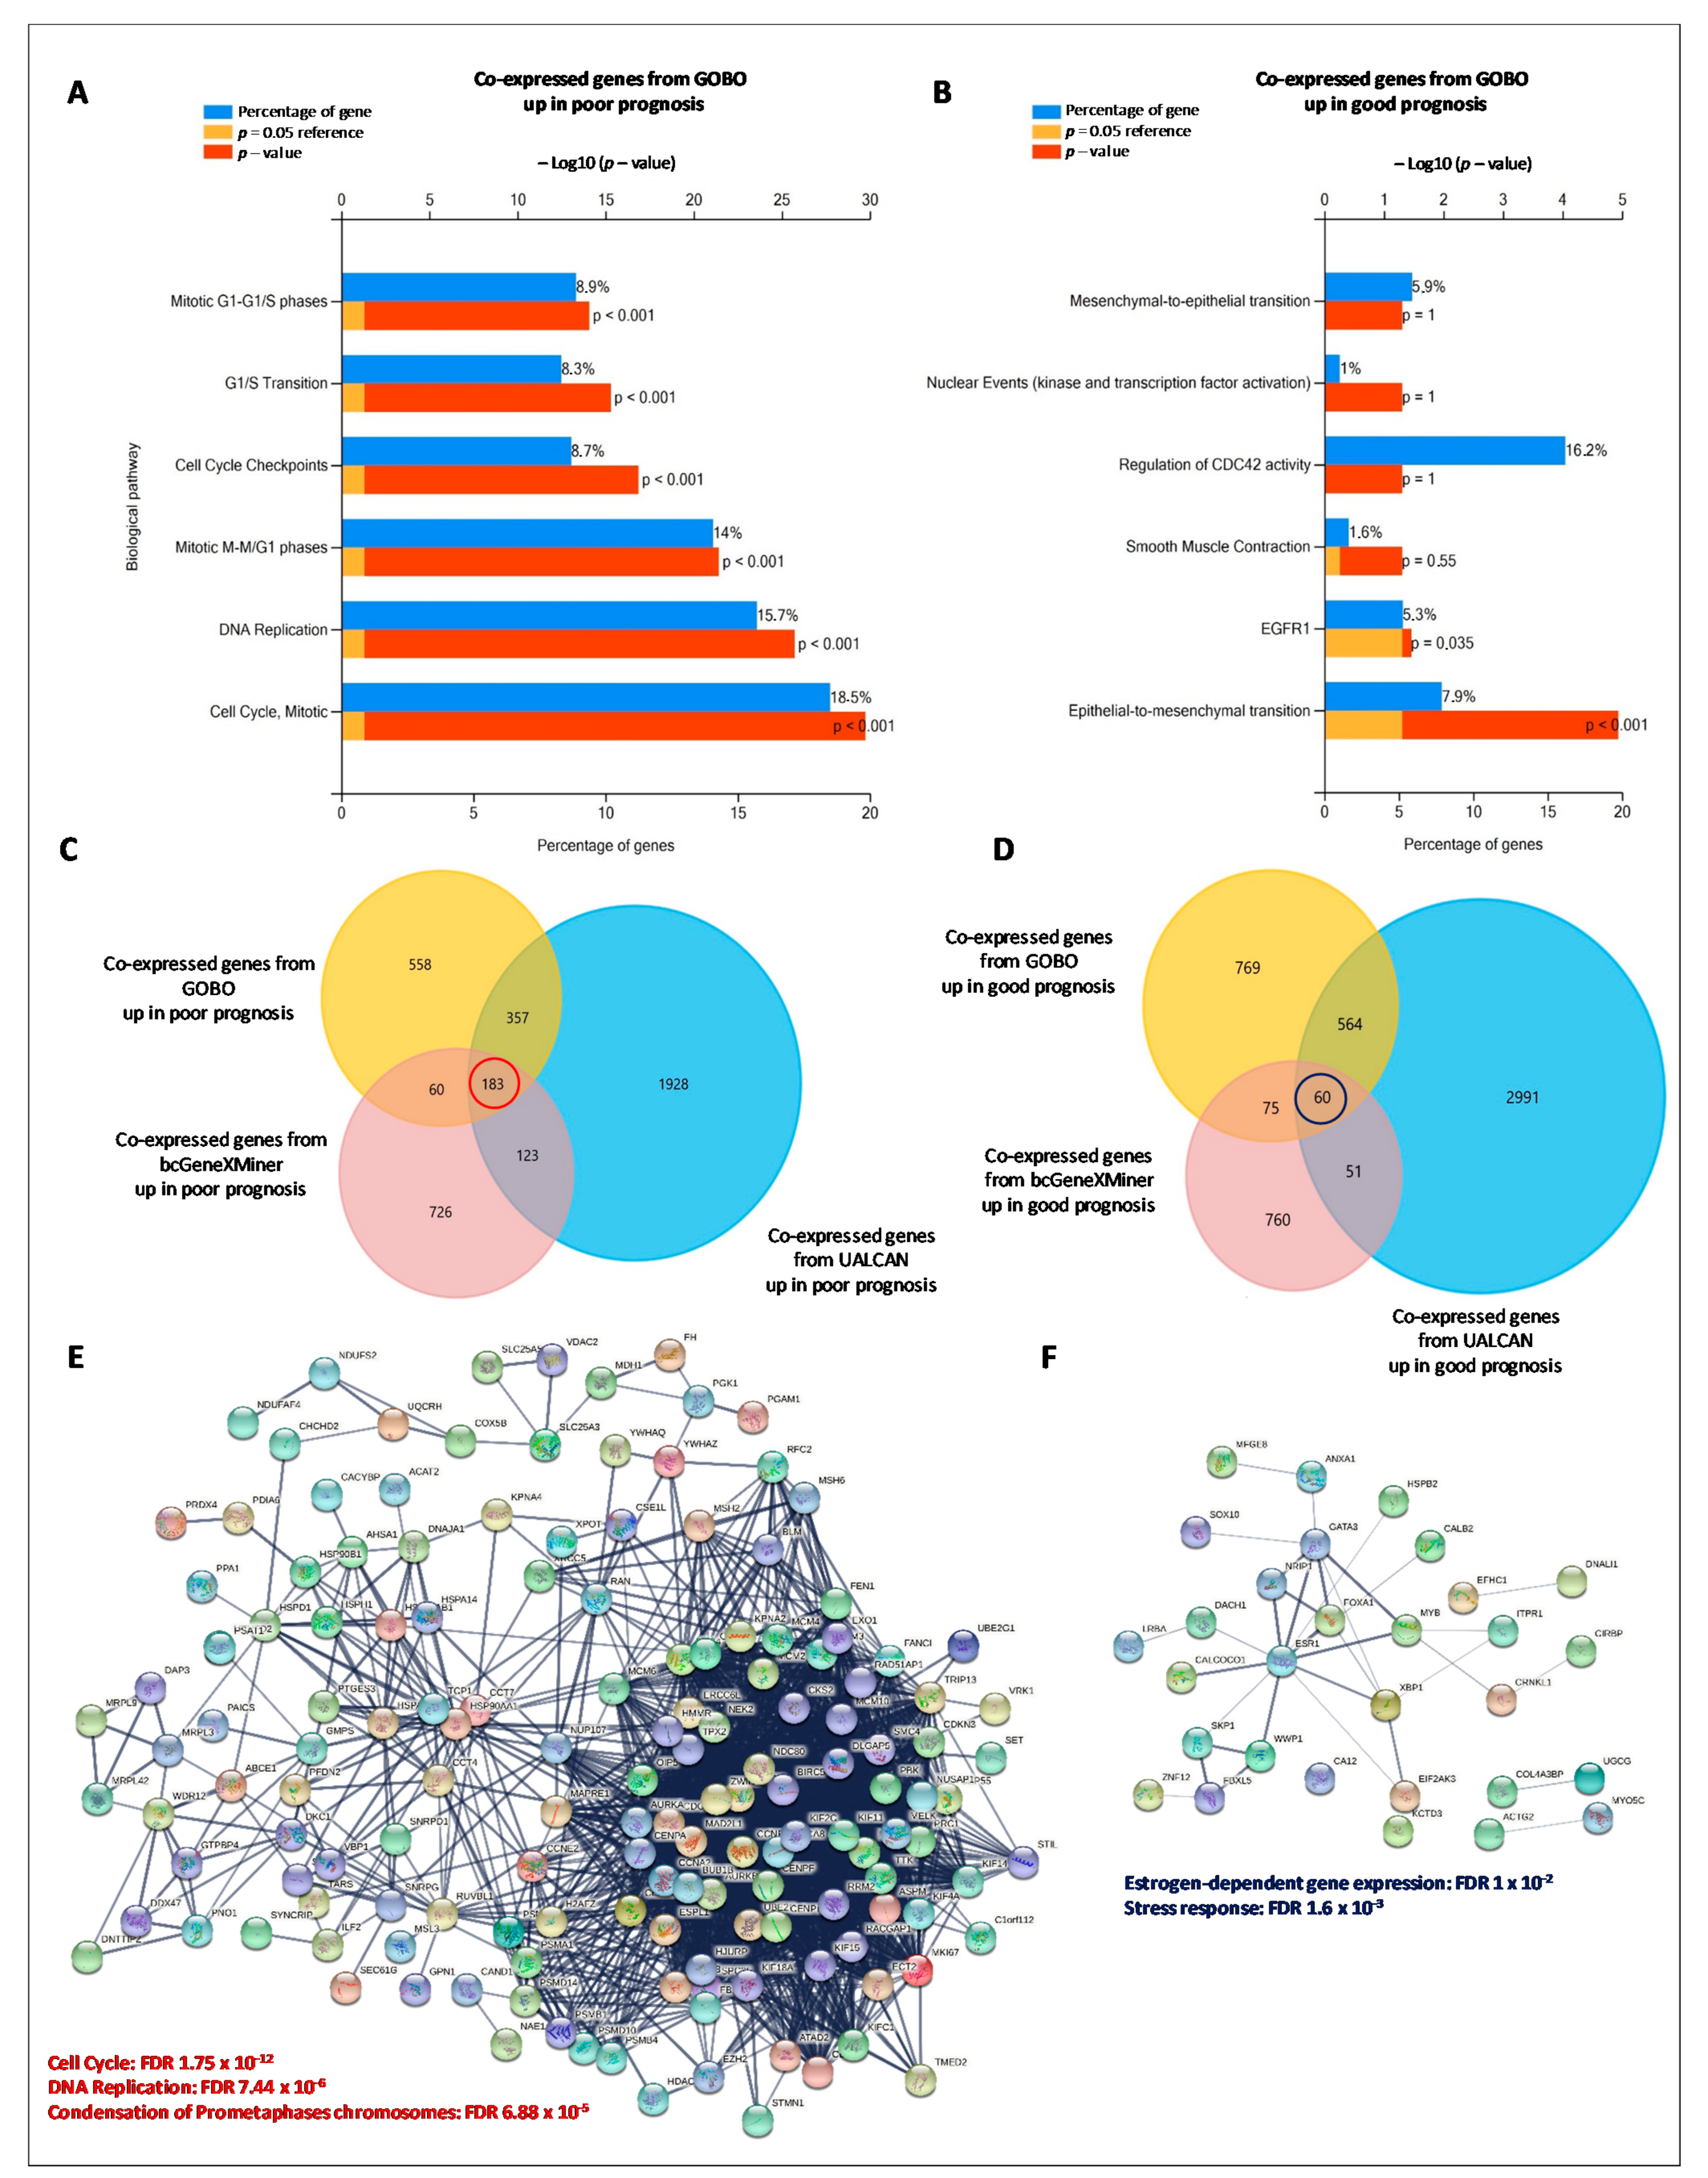
3.5. HSPs-Gene Co-Expression Networks

To unveil the mechanisms by which HSPs deregulation affect breast cancer development and influence prognosis, we identified the predicted genes that are transcriptionally co-expressed with individual HSPs via computational analysis. The co-expressed genes for the HSP-cluster that are significantly associated with a poor and good prognosis were queried to GOBO, UALCAN, and bc-GenExMiner database, respectively, using a Pearson correlation score of ≥ 0.4. The lists of the derived positive and negative HSPs co-expressed genes (Table S2), were appropriately sorted to obtain up-regulated genes in poor prognosis and up-regulated genes in good prognosis. Functional enrichments in the HSP-regulated networks (biological pathways) were highlighted by using the Fun Rich tool. Although each HSP was significantly associated with different genes in different databases, they were implicated in similar biological functions. Overall, biological processes were included in the mitotic cell cycle, DNA replication and cell cycle checkpoint for the co-expressed HSP genes up-regulated in poor prognosis, independently from the used database (Figure 5A, Figure S3A), suggesting that these HSPs-regulated biological processes might play a significant role in the initiation and progression of breast cancer. Less robust results were obtained for the co-expressed HSP genes up-regulated in good prognosis (Figure 5B, Figure S3B): the biological processes in which these genes are involved were Epithelial to Mesenchymal Transition (ETM) for the gene list derived from GOBO and bc-GenExMiner, and receptor signaling network (PAR-1, c-MET, VEGFR1, VEGFR2, HER2) for the gene list derived from UALCAN. Interestingly, when the list of common genes from the three bioinformatics platforms (Figure 5C,D) was used to find functional protein-protein interactions by using the STRING analysis tool (Figure 5E,F), a significant network, involved in cell cycle and DNA replication, was obtained for the co-expressed HSP genes up-regulated in poor prognosis. Again, the protein-protein interaction network derived from the co-expressed HSP genes up-regulated in good prognosis, was less robust and affected the Estrogen-dependent gene expression. Collectively, the pathway analysis of HSP co-expressed genes showed a specific signature for poor prognosis, affecting cell cycle and DNA replication.

3.6. Regulatory Network Analysis of HSPs-miRNA-mRNA

To further explore the molecular mechanisms responsible for HSPs effects on BC, we analyzed the networks of HSPs co-expressed miRNAs generated by the bc-GenExMiner database. Positive and negative HSPs co-expressed miRNAs were properly sorted to obtain two lists of up-regulated miRNAs in poor and in good prognosis. Only the miRNAs repeated at least three times were selected for miRNA-mRNA network construction using miRNet. A total of 14 miRNAs were clustered within the miRNAs network up-regulated in poor prognosis (Table 5). Interestingly, the target genes were involved in the cell cycle (Figure S4A). A total of 20 miRNAs were clustered within the miRNAs network up-regulated in good prognosis (Table 5). The target genes were implicated in the negative regulation of DNA-dependent transcription (Figure S4B). Interestingly, among the HSPs co-expressed miRNAs up-regulated in poor prognosis 5 miRNAs (hsa-mir-320b-2, hsa-mir-545, hsa-mir-651, hsa-mir-570, hsa-mir-643) were significantly up-regulated in breast cancer than normal tissues, as verified by using UALCAN, while among the HSPs associated miRNAs up-regulated in good prognosis, 10 miRNAs (hsa-mir-143, hsa-mir-196b, hsa-mir-145, hsa-mir-150, hsa-mir-1228, hsa-mir-1910, hsa-mir-1247, hsa-mir-411, hsa-mir-370, hsa-mir-770) were significantly down-regulated in BC compared to normal tissues. As the mRNAs-miRNAs network was created considering the HSPs clusters associated with prognosis, a greater interconnection mRNAs-miRNAs was recorded for the cluster associated with poor prognosis (Figure S4C), compared to the network obtained for HSPs-cluster associated with good prognosis (Figure S4D). As expected, collectively they were involved in protein folding. Several miRNAs, selected as key components of the networks, showed significant differences between breast cancer than normal tissues. In particular, 12 of them were up-regulated in breast cancer tissues, while 6 of them were down-regulated in breast cancer. These results, for the first time, indicated that the HSPs deregulation in BC affected epigenetic networks involving also several microRNAs, pointing that the complex network triggered by HSPs deregulation provides a distinctive molecular portrait of each tumor.

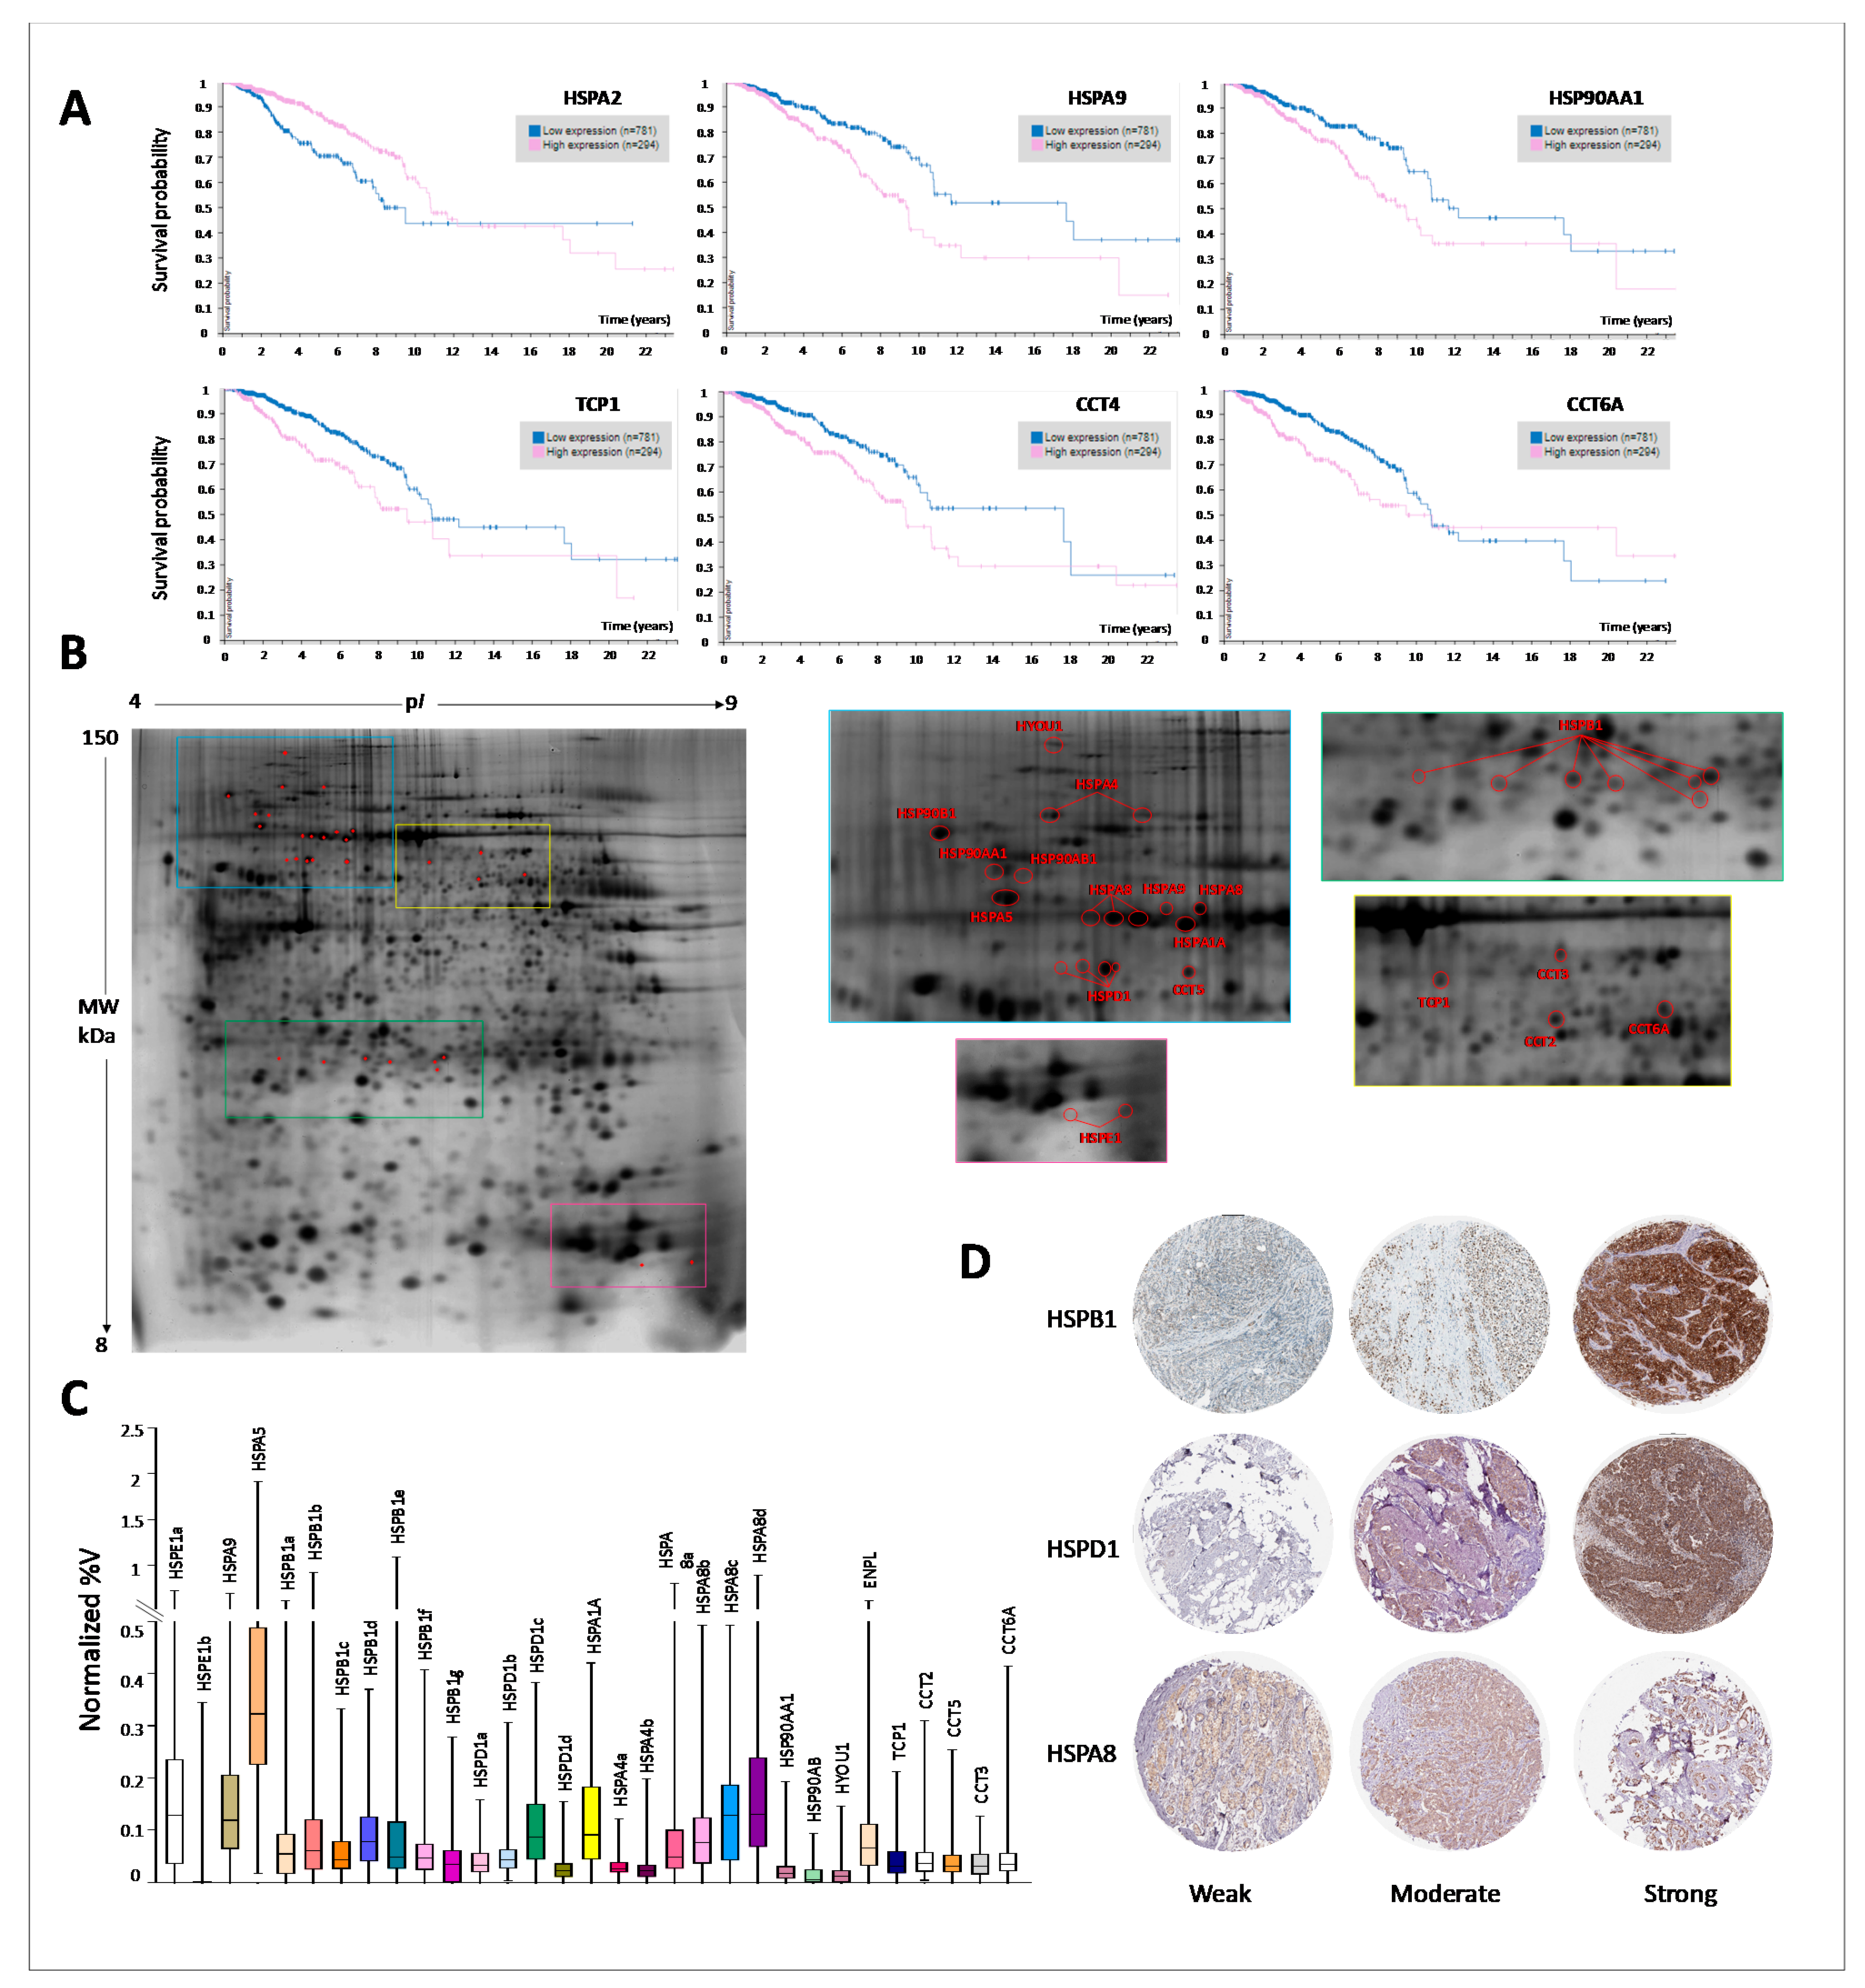
3.7. Proteomics Expression of HSP Members and Prognostic Significance

Complementing the transcriptomics results with proteomics ones allows studying globally the HSPs-network within cancer cells and is also necessary to validate the existence of different protein isoforms as well as the exact localization of proteins, tightly linked to their function. The prognostic value of HSPs protein expression, evaluated by immunohistochemistry (IHC) staining, was retrieved using The Human Protein Atlas (HPA) database (Figure 6A). High expression levels of 5 HSP members (HSPA9, HSP90AA1, TCP1, CCT4 and CCT6A) were significant associated with shorter overall survival, while a high expression level of HSPA2 was associated with a good prognosis. Moreover, taking advantage of our previous proteomic data, we performed a comprehensive screening of protein spots, in different proteomic maps, and collectively the following HSP protein members were identified: HYOU1 (HYOU1), HSP90AA1 (HS90A), HSP90AB (HS90B), HSP90B1 (ENPL), HSPA1A (HS71A), HSPA4 (HSP74, 2 isoforms), HSPA5 (BIP), HSPA8 (HSP7C, 4 isoforms), HSPA9 (GRP75), HSPD1 (CH60, 4 isoforms), TCP1 (TCPA), CCT2 (TCPB), CCT3 (TCPG), CCT5 (TCPE), CCT6A (TCPZ), HSPB1 (HSP27, 7 isoforms), HSPE1 (CH10, 2 isoforms). Figure 6B shows a representative proteomic map of a breast surgical tissue silver-stained, with cropped windows where the 17 identified HSPs proteins and 14 isoforms are marked with labels corresponding to the gene name. The protein identity was assessed by Maldi-Tof (Table S3). Different isoforms of the same protein were labeled by alphabetic letters starting from the more acidic one. Several HSP proteins and isoforms showed high variability of expression between analyzed patients (Figure 6C), suggesting that different proteins and isoforms should be used for patient stratification. Finally, the immunohistochemical analysis using the HPA database gives us the possibility to define HSPs protein localization in different compartments at a single-cell and subcellular level and also provided important spatial information in the context of neighboring cells. Figure 6D reports immunohistochemical staining of BC tumors showing weak, moderate and strong expression of selected HSPs, based on the major number of identified isoforms in proteomics maps. Interestingly, antibody immunoreactivity was observed in several cellular compartments, such as cytoplasm, plasma membrane, and nucleus. Collectively, our proteomic data on HSPs expression and prognostic value are in line with genomic data. Although, proteomic investigations showed a more complex scenario in which different HSP-isoforms can operate within the cancer cells, creating new functional arrangements, difficult to predict based on gene expression. In the hope for the clinical use of HSP-clusters, both the gene and protein expression levels should be taken into consideration, for a more accurate prognosis.

4. Discussion

HSPs are a ubiquitous and highly conserved protein class, essential for cell protection from a wide range of harmful conditions, including heat shock, oxidative stress, inflammation, and proteotoxic stress (a specific form of deleterious stress causing increased levels of misfolded proteins). However, when the cells reach the limit of stress tolerance, they activate apoptosis or autophagy. HSPs play critical roles in inhibiting pro-apoptotic molecules through the modulation of several signaling cascades such as JNK, AKT, and NF-κB [44]. Several HSP members are closely associated with the onset and progression of several human cancer types [45,46,47,48,49], but the expression pattern and potential roles of HSPs in breast cancer, as well as their underlying regulatory mechanisms, remain poorly investigated. Only two recent studies investigated the prognostic significance of HSP members in BC, exclusively limited to the transcriptomic analysis [50,51]. Here, for the first time, we performed an integrated multi-omics analysis to assess the prognostic value and the functional implications of HSPs deregulation in BC. Using UALCAN database, we found that collectively HSP family members were deregulated in BC. In particular, 50 HSPs members were significantly up-regulated in cancer compared to normal tissues, while 26 HSPs members were down-regulated. These results indicated that HSPs could act both as oncogenes or tumor suppressor genes. Moreover, the Oncomine analysis of HSPs deregulation in different cancer types showed that HSPs exert both, pro- and anti-tumorigenic actions depending on the tumor type.
HSP members are coded by distinct chromosomal loci that are not clustered. The molecular basis of HSPs deregulation in BC has not been well-studied and may have multiple molecular etiologies. For example, associated with genetic alterations and/or epigenetic modifications. Collectively, we showed that the mutation rate (amplification followed by deletion) was higher in HSP members up-regulated in BC, while a lower mutation rate was detected in HSP members down-regulated in BC. Besides, HSPs promoter regions were found to be commonly hypo-methylated in HSP members up-regulated in BC, while a general tendency to hyper-methylated promoters was detected in HSP members down-regulated in BC. In alignment with our results, the CpG island located in the promoter regions of the DNAJC10 gene was found to be frequently hypo-methylated in breast cell lines [52]. We speculate that genetic alterations and epigenetic deregulations could in part explain the deregulation of HSPs in BC. Other mechanisms responsible for HSPs deregulation are: (1) The heat shock factor (HSF) family that ensures prompt transcriptional activation of HSP members under stress and equally precipitous switch-off after recovery [53]; (2) the genetic changes associated with tumor progression, producing over-expressed onco-proteins, mostly mutated and/or conformationally altered proteins, may elicit an HSPs response; (3) the aneuploidy (defined as abnormal chromosome number), and its associated abnormalities [54], such as chromosomal instability (CIN), could impair HSPs expression and function. Aneuploidy alters the relative dosage of genes on the affected chromosomes, leading to cellular stress response at least partially due to impaired protein folding capacity. This, in turn, affects the cellular protein quality control pathways that preserve homeostasis and induces chronic proteotoxic stress (broadly referring to the overburdening of cellular systems that maintain proper protein folding and homeostasis) [55,56]. Consequently, the aneuploid cells would exhibit an over-production of proteins, relative to the chaperone systems needed to fold nascent polypeptides or the degradation systems that remove misfolded or damaged proteins. This is of particular importance regarding the maintenance of the correct stoichiometry of macromolecular complexes, whose subunits may be encoded by genes on different chromosomes. Further studies are needed to more comprehensively explore the detailed molecular mechanisms of altered HSPs expression in BC.
The prognostic analysis, performed on HSPs gene expression levels and clinical outcome, identified two HSP-clusters, associated with a poor and good prognosis, respectively, in line with previous reports [50,51]. Analytically, when the HSP subfamilies were considered, the chaperonins subfamily (TCP1, CCT2, CCT3, CCT4, CCT6A, CCT7, and CCT8) was collectively associated with poor prognosis. Accordingly, the expression levels of different CCT members are reported as up-regulated in various cancers [57]. In particular, it was estimated that CCT members facilitate the folding of approximately 10% of newly synthesized proteins [58], and in cancer cells they could potentially fold more proteins, with substrates, including oncogenic proteins and mediators of oncogenesis [59]. A more heterogeneous involvement with prognosis was detected for HSP40 members, with 7 members significantly associated with poor prognosis (DNAJA1, DNAJB1, DNAJB11, DNAJC2, DNAJC5, DNAJC9, DNAJC17) and 10 members associated with good prognosis (DNAJB8, DNAJB12, DNAJB14, DNAJC4, DNAJC5G, DNAJC10, DNAJC12, DNAJC14, DNAJB16, and DNAJC19). HSP40 members acting as co-chaperones regulate the major functions of other HSPs (HSP90, HSP70, and HSP60) and could be able to switch the canonical functions of HSPs towards oncogenic roles. HSP40 members work as tumor suppressors and inhibit tumor growth [60]. Other members have been implicated in cancer development and metastasis, such as DNAJA1 (in glioblastoma and prostate), DNAJB11 (in ovarian tumors), and DNAJC9 (cervical) [61].
Interestingly, the HSP-cluster associated with poor prognosis showed significant correlations with ER-/PR-/HER+, lymph node metastases, and higher grading, identifying more aggressive tumors. On the contrary, the HSPs cluster associated with a good prognosis showed a significant correlation with ER+/PR+, HER-, lymph node-negative, and lower grading tumors. Collectively, these results confirm the robustness of the identified HSP clusters in predicting prognosis in clinical subgroups of patients.
To explore HSPs-related pathways altered in BC, genes co-expressed with HSPs were analyzed. We found that HSPs co-expressed genes associated with poor prognosis were enriched with cell cycle, DNA replication and cell cycle checkpoint, commonly oncogenic processes associated with cell proliferation. Therefore, we hypothesize that HSP-networks, affecting cell cycle, and DNA replication, may provide a robust measure of proliferation rate and more aggressive clinical course in BC. Less robust results were obtained for the HSPs co-expressed genes up-regulated in a good prognosis. The pathways enrichment analysis of these genes showed that they are involved in ETM, receptors signaling (PAR-1, c-MET, VEGFR1, VEGFR2, HER2) and Estrogen-dependent gene expression and thus further functional investigations are needed to validate these findings.
It is well-known that miRNA can act as master players at any stage of breast cancer development by targeting multiple mRNAs that are implicated in tumor suppressor or oncogenic signaling pathways [62]. To gain new functional insights into the molecular mechanisms underlying the role of HSPs in BC tumorigenesis, we screened the biological roles of candidate miRNAs involved in HSPs-regulated networks. In these networks, 14 potential miRNAs, clustered within the miRNA network up-regulated in poor prognosis, were identified as candidates’ hub miRNAs (hsa-mir-320b-2, hsa-mir-545, hsa-mir-941-2, hsa-mir-651, hsa-mir-383, hsa-mir-1914, hsa-mir-570, hsa-mir-647, hsa-mir-1227, hsa-mir-593, hsa-mir-300, hsa-mir-643, hsa-mir-626, hsa-mir-1289-1) and, accordingly with the HSP-co-expressed gene functions, the target genes were implicated in the cell cycle. A total of 20 miRNAs, clustered within the miRNA network up-regulated in good prognosis, were identified as possible hub miRNAs (hsa-mir-23a, hsa-mir-143, hsa-mir-185, hsa-mir-196b, hsa-mir-145, hsa-mir-150, hsa-mir-1228, hsa-mir-1910, hsa-mir-450a-1, hsa-mir-548i-1, hsa-mir-1247, hsa-mir-411, hsa-mir-1299, hsa-mir-370, hsa-mir-544a, hsa-mir-1200, hsa-mir-3654, hsa-mir-770, hsa-mir-555, hsa-mir-604), and the target genes were implicated in the negative regulation of transcription, DNA dependent. Several of the identified miRNAs were also differentially expressed in breast cancer than in normal tissues, emphasizing the important role of these miRNAs in breast carcinogenesis and progression, as already reported by several authors [63,64,65,66,67,68,69,70]. We surmise that miRNAs, related to a worse prognosis, may exert their oncogenic functions by silencing breast onco-suppressors, while the miRNAs related to a better prognosis may exert protective roles by silencing breast oncogenes. Further research and validation experiments that explore the clinical and biological roles of selected miRNAs may yield a better understanding of the mechanisms underlying breast cancer growth, metastasis, and survival. However, in this study, for the first time, we showed that the HSPs deregulation in BC affected epigenetic networks involving also microRNAs.
As proteins are considered the molecular effectors, the characterization of HSPs protein expression profiles represents the best chance of better understanding their molecular context-dependent functions. Proteomic data on HSPs expression and prognostic value are in line with the transcriptomic results, although proteomic investigations showed a more complex scenario in which different HSP-proteoforms (probably arising from alternatively spliced RNA transcripts and post-translational modifications (PTM)) can operate within the cancer cells, creating new functional arrangements, difficult to predict on gene expression. Based on IHC analyses, only 5 HSP members (HSPA9, HSP90AA1, TCP1, CCT4 and CCT6A) were significant associated with shorter overall survival, while a higher expression level of HSPA2 was associated with a good prognosis. This stringency in the prognostic value of HSP proteins could partly depend on the expression of multiple proteoforms, probably localized in different subcellular compartments, affecting a variety of intracellular signaling pathways. It is well-known that the HSPs activity is regulated by PTM such as phosphorylation, acetylation, methylation, ubiquitination, glycosylation, S-nitrosylation [71]. Since the addition and reciprocal removal of chemical groups can be triggered very rapidly, PTMs provide an efficient switch to precisely regulate the HSPs functions and activities. For instance, the HSP27 (HSPB1) function is modulated by phosphorylation at different serine residues, catalyzed by the mitogen-activated protein kinase MAPK2 and 3 [72]. Moreover, in clinical cancer tissues, various phosphorylation patterns of HSP27 have been found to associate with the aggressiveness of tumor phenotype [73]. Consequently, it has been proposed that HSP27 phosphorylation isoforms could also represent useful tumor markers, while a more comprehensive analysis of tissue samples will be required. Besides, each HSP is properly localized in a specific cellular compartment(s). For instance, HSP70 and HSP90 can be localized in the cytosol and the nucleus, grp78 (HSPA5) in the endoplasmic reticulum. Whereas, HSP60 (HSPD1) is found in mitochondria [74]. Some HSPs can also be found on the cell surface, such as HSP60 and HSP70, especially in lipid rafts (plasma membrane subdomains, containing high levels of cholesterol and glycosphingolipids) [75]. More recently, HSPs are considered key players in the intercellular cross-talk [76]. They may be secreted through Extracellular Vesicles (EVs), e.g., exosomes, which derive from endosomes and multivesicular bodies. HSP27, HSP60, HSC70, HSP70, and HSP90 were found in the extracellular environment where their role is believed to be immunogenic and may induce either a pro- or anti-inflammatory response. For example, EV containing HSP70 on their surface activates macrophages and natural killer cells. HSPs can be released from cells in free, soluble form, possibly via Golgi. In this form, HSPs circulate via blood throughout the organism and act in an endocrine fashion: [77].

5. Conclusions

Altogether, based on bioinformatics analysis and experimental validation, we provided a reliable integrated analysis of the HSPs expression pattern, prognostic value, and potential regulatory mechanisms in breast cancer. HSPs represent a multitasking protein family exerting multi-level functions within BC cells. HSP network is dynamic within cancer cells whose biochemistry and function depend on cellular and environment milieu. In this intricate scenario, two different HSP-clusters here identified might serve as a potential panel for prognosis evaluation. The usefulness of obtained data should be considered prospectively because, in the era of personalized therapy, the molecular characterization of the two HSP-clusters should be given the possibility to stratify patients with different prognoses. Moreover, several clinical trials are currently investigating the use of HSP-inhibitors or HSP-based vaccines for cancer therapy and immunotherapy. We believe that, rather than a single HSP member, multiple HSPs should be targeted so that they have a better chance of reverting the clinical phenotype. In fact, the simultaneous deregulation of several HSPs in cancer cells could be orchestrating new interactive circuits that define tumor progression. However, further validations are needed to judge their comprehensive prognostic impact in BC.

Supplementary Materials

The following are available online at https://www.mdpi.com/2079-7737/10/3/247/s1, Figure S1: Gene expression analysis of HSP members in 20 different tumors and their corresponding normal tissues. Data were extracted for each HSP gene from ONCOMINE database. The selected thresholds for the analyses were: p-value: 1 × 10⁻⁴; fold change: 2; gene rank: top 10%; data type: mRNA; sample type: clinical specimens. The color depth was determined by the gene rank (top 1%–top 5%–top 10%). The number in the colored box represents the number of analyses meeting these thresholds. The red boxes indicate that the mRNA levels of target genes are higher in tumor tissues than in normal tissues, while blue boxes indicate that the mRNA levels of target genes are lower in tumor tissues than in normal tissues. (A) HSP110, HSP90 and HSP70 members; (B) HSP60 and HSP20 members; (C,D) HSP40 members. Table S1: Prognostic value of individual HSP members evaluated in KM plotter database. For each HSP (identified with an Affimetrix ID) survival outcome was evaluated as Relapse Free Survival (RSF), Distant Metastasis Free Survival (DMFS), and Overall Survival (OS). Patients were divided by the best cut-off vaue. Significant associations with prognosis are underlined in bold. The red color indicates that the higher HSP expression is significantly associated with a poor prognosis. The black color indicates that higher HSP expression is significantly associated with a good prognosis. Figure S2: Survival curves of HSP members significantly associated with poor (A–C) and good (D–F) prognosis. The analysis is shown for RFS (A–D) OS (B–E) and DMFS (C–F) using the Kaplan-Meier Plotter database. Patients were divided into two groups by using the best cut-off of probe expression. Table S2: Lists of positive and negative HSPs co-expressed genes derived by GOBO, UALCAN, and bc-GenExMiner database. Pearson correlation score was considered significant when ≥ 0.4 and ≤ −4. Figure S3. Enrichment pathway analysis of HSPs co-expressed genes significantly correlated with prognosis. Significantly enriched biological pathways were ranked by p-value using the FunRich 3.0 software. (A,B) The top six biological pathways in which the HSPs co-expressed genes up-regulated in poor and good prognosis, derived from UALCAN and bc-GenExMiner, were significantly involved. Figure S4. Construction of HSPs-miRNAs-mRNAs network and KEGG Pathway Enrichment Analysis using miRNet. (A) HSPs co-expressed miRNAs network up-regulated in poor prognosis; (B) HSPs co-expressed miRNAs network up-regulated in good prognosis; (C) HSPs-miRNAs network associated with poor prognosis; (D) HSPs-miRNAs network associated with good prognosis. In each network, yellow circles indicate the enriched genes retrieved by KEGG pathways analysis. The size of circles and squares indicates greater interconnection in the network (hubs miRNAs and genes). The hubs miRNAs involved in the network are listed and the expression of each miRNA in breast cancer tissues and normal controls was retrieved by UALCAN database. The red underlined miRNAs were significantly up-regulated in breast cancer than normal tissues; the black underlined miRNAs were significantly down-regulated in breast cancer than normal tissues. A p-value < 0.01 was regarded as significant. Table S3: List of the HSP proteins identified in the proteomics maps of breast cancer tissues by Maldi-Tof. For each protein the Abbreviated Name, the Uniprot AC, the Mowse Score, the Number of mass values matched, the Number of mass values searched, the % Masses Matched, the % Sequence Coverage, and the experimental MW (Da) and the pI are indicated.

Author Contributions

Conceptualization, P.C., S.F., I.P.-M. and F.G.; methodology, M.B., G.D.C., C.D., F.G., P.C.; software, M.B., G.D.C., C.D., P.C., I.P.-M. and S.F.; validation G.D.C., M.B., C.D., P.C., S.F., I.P.-M. and F.G.; resources, P.C., I.P.-M., and S.F.; writing—original draft preparation, P.C.; writing—review and editing, M.B., G.D.C., C.D., F.G., I.P.-M., S.F. and P.C.; supervision, P.C., S.F., F.G., and I.P.-M.; project administration, P.C.; funding acquisition, P.C., I.P.-M., and S.F. All authors have read and agreed to the published version of the manuscript.

Funding

This work was partially supported by grants from the University of Palermo (FFR-D15-16024 and FFR-D15-006075) to P.C. and S.F., PRIN 2017 (2017T8CMCY_003—Linea A) to P.C. and a State-made contribution (5 × 1000) to COBS as distinguished no-profit research institution.

Institutional Review Board Statement

The study was conducted according to the guidelines of the Declaration of Helsinki, and approved by the Institutional Review Board of La Maddalena Hospital (N/515/2008).

Informed Consent Statement

Informed consent was obtained from all subjects involved in the study when enrolled.

Data Availability Statement

Not applicable.

Acknowledgments

Authors thank the Medical Staff and Vito Balsamo at La Maddalena Hospital for their excellent cooperation.

Conflicts of Interest

The authors declare no conflict of interest.

References

  1. Bray, F.; Ferlay, J.; Soerjomataram, I.; Siegel, R.L.; Torre, L.A.; Jemal, A. Global cancer statistics 2018: GLOBOCAN estimates of incidence and mortality worldwide for 36 cancers in 185 countries. CA Cancer J. Clin. 2018, 68, 394–424. [Google Scholar] [CrossRef] [Green Version]
  2. Byler, S.; Goldgar, S.; Heerboth, S.; Leary, M.; Housman, G.; Moulton, K.; Sarkar, S. Genetic and epigenetic aspects of breast cancer progression and therapy. Anticancer Res. 2014, 34, 1071–1077. [Google Scholar]
  3. Testa, U.; Castelli, G.; Pelosi, E. Breast Cancer: A molecularly heterogenous disease needing subtype-specific treatments. Med. Sci. 2020, 8, 18. [Google Scholar] [CrossRef] [PubMed] [Green Version]
  4. Rivenbark, A.G.; O’Connor, S.M.; Coleman, W.B. Molecular and cellular heterogeneity in breast cancer: Challenges for personalized medicine. Am. J. Pathol. 2013, 183, 1113–1124. [Google Scholar] [CrossRef] [Green Version]
  5. Gong, G.; Kwon, M.J.; Han, J.; Lee, H.J.; Lee, S.K.; Lee, J.E.; Lee, S.H.; Park, S.; Choi, J.S.; Cho, S.Y.; et al. A new molecular prognostic score for predicting the risk of distant metastasis in patients with HR+/HER2- early breast cancer. Sci. Rep. 2017, 7, 45554. [Google Scholar] [CrossRef] [Green Version]
  6. Park, S.; Koo, J.S.; Kim, M.S.; Park, H.S.; Lee, J.S.; Lee, J.S.; Kim, S.I.; Park, B.W. Characteristics and outcomes according to molecular subtypes of breast cancer as classified by a panel of four biomarkers using immunohistochemistry. Breast 2012, 21, 50–57. [Google Scholar] [CrossRef]
  7. Lindquist, S.; Craig, E.A. The heat-shock proteins. Annu. Rev. Genet. 1988, 22, 631–677. [Google Scholar] [CrossRef]
  8. Ritossa, F. A new puffing pattern induced by temperature shock and DNP in drosophila. Experientia 1962, 18, 571–573. [Google Scholar] [CrossRef]
  9. Kampinga, H.H.; Hageman, J.; Vos, M.J.; Kubota, H.; Tanguay, R.M.; Bruford, E.A.; Cheetham, M.E.; Chen, B.; Hightower, L.E. Guidelines for the nomenclature of the human heat shock proteins. Cell Stress Chaperones 2009, 14, 105–111. [Google Scholar] [CrossRef] [Green Version]
  10. Huang, Y.H.; Yeh, C.T. Functional compartmentalization of HSP60-survivin interaction between mitochondria and cytosol in cancer cells. Cells 2019, 9, 23. [Google Scholar] [CrossRef] [PubMed] [Green Version]
  11. Kabani, M.; Martineau, C.N. Multiple hsp70 isoforms in the eukaryotic cytosol: Mere redundancy or functional specificity? Curr. Genom. 2008, 9, 338–348. [Google Scholar] [CrossRef] [PubMed] [Green Version]
  12. Stephanou, A.; Latchman, D.S. Transcriptional modulation of heat-shock protein gene expression. Biochem. Res. Int. 2011, 2011, 238601. [Google Scholar] [CrossRef] [PubMed] [Green Version]
  13. Ciocca, D.R.; Calderwood, S.K. Heat shock proteins in cancer: Diagnostic, prognostic, predictive, and treatment implications. Cell Stress Chaperones 2005, 10, 86–103. [Google Scholar] [CrossRef]
  14. Hoter, A.; Rizk, S.; Naim, H.Y. The multiple roles and therapeutic potential of molecular chaperones in prostate cancer. Cancers 2019, 11, 1194. [Google Scholar] [CrossRef] [Green Version]
  15. Yun, C.W.; Kim, H.J.; Lim, J.H.; Lee, S.H. Heat shock proteins: Agents of cancer development and therapeutic targets in anti-cancer therapy. Cells 2019, 9, 60. [Google Scholar] [CrossRef] [PubMed] [Green Version]
  16. Walsh, D.; Grantham, J.; Zhu, X.O.; Wei Lin, J.; van Oosterum, M.; Taylor, R.; Edwards, M. The role of heat shock proteins in mammalian differentiation and development. Environ. Med. Annu. Rep. Res. Inst. Environ. Med. Nagoya Univ. 1999, 43, 79–87. [Google Scholar]
  17. Voellmy, R. Transduction of the stress signal and mechanisms of transcriptional regulation of heat shock/stress protein gene expression in higher eukaryotes. Crit. Rev. Eukaryot. Gene Expr. 1994, 4, 357–401. [Google Scholar]
  18. Joly, A.L.; Wettstein, G.; Mignot, G.; Ghiringhelli, F.; Garrido, C. Dual role of heat shock proteins as regulators of apoptosis and innate immunity. J. Innate Immun. 2010, 2, 238–247. [Google Scholar] [CrossRef]
  19. Chandrashekar, D.S.; Bashel, B.; Balasubramanya, S.A.H.; Creighton, C.J.; Ponce-Rodriguez, I.; Chakravarthi, B.; Varambally, S. UALCAN: A portal for facilitating tumor subgroup gene expression and survival analyses. Neoplasia 2017, 19, 649–658. [Google Scholar] [CrossRef]
  20. Cerami, E.; Gao, J.; Dogrusoz, U.; Gross, B.E.; Sumer, S.O.; Aksoy, B.A.; Jacobsen, A.; Byrne, C.J.; Heuer, M.L.; Larsson, E.; et al. The cBio cancer genomics portal: An open platform for exploring multidimensional cancer genomics data. Cancer Discov. 2012, 2, 401–404. [Google Scholar] [CrossRef] [Green Version]
  21. Lanczky, A.; Nagy, A.; Bottai, G.; Munkacsy, G.; Szabo, A.; Santarpia, L.; Gyorffy, B. miRpower: A web-tool to validate survival-associated miRNAs utilizing expression data from 2178 breast cancer patients. Breast Cancer Res. Treat. 2016, 160, 439–446. [Google Scholar] [CrossRef]
  22. Uhlen, M.; Zhang, C.; Lee, S.; Sjostedt, E.; Fagerberg, L.; Bidkhori, G.; Benfeitas, R.; Arif, M.; Liu, Z.; Edfors, F.; et al. A pathology atlas of the human cancer transcriptome. Science 2017, 357, 2507. [Google Scholar] [CrossRef] [Green Version]
  23. Jezequel, P.; Campone, M.; Gouraud, W.; Guerin-Charbonnel, C.; Leux, C.; Ricolleau, G.; Campion, L. bc-GenExMiner: An easy-to-use online platform for gene prognostic analyses in breast cancer. Breast Cancer Res. Treat. 2012, 131, 765–775. [Google Scholar] [CrossRef]
  24. Ringner, M.; Fredlund, E.; Hakkinen, J.; Borg, A.; Staaf, J. GOBO: Gene expression-based outcome for breast cancer online. PLoS ONE 2011, 6, e17911. [Google Scholar] [CrossRef] [PubMed]
  25. Pathan, M.; Keerthikumar, S.; Chisanga, D.; Alessandro, R.; Ang, C.S.; Askenase, P.; Batagov, A.O.; Benito-Martin, A.; Camussi, G.; Clayton, A.; et al. A novel community driven software for functional enrichment analysis of extracellular vesicles data. J. Extracell. Vesicles 2017, 6, 1321455. [Google Scholar] [CrossRef] [Green Version]
  26. Szklarczyk, D.; Franceschini, A.; Wyder, S.; Forslund, K.; Heller, D.; Huerta-Cepas, J.; Simonovic, M.; Roth, A.; Santos, A.; Tsafou, K.P.; et al. STRING v10: Protein-protein interaction networks, integrated over the tree of life. Nucleic Acids Res. 2015, 43, D447–D452. [Google Scholar] [CrossRef]
  27. Chang, L.; Zhou, G.; Soufan, O.; Xia, J. miRNet 2.0: Network-based visual analytics for miRNA functional analysis and systems biology. Nucleic Acids Res. 2020, 48, W244–W251. [Google Scholar] [CrossRef]
  28. Cancemi, P.; Buttacavoli, M.; Roz, E.; Feo, S. Expression of alpha-enolase (ENO1), myc promoter-binding protein-1 (MBP-1) and matrix metalloproteinases (MMP-2 and MMP-9) reflect the nature and aggressiveness of breast tumors. Int. J. Mol. Sci. 2019, 20, 3952. [Google Scholar] [CrossRef] [Green Version]
  29. Di Cara, G.; Marabeti, M.R.; Musso, R.; Riili, I.; Cancemi, P.; Pucci Minafra, I. New Insights into the occurrence of matrix metalloproteases -2 and -9 in a cohort of breast cancer patients and proteomic correlations. Cells 2018, 7, 89. [Google Scholar] [CrossRef] [PubMed] [Green Version]
  30. Cancemi, P.; Buttacavoli, M.; Di Cara, G.; Albanese, N.N.; Bivona, S.; Pucci-Minafra, I.; Feo, S. A multiomics analysis of S100 protein family in breast cancer. Oncotarget 2018, 9, 29064–29081. [Google Scholar] [CrossRef] [PubMed] [Green Version]
  31. Pucci-Minafra, I.; Di Cara, G.; Musso, R.; Cancemi, P.; Albanese, N.N.; Roz, E.; Minafra, S. Retrospective proteomic screening of 100 breast cancer tissues. Proteomes 2017, 5, 15. [Google Scholar] [CrossRef] [Green Version]
  32. Cancemi, P.; Di Cara, G.; Albanese, N.N.; Costantini, F.; Marabeti, M.R.; Musso, R.; Riili, I.; Lupo, C.; Roz, E.; Pucci-Minafra, I. Differential occurrence of S100A7 in breast cancer tissues: A proteomic-based investigation. Proteom. Clin. Appl. 2012, 6, 364–373. [Google Scholar] [CrossRef] [Green Version]
  33. Cancemi, P.; Di Cara, G.; Albanese, N.N.; Costantini, F.; Marabeti, M.R.; Musso, R.; Lupo, C.; Roz, E.; Pucci-Minafra, I. Large-scale proteomic identification of S100 proteins in breast cancer tissues. BMC Cancer 2010, 10, 476. [Google Scholar] [CrossRef] [Green Version]
  34. Buttacavoli, M.; Albanese, N.N.; Roz, E.; Pucci-Minafra, I.; Feo, S.; Cancemi, P. Proteomic profiling of colon cancer tissues: Discovery of new candidate biomarkers. Int. J. Mol. Sci. 2020, 21, 3096. [Google Scholar] [CrossRef]
  35. Coppola, A.; Cancemi, P.; Tomasello, L.; Guarnotta, V.; Pitrone, M.; Failla, V.; Cillino, S.; Feo, S.; Pizzolanti, G.; Giordano, C. Anti-inflammatory action of heterogeneous nuclear ribonucleoprotein A2/B1 in patients with autoimmune endocrine disorders. J. Clin. Med. 2019, 9, 9. [Google Scholar] [CrossRef] [PubMed] [Green Version]
  36. DiCara, G.; Marengo, G.; Albanese, N.N.; Marabeti, M.R.; Musso, R.; Cancemi, P.; Pucci-Minafra, I. Proteomic profiling of Trastuzumab (Herceptin(R))-sensitive and -resistant SKBR-3 breast cancer cells. Anticancer Res. 2013, 33, 489–503. [Google Scholar]
  37. Musso, R.; Di Cara, G.; Albanese, N.N.; Marabeti, M.R.; Cancemi, P.; Martini, D.; Orsini, E.; Giordano, C.; Pucci-Minafra, I. Differential proteomic and phenotypic behaviour of papillary and anaplastic thyroid cell lines. J. Proteom. 2013, 90, 115–125. [Google Scholar] [CrossRef]
  38. Coppola, A.; Tomasello, L.; Pizzolanti, G.; Pucci-Minafra, I.; Albanese, N.; Di Cara, G.; Cancemi, P.; Pitrone, M.; Bommarito, A.; Carissimi, E.; et al. In vitro phenotypic, genomic and proteomic characterization of a cytokine-resistant murine beta-TC3 cell line. PLoS ONE 2012, 7, e32109. [Google Scholar] [CrossRef] [Green Version]
  39. Minafra, L.; Di Cara, G.; Albanese, N.N.; Cancemi, P. Proteomic differentiation pattern in the U937 cell line. Leuk. Res. 2011, 35, 226–236. [Google Scholar] [CrossRef]
  40. Cancemi, P.; Albanese, N.N.; DiCara, G.; Marabeti, M.R.; Costantini, F.; Minafra, S.; Pucci-Minafra, I. Multiple changes induced by fibroblasts on breast cancer cells. Connect. Tissue Res. 2010, 51, 88–104. [Google Scholar] [CrossRef] [Green Version]
  41. Pucci-Minafra, I.; Albanese, N.N.; Di Cara, G.; Minafra, L.; Marabeti, M.R.; Cancemi, P. Breast cancer cells exhibit selective modulation induced by different collagen substrates. Connect. Tissue Res. 2008, 49, 252–256. [Google Scholar] [CrossRef]
  42. Pucci-Minafra, I.; Cancemi, P.; Di Cara, G.; Minafra, L.; Feo, S.; Forlino, A.; Tira, M.E.; Tenni, R.; Martini, D.; Ruggeri, A.; et al. Decorin transfection induces proteomic and phenotypic modulation in breast cancer cells 8701-BC. Connect. Tissue Res. 2008, 49, 30–41. [Google Scholar] [CrossRef] [Green Version]
  43. Pucci-Minafra, I.; Cancemi, P.; Albanese, N.N.; Di Cara, G.; Marabeti, M.R.; Marrazzo, A.; Minafra, S. New protein clustering of breast cancer tissue proteomics using actin content as a cellularity indicator. J. Proteome Res. 2008, 7, 1412–1418. [Google Scholar] [CrossRef] [PubMed] [Green Version]
  44. Das, J.K.; Xiong, X.; Ren, X.; Yang, J.M.; Song, J. Heat shock proteins in cancer immunotherapy. J. Oncol. 2019, 2019, 3267207. [Google Scholar] [CrossRef] [Green Version]
  45. Yu, Z.; Zhi, J.; Peng, X.; Zhong, X.; Xu, A. Clinical significance of HSP27 expression in colorectal cancer. Mol. Med. Rep. 2010, 3, 953–958. [Google Scholar] [CrossRef] [PubMed]
  46. Fucarino, A.; Pitruzzella, A. Role of HSP60/HSP10 in Lung Cancer: Simple Biomarkers or Leading Actors? J. Oncol. 2020, 2020, 4701868. [Google Scholar] [CrossRef] [PubMed]
  47. Merendino, A.M.; Bucchieri, F.; Campanella, C.; Marciano, V.; Ribbene, A.; David, S.; Zummo, G.; Burgio, G.; Corona, D.F.; Conway de Macario, E.; et al. Hsp60 is actively secreted by human tumor cells. PLoS ONE 2010, 5, e9247. [Google Scholar] [CrossRef] [Green Version]
  48. Shan, N.; Zhou, W.; Zhang, S.; Zhang, Y. Identification of HSPA8 as a candidate biomarker for endometrial carcinoma by using iTRAQ-based proteomic analysis. Oncotargets Ther. 2016, 9, 2169–2179. [Google Scholar] [CrossRef] [Green Version]
  49. Seigneuric, R.; Mjahed, H.; Gobbo, J.; Joly, A.L.; Berthenet, K.; Shirley, S.; Garrido, C. Heat shock proteins as danger signals for cancer detection. Front. Oncol. 2011, 1, 37. [Google Scholar] [CrossRef] [PubMed] [Green Version]
  50. Zoppino, F.C.M.; Guerrero-Gimenez, M.E.; Castro, G.N.; Ciocca, D.R. Comprehensive transcriptomic analysis of heat shock proteins in the molecular subtypes of human breast cancer. BMC Cancer 2018, 18, 700. [Google Scholar] [CrossRef] [Green Version]
  51. Klimczak, M.; Biecek, P.; Zylicz, A.; Zylicz, M. Heat shock proteins create a signature to predict the clinical outcome in breast cancer. Sci. Rep. 2019, 9, 7507. [Google Scholar] [CrossRef] [Green Version]
  52. Acun, T.; Senses, K.M. Downregulation of DNAJC10 (ERDJ5) is associated with poor survival in breast cancer. Breast Cancer 2020, 27, 483–489. [Google Scholar] [CrossRef]
  53. Zhang, Y.; Chou, S.D.; Murshid, A.; Prince, T.L.; Schreiner, S.; Stevenson, M.A.; Calderwood, S.K. The role of heat shock factors in stress-induced transcription. Methods Mol. Biol. 2011, 787, 21–32. [Google Scholar] [CrossRef] [PubMed] [Green Version]
  54. Orr, B.; Godek, K.M.; Compton, D. Aneuploidy. Curr. Biol. CB 2015, 25, R538–R542. [Google Scholar] [CrossRef] [Green Version]
  55. Donnelly, N.; Storchova, Z. Causes and consequences of protein folding stress in aneuploid cells. Cell Cycle 2015, 14, 495–501. [Google Scholar] [CrossRef] [PubMed] [Green Version]
  56. Zhu, J.; Tsai, H.J.; Gordon, M.R.; Li, R. Cellular stress associated with aneuploidy. Dev. Cell 2018, 44, 420–431. [Google Scholar] [CrossRef] [Green Version]
  57. Showalter, A.E.; Martini, A.C.; Nierenberg, D.; Hosang, K.; Fahmi, N.A.; Gopalan, P.; Khaled, A.S.; Zhang, W.; Khaled, A.R. Investigating chaperonin-containing TCP-1 subunit 2 as an essential component of the chaperonin complex for tumorigenesis. Sci. Rep. 2020, 10, 798. [Google Scholar] [CrossRef]
  58. Lopez, T.; Dalton, K.; Frydman, J. The mechanism and function of group II chaperonins. J. Mol. Biol. 2015, 427, 2919–2930. [Google Scholar] [CrossRef] [Green Version]
  59. Roh, S.H.; Kasembeli, M.; Bakthavatsalam, D.; Chiu, W.; Tweardy, D.J. Contribution of the type II chaperonin, TRiC/CCT, to oncogenesis. Int. J. Mol. Sci. 2015, 16, 26706–26720. [Google Scholar] [CrossRef] [PubMed] [Green Version]
  60. Mitra, A.; Shevde, L.A.; Samant, R.S. Multi-faceted role of HSP40 in cancer. Clin. Exp. Metastasis 2009, 26, 559–567. [Google Scholar] [CrossRef]
  61. Acun, T.; Doberstein, N.; Habermann, J.K.; Gemoll, T.; Thorns, C.; Oztas, E.; Ried, T. HLJ1 (DNAJB4) gene is a novel biomarker candidate in breast cancer. Omics J. Integr. Biol. 2017, 21, 257–265. [Google Scholar] [CrossRef] [Green Version]
  62. Peng, Y.; Croce, C.M. The role of MicroRNAs in human cancer. Signal. Transduct. Target. Ther. 2016, 1, 15004. [Google Scholar] [CrossRef] [PubMed] [Green Version]
  63. Lieb, V.; Weigelt, K.; Scheinost, L.; Fischer, K.; Greither, T.; Marcou, M.; Theil, G.; Klocker, H.; Holzhausen, H.J.; Lai, X.; et al. Serum levels of miR-320 family members are associated with clinical parameters and diagnosis in prostate cancer patients. Oncotarget 2018, 9, 10402–10416. [Google Scholar] [CrossRef] [Green Version]
  64. Jia, X.; Liu, X.; Li, M.; Zeng, Y.; Feng, Z.; Su, X.; Huang, Y.; Chen, M.; Yang, X. Potential tumor suppressing role of microRNA-545 in epithelial ovarian cancer. Oncol. Lett. 2018, 15, 6386–6392. [Google Scholar] [CrossRef] [Green Version]
  65. Surapaneni, S.K.; Bhat, Z.R.; Tikoo, K. MicroRNA-941 regulates the proliferation of breast cancer cells by altering histone H3 Ser 10 phosphorylation. Sci. Rep. 2020, 10, 17954. [Google Scholar] [CrossRef] [PubMed]
  66. Chang, J.T.; Wang, F.; Chapin, W.; Huang, R.S. Identification of microRNAs as breast cancer prognosis markers through the cancer genome atlas. PLoS ONE 2016, 11, e0168284. [Google Scholar] [CrossRef] [PubMed] [Green Version]
  67. Tokumaru, Y.; Asaoka, M.; Oshi, M.; Katsuta, E.; Yan, L.; Narayanan, S.; Sugito, N.; Matsuhashi, N.; Futamura, M.; Akao, Y.; et al. High expression of microRNA-143 is associated with favorable tumor immune microenvironment and better survival in estrogen receptor positive breast cancer. Int. J. Mol. Sci. 2020, 21, 3213. [Google Scholar] [CrossRef] [PubMed]
  68. Imam, J.S.; Buddavarapu, K.; Lee-Chang, J.S.; Ganapathy, S.; Camosy, C.; Chen, Y.; Rao, M.K. MicroRNA-185 suppresses tumor growth and progression by targeting the Six1 oncogene in human cancers. Oncogene 2010, 29, 4971–4979. [Google Scholar] [CrossRef] [PubMed] [Green Version]
  69. Tahiri, A.; Leivonen, S.K.; Luders, T.; Steinfeld, I.; Ragle Aure, M.; Geisler, J.; Makela, R.; Nord, S.; Riis, M.L.; Yakhini, Z.; et al. Deregulation of cancer-related miRNAs is a common event in both benign and malignant human breast tumors. Carcinogenesis 2014, 35, 76–85. [Google Scholar] [CrossRef]
  70. Huang, S.; Chen, Y.; Wu, W.; Ouyang, N.; Chen, J.; Li, H.; Liu, X.; Su, F.; Lin, L.; Yao, Y. miR-150 promotes human breast cancer growth and malignant behavior by targeting the pro-apoptotic purinergic P2X7 receptor. PLoS ONE 2013, 8, e80707. [Google Scholar] [CrossRef]
  71. Cloutier, P.; Coulombe, B. Regulation of molecular chaperones through post-translational modifications: Decrypting the chaperone code. Biochim. Biophys. Acta 2013, 1829, 443–454. [Google Scholar] [CrossRef] [Green Version]
  72. Choi, S.K.; Kam, H.; Kim, K.Y.; Park, S.I.; Lee, Y.S. Targeting heat shock protein 27 in cancer: A druggable target for cancer treatment? Cancers 2019, 11, 1195. [Google Scholar] [CrossRef] [Green Version]
  73. Zhang, D.; Wong, L.L.; Koay, E.S. Phosphorylation of Ser78 of Hsp27 correlated with HER-2/neu status and lymph node positivity in breast cancer. Mol. Cancer 2007, 6, 52. [Google Scholar] [CrossRef] [Green Version]
  74. Chatterjee, S.; Burns, T.F. Targeting heat shock proteins in cancer: A promising therapeutic approach. Int. J. Mol. Sci. 2017, 18, 1978. [Google Scholar] [CrossRef] [PubMed] [Green Version]
  75. Shevtsov, M.; Balogi, Z.; Khachatryan, W.; Gao, H.; Vigh, L.; Multhoff, G. Membrane-associated heat shock proteins in oncology: From basic research to new theranostic targets. Cells 2020, 9, 1263. [Google Scholar] [CrossRef]
  76. Santos, T.G.; Martins, V.R.; Hajj, G.N.M. Unconventional secretion of heat shock proteins in cancer. Int. J. Mol. Sci. 2017, 18, 946. [Google Scholar] [CrossRef] [PubMed] [Green Version]
  77. Rappa, F.; Farina, F.; Zummo, G.; David, S.; Campanella, C.; Carini, F.; Tomasello, G.; Damiani, P.; Cappello, F.; Macario-Conway, D.E.M.; et al. HSP-molecular chaperones in cancer biogenesis and tumor therapy: An overview. Anticancer Res. 2012, 32, 5139–5150. [Google Scholar] [PubMed]
Figure 1. Gene expression analysis of HSP members between normal and breast cancer samples analyzed by UALCAN database. (A) Box plots of HSP genes up-regulated in BC compared to normal tissues. (B) Box plots of HSP genes down-regulated in BC compared to normal tissues. p < 0.01 was considered significant.
Biology 10 00247 g001aBiology 10 00247 g001b
Figure 2. Analysis of genetic alterations in HSP members differentially expressed in BC. The percentage of alterations in HSP genes was extracted by using the OncoPrint tool of cBioPortal containing sequencing data of 2509 patients. Red and blue represent amplification, and deep deletion, respectively, green and grey represent missense and truncating mutations. Asterisk * indicates the corresponding HSP members showing a percentage of alteration higher than 3%. Histograms showing the percentage of genetic alterations of HSP genes up-regulated (A), and down-regulated (B) in BC.
Biology 10 00247 g002
Figure 3. Analysis of promoter methylation status in HSP members differentially expressed in BC. For each HSP member the levels of promoter methylation between normal and breast cancer were retrieved from UALCAN database. Beta value cut-off indicates hyper-methylation [beta value: 0.7–0.5] or hypo-methylation [beta-value: 0.3–0.25]. HSP members with hyper-methylated promoters are marked in green; HSP members with hypo-methylated promoters are marked in black. Box plots showing the promoter methylation status between normal and breast primary tumors in HSPs up-regulated (A) and down-regulated in BC (B). p < 0.01 was considered significant.
Biology 10 00247 g003
Figure 4. Survival curves of HSP members significantly associated with prognosis. The analysis is shown for Relapse Free Survival (RFS) Overall Survival (OS) and Distant Metastasis Free Survival (DMFS) using the Kaplan-Meier Plotter database. Patients were divided into two groups by using the best cut-off of probe expression. Survival curves of HSP-cluster associated with poor (A) and good (B) prognosis.
Biology 10 00247 g004
Figure 5. Enrichment pathway analysis of HSPs co-expressed genes significantly correlated with prognosis. Significantly enriched biological pathways were ranked by p-value using the FunRich 3.0 software. (A,B) The top six biological pathways in which the HSPs co-expressed genes up-regulated in poor and good prognosis, derived from GOBO, were significantly involved. (C,D) Venn diagrams of overlapping HSPs co-expressed genes up-regulated in poor and good prognosis, derived from GOBO, UALCAN, and bc-GenExMiner. (E,F) Protein-protein interaction network of the common HSPs co-expressed genes derived from the three cross-platforms GOBO, UALCAN and bc-GenExMiner using STRING database. The network was performed with medium confidence (combined score > 0.4) and disconnected nodes were deleted.
Biology 10 00247 g005
Figure 6. Proteomic expression of HSP members and prognostic significance. (A) Survival analysis of HSPs protein expression evaluated by immunohistochemistry (IHC) staining, using The Human Protein Atlas (HPA) database. The database was queried for each HSP member, and only significant analyses were reported; (B) Representative proteomic map of a breast cancer tissue. The 2-D separation was performed on IPG gel strips (18 cm, 3.0–10 NL) followed by the SDS-PAGE on a vertical linear-gradient slab gel (9–16%T). HSP protein members identified by Maldi-Tof spectrometry are marked with the Gene name. When present, different isoforms of the same protein were jointly labeled; (C) Quantitative analysis of HSP proteins, given as box-plot graph, in breast cancer tissues. Quantification was deduced by the 2D gels, analyzed by Image-Master software. In the ordinate are the values of N%V; (D) Representative IHC images for individual HSP proteins (HSPB1, HSPD1, and HSPA8) in breast cancer tissues showing weak, moderate and strong staining, respectively retrieved by the HPA database. The antibody immune reactivity was observed in several cell compartments, such as cytoplasm, plasma membrane as well as in nucleus.
Biology 10 00247 g006
Table 1. List of 95 HSP family members classified into 6 sub-families according to their molecular weight (HSP110, HSP90, HSP70, HSP60, HSP40 and HSP20). For each HSP, the Gene name, Chromosomic localization, Affimetrix ID probe, Protein name, Uniprot database access number, Abbreviated protein name and Theoretical molecular weight, are reported.
HSP FamilyGene Name Chromosomic LocalizationAffimetrix IDProtein Name Uniprot Access (Abbreviated Name)Molecular Weigth (Da)
HSP110 (HSPH)HSPH113q12.3235573_atHeat shock 105 kDa/110 kDa protein 1Q92598 (HS105)96,865
HYOU111q23.3200825_s_atHypoxia up-regulated protein 1Q9Y4L1 (HYOU1)111,335
HSP90 (HSPC)HSP90AA114q32.31214328_s_atHeat shock protein HSP 90-alphaP07900 (HS90A)84,660
HSP90AB16Q21,1200064_atHeat shock protein HSP 90-betaP08238 (HS90B)83,264
HSP90B112q23.3200599_s_atEndoplasminP14625 (ENPL)92,469
TRAP116P13.3201391_atHeat shock protein 75 kDa, mitochondrialQ12931 (TRAP1)80,110
HSP70 (HSPA)HSPA1A6p21.33200799_atHeat shock 70 kDa protein 1AP0DMV8 (HS71A)70,052
HSPA1B6p21.33202581_atHeat shock 70 kDa protein 1BP0DMV9 (HS71B)70,052
HSPA1L6p21.33210189_atHeat shock 70 kDa protein 1-likeP34931 (HS71L)70,375
HSPA214q23.3211538_s_atHeat shock-related 70 kDa protein 2P54652 (HSP72)70,021
HSPA45q31.1208815_x_atHeat shock 70 kDa protein 4P34932 (HSP74)94,331
HSPA4L4q28205543_atHeat shock 70 kDa protein 4LO95757 (HS74L)94,512
HSPA59q33.3230031_atEndoplasmic reticulum chaperone BiPP11021 (BIP)72,333
HSPA61q23.3117_at Heat shock 70 kDa protein 6P17066 (HSP76)71,028
HSPA71q23.3-Putative heat shock 70 kDa protein 7P48741 (HSP77)40,244
HSPA811q24.1221891_x_atHeat shock cognate 71 kDa proteinP11142 (HSP7C)70,898
HSPA95q31.1200690_atStress-70 protein, mitochondrialP38646 (GRP75)73,680
HSPA12A10q25.3214434_atHeat shock 70 kDa protein 12AO43301 (HS12A)74,978
HSPA12B20p13229172_atHeat shock 70 kDa protein 12BQ96MM6 (HS12B)75,688
HSPA1321q11.2202557_atHeat shock 70 kDa protein 13P48723 (HSP13)51,927
HSPA1410p13226887_atHeat shock 70 kDa protein 14Q0VDF9 (HSP7E)54,794
HSP60 (Chaperonins)BBS1012q21.2219487_atBardet-Biedl syndrome 10 proteinQ8TAM1 (BBS10)80,838
BBS124q27229603_atBardet-Biedl syndrome 12 proteinQ6ZW61 (BBS12)79,085
TCP16q25.3222010_atT-complex protein 1 subunit alphaP17987 (TCPA)60,344
CCT212q15201947_s_atT-complex protein 1 subunit betaP78371 (TCPB)57,488
CCT31q23200910_atT-complex protein 1 subunit gammaP49368 (TCPG)60,534
CCT42p15200877_atT-complex protein 1 subunit deltaP50991 (TCPD)57,924
CCT55p15.2229068_atT-complex protein 1 subunit epsilonP48643 (TCPE)59,671
CCT6A7p11.2201326_atT-complex protein 1 subunit zetaP40227 (TCPZ)58,024
CCT6B17q12206587_atT-complex protein 1 subunit zeta-2Q92526 (TCPW)57,821
CCT72p13.2200812_atT-complex protein 1 subunit etaQ99832 (TCPH)59,367
CCT821q22.11200873_s_atT-complex protein 1 subunit thetaP50990 (TCPQ)59,621
HSPD12q33.1200807_s_at60 kDa heat shock protein, mitochondrialP10809 (CH60)61,055
HSPE12q33.1205133_s_at10 kDa heat shock protein, mitochondrialP61604 (CH10)10,932
MKKS20p12218138_atMcKusick-Kaufman/Bardet-Biedl syndromes putative chaperoninQ9NPJ1 (MKKS)62,342
HSP40 (DNAJ)DNAJA19p21.1 200881_s_atDnaJ homolog subfamily A member 1P31689 (DNJA1)44,868
DNAJA216q12.1226994_atDnaJ homolog subfamily A member 2O60884 (DNJA2)45,746
DNAJA316p13.3205963_s_atDnaJ homolog subfamily A member 3, mitochondrialQ96EY1 (DNJA3)52,489
DNAJA415q25.1225061_atDnaJ homolog subfamily A member 4Q8WW22 (DNJA4)44,798
DNAJB119p13.2200666_s_atDnaJ homolog subfamily B member 1P25685 (DNJB1)38,044
DNAJB22q35202500_atDnaJ homolog subfamily B member 2P25686 (DNJB2)35,580
DNAJB32q37.1-DnaJ homolog subfamily B member 3Q8WWF6 (DNJB3)16,559
DNAJB41p31.1203810_atDnaJ homolog subfamily B member 4Q9UDY4 (DNJB4)37,807
DNAJB59p13.1212817_atDnaJ homolog subfamily B member 5O75953 (DNJB5)39,133
DNAJB67q36.3209015_s_atDnaJ homolog subfamily B member 6O75190 (DNJB6)36,087
DNAJB722q13.21552675_atDnaJ homolog subfamily B member 7Q7Z6W7 (DNJB7)35,434
DNAJB83q21.3237284_atDnaJ homolog subfamily B member 8Q8NHS0 (DNJB8)25,686
DNAJB97q31.1202843_atDnaJ homolog subfamily B member 9Q9UBS3 (DNJB9)25,518
DNAJB113q27.3223054_atDnaJ homolog subfamily B member 11Q9UBS4 (DJB11)40,514
DNAJB1210q22.1202866_atDnaJ homolog subfamily B member 12Q9NXW2 (DJB12)41,860
DNAJB1311q13.4230936_atDnaJ homolog subfamily B member 13P59910 (DJB13)36,118
DNAJB144q23226399_atDnaJ homolog subfamily B member 14Q8TBM8 (DJB14)42,516
DNAJC110p12.31218409_atDnaJ homolog subfamily C member 1Q96KC8 (DNJC1)63,883
DNAJC27q22.1213097_s_atDnaJ homolog subfamily C member 2Q99543 (DNJC2)71,996
DNAJC313q32.1225284_atDnaJ homolog subfamily C member 3Q13217 (DNJC3)57,580
DNAJC411q13.1228622_s_atDnaJ homolog subfamily C member 4Q9NNZ3 (DNJC4)27,593
DNAJC520q13.33224611_s_atDnaJ homolog subfamily C member 5Q9H3Z4 (DNJC5)22,149
DNAJC5B8q13.1232798_atDnaJ homolog subfamily C member 5BQ9UF47 (DNJ5B)22,496
DNAJC5G2p23.31552450_a_atDnaJ homolog subfamily C member 5GQ8N7S2 (DNJ5G)21,433
DNAJC61p31.3204721_s_atPutative tyrosine-protein phosphatase auxilinO75061 (AUXI)99,997
DNAJC717q21.2202416_atDnaJ homolog subfamily C member 7Q99615 (DNJC7)56,441
DNAJC81p35.3212490_atDnaJ homolog subfamily C member 8O75937 (DNJC8)29,842
DNAJC910q22.2213088_s_atDnaJ homolog subfamily C member 9Q8WXX5 (DNJC9)29,910
DNAJC102q32.1229588_atDnaJ homolog subfamily C member 10Q8IXB1 (DJC10)91,080
DNAJC111p36.31215792_s_atDnaJ homolog subfamily C member 11Q9NVH1 (DJC11)63,278
DNAJC1210q21.3223722_atDnaJ homolog subfamily C member 12Q9UKB3 (DJC12)23,415
DNAJC133q22.1212467_atDnaJ homolog subfamily C member 13O75165 (DJC13)254,415
DNAJC1412q13.2223420_atDnaJ homolog subfamily C member 14Q6Y2X3 (DJC14)78,569
DNAJC1513q14.11227808_atDnaJ homolog subfamily C member 15Q9Y5T4 (DJC15)16,383
DNAJC161p36.21212911_atDnaJ homolog subfamily C member 16Q9Y2G8 (DJC16)90,591
DNAJC1715q15.1219861_atDnaJ homolog subfamily C member 17Q9NVM6 (DJC17)34,687
DNAJC185q31.2238115_atDnaJ homolog subfamily C member 18Q9H819 (DJC18)41,551
DNAJC193q26.33225358_atMitochondrial import inner membrane translocase subunit TIM14Q96DA6 (TIM14)12,499
HSCB22q12.1223647_x_atIron-sulfur cluster co-chaperone protein HscBQ8IWL3 (HSC20)27,422
DNAJC215p13.1230893_atDnaJ homolog subfamily C member 21Q5F1R6 (DJC21)62,028
DNAJC2212q13.12220441_atDnaJ homolog subfamily C member 22Q8N4W6 (DJC22)38,086
SEC636q21229969_atTranslocation protein SEC63 homologQ9UGP8 (SEC63)87,997
DNAJC2411p13213853_atDnaJ homolog subfamily C member 24Q6P3W2 (DJC24)17,139
DNAJC259q31.3226859_atDnaJ homolog subfamily C member 25Q9H1X3 (DJC25)42,404
GAK4p16.340225_atCyclin-G-associated kinaseO14976 (GAK)143,191
DNAJC272p23.3227859_atDnaJ homolog subfamily C member 27Q9NZQ0 (DJC27)30,855
DNAJC2821q22.11220372_atDnaJ homolog subfamily C member 28Q9NX36 (DJC28)45,806
SACS13q12.12213262_atSacsinQ9NZJ4 (SACS)521,126
DNAJC307q11.23223367_atDnaJ homolog subfamily C member 30, mitochondrialQ96LL9 (DJC30)25,961
HSP20 (HSPB)HSPB17q11.23201841_s_atHeat shock protein beta-1P04792 (HSPB1)22,783
HSPB211q23.1205824_atHeat shock protein beta-2Q16082 (HSPB2)20,233
HSPB35q11.2206375_s_atHeat shock protein beta-3Q12988 (HSPB3)16,966
CRYAA21q22.3210199_atAlpha-crystallin A chainP02489 (CRYAA)19,909
CRYAB11q22.3209283_atAlpha-crystallin B chainP02511 (CRYAB)20,159
HSPB619q13.12226304_atHeat shock protein beta-6O14558 (HSPB6)17,136
HSPB71p36.13218934_s_atHeat shock protein beta-7Q9UBY9 (HSPB7)18,611
HSPB812q24.23221667_s_atHeat shock protein beta-8Q9UJY1 (HSPB8)21,604
HSPB917q21.2230510_atHeat shock protein beta-9Q9BQS6 (HSPB9)17,486
OFD18q22.3203569_s_atOral-facial-digital syndrome 1 proteinO75665 (OFD1)116,671
HSPB111p32215691_x_atIntraflagellar transport protein 25 homologQ9Y547 (IFT25)16,297
Table 2. List of HSP members significantly up and down-regulated in BC analyzed in UALCAN database.
List of HSPs Up-Regulated in BCUALCAN
Gene Expression between Normal and Cancer Tissues
(p Value)
List of HSPs Up-Regulated in BCUALCAN
Gene Expression between Normal and Cancer Tissues (p Value)
List of HSPs
Down-Regulated in BC
UALCAN
Gene Expression between Normal and Cancer Tissues (p Value)
HSPH11.62 × 10−12HSPB11.62 × 10−12HSPA4L1.63 × 10−5
HYOU1<1 × 10⁻¹²HSPB111.62 × 10−12HSPA12A2.24 × 10−12
HSP90AA11.62 × 10−12DNAJA1<1 × 10⁻¹²HSPA12B1.62 × 10−12
HSP90AB11.62 × 10−12DNAJA3<1 × 10⁻¹²BBS101.1 × 10−16
HSP90B11.62 × 10−12DNAJA41.62 × 10−12BBS121.62 × 10−12
TRAP11.62 × 10−12DNAJB21.7 × 10−12TCP13.19 × 10−9
HSPA1A5.62 × 10−4DNAJB65.59 × 10−10CCT6B4.61 × 10−10
HSPA1L8.43 × 10−5DNAJB111.62 × 10−12HSPB2<1 × 10⁻¹²
HSPA21.69 × 10−12DNAJC11.11 × 10−16CRYAB1.62 × 10−12
HSPA4<1 × 10⁻¹²DNAJC21.62 × 10−12HSPB6<1 × 10⁻¹²
HSPA51.62 × 10−12DNAJC43.87 × 10−7HSPB73.76 × 10−11
HSPA62.87 × 10−7DNAJC5<1 × 10⁻¹²HSPB93.89 × 10−3
HSPA81.62 × 10−12DNAJC5B1.05 × 10−9DNAJA24.36 × 10−5
HSPA9<1 × 10⁻¹²DNAJC71.62 × 10−12DNAJB41.62 × 10−12
HSPA131.62 × 10−12DNAJC9<1 × 10⁻¹²DNAJB72.01 × 10−5
HSPA14<1 × 10⁻¹²DNAJC101.11 × 10−16DNAJB132.13 × 10−6
CCT21.62 × 10−12DNAJC112.97 × 10−9DNAJB141.62 × 10−3
CCT3<1 × 10⁻¹²DNAJC121.62 × 10−12DNAJC5G1.21 × 10−4
CCT41.98 × 10−4DNAJC141.62 × 10−12DNAJC61.64 × 10−12
CCT5<1 × 10⁻¹²DNAJC178.1 × 10−5DNAJC83.4 × 10−8
CCT6A1.11 × 10−16DNAJC19<1 × 10⁻¹²DNAJC133.5 × 10−3
CCT7<1 × 10⁻¹²DNAJC211.64 × 10−13DNAJC18<1 × 10⁻¹²
CCT81.62 × 10−12DNAJC221.62 × 10−12DNAJC247.52 × 10−5
HSPD11.62 × 10−12GAK1.62 × 10−12DNAJC271.62 × 10−12
HSPE1<1 × 10⁻¹²DNAJC301.27 × 10−7DNAJC288.74 × 10−12
SACS<1 × 10⁻¹²
Table 3. List of HSP members significantly associated with clinical outcome, including Relapse Free Survival (RFS), Overall Survival (OS), and Distant Metastasis Free Survival (DMFS), evaluated by KM Plotter database. The Log Rank value was marked in red when higher expression of selected HSP was associated with poor prognosis and in the black when higher expression of selected HSP was associated with a good prognosis. The probe expression value cut-off for each analysis is also reported.
GeneRFSOSDMFS
Used Cut-Off Logrank PUsed Cut-Off Logrank PUsed Cut-Off Logrank P
HSP90AA120,364<1 × 10−1623,5045.7 × 10−720,0543.8 × 10−4
HSPA1A90779.4 × 10−513,3462.5 × 10−390898 × 10−4
HSPA1B20468.3 × 10−4 12549.2 × 10−418296.8 × 10−3
HSPA814,679<1 × 10−1614,6795.5 × 10−314,0181.7 × 10−2
HSPA144901.7 × 10−54771.7 × 10−44902.2 × 10−3
TCP16017.4 × 10−116761.5 × 10−75621.2 × 10−4
CCT25366<1 × 10−1653702.7 × 10−845202 × 10−7
CCT345542.9 × 10−1546191.2 × 10−247351.9 × 10−3
CCT459341.10 × 10−1155872.9 × 10−267783.32 × 10−2
CCT6A1676<1 × 10−1616672 × 10−816787.6 × 10−6
CCT72498<1 × 10−1623945 × 10−424661.4 × 10−3
CCT85676<1 × 10−1645995.5 × 10−536131.1 × 10−4
HSPD111,874<1 × 10−1611,6407.7 × 10−710,2535.6 × 10−6
DNAJA150702 × 10−1440992.7 × 10−449391 × 10−4
DNAJB122848.7 × 10−423124 × 10−223691.1 × 10−2
DNAJB1117711.3 × 10−923004.20 × 10−219102.5 × 10−4
DNAJC211532.5 × 10−167811.7 × 10−310499.1 × 10−4
DNAJC57683.9 × 10−27481.8 × 10−35914.8 × 10−2
DNAJC91494<1 × 10−1612961.5 × 10−713281.3 × 10−6
DNAJC171281.6 × 10−21282 × 10−21633.6 × 10−3
HSPB199812.4 × 10−1259403.5 × 10−475841.3 × 10−7
HSPA25362.2 × 10−106245.8 × 10−55631.7 × 10−6
BBS121861 × 10−101853.8 × 10−41874.7 × 10−3
DNAJB8264 × 10−5233.7 × 10−2247.4 × 10−3
DNAJB126446.4 × 10−106441.5 × 10−28792.5 × 10−2
DNAJB147575.5 × 10−811471.2 × 10−411642.7 × 10−2
DNAJC44873.3 × 10−104899 × 10−34452.9 × 10−3
DNAJC5G541.3 × 10−8272.3 × 10−3541.5 × 10−2
DNAJC101715.3 × 10−122029.6 × 10−31874.3 × 10−2
DNAJC12921.4 × 10−71275.3 × 10−4921.8 × 10−5
DNAJC144333.8 × 10−103935.2 × 10−35291.5 × 10−2
DNAJC164028.3 × 10−113615.8 × 10−94024.7 × 10−8
DNAJC195621.4 × 10−105781.6 × 10−75783.1 × 10−7
CRYAB5751.7 × 10−25223.8 × 10−38483.2 × 10−2
Table 4. Relationship between HSPs mRNA expression in BC and clinical-pathological parameters, including estrogen receptor (ER), progesterone receptor (PR), and human epidermal growth receptor 2 (HER) status, lymph node (N) involvement, and grading (G1–G2–G3). Data were retrieved for each HSP using bcGeneXMiner and the grading was assessed using GOBO database. p < 0.05 was considered significant (p < 0.05 *, p < 0.01 **, p < 0.001 ***).
Gene NameER+/PR+ER-/PR-HER+ HER- N+N-G1G2G3
HSPA1A<0.0001 *** --0.0315 * ---
HSPA8 <0.0001 ***0.0022 ** 0.0002 *** ---
HSPA14 <0.0001 ***<0.0001 *** 0.0134 ** <0.0001 ***
HSPB1<0.0001 *** --<0.0001 *** <0.0001 ***
HSP90AA1 <0.0001 ***<0.0001 *** <0.0001 *** <0.0001 ***
TCP1 <0.0001 ***<0.0001 *** 0.0175 ** <0.0001 ***
CCT2--0.0066 ** 0.0003 *** <0.0001 ***
CCT3 <0.0001 ***0.0001 *** 0.0025 ** <0.0001 ***
CCT4 <0.0001 ***---- <0.0001 ***
CCT6A <0.0001 ***<0.0001 *** <0.0001 *** <0.0001 ***
CCT7 <0.0001 ***--<0.0001 *** <0.0001 ***
CCT8 <0.0001 ***---- <0.0001 ***
HSPD1 <0.0001 ***<0.0001 *** <0.0001 *** <0.0001 ***
DNAJA1 <0.0001 ***0.0091 ** <0.0001 *** <0.0001 ***
DNAJB11 <0.0001 ***<0.0001 *** -----
DNAJC2 <0.0001 ***--0.0002 *** <0.0001 ***
DNAJC5 <0.0001 ***<0.0001 *** 0.0050 ** ---
DNAJC9 <0.0001 ***0.0042 ** 0.0213 * <0.0001 ***
DNAJC17<0.0001 *** ----<0.0001 ***
HSPA2<0.0001 *** <0.0001 ***--<0.0001 ***
BBS12<0.0001 *** <0.0001 *** 0.0404 *---
DNAJB14<0.0001 *** ---- <0.0001 ***
DNAJC40.01 * 0.0057 ** <0.0001 *** <0.0001 ***
DNAJC5G---------
DNAJC10--<0.0001 *** -- 0.00011 ***
DNAJC12<0.0001 *** <0.0001 ***--<0.0001 ***
DNAJC14<0.0001 *** 0.0003 ***-----
DNAJC19<0.0001 *** <0.0001 ***-----
CRYAB <0.0001 *** <0.0001 ***-----
Table 5. List of the hubs miRNAs involved in the HSPs-miRNAs-mRNAs network. The red bolded miRNAs were significantly up-regulated in breast cancer than normal tissues; the black bolded miRNAs were significantly down-regulated in breast cancer than normal tissues. A p-value < 0.01 was regarded as significant.
HSPs Co-Expressed miRNAs
Up-Regulated in Poor Prognosis
HSPs Co-Expressed miRNAs
Up-Regulated in Good Prognosis
hsa-mir-320b-27.13 × 10⁻⁷hsa-mir-23a-
hsa-mir-5454.38 × 10−12hsa-mir-1431.62 × 10−12
hsa-mir-941-2-hsa-mir-1851.42 × 10−4
hsa-mir-651<1 × 10⁻¹²hsa-mir-196b5.07 × 10−2
hsa-mir-3835.48 × 10−7hsa-mir-145<1 × 10⁻¹²
hsa-mir-1914-hsa-mir-1504.4 × 10−11
hsa-mir-5705.56 × 10−5hsa-mir-12283.04 × 10−2
hsa-mir-647-hsa-mir-19104.10 × 10−5
hsa-mir-1227-hsa-mir-450a-1-
hsa-mir-593-hsa-mir-548i-1-
hsa-mir-300-hsa-mir-12471.24 × 10−14
hsa-mir-6439.17 × 10−11hsa-mir-4112.00 × 10−5
hsa-mir-626-hsa-mir-1299-
hsa-mir-1289-1-hsa-mir-3704.12 × 10−5
hsa-mir-544a-
HSPs-miRNAs network
associated with poor prognosis
hsa-mir-1200-
hsa-mir-36548.15 × 10−9
hsa-mir-16-5p-hsa-mir-7706.09 × 10−05
hsa-mir-23b-3p-hsa-mir-555-
hsa-mir-15a-5p3.88 × 10−15hsa-mir-604-
hsa-mir-34a-5p-
hsa-mir-1-3p-HSPs-miRNAs network associated with good prognosis
hsa-mir-103a-3p<1 × 10⁻¹²
hsa-mir-148a-3p6.5 × 10−13hsa-mir-16-5p-
hsa-mir-424-5p-hsa-mir-155-5p1.62 × 10−12
hsa-mir-1072.4 × 10−11hsa-mir-146a-5p5.77 × 10−05
hsa-mir-155-5p1.62 × 10−12hsa-mir-124-3p-
hsa-mir-497-5p<1 × 10⁻¹²hsa-mir-1-3p-
hsa-mir-181a-5p8.31 × 10−03hsa-mir-182-5p1.62 × 10−12
hsa-mir-21-3p<1 × 10⁻¹²hsa-mir-191-5p<1 × 10⁻¹²
hsa-mir-15b-3p6.96 × 10−10hsa-mir-17-5p<1 × 10⁻¹²
hsa-mir-186-5p0.00446hsa-mir-23b-3p-
hsa-mir-195-5p<1 × 10⁻¹²hsa-mir-34a-5p-
hsa-mir-141-5p1.62 × 10−12hsa-mir-15a-5p3.88 × 10−15
hsa-mir-29a-3p1.96 × 10−12hsa-mir-20a-5p1.1 × 10−11
hsa-mir-197-3p-hsa-mir-195-5p<1 × 10⁻¹²
hsa-mir-302c-3p-
Publisher’s Note: MDPI stays neutral with regard to jurisdictional claims in published maps and institutional affiliations.

