
Biochemical Response to Freezing in the Siberian Salamander Salamandrella keyserlingii

 ,
,  , ,
, ,
Simple Summary
Abstract
1. Introduction
2. Materials and Methods
2.1. Animals Care and Freezing Protocol
2.2. NMR Measurements
3. Results
4. Discussion
4.1. Cryoprotectants
4.2. Freezing Bioenergetics
4.3. Markers of Stress
4.4. Amino Acids
4.5. Comparison to Metabolome in Hypoxia
5. Conclusions
Supplementary Materials
Author Contributions
Funding
Institutional Review Board Statement
Informed Consent Statement
Data Availability Statement
Conflicts of Interest
References
- Berman, D.I.; Bulakhova, N.A.; Meshcheryakova, E.N. The Siberian wood frog survives for months underwater without oxygen. Sci. Rep. 2019, 9, 13594. [Google Scholar] [CrossRef]
- Storey, K.B.; Storey, J.M. Molecular physiology of freeze tolerance in vertebrates. Physiol. Rev. 2017, 97, 623–665. [Google Scholar] [CrossRef] [PubMed]
- Churchill, T.A.; Storey, K.B. Effects of dehydration on organ metabolism in the frog Pseudacris crucifer: Hyperglycemic responses to dehydration mimic freezing-induced cryoprotectant production. J. Comp. Physiol. B 1994, 164, 492–498. [Google Scholar] [CrossRef] [PubMed]
- Costanzo, J.P.; Lee, R.E., Jr. Avoidance and tolerance of freezing in ectothermic vertebrates. J. Exp. Biol. 2013, 216, 1961–1967. [Google Scholar] [CrossRef] [PubMed]
- Berman, D.I.; Meshcheryakova, E.N.; Bulakhova, N.A. Extreme negative temperatures and body mass loss in the Siberian salamander (Salamandrella keyserlingii, Amphibia, Hynobiidae). Dokl. Biol. Sci. 2016, 468, 137–141. [Google Scholar] [CrossRef]
- Berman, D.I.; Leirikh, A.N.; Meshcheryakova, E.N. The Schrenck newt (Salamandrella schrenckii, Amphibia, Caudata, Hynobiidae) is the second amphibian that withstands extremely low temperatures. Dokl. Biol. Sci. 2010, 431, 131–134. [Google Scholar] [CrossRef]
- Berman, D.I.; Meshcheryakova, E.N.; Bulakhova, N.A. The Japanese tree frog (Hyla japonica), one of the most cold-resistant species of amphibians. Dokl. Biol. Sci. 2016, 471, 276–279. [Google Scholar] [CrossRef]
- Larson, D.J.; Middle, L.; Vu, H.; Zhang, W.; Serianni, A.S.; Duman, J.; Barnes, B.M. Wood frog adaptations to overwintering in Alaska: New limits to freezing tolerance. J. Exp. Biol. 2014, 72, 1420–1425. [Google Scholar] [CrossRef]
- Berman, D.I.; Bulakhova, N.A.; Meshcheryakova, E.N.; Shekhovtsov, S.V. Overwintering and cold tolerance in the moor frog (Rana arvalis) across its range. Can. J. Zool. 2020, 98, 705–714. [Google Scholar] [CrossRef]
- Berman, D.I.; Leirikh, A.N.; Mikhailova, E.I. Winter hibernation of the Siberian salamander Hynobius keyserlingi. J. Evol. Biochem. Physiol. 1984, 3, 323–327. (In Russian) [Google Scholar]
- Davies, P.L. Ice-binding proteins: A remarkable diversity of structures for stopping and starting ice growth. Trends Biochem. Sci. 2014, 39, 548–555. [Google Scholar] [CrossRef] [PubMed]
- Vance, T.D.R.; Bayer-Giraldi, M.; Davies, P.L.; Mangiagalli, M. Ice-binding proteins and the ‘domain of unknown function’ 3494 family. FEBS J. 2019, 286, 855–873. [Google Scholar] [CrossRef] [PubMed]
- Bar Dolev, M.; Braslavsky, I.; Davies, P.L. Ice-binding proteins and their function. Annu. Rev. Biochem. 2016, 85, 515–542. [Google Scholar] [CrossRef] [PubMed]
- Shekhovtsov, S.V.; Bulakhova, N.A.; Tsentalovich, Y.P.; Zelentsova, E.A.; Yanshole, L.V.; Meshcheryakova, E.N.; Berman, D.I. Metabolic response of the Siberian wood frog Rana amurensis to extreme hypoxia. Sci. Rep. 2020, 10, 14604. [Google Scholar] [CrossRef] [PubMed]
- Bulakhova, N.A.; Gaidin, S.G. Quantitative characteristics of the autumn and spring oogenesis stages of the Siberian salamander (Salamandrella keyserlingii) in the tundras of the northern coast of the sea of Okhotsk. Bull. North-East. Sci. Cent. FEB RAS 2017, 1, 52–60. (In Russian) [Google Scholar]
- Costanzo, J.P.; do Amaral, M.C.F.; Rosendale, A.J.; Lee, R.E., Jr. Hibernation physiology, freezing adaptation and extreme freeze tolerance in a northern population of the wood frog. J. Exp. Biol. 2013, 216, 3461–3473. [Google Scholar] [CrossRef]
- Yanshole, V.V.; Yanshole, L.V.; Zelentsova, E.A.; Tsentalovich, Y.P. Ovothiol A is the main antioxidant in fish lens. Metabolites 2019, 9, 95. [Google Scholar] [CrossRef]
- Wishart, D.S.; Feunang, Y.D.; Marcu, A.; Guo, A.C.; Liang, K.; Vázquez-Fresno, R.; Sajed, T.; Johnson, D.; Li, C.; Karu, N.; et al. HMDB 4.0: The human metabolome database for 2018. Nucleic Acids Res. 2018, 46, D608–D617. [Google Scholar] [CrossRef] [PubMed]
- Snytnikova, O.A.; Yanshole, L.V.; Iskakov, I.A.; Yanshole, V.V.; Chernykh, V.V.; Stepakov, D.A.; Novoselov, V.P.; Tsentalovich, Y.P. Quantitative metabolomic analysis of the human cornea and aqueous humor. Metabolomics 2017, 13, 152. [Google Scholar] [CrossRef]
- Chong, J.; Soufan, O.; Li, C.; Caraus, I.; Li, S.; Bourque, G.; Wishart, D.S.; Xia, J. MetaboAnalyst 4.0: Towards more transparent and integrative metabolomics analysis. Nucleic Acids Res. 2018, 46, W486–W494. [Google Scholar] [CrossRef] [PubMed]
- Tas, R.P.; Sampaio-Pinto, V.; Wennekes, T.; Laake, L.W.; Voets, I.K. From the freezer to the clinic. EMBO Rep. 2021, 22, e52162. [Google Scholar] [CrossRef] [PubMed]
- Costanzo, J.P. Overwintering adaptations and extreme freeze tolerance in a subarctic population of the wood frog, Rana sylvatica. J. Comp. Physiol. B 2019, 189, 1–15. [Google Scholar] [CrossRef]
- Hochachka, P.W.; Somero, G.N. Biochemical Adaptation: Mechanism and Process in Physiological Evolution; Oxford University Press: Oxford, UK, 2002; ISBN 0195353676. [Google Scholar]
- Toxopeus, J.; Koštál, V.; Sinclair, B.J. Evidence for non-colligative function of small cryoprotectants in a freeze-tolerant insect. Proc. R. Soc. B 2019, 286, 20190050. [Google Scholar] [CrossRef] [PubMed]
- Vesala, L.; Salminen, T.S.; Koštál, V.; Zahradníčková, H.; Hoikkala, A. Myo-inositol as a main metabolite in overwintering flies: Seasonal metabolomic profiles and cold stress tolerance in a northern drosophilid fly. J. Exp. Biol. 2012, 215, 2891–2897. [Google Scholar] [CrossRef] [PubMed]
- Watanabe, M. Cold tolerance and myo-inositol accumulation in overwintering adults of a lady beetle, Harmonia axyridis (Coleoptera: Coccinellidae). Eur. J. Entomol. 2002, 99, 5–10. [Google Scholar] [CrossRef]
- Croze, M.L.; Soulage, C.O. Potential role and therapeutic interests of myo-inositol in metabolic diseases. Biochimie 2013, 95, 1811–1827. [Google Scholar] [CrossRef] [PubMed]
- Storey, K.B.; Storey, J.M. Freeze tolerance and intolerance as strategies of winter survival in terrestrially-hibernating amphibians. Comp. Biochem. Physiol. A Physiol. 1986, 83, 613–617. [Google Scholar] [CrossRef]
- Storey, K.B.; Storey, J.M. Persistence of freeze tolerance in terrestrially hibernating frogs after spring emergence. Copeia 1987, 1987, 720–726. [Google Scholar] [CrossRef]
- Costanzo, J.P.; do Amaral, M.C.F.; Rosendale, A.J.; Lee, R.E. Seasonality of freeze tolerance in a Subarctic population of the wood frog, Rana sylvatica. Int. J. Zool. 2014, 2014, 750153. [Google Scholar] [CrossRef]
- Voituron, Y.; Paaschburg, L.; Holmstrup, M.; Barré, H.; Ramløv, H. Survival and metabolism of Rana arvalis during freezing. J. Comp. Physiol. B 2009, 179, 223–230. [Google Scholar] [CrossRef]
- Schmid, W.D. Survival of frogs in low temperature. Science 1982, 215, 697–698. [Google Scholar] [CrossRef]
- Swanson, D.L.; Graves, B.M.; Koster, K.L. Freezing tolerance/intolerance and cryoprotectant synthesis in terrestrially overwintering anurans in the Great Plains, USA. J. Comp. Physiol. B 1996, 166, 110–119. [Google Scholar] [CrossRef] [PubMed]
- Costanzo, J.P.; Wright, M.F.; Lee, R.E. Freeze tolerance as an overwintering adaptation in Cope’s grey treefrog (Hyla chrysoscelis). Copeia 1992, 1992, 565–569. [Google Scholar] [CrossRef]
- Irwin, J.T.; Lee, J.R.E. Geographic variation in energy storage and physiological responses to freezing in the gray treefrogs Hyla versicolor and H. chrysoscelis. J. Exp. Biol. 2003, 206, 2859–2867. [Google Scholar] [CrossRef]
- Layne Jr, J.R.; Jones, A.L. Freeze tolerance in the gray treefrog: Cryoprotectant mobilization and organ dehydration. J. Exp. Zool. 2001, 290, 1–5. [Google Scholar] [CrossRef]
- Layne, J.R. Freeze tolerance and cryoprotectant mobilization in the gray treefrog (Hyla versicolor). J. Exp. Zool. 1999, 283, 221–225. [Google Scholar] [CrossRef]
- Storey, J.M.; Storey, K.B. Adaptations of metabolism for freeze tolerance in the gray tree frog, Hyla versicolor. Can. J. Zool. 1985, 63, 49–54. [Google Scholar] [CrossRef]
- Jackson, D.C. Surviving extreme lactic acidosis: The role of calcium lactate formation in the anoxic turtle. Respir. Physiol. Neurobiol. 2004, 144, 173–178. [Google Scholar] [CrossRef] [PubMed]
- Shoubridge, E.A.; Hochachka, P.W. Ethanol: Novel end product of vertebrate anaerobic metabolism. Science 1980, 209, 308–309. [Google Scholar] [CrossRef]
- Chouchani, E.T.; Pell, V.R.; Gaude, E.; Aksentijević, D.; Sundier, S.Y.; Robb, E.L.; Logan, A.; Nadtochiy, S.M.; Ord, E.N.J.; Smith, A.C.; et al. Ischaemic accumulation of succinate controls reperfusion injury through mitochondrial ROS. Nature 2014, 515, 431–435. [Google Scholar] [CrossRef] [PubMed]
- Dahl, H.-A.; Johansen, A.; Nilsson, G.E.; Lefevre, S. The metabolomic response of crucian carp (Carassius carassius) to anoxia and reoxygenation differs between tissues and hints at uncharacterized survival strategies. Metabolites 2021, 11, 435. [Google Scholar] [CrossRef] [PubMed]
- Bundgaard, A.; James, A.M.; Gruszczyk, A.V.; Martin, J.; Murphy, M.P.; Fago, A. Metabolic adaptations during extreme anoxia in the turtle heart and their implications for ischemia-reperfusion injury. Sci. Rep. 2019, 9, 2850. [Google Scholar] [CrossRef] [PubMed]
- Zablocki, K.; Miller, S.P.; Garcia-Perez, A.; Burg, M.B. Accumulation of glycerophosphocholine (GPC) by renal cells: Osmotic regulation of GPC:choline phosphodiesterase. Proc. Natl. Acad. Sci. USA 1991, 88, 7820–7824. [Google Scholar] [CrossRef]
- Aruoma, O.I.; Laughton, M.J.; Halliwell, B. Carnosine, homocarnosine and anserine: Could they act as antioxidants in vivo? Biochem. J. 1989, 264, 863–869. [Google Scholar] [CrossRef] [PubMed]
- Cheah, I.K.; Halliwell, B. Ergothioneine; antioxidant potential, physiological function and role in disease. Biochim. Biophys. Acta 2012, 1822, 784–793. [Google Scholar] [CrossRef] [PubMed]
- Niu, Y.; Cao, W.; Wang, J.; He, J.; Storey, K.B.; Ding, L.; Tang, X.; Chen, Q. Freeze tolerance and the underlying metabolite responses in the Xizang plateau frog, Nanorana parkeri. J. Comp. Physiol. B 2021, 191, 173–184. [Google Scholar] [CrossRef]
- Costanzo, J.P.; Reynolds, A.M.; do Amaral, M.C.F.; Rosendale, A.J.; Lee, R.E. Cryoprotectants and extreme freeze tolerance in a subarctic population of the wood frog. PLoS ONE 2015, 10, e0117234. [Google Scholar] [CrossRef] [PubMed]
- Kaneko, J.; Enya, A.; Enomoto, K.; Ding, Q.; Hisatsune, T. Anserine (beta-alanyl-3-methyl-L-histidine) improves neurovascular-unit dysfunction and spatial memory in aged AβPPswe/PSEN1dE9 Alzheimer’s-model mice. Sci. Rep. 2017, 7, 12571. [Google Scholar] [CrossRef]
- Chinkes, D.L. Methods for measuring tissue protein breakdown rate in vivo. Curr. Opin. Clin. Nutr. Metab. Care 2005, 8, 534–537. [Google Scholar] [CrossRef] [PubMed]


| T, °C | Duration, Days |
|---|---|
| 15 | 5 |
| 10 | 7 |
| 8 | 7 |
| 5 | 30 |
| 1 | 20 |
| −1 | 20 |
| −2 | 2 |
| −3 | 2 |
| −8 | 7 |
| Compound | Liver | Muscle | ||
|---|---|---|---|---|
| Control | Frozen | Control | Frozen | |
| 2-aminoadipate | 300 ± 175 | 142 ± 53 *** | 252 ± 56 | 133 ± 25 |
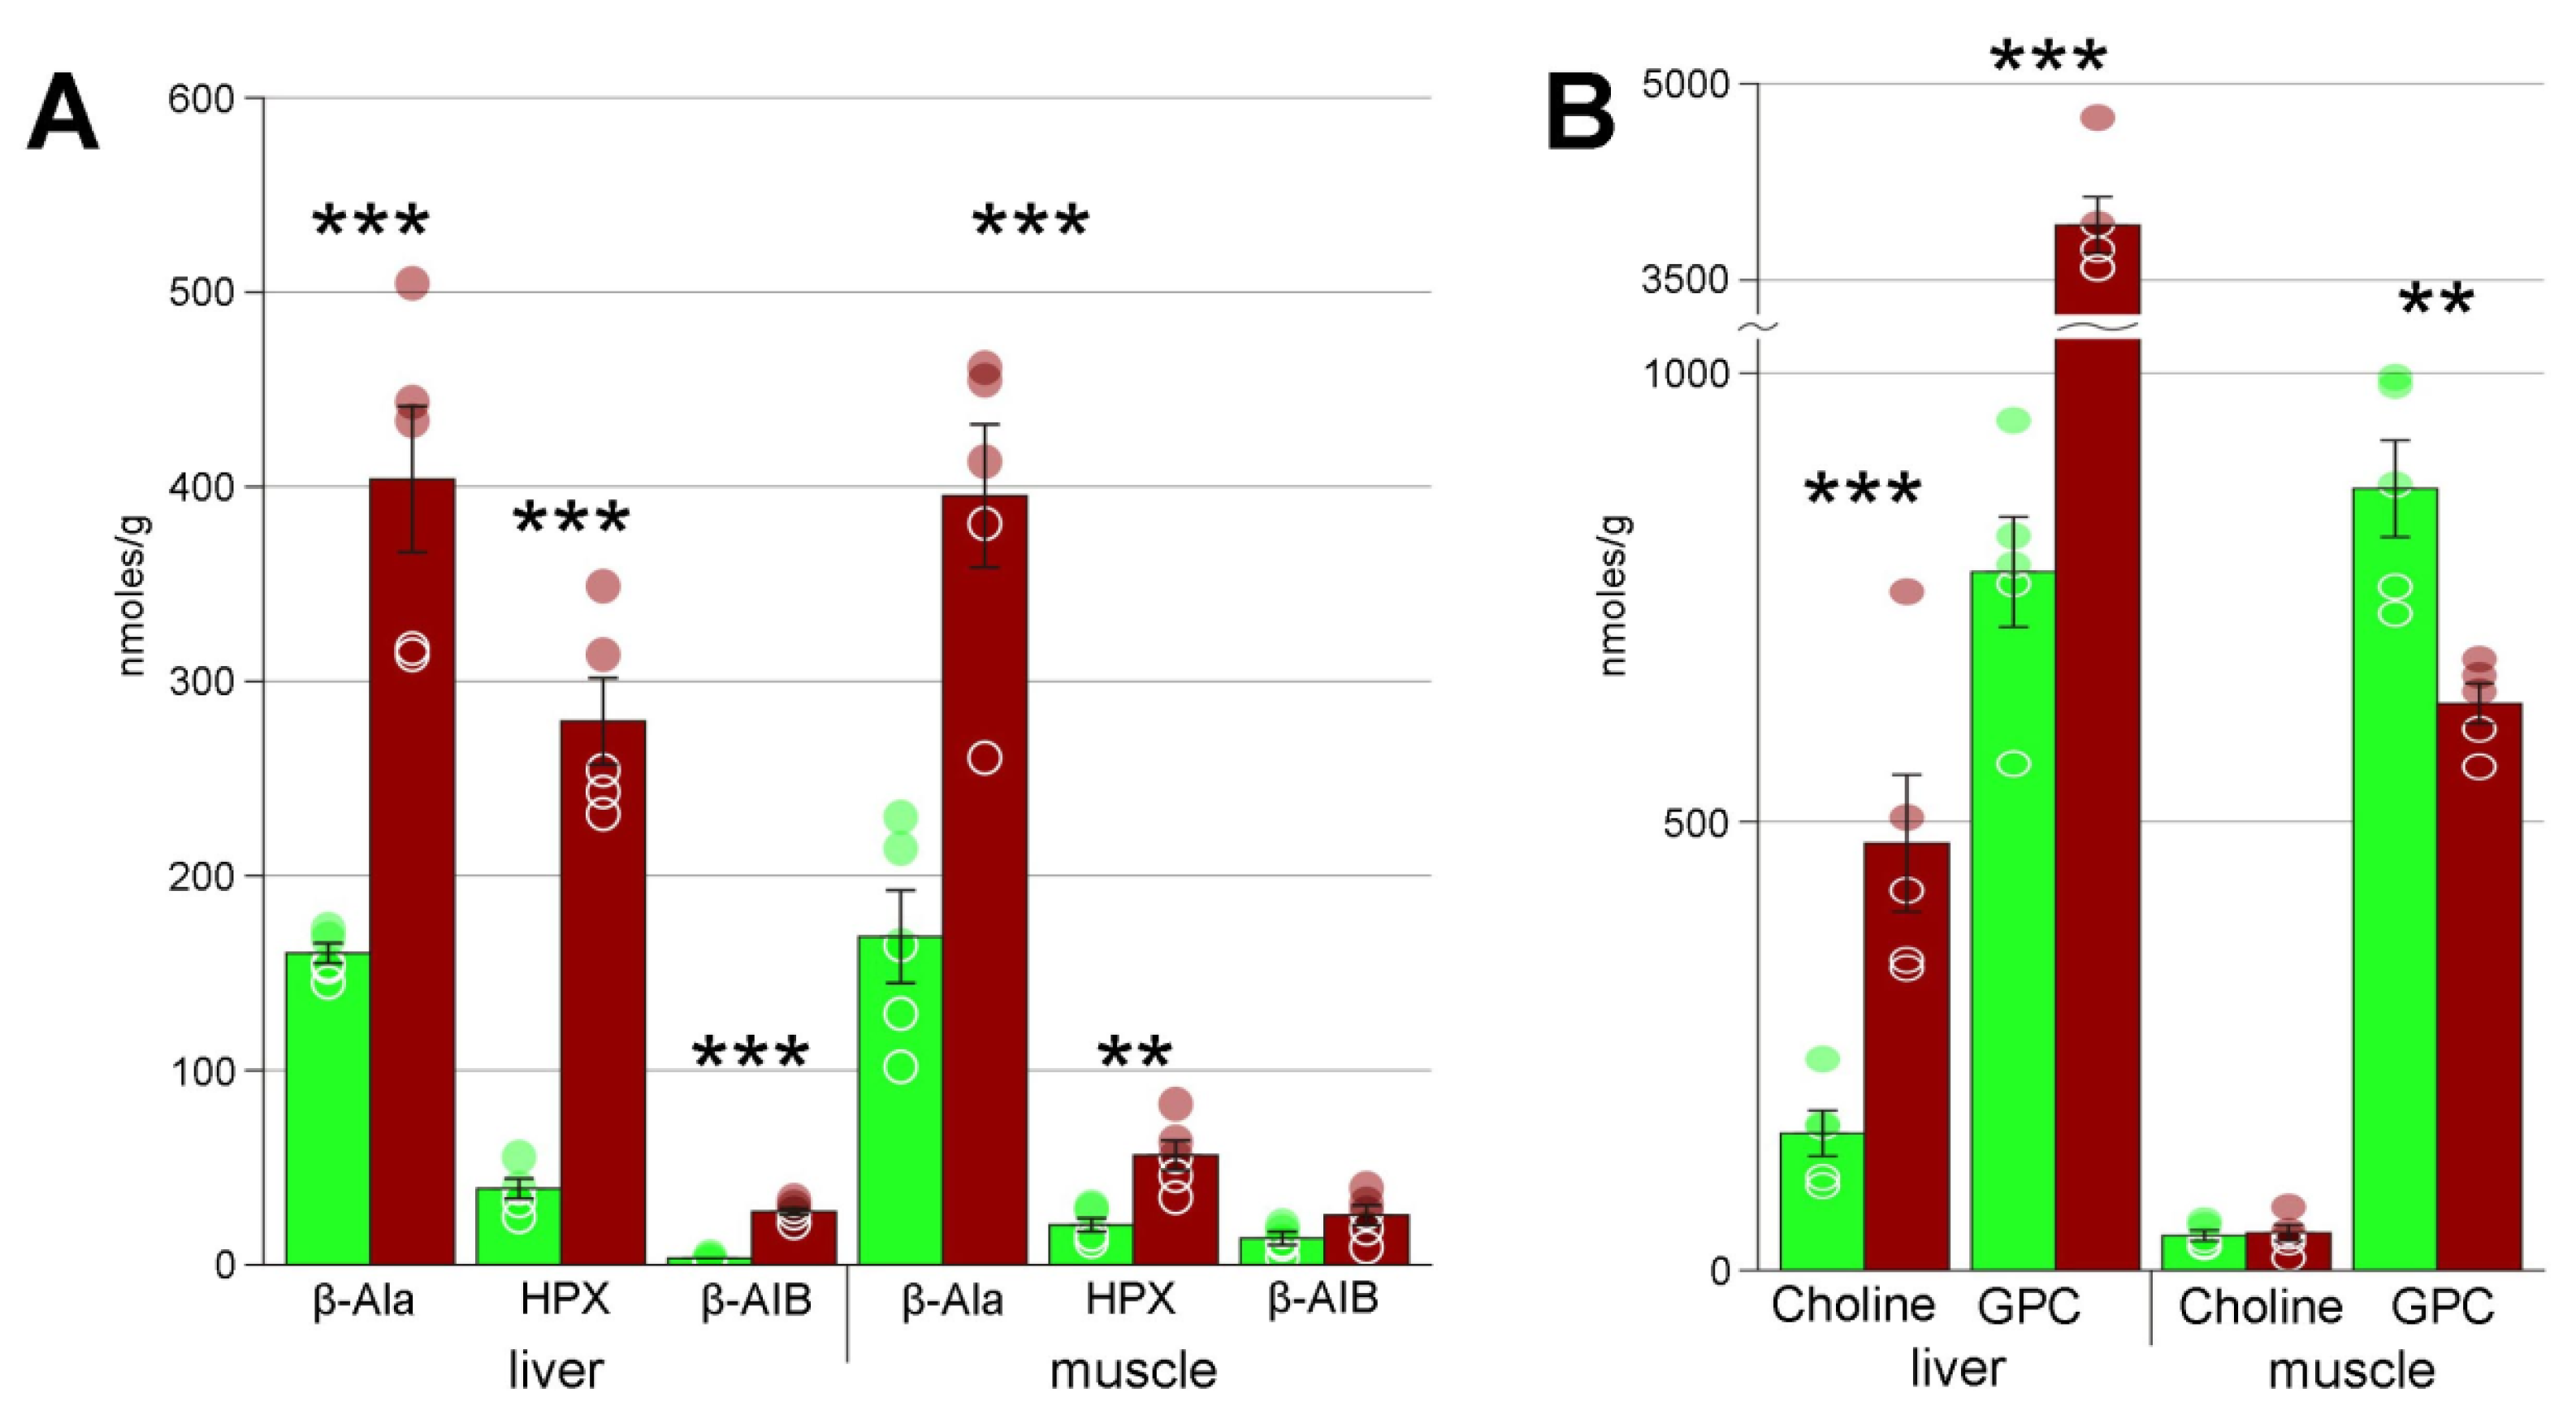
| 3-aminoisobutyrate | 3 ± 1 | 27 ± 2 *** | 13 ± 3 | 26 ± 5 |
| 3-OH-isobutyrate | 23 ± 4 | 539 ± 77 *** | 32 ± 5 | 109 ± 20 ** |
| Acetate | 764 ± 19 | 232 ± 85 *** | 121 ± 7 | 28 ± 4 *** |
| ADP | 97 ± 23 | 25 ± 3 * | 128 ± 32 | 42 ± 7* |
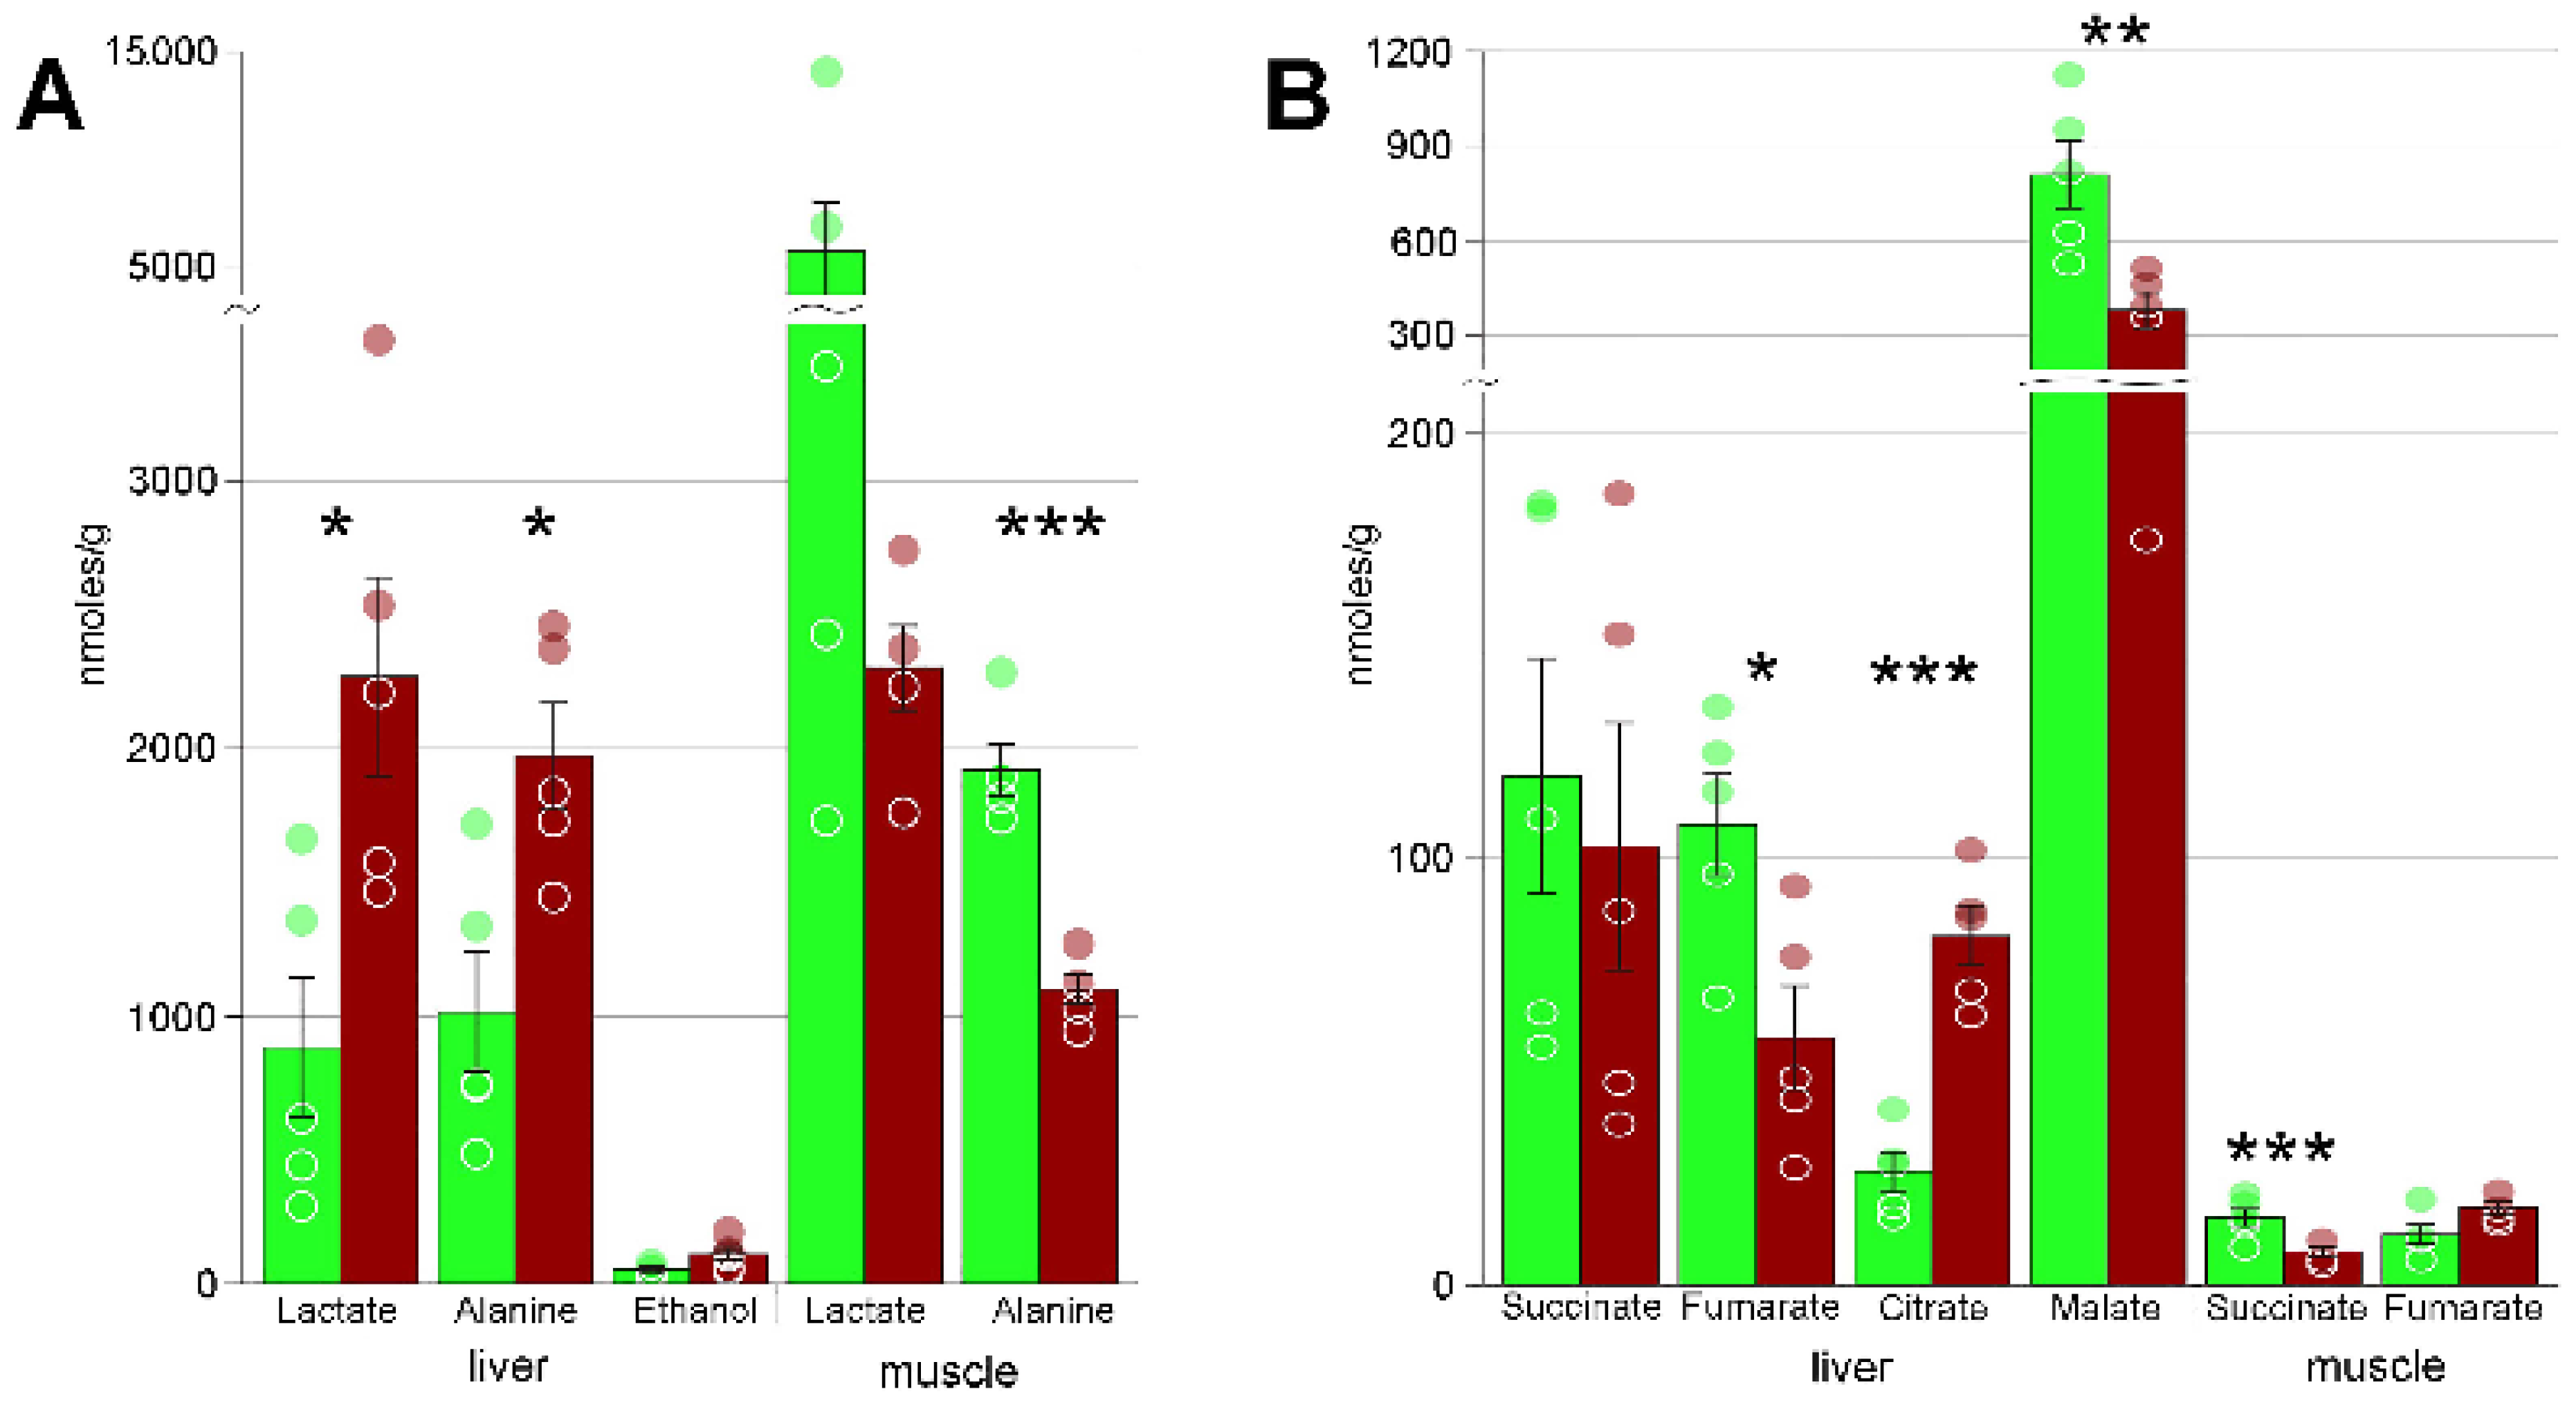
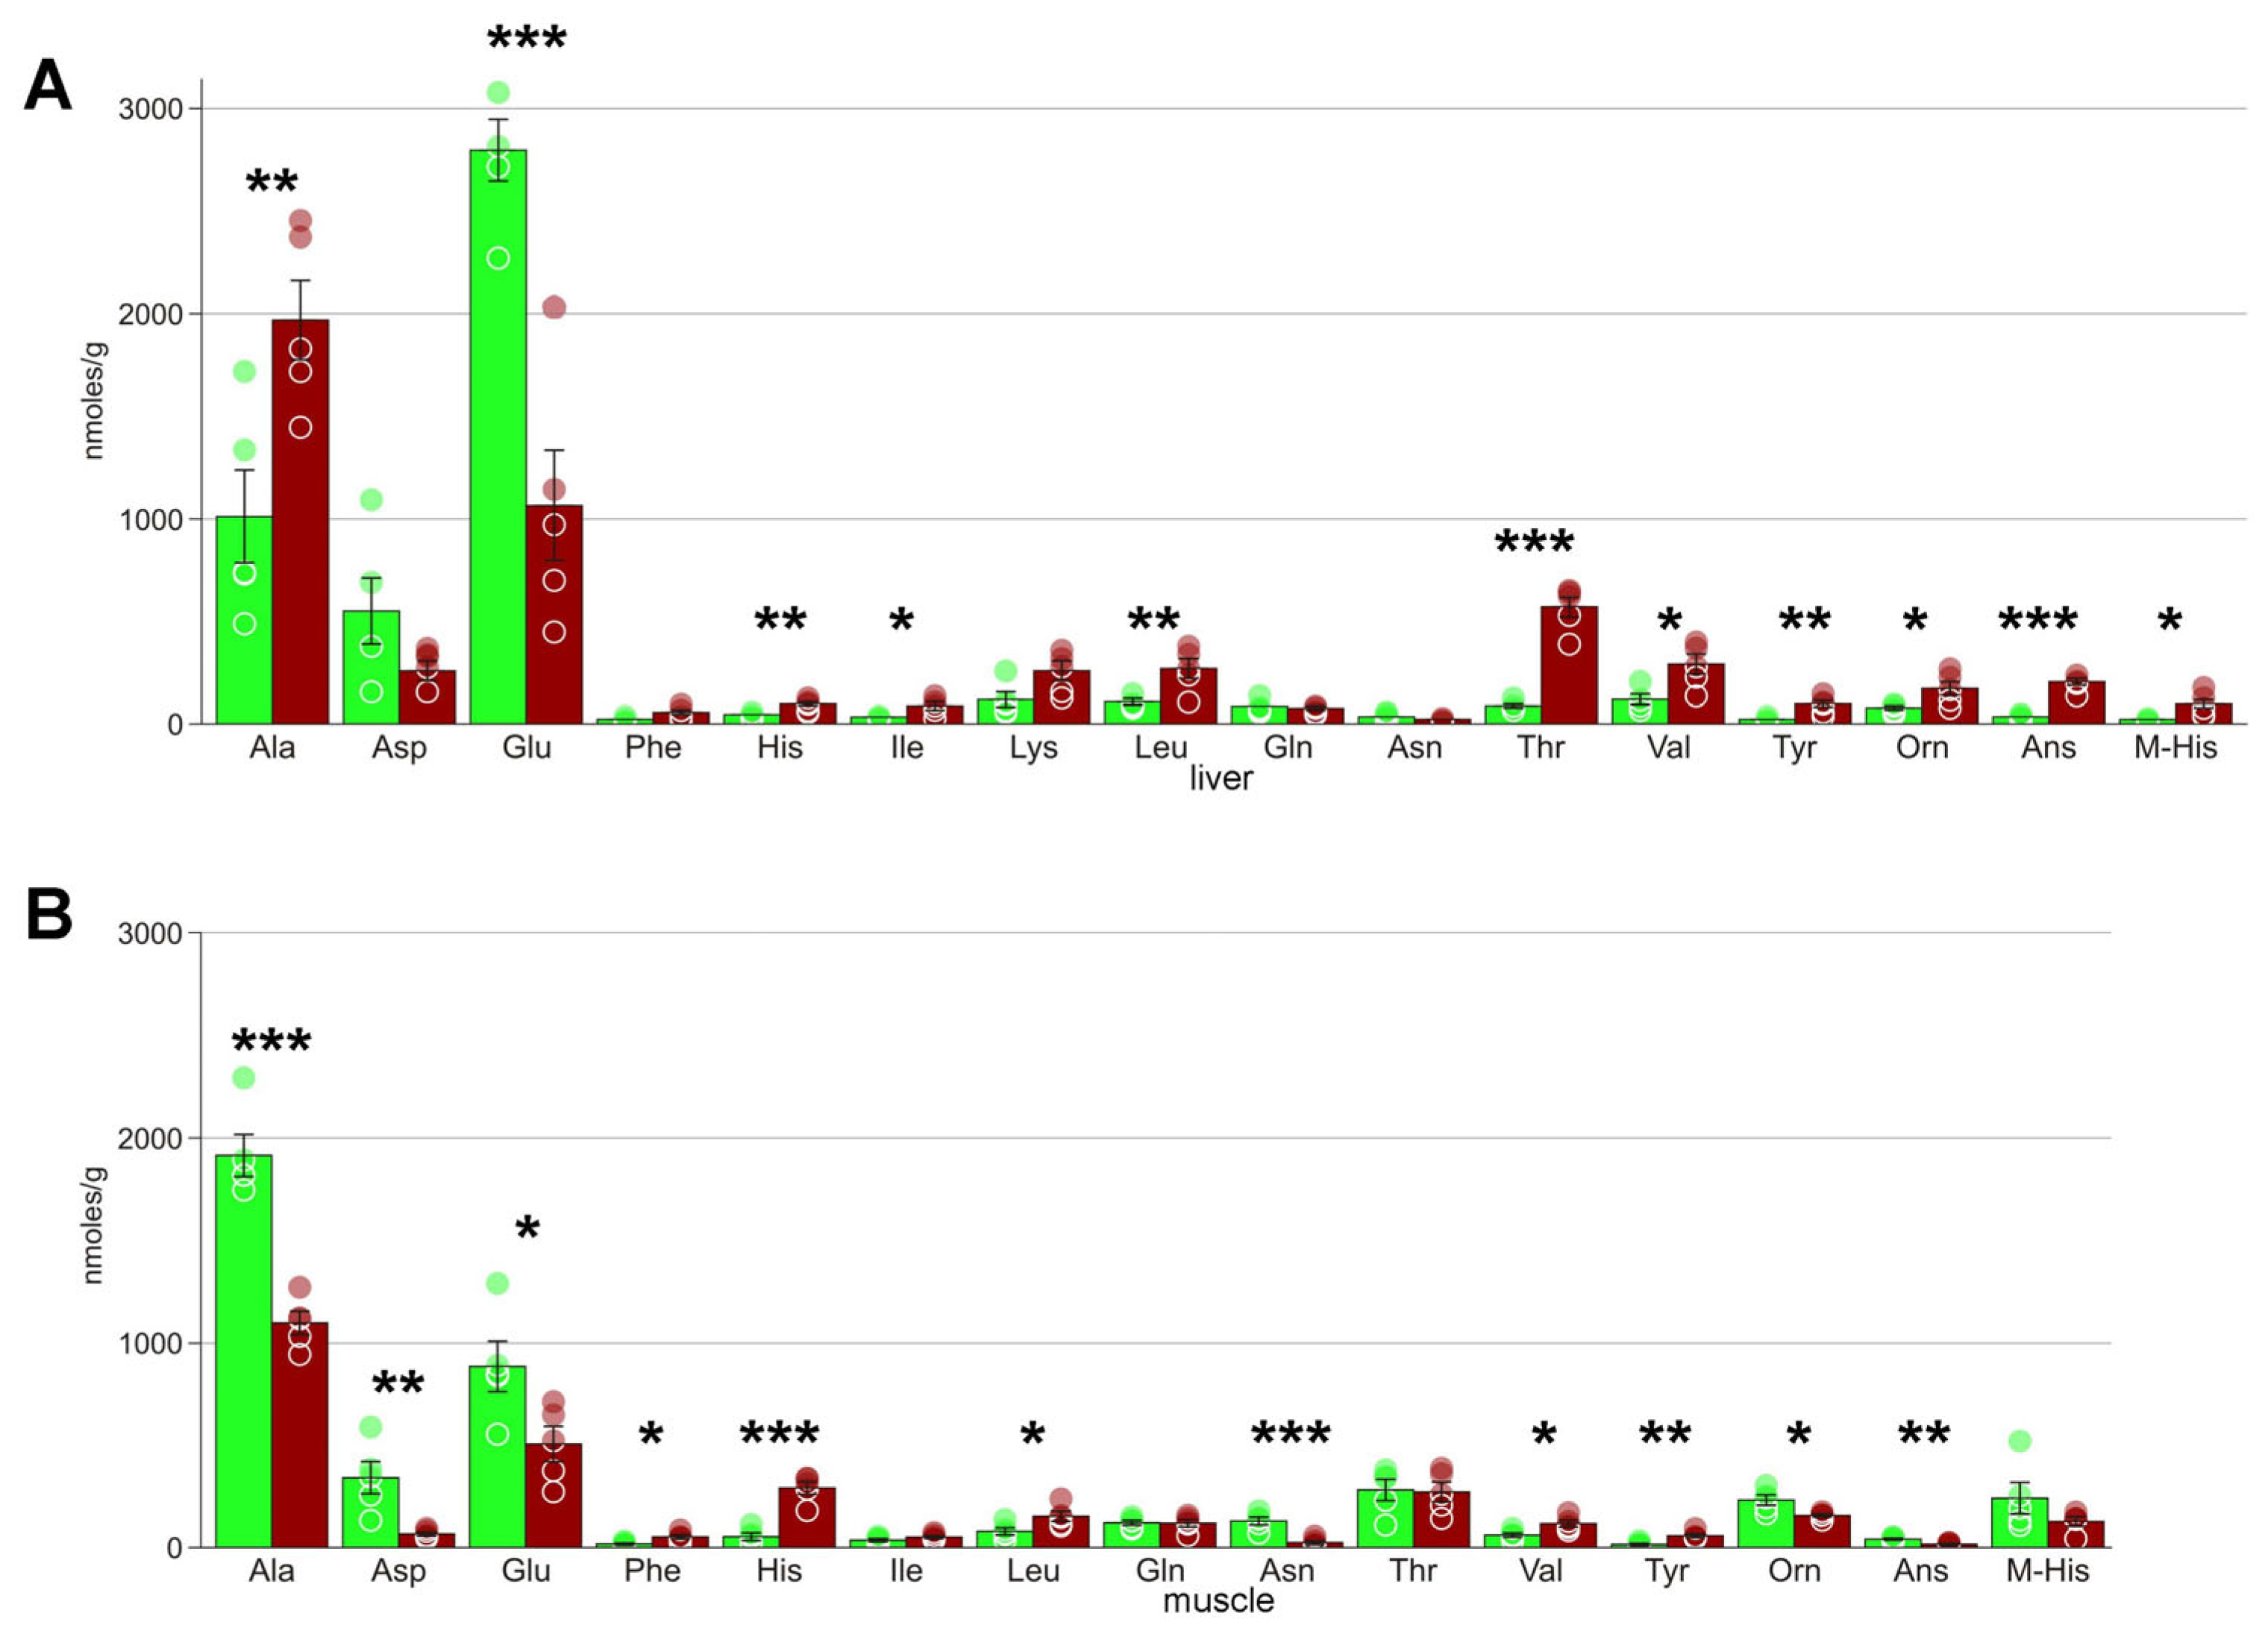
| Alanine | 1009 ± 227 | 1973 ± 195 * | 1915 ± 97 | 1099 ± 54 *** |
| Alpha-aminobutyrate | 4 ± 1 | 10 ± 2 * | 7 ± 1 | 4 ± 1 |
| AMP | 141 ± 13 | 18 ± 2 *** | 88 ± 17 | 23 ± 13 * |
| Anserine | 37 ± 5 | 210 ± 19 *** | 41 ± 4 | 16 ± 4 ** |
| Ascorbate | n/a | 130 ± 21 | n/a | n/a |
| Asparagine | 38 ± 7 | 19 ± 4 | 130 ± 18 | 24 ± 9 *** |
| Aspartate | 547 ± 163 | 264 ± 45 | 343 ± 76 | 66 ± 9 *** |
| ATP | 78 ± 22 | 20 ± 6 * | 102 ± 48 | 14 ± 5 |
| Beta-alanine | 160 ± 5 | 404 ± 38 *** | 169 ± 24 | 395 ± 36 *** |
| Carnosine | 20 ± 2 | 98 ± 25 * | 1805 ± 373 | 940 ± 193 |
| Choline | 154 ± 25 | 475 ± 77 ** | 40 ± 6 | 41 ± 9 |
| Citrate | 27 ± 5 | 82 ± 7 *** | n/a | n/a |
| Creatine | 101 ± 16 | 478 ± 59 *** | 5525 ± 484 | 3544 ± 121 ** |
| Ergothioneine | 90 ± 20 | 322 ± 36 *** | 24 ± 5 | 31 ± 6 |
| Ethanol | 50 ± 9 | 108 ± 24 | n/a | n/a |
| Formate | 32 ± 1 | 43 ± 3 * | 163 ± 20 | 14 ± 5 *** |
| Fumarate | 108 ± 12 | 58 ± 12 * | 12 ± 2 | 18 ± 1 |
| GABA | 12 ± 2 | 24 ± 4 * | n/a | n/a |
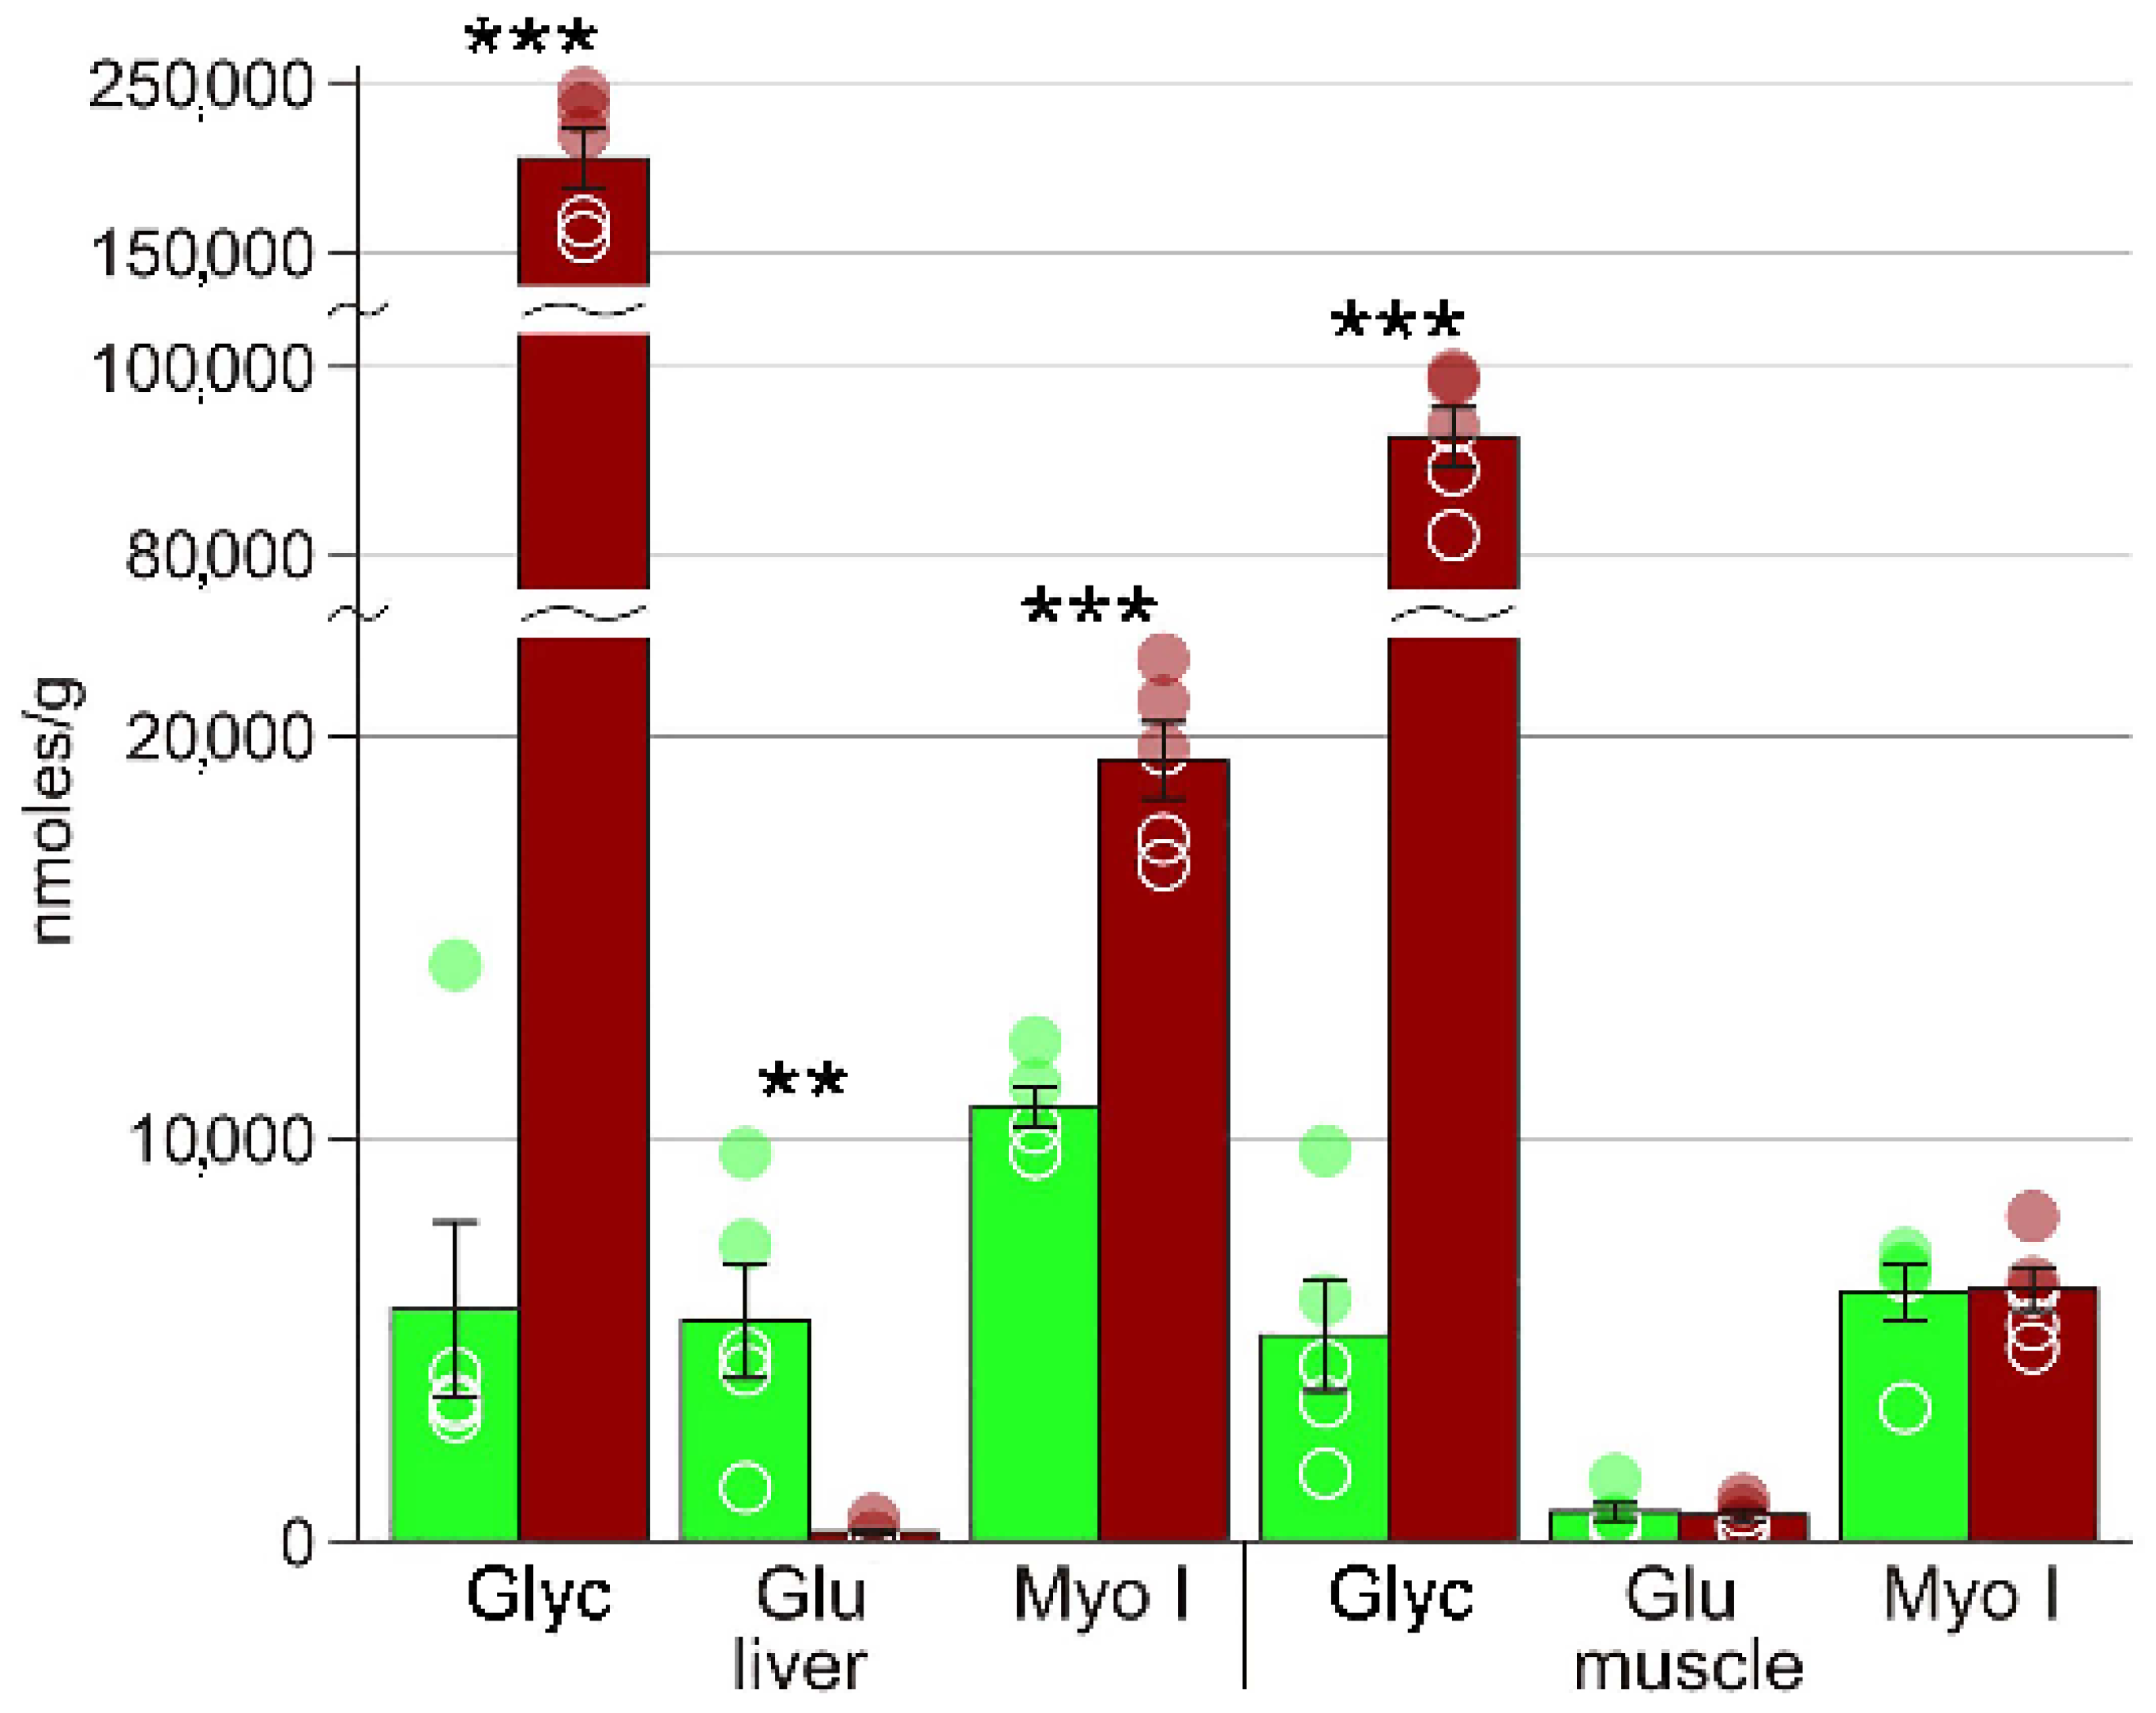
| Glucose | 5469 ± 1415 | 202 ± 87 ** | 738 ± 210 | 630 ± 136 |
| Glutamate | 2800 ± 149 | 1068 ± 271 *** | 887 ± 118 | 508 ± 82 * |
| Glutamine | 88 ± 15 | 73 ± 8 | 121 ± 11 | 119 ± 17 |
| Glycerol | 5721 ± 2161 | 200642 ± 19242 *** | 5082 ± 1367 | 92500 ± 3211 *** |
| Glycerophosphocholine | 779 ± 62 | 3920 ± 214 *** | 873 ± 55 | 634 ± 22 ** |
| GSH | 171 ± 8 | 53 ± 9 *** | 41 ± 25 | 1 ± 1 |
| GTP | 5 ± 1 | 11 ± 1 ** | n/a | n/a |
| Histidine | 44 ± 4 | 94 ± 13 ** | 53 ± 18 | 292 ± 30 |
| Hypoxanthine | 39 ± 5 | 280 ± 22 *** | 21 ± 4 | 57 ± 8 *** |
| Inosinate | 36 ± 8 | 7 ± 2 ** | 129 ± 33 | 166 ± 36 ** |
| Inosine | 8 ± 1 | 32 ± 5 ** | 24 ± 9 | 96 ± 25 |
| Isoleucine | 33 ± 4 | 89 ± 20 * | 36 ± 7 | 51 ± 7 * |
| Lactate | 878 ± 270 | 2268 ± 371 * | 5705 ± 2273 | 2302 ± 158 |
| Leucine | 104 ± 13 | 273 ± 47 ** | 79 ± 17 | 133 ± 38 |
| Lysine | 122 ± 37 | 254 ± 44 | n/a | n/a |
| Malic acid | 809 ± 108 | 380 ± 58 ** | n/a | n/a |
| Mannose | 123 ± 39 | 20 ± 3 * | 43 ± 7 | 1 ± 1 * |
| Me-Histidine | n/a | n/a | 242 ± 74 | 128 ± 22 |
| Methionine sulfoxide | 20 ± 3 | 53 ± 14 | n/a | n/a |
| Myo-inositol | 10812 ± 493 | 19365 ± 967 *** | 6219 ± 562 | 6155 ± 710 |
| NAD | 25 ± 5 | 40 ± 3 * | 46 ± 12 | 11 ± 4 * |
| NADH | 6 ± 2 | n/a ** | n/a | n/a |
| NADPH | 4 ± 1 | 2 ± 1 | n/a | n/a |
| Nicotinamide | 21 ± 4 | 90 ± 3 *** | 13 ± 8 | 4 ± 4 |
| Ornithine | 74 ± 10 | 174 ± 36 * | 233 ± 24 | 157 ± 7 * |
| Phenylalanine | 20 ± 5 | 56 ± 15 | 17 ± 4 | 52 ± 10 * |
| Phosphocholine | 44 ± 8 | 62 ± 9 | 48 ± 9 | 24 ± 4 * |
| Pyruvate | 4 ± 1 | 4 ± 1 | 23 ± 5 | 4 ± 1 ** |
| S-adenosylhomocysteine | 1 ± 1 | 10 ± 1 *** | n/a | n/a |
| Serine-phosphoethanolamine | n/a | n/a | 3210 ± 249 | 1668 ± 132 *** |
| Scillo-inositol | 73 ± 10 | 172 ± 18 ** | 159 ± 15 | 121 ± 15 |
| Succinate | 119 ± 27 | 103 ± 29 | 16 ± 2 | 8 ± 1 ** |
| Threonine | 91 ± 11 | 574 ± 50 *** | 283 ± 50 | 273 ± 46 |
| Tyrosine | 20 ± 6 | 93 ± 19 ** | 15 ± 5 | 58 ± 9 ** |
| UMP | 20 ± 1 | 1 ± 1 *** | n/a | n/a |
| Uracyl | 16 ± 2 | 25 ± 5 | n/a | n/a |
| Uridine | 9 ± 2 | 53 ± 11 ** | n/a | n/a |
| Valine | 119 ± 25 | 288 ± 48 * | 61 ± 10 | 117 ± 15 * |
Publisher’s Note: MDPI stays neutral with regard to jurisdictional claims in published maps and institutional affiliations. |
© 2021 by the authors. Licensee MDPI, Basel, Switzerland. This article is an open access article distributed under the terms and conditions of the Creative Commons Attribution (CC BY) license (https://creativecommons.org/licenses/by/4.0/).
Share and Cite
Shekhovtsov, S.V.; Bulakhova, N.A.; Tsentalovich, Y.P.; Zelentsova, E.A.; Meshcheryakova, E.N.; Poluboyarova, T.V.; Berman, D.I. Biochemical Response to Freezing in the Siberian Salamander Salamandrella keyserlingii. Biology 2021, 10, 1172. https://doi.org/10.3390/biology10111172
Shekhovtsov SV, Bulakhova NA, Tsentalovich YP, Zelentsova EA, Meshcheryakova EN, Poluboyarova TV, Berman DI. Biochemical Response to Freezing in the Siberian Salamander Salamandrella keyserlingii. Biology. 2021; 10(11):1172. https://doi.org/10.3390/biology10111172
Chicago/Turabian StyleShekhovtsov, Sergei V., Nina A. Bulakhova, Yuri P. Tsentalovich, Ekaterina A. Zelentsova, Ekaterina N. Meshcheryakova, Tatiana V. Poluboyarova, and Daniil I. Berman. 2021. "Biochemical Response to Freezing in the Siberian Salamander Salamandrella keyserlingii" Biology 10, no. 11: 1172. https://doi.org/10.3390/biology10111172
APA StyleShekhovtsov, S. V., Bulakhova, N. A., Tsentalovich, Y. P., Zelentsova, E. A., Meshcheryakova, E. N., Poluboyarova, T. V., & Berman, D. I. (2021). Biochemical Response to Freezing in the Siberian Salamander Salamandrella keyserlingii. Biology, 10(11), 1172. https://doi.org/10.3390/biology10111172