
Assessment of Anthropometric Indices for Optimal Cut-Offs for Obesity Screening in a South African Adolescent Population

 ,
,  , , , and
Abstract
:Simple Summary
Abstract
1. Introduction
2. Materials and Methods
2.1. Study Population and Design
2.2. Ethical Consideration
2.3. Anthropometric Measurements
2.4. Data and Statistical Analysis
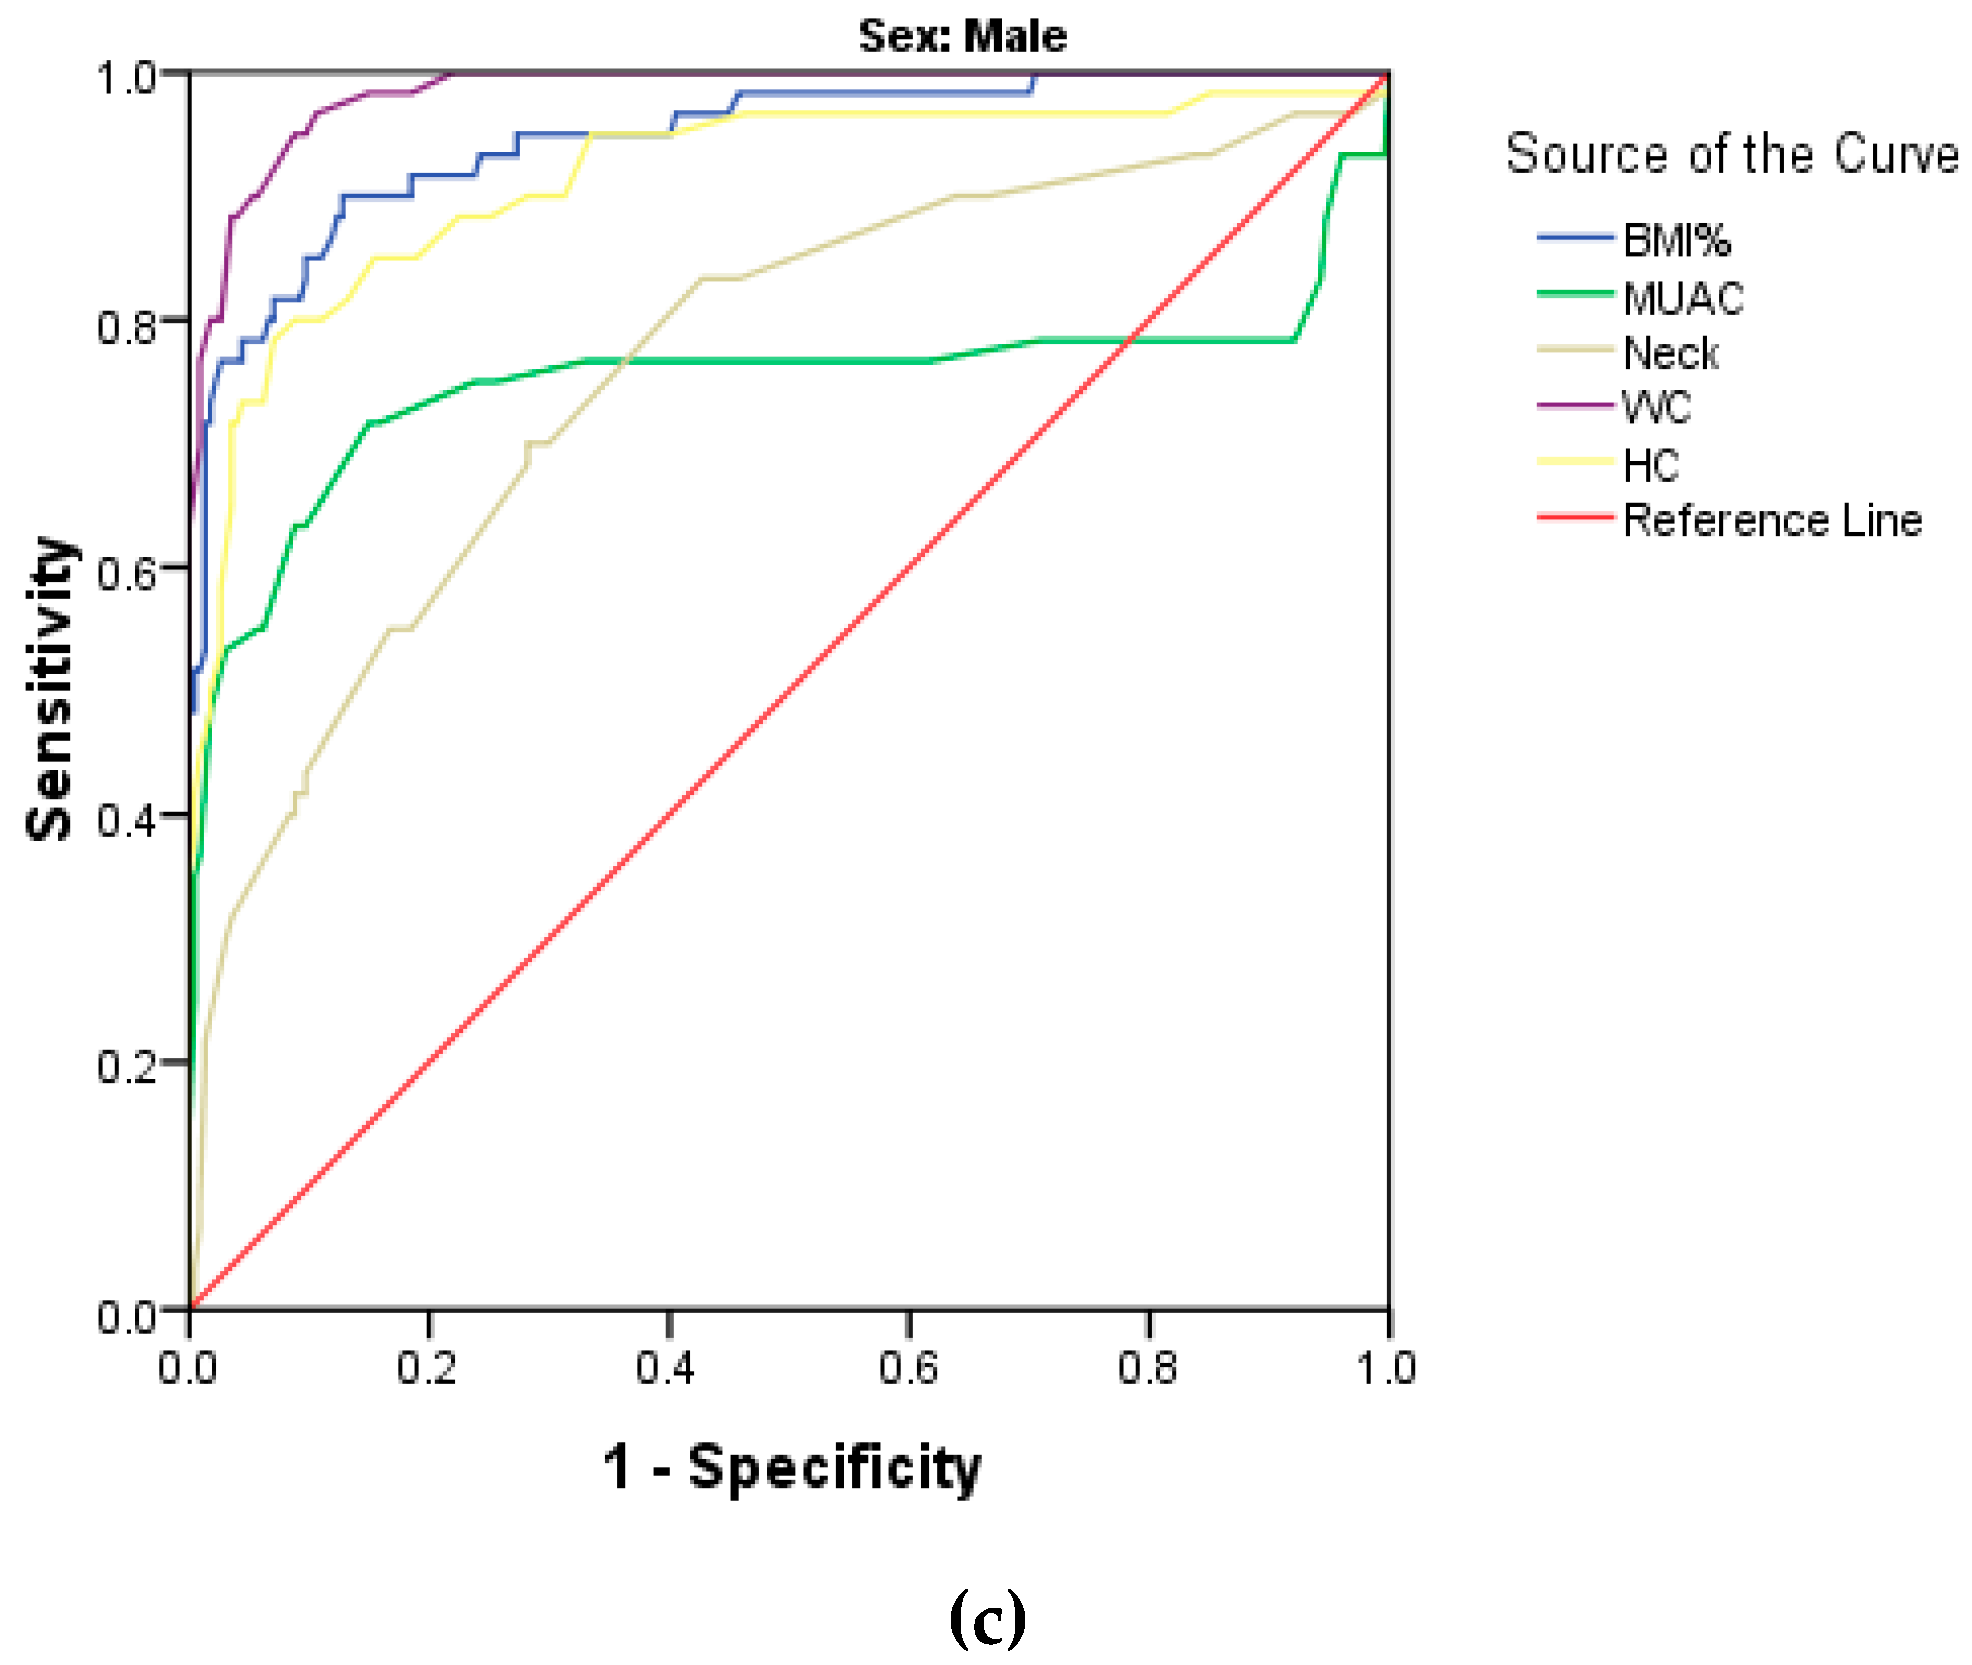
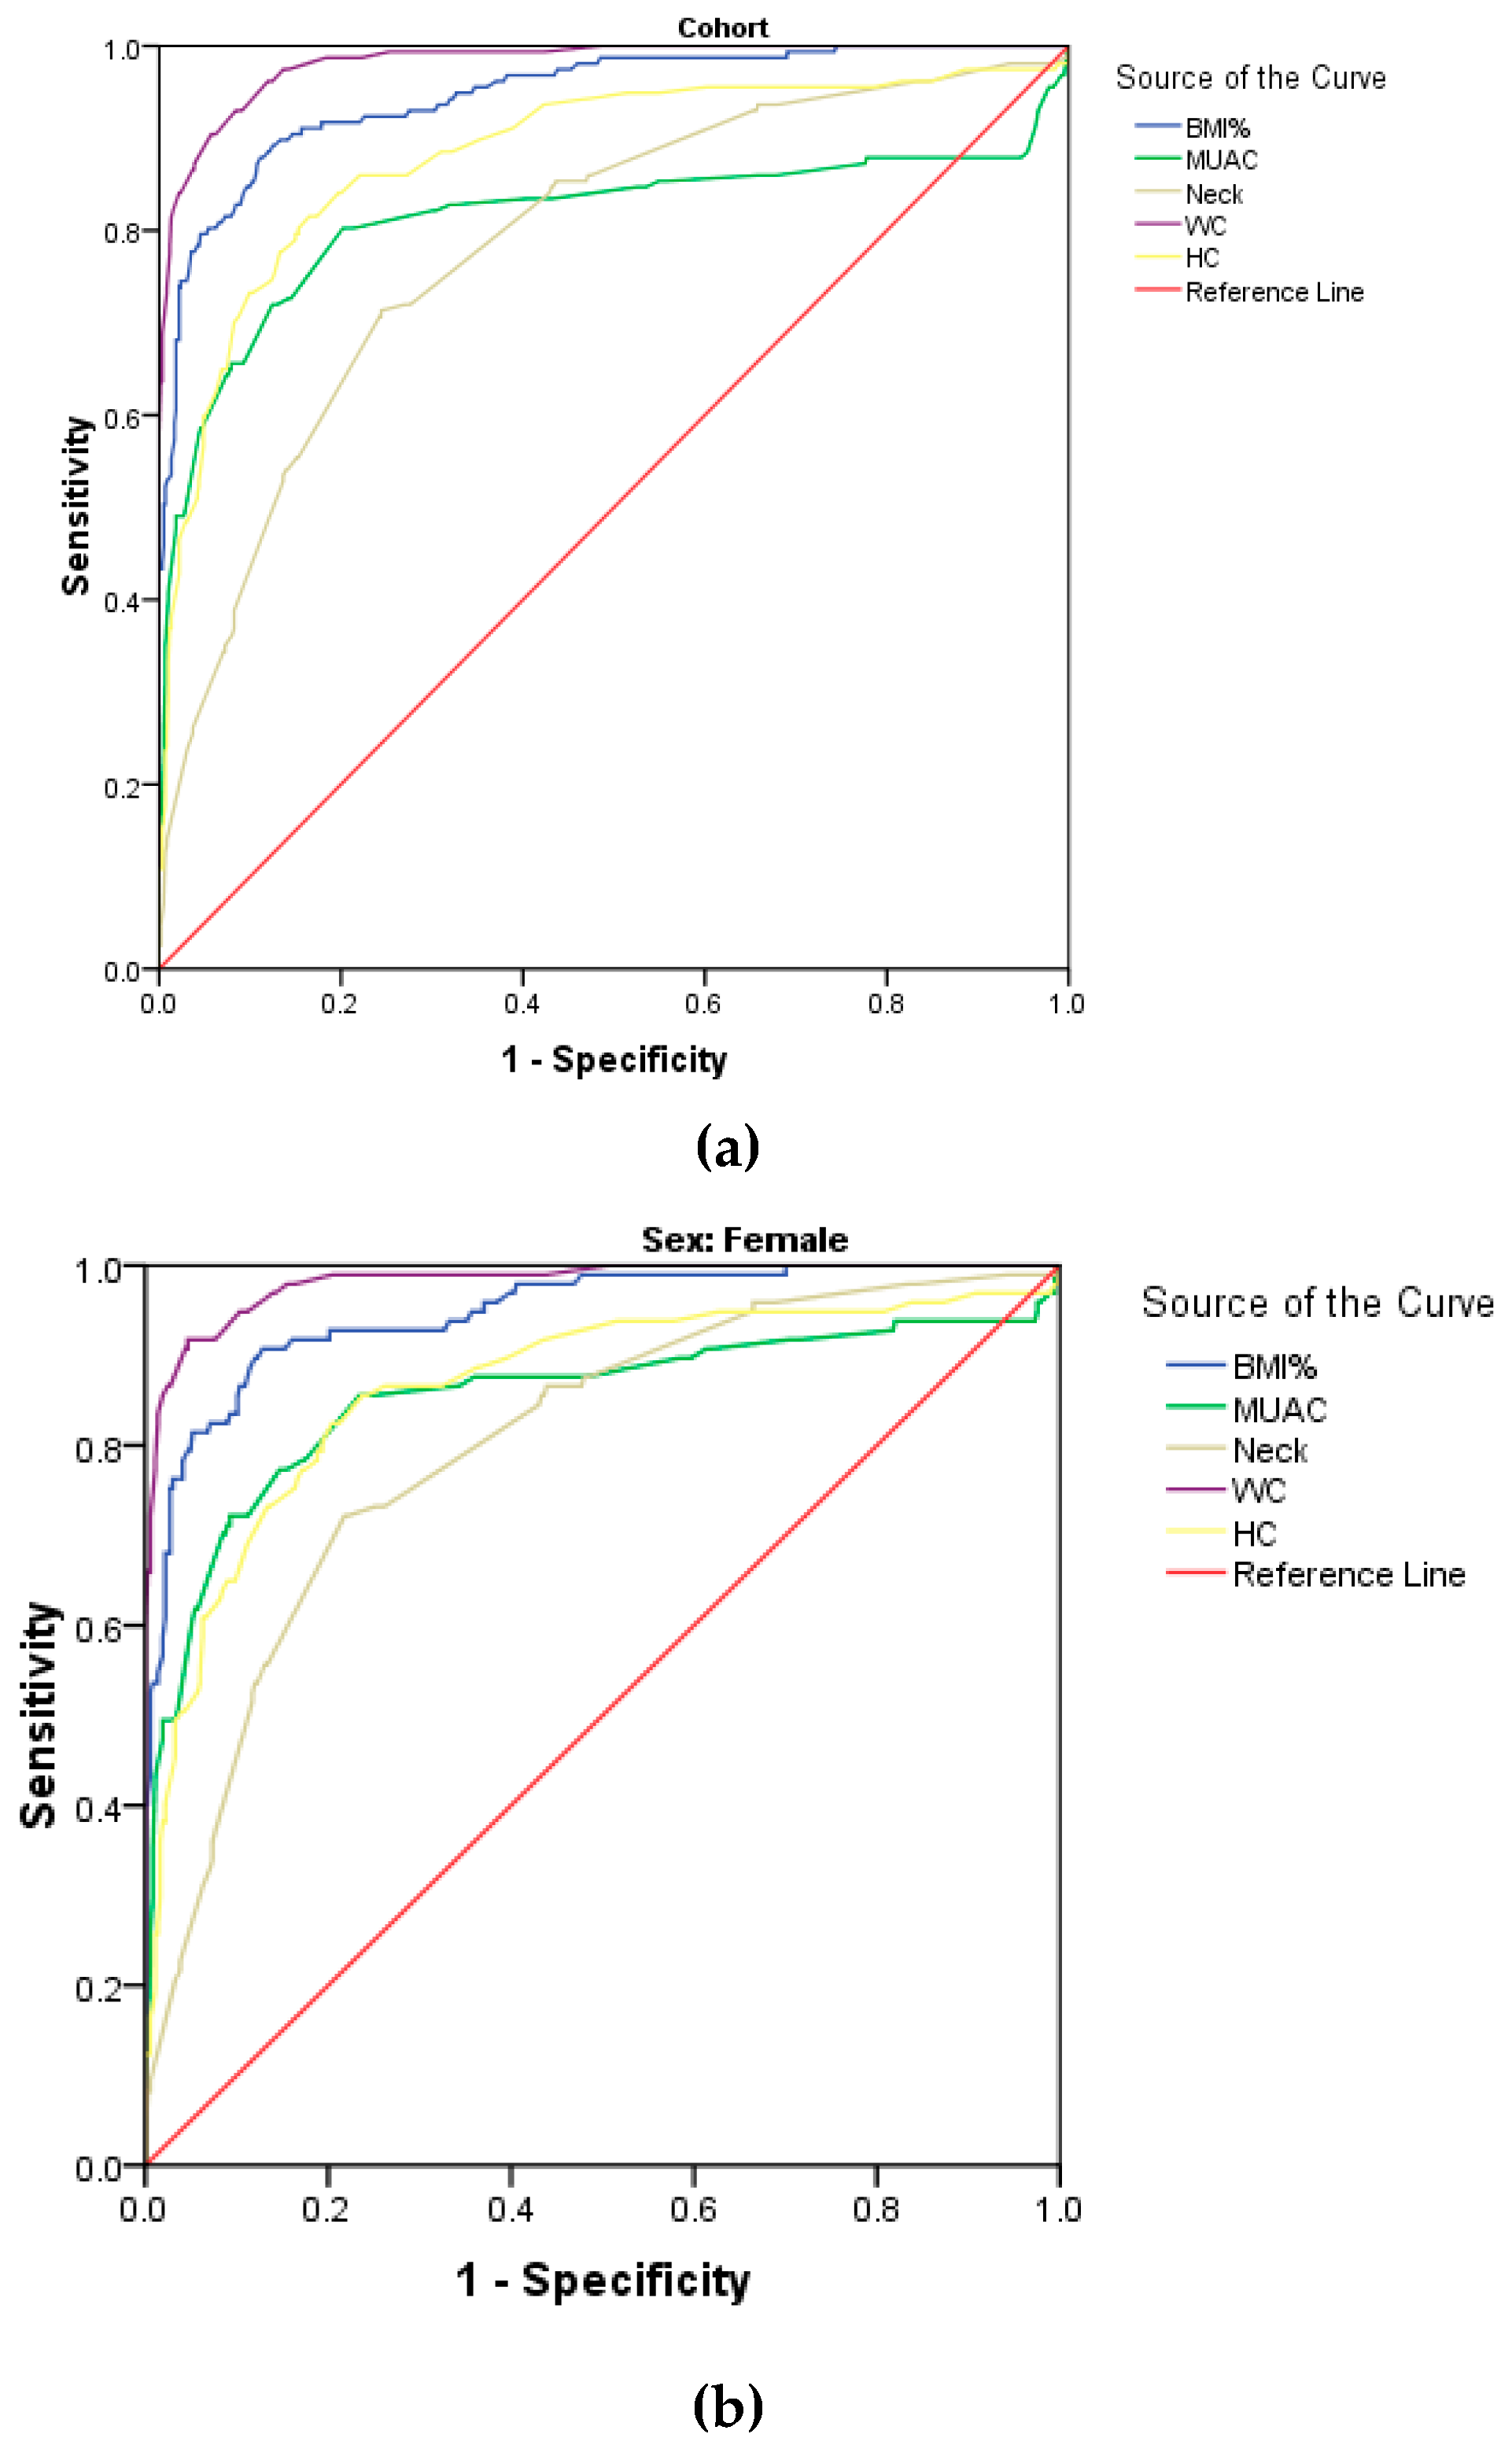
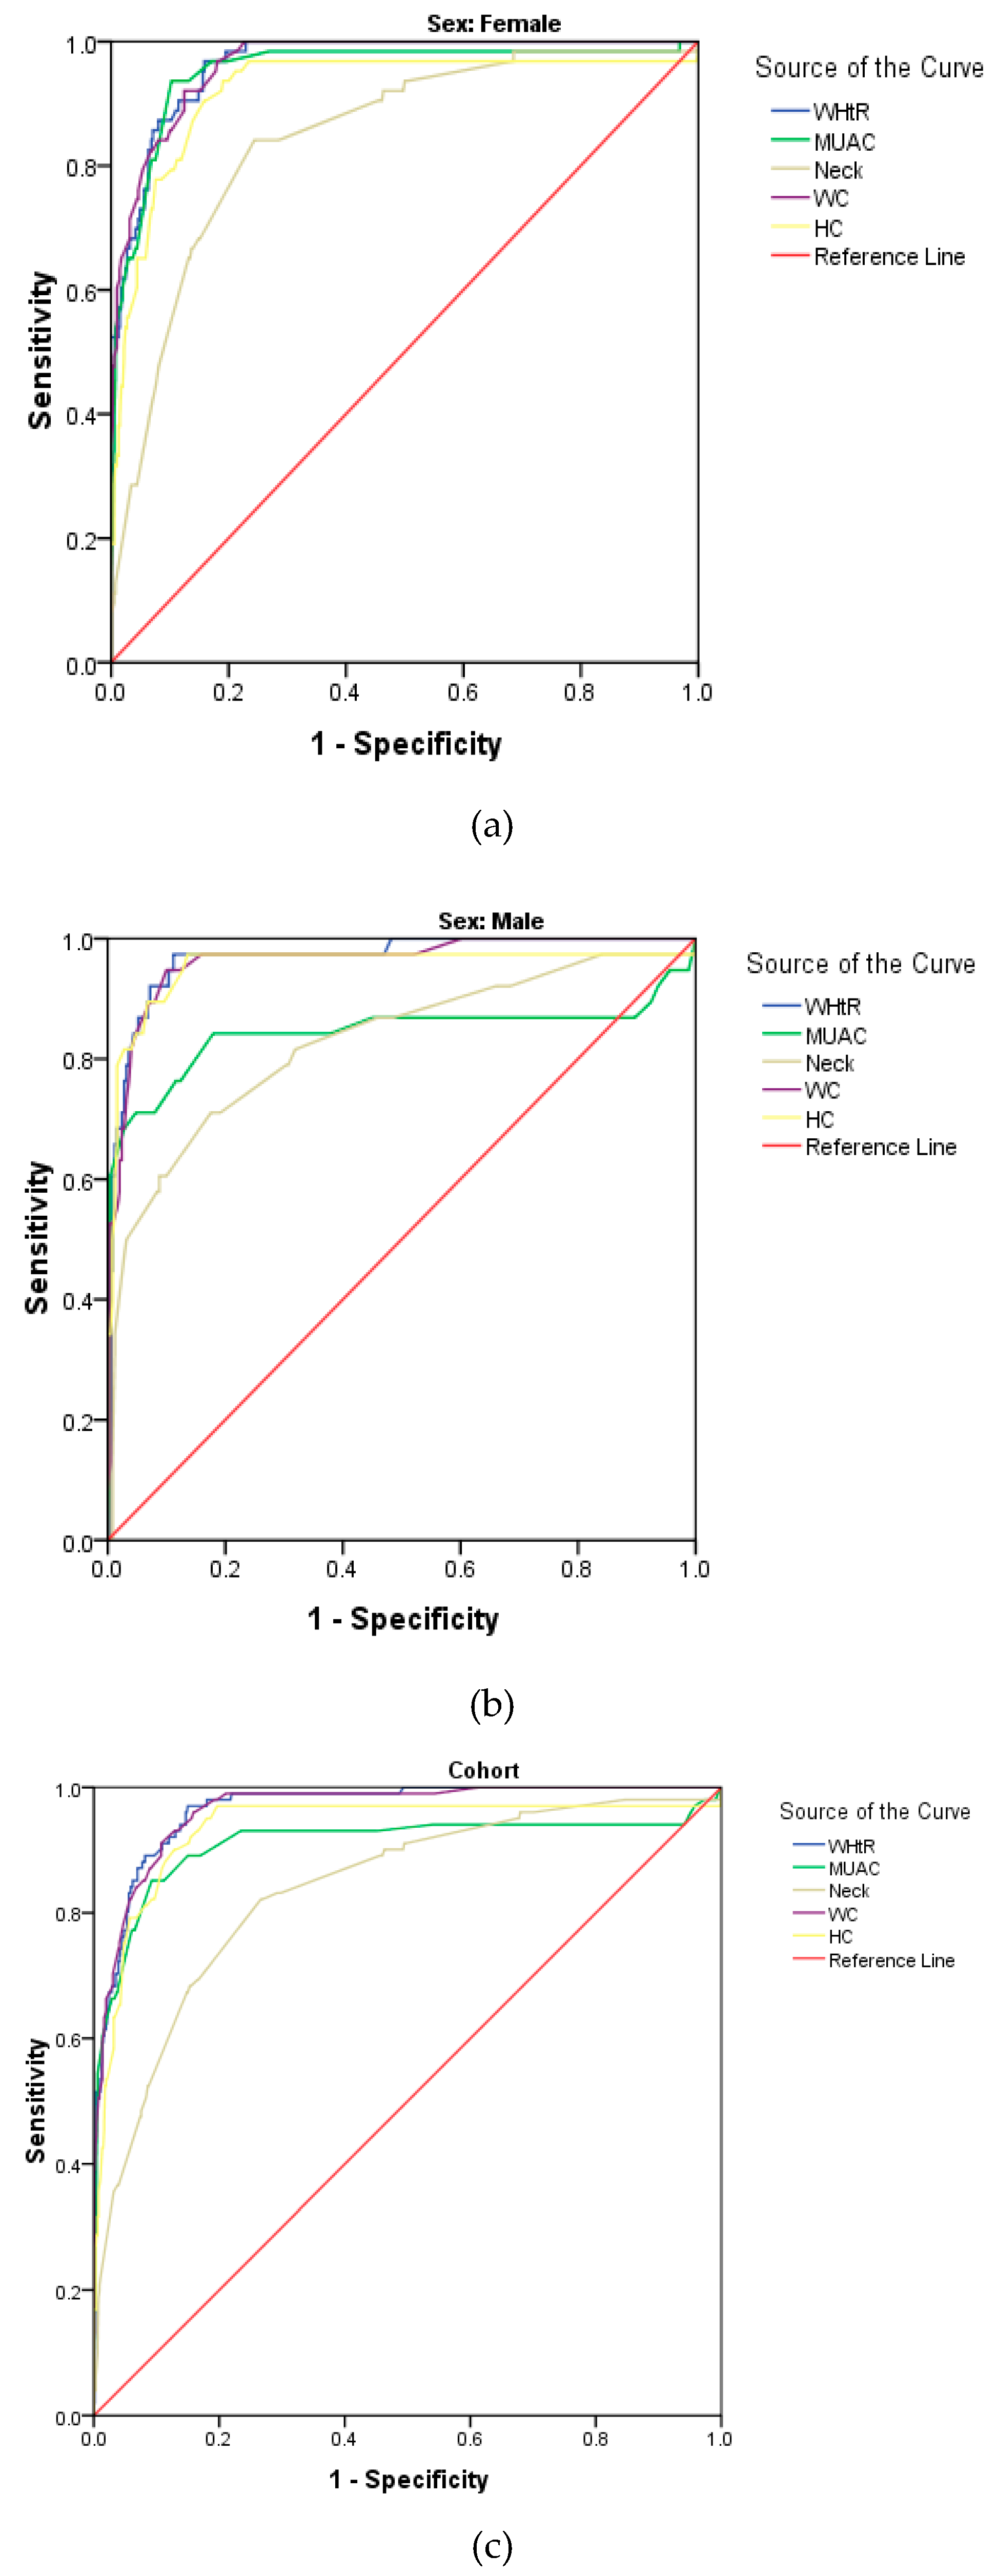
3. Results
4. Discussion
5. Conclusions
Author Contributions
Funding
Institutional Review Board Statement
Informed Consent Statement
Data Availability Statement
Acknowledgments
Conflicts of Interest
References
- Di Cesare, M.; Sorić, M.; Bovet, P.; Miranda, J.J.; Bhutta, Z.; Stevens, G.A.; Laxmaiah, A.; Kengne, A.P.; Bentham, J. The epidemiological burden of obesity in childhood: A worldwide epidemic requiring urgent action. BMC Med. 2019, 17, 212. [Google Scholar] [CrossRef] [PubMed] [Green Version]
- Development Initiatives. 2018 Global Nutrition Report: Shining a Light to Spur Action on Nutrition. Development Initiatives Poverty Research Ltd.: Bristol, UK, 2018; Available online: https://globalnutritionreport.org/ (accessed on 2 April 2019).
- Lobstein, T.; Jackson-Leach, R.; Moodie, M.L.; Hall, K.D.; Gortmaker, S.L.; Swinburn, B.A. Child and adolescent obesity: Part of a bigger picture. Lancet 2015, 385, 2510–2520. [Google Scholar] [CrossRef] [Green Version]
- Friedemann, C.; Heneghan, C.; Mahtani, K.; Thompson, M.; Perera, R.; Ward, A.M. Cardiovascular disease risk in healthy children and its association with body mass index: Systematic review and meta-analysis. BMJ 2012, 345, e4759. [Google Scholar] [CrossRef] [PubMed] [Green Version]
- Nkeh-Chungag, B.N.; Sekokotla, A.M.; Sewani-Rusike, C.; Namugowa, A.; Iputo, E. Prevalence of hypertension and prehypertension in 13–17 year old adolescents living in Mthatha–South Africa: A cross-sectional. Cent. Eur. J. Public Health 2015, 23, 59–64. [Google Scholar] [CrossRef] [Green Version]
- Matjuda, E.N.; Engwa, G.A.; Anye, S.N.C.; Nkeh-Chungag, B.N.; Goswami, N. Cardiovascular Risk Factors and Their Relationship with Vascular Dysfunction in South African Children of African Ancestry. J. Clin. Med. 2021, 10, 354. [Google Scholar] [CrossRef] [PubMed]
- Cook, S.; Kavey, R.E. Dyslipidemia and pediatric obesity. Pediatr. Clin. Nutr. Am. 2011, 58, 1363–1373. [Google Scholar] [CrossRef] [Green Version]
- Brady, T.M. Obesity-related hypertension in children. Front. Pediatr. 2017, 5, 197. [Google Scholar] [CrossRef] [Green Version]
- Matjuda, E.N.; Sewani-Rusike, C.R.; Anye, S.N.C.; Engwa, G.A.; Nkeh-Chungag, B.N. Relationship between High Blood Pressure and Microalbuminuria in Children Aged 6–9 Years in a South African Population. Children 2020, 7, 131. [Google Scholar] [CrossRef]
- Pulgaron, E.R.; Delamater, A.M. Obesity and type 2 diabetes in children: Epidemiology and treatment. Curr. Diab. Rep. 2014, 14, 508. [Google Scholar] [CrossRef] [Green Version]
- Kodama, S.; Horikawa, C.; Fujihara, K.; Heianza, Y.; Hirasawa, R.; Yachi, T. Comparisons of the strength of associations with future type 2 diabetes risk among anthropometric obesity indicators, including waist-to-height ratio: A meta-analysis. Am. J. Epidemiol. 2012, 176, 959–969. [Google Scholar] [CrossRef] [Green Version]
- Raj, M. Obesity and cardiovascular risk in children and adolescents. Indian J. Endocr. Metab. 2012, 16, 13–19. [Google Scholar] [CrossRef]
- Krul, M.; van der Wouden, J.C.; Schellevis, F.G.; van Suijlekom-Smit, L.W.A.; Koes, B.W. Musculoskeletal problems in overweight and obese children. Ann. Fam. Med. 2009, 7, 352–356. [Google Scholar] [CrossRef]
- Park, M.H.; Falconer, C.; Viner, R.M.; Kinra, S. The impact of childhood obesity on morbidity and mortality in adulthood: A systematic review. Obes. Rev. 2012, 13, 985–1000. [Google Scholar] [CrossRef]
- Krebs, N.F.; Himes, J.H.; Jacobson, D.; Nicklas, T.A.; Guilday, P.; Styne, D. Assessment of Child and Adolescent Overweight and Obesity. Pediatr. 2007, 120, S193. [Google Scholar] [CrossRef] [PubMed] [Green Version]
- Santomauro, F.; Lorini, C.; Pieralli, F.; Niccolai, G.; Picciolli, P.; Vezzosi, S.; Bonaccorsi, G. Waist-to-height ratio and its associations with body mass index in a sample of Tuscan children in primary school. Ital. J. Pediatr. 2017, 43, 53. [Google Scholar] [CrossRef] [PubMed]
- De Almeida, C.A.; Del Ciampo, L.A.; Ricco, R.G.; Silva, S.M.; Naves, R.B.; Pina, J.F. Assessment of mid-upper arm circumference as a method for obesity screening in preschool children. J. Pediatr. 2003, 79, 455–460. [Google Scholar] [CrossRef]
- Nafiu, O.O.; Burke, C.; Lee, J.; Voepel-Lewis, T.; Malviya, S.; Tremper, K.K. Neck circumference as a screening measure for identifying children with high body mass index. Pediatrics 2010, 126, e306–e310. [Google Scholar] [CrossRef]
- Lear, S.A.; James, P.T.; Ko, G.T.; Kumanyika, S. Appropriateness of waist circumference and waist-to-hip ratio cutoffs for different ethnic groups. Eur. J. Clin. Nutr. 2010, 64, 42–61. [Google Scholar] [CrossRef] [PubMed] [Green Version]
- Lee, C.M.Y.; Huxley, R.R.; Wildman, R.P.; Woodward, M. Indices of abdominal obesity are better discriminators of cardiovascular risk factors than BMI: A meta-analysis. J. Clin. Epidemiol. 2008, 61, 646–653. [Google Scholar] [CrossRef]
- Ashwell, M.; Hsieh, S.D. Six reasons why the waist-to-height ratio is a rapid and effective global indicator for health risks of obesity and how its use could simplify the international public health message on obesity. Int. J. Food Sci. Nutr. 2005, 56, 303–307. [Google Scholar] [CrossRef] [PubMed]
- Arnaiz, P.; Grob, F.; Cavada, G.; Domínguez, A.; Bancalari, R.; Cerda, V.; Zamorano, J.; Fernández, M.; García, H. Waist-to-height ratio does not change with gender, age and pubertal stage in elementary school children. Rev. Med. Chile 2014, 142, 574–578. [Google Scholar] [CrossRef] [PubMed]
- Sijtsma, A.; Bocca, G.; L’abée, C.; Liem, E.T.; Sauer, P.J.; Corpeleijn, E. Waist-to height ratio, waist circumference and BMI as indicators of percentage fat mass and cardiometabolic risk factors in children aged 3–7 years. Clin. Nutr. 2014, 33, 311–315. [Google Scholar] [CrossRef] [Green Version]
- De Onis, M.; Onyango, A.W.; Borghi, E.; Siyam, A.; Nishida, C.; Siekmann, J. Development of a WHO growth reference for school-aged children and adolescents. Bull. WHO 2007, 85, 660. [Google Scholar] [CrossRef]
- Kuczmarski, R.J.; Ogden, C.L.; Guo, S.S. 2000 CDC growth charts for the United States: Methods and development. Vital Health Stat. 2002, 11, 1–190. [Google Scholar]
- Cole, T.J.; Bellizzi, M.C.; Flegal, K.M.; Dietz, W.H. Establishing a standard definition for child overweight and obesity worldwide: International survey. Br. Med. J. 2000, 320, 1240–1243. [Google Scholar] [CrossRef] [Green Version]
- Ashwell, M.; Gunn, P.; Gibson, S. Waist-to-height ratio is a better screening tool than waist circumference and BMI for adult cardiometabolic risk factors: Systematic review and meta-analysis. Obes. Rev. 2012, 13, 275–286. [Google Scholar] [CrossRef]
- Ekoru, K.; Murphy, G.A.V.; Young, E.H.; Delisle, H.; Jerome, C.S.; Assah, F.; Longo–Mbenza, B.; Nzambi, J.P.D.; On’Kin, J.B.K.; Buntix, F. Deriving an optimal threshold of waist circumference for detecting cardiometabolic risk in sub-Saharan Africa. Int. J. Obes. 2018, 42, 487–494. [Google Scholar] [CrossRef] [Green Version]
- Prioreschi, A.; Munthali, R.J.; Kagura, J.; Said, M.R.; De Lucia, R.E.; Micklesfield, L.K. The associations between adult body composition and abdominal adiposity outcomes, and relative weight gain and linear growth from birth to age 22 in the Birth to Twenty Plus cohort, South Africa. PLoS ONE 2018, 13, e0190483. [Google Scholar] [CrossRef] [Green Version]
- Lear, S.A.; Toma, M.; Birmingham, C.L.; Frohlich, J.J. Modification of the relationship between simple anthropometric indices and risk factors by ethnic background. Metabolism 2003, 52, 1295–1301. [Google Scholar] [CrossRef]
- Otitoola, O.; Oldewage-Theron, W.; Egal, A. Prevalence of overweight and obesity among selected schoolchildren and adolescents in Cofimvaba, South Africa. South Afr. J. Clin. Nutr. 2020, 33, 1–6. [Google Scholar] [CrossRef] [Green Version]
- Sekokotla, M.A.; Goswami, N.; Sewani-Rusike, C.R.; Iputo, J.E.; Nkeh-Chungag, B.N. Prevalence of metabolic syndrome in adolescents living in Mthatha, South Africa. Ther. Clin. Risk Manag. 2017, 13, 131–137. [Google Scholar] [CrossRef] [Green Version]
- Matjuda, E.N.; Engwa, G.A.; Letswalo, P.B.; Mungamba, M.M.; Sewani-Rusike, C.R.; Nkeh-Chungag, B.N. Association of Hypertension and Obesity with Risk Factors of Cardiovascular Diseases in Children Aged 6–9 Years Old in the Eastern Cape Province of South Africa. Children 2020, 7, 25. [Google Scholar] [CrossRef] [Green Version]
- Letswalo, B.P.; Schmid-Zalaudek, K.; Brix, B.; Matjuda, E.N.; Klosz, F.; Obernhumer, N.; Engwa, A.G.; Gaisl, M.; Sewani-Rusike, C.; Fredriksen, P.M.; et al. Cardiometabolic risk factors and early indicators of vascular dysfunction: A cross-sectional cohort study in South African adolescents. BMJ Open 2021, 11, e042955. [Google Scholar] [CrossRef] [PubMed]
- Stewart, A.; Marfell-Jones, M.; Olds, T.; Ridder, H. International Standards for Anthropometric Assessment; ISAK: Lower Hutt, New Zealand, 2011. [Google Scholar]
- Centers for Disease Control and Prevention. A SAS Program for the 2000 CDC Growth Charts (ages 0 to <20 years); Division of Nutrition, Physical Activity, and Obesity, National Center for Chronic Disease Prevention and Health Promotion, Centers for Disease Control and Prevention: Atlanta, GA, USA, 2014. [Google Scholar]
- Kumar, R.; Indrayan, A. Receiver Operating Characteristic (ROC) Curve for Medical Researchers. Indian Pediatr. 2011, 48, 277–287. [Google Scholar] [CrossRef] [PubMed]
- Negash, S.; Agyemang, C.; Matsha, T.E.; Peer, N.; Erasmus, R.T.; Kengne, A.P. Differential prevalence and associations of overweight and obesity by gender and population group among school learners in South Africa: A cross-sectional study. BMC Obes. 2017, 4, 29. [Google Scholar]
- Umer, A.; Kelley, G.A.; Cottrell, L.E.; Giacobbi, P., Jr.; Innes, K.E.; Lilly, C.L. Childhood obesity and adult cardiovascular disease risk factors: A systematic review with meta-analysis. BMC Public Health 2017, 17, 683. [Google Scholar]
- Yoo, E.-G. Waist-to-height ratio as a screening tool for obesity and cardiometabolic risk. Korean J Pediatr. 2016, 59, 425–431. [Google Scholar] [CrossRef]
- Adom, T.; Kengne, A.P.; De Villiers, A.; Boatin, R.; Puoane, T. Diagnostic Accuracy of Body Mass Index in Defining Childhood Obesity: Analysis of Cross-Sectional Data from Ghanaian Children. Int. J. Environ. Res. Public Health 2020, 17, 36. [Google Scholar] [CrossRef] [Green Version]
- Browning, L.M.; Hsieh, S.D.; Ashwell, M. A systematic review of waist-to-height ratio as a screening tool for the prediction of cardiovascular disease and diabetes: 0.5 could be a suitable global boundary value. Nutr. Res. Rev. 2010, 23, 247–269. [Google Scholar] [CrossRef] [Green Version]
- Dong, J.; Wang, S.; Chu, X.; Zhao, J.; Liang, Y.Z.; Yang, Y.B.; Yan, Y.X. Optimal Cut-off Point of Waist to Height Ratio in Beijing and Its Association with Clusters of Metabolic Risk Factors. Curr. Med. Sci. 2019, 39, 330–336. [Google Scholar] [CrossRef]
- Peng, Y.; Li, W.; Wang, Y.; Bo, J.; Chen, H. The Cut-Off Point and Boundary Values of Waist-to-Height Ratio as an Indicator for Cardiovascular Risk Factors in Chinese Adults from the PURE Study. PLoS ONE 2015, 10, e0144539. [Google Scholar] [CrossRef]
- Matsha, T.E.; Kengne, A.-P.; Yako, Y.Y.; Hon, G.M.; Hassan, M.S.; Erasmus, R.T. Optimal Waist-to-Height Ratio Values for Cardiometabolic Risk Screening in an Ethnically Diverse Sample of South African Urban and Rural School Boys and Girls. PLoS ONE 2013, 8, e71133. [Google Scholar] [CrossRef] [Green Version]
- Li, H.; Ji, C.Y.; Zong, X.N.; Zhang, Y.Q. Body mass index growth curves for Chinese children and adolescents aged 0 to 18 years. Chin. J. Pediatr. 2009, 47, 493–498. [Google Scholar]
- Freedman, D.S.; Wang, J.; Maynard, L.M.; Thornton, J.C.; Mei, Z.; Pierson, R.N.; Dietz, W.H.; Horlick, M. Relation of BMI to fat and fat-free mass among children and adolescents. Int. J. Obes. 2005, 29, 1–8. [Google Scholar] [CrossRef] [Green Version]
- Chung, S. Growth and Puberty in Obese Children and Implications of Body Composition. J. Obes. Metab. Syndr. 2017, 26, 243–250. [Google Scholar] [CrossRef] [PubMed]
- Bleil, M.E.; Booth-LaForce, C.; Benner, A.D. Race Disparities in Pubertal Timing: Implications for Cardiovascular Disease Risk Among African American Women. Popul. Res. Policy Rev. 2017, 36, 717–738. [Google Scholar] [CrossRef]
- Nicolau, A.L.; de Moraes, O.G.M. Waist Circumference: A Simple Measure for Childhood Obesity? Arq. Bras. Cardiol. 2020, 114, 538–539. [Google Scholar]
- Hirschler, V.; Aranda, C.; Calcagno, M.D.L.; Maccalini, G.; Jadzinsky, M. Can Waist Circumference Identify Children with the Metabolic Syndrome? Arch. Pediatr. Adolesc. Med. 2005, 159, 740–744. [Google Scholar] [CrossRef] [PubMed] [Green Version]
- Taheri, M.; Kajbaf, T.Z.; Taheri, M.-R.; Aminzadeh, M. Neck Circumference as a Useful Marker for Screening Overweight and Obesity in Children and Adolescents. Oman Med. J. 2016, 31, 170–175. [Google Scholar] [CrossRef]
- Mazıcıoğlu, M.M.; Hatipoğlu, N.; Oztürk, A.; Ciçek, B.; Ustünbaş, H.B.; Kurtoğlu, S. Waist circumference and mid-upper arm circumference in evaluation of obesity in children aged between 6 and 17 years. J. Clin. Res. Pediatr. Endocrinol. 2010, 2, 144–150. [Google Scholar] [CrossRef]
- Chaput, J.-P.; Katzmarzyk, P.T.; Barnes, J.D.; Fogelholm, M.; Hu, G.; Kuriyan, R.; Kurpad, A.; Lambert, E.V.; Maher, C.; Maia, J.; et al. Mid-upper arm circumference as a screening tool for identifying children with obesity: A 12-country study. Pediatr. Obes. 2017, 12, 439–445. [Google Scholar] [CrossRef] [PubMed]
- Asif, M.; Aslam, M.; Altaf, S. Mid-upper-arm circumference as a screening measure for identifying children with elevated body mass index: A study for Pakistan. Korean J. Pediatr. 2018, 61, 6–11. [Google Scholar] [CrossRef] [PubMed]
- McLaren, S.; Steenkamp, L.; McCarthy, H.D.; Rutishauser-Perera, A. Screening for overweight using mid-upper arm circumference (MUAC) among children younger than two years in the Eastern Cape, South Africa. South Afr. J. Clin. Nutr. 2020, 33, 1–4. [Google Scholar] [CrossRef]


| Females (n = 796) | Males (n = 348) | ||||||
|---|---|---|---|---|---|---|---|
| Mean ± SD | CI | Min.-Max. | Mean ± SD | CI | Min.-Max. | p-Value | |
| Age (years) | 13.88 ± 1.61 | 13.77, 14.00 | 11–17 | 13.17 ± 1.70 | 12.99, 13.35 | 11–17 | 0.001 |
| Weight (kg) | 55.38 ± 15.11 | 54.32, 56.43 | 26.7–112.50 | 50.97 ± 15.32 | 49.36, 52.59 | 24.0–108.69 | 0.079 |
| Height (m) | 1.56 ± 0.08 | 1.56, 1.57 | 1.31–1.88 | 1.56 ± 0.11 | 1.55, 1.57 | 1.28–1.86 | 0.003 |
| BMI (m/h2) | 22.43 ± 5.30 | 22.06, 22.80 | 13.55–42.00 | 20.57 ± 4.73 | 20.07, 21.07 | 13.50–41.50 | 0.001 |
| pBMI | 64.83 ± 28.87 | 62.81, 66.85 | 0.6–99.8 | 56.79 ± 31.17 | 53.50, 60.09 | 0.1, 99.6 | 0.001 |
| WHtR | 0.47 ± 0.07 | 0.46, 0.47 | 0.33–0.77 | 0.45 ± 0.06 | 0.45, 0.46 | 0.35–0.71 | 0.010 |
| WC (cm) | 72.94 ± 11.10 | 72.17, 73.71 | 50.0–119.0 | 70.64 ± 10.77 | 69.50, 71.77 | 52.0–115.5 | 0.117 |
| HC (cm) | 92.05 ± 13.23 | 91.13, 92.97 | 53.0–136.5 | 85.05 ± 11.87 | 85.79, 88.30 | 49.4–128.0 | 0.001 |
| Neck (cm) | 29.9 ± 2.32 | 29.70, 30.11 | 23.5–42.5 | 29.97 ± 2.57 | 29.67, 30.27 | 22.5–38.0 | 0.342 |
| MUAC (cm) | 24.54 ± 4.44 | 24.14, 24.94 | 12.5–43.5 | 23.14 ± 4.89 | 22.58, 23.17 | 13.0–35.7 | 0.001 |
| n (%) | Category | Cohort 1144 (%) | Female 796 (%) | Male 348 (%) |
|---|---|---|---|---|
| WHtR | Non-obese | 855 (74.7) | 579 (72.7) | 276 (79.3) |
| Obese | 289 (25.3) | 217 (27.3) | 72 (20.7) | |
| pBMI | Non-obese | 967 (84.5) | 663 (83.3) | 308 (87.4) |
| Obese | 177 (15.5) | 133 (16.7) | 44 (12.6) |
| n (%) | Underweight | Normal Weight | Overweight | Obese | Total |
|---|---|---|---|---|---|
| Sex | |||||
| Female | 17 (2.1) | 508 (63.8) | 138 (17.3) | 133 (16.7) | 796 |
| Male | 20 (5.7) | 236 (67.8) | 48 (13.8) | 44 (12.6) | 348 |
| Cohort (total) | 37 (3.2) | 744 (65.0) | 186 (16.3) | 177 (15.5) | 1144 |
| Age | |||||
| 11 | 6 (5.9) | 59 (58.4) | 21 (20.8) | 15 (14.9) | 101 |
| 12 | 12 (5.6) | 155 (72.4) | 24 (11.2) | 23 (10.7) | 214 |
| 13 | 9 (3.2) | 193 (68.9) | 38 (13.6) | 40 (14.3) | 280 |
| 14 | 4 (2.2) | 119 (65.7) | 27 (14.9) | 31 (17.1) | 181 |
| 15 | 5 (3.0) | 98 (59.0) | 39 (23.5) | 24 (14.5) | 166 |
| 16 | 1 (0.7) | 83 (58.5) | 23 (16.2) | 35 (24.6) | 142 |
| 17 | 0 (0.0) | 37 (61.7) | 14 (23.3) | 9 (15.0) | 60 |
| Cohort (total) | 37 (3.2) | 744 (65.0) | 186 (16.3) | 177 (15.5) | 1144 |
| WHtR | |||||||
|---|---|---|---|---|---|---|---|
| Cohort | Female | Male | |||||
| Obese (%) | Non-obese (%) | Obese (%) | Non-obese (%) | Obese (%) | Non-obese (%) | ||
| Obese | 156 (54.0) | 21 (2.5) | 115 (53.0) | 18 (3.1) | 41 (56.9) | 3 (1.1) | |
| pBMI | Non-obese | 133 (46.0) | 834 (97.5) | 102 (47.0) | 561 (96.9) | 31 (43.1) | 273 (98.9) |
| Total | 289 | 855 | 217 | 579 | 72 | 276 | |
| Cohort | Female | Male | |||||
| Sensitivity% | Specificity% | Sensitivity% | Specificity% | Sensitivity% | Specificity% | ||
| pBMI | 54.0 | 97.5 | 53.0 | 96.9 | 56.9 | 98.9 |
| Cut-off | Sensitivity% | Specificity% | AUC | SE | 95%CI | |
|---|---|---|---|---|---|---|
| Cohort | ||||||
| NC | 30.6 | 71.3 | 77.6 | 0.786 | 0.021 | 0.745–0.827 |
| MUAC | 25.9 | 80.3 | 79.8 | 0.813 | 0.026 | 0.762–0.865 |
| WC | 75.1 | 90.4 | 89.4 | 0.982 | 0.004 | 0.974–0.991 |
| HC | 92.15 | 80.3 | 84.7 | 0.883 | 0.018 | 0.848–0.917 |
| pBMI | 85.2 | 87.9 | 88.9 | 0.947 | 0.010 | 0.927–0.967 |
| pBMIr | 95.1 | 57.3 | 98.3 | 0.947 | 0.010 | 0.927–0.967 |
| Female | ||||||
| NC | 30.70 | 72.2 | 77.9 | 0.801 | 0.025 | 0.752–0.851 |
| MUAC | 25.55 | 85.6 | 76.3 | 0.853 | 0.028 | 0.798–0.908 |
| WC | 76.1 | 91.8 | 95.4 | 0.982 | 0.006 | 0.970–0.994 |
| HC | 90.25 | 85.6 | 75.7 | 0.864 | 0.024 | 0.817–0.912 |
| pBMI | 84.45 | 90.7 | 87.2 | 0.947 | 0.013 | 0.922–0.972 |
| pBMIr | 95.1 | 56.7 | 98.1 | 0.947 | 0.013 | 0.922–0.972 |
| Male | ||||||
| NC | 30.6 | 70.0 | 85.4 | 0.764 | 0.037 | 0.691–0.837 |
| MUAC | 25.90 | 71.7 | 85.0 | 0.749 | 0.050 | 0.650–0.847 |
| WC | 73.25 | 95.0 | 91.2 | 0.985 | 0.006 | 0.973–0.996 |
| HC | 93.50 | 78.3 | 93.0 | 0.915 | 0.025 | 0.867–0.963 |
| pBMI | 80.75 | 90.0 | 87.2 | 0.946 | 0.017 | 0.913–0.980 |
| pBMIr | 95.0 | 58.3 | 98.7 | 0.946 | 0.017 | 0.913–0.980 |
| Cut-off | Sensitivity% | Specificity% | AUC | SE | 95%CI | |
|---|---|---|---|---|---|---|
| Cohort | ||||||
| WHtR | 0.481 | 97.0 | 84.0 | 0.966 | 0.007 | 0.952–0.980 |
| NC | 30.95 | 82.2 | 73.4 | 0.837 | 0.023 | 0.793–0.882 |
| MUAC | 27.95 | 85.1 | 90.8 | 0.909 | 0.023 | 0.864–0.955 |
| WC | 76.1 | 91.1 | 89.3 | 0.965 | 0.008 | 0.949–0.980 |
| HC | 95.75 | 90.1 | 87.1 | 0.934 | 0.017 | 0.900–0.968 |
| Female | ||||||
| WHtR | 0.484 | 96.8 | 84.1 | 0.965 | 0.008 | 0.949–0.981 |
| NC | 30.95 | 84.1 | 95.6 | 0.846 | 0.026 | 0.795–0.897 |
| MUAC | 27.95 | 93.7 | 89.8 | 0.851 | 0.017 | 0.920–0.985 |
| WC | 76.1 | 92.1 | 87.6 | 0.966 | 0.008 | 0.949–0.982 |
| HC | 95.25 | 90.5 | 83.4 | 0.922 | 0.023 | 0.877–0.967 |
| Male | ||||||
| WHtR | 0.491 | 97.4 | 88.8 | 0.968 | 0.014 | 0.940–0.995 |
| NC | 31.85 | 71.1 | 82.5 | 0.827 | 0.042 | 0.745–0.909 |
| MUAC | 25.9 | 84.2 | 82.1 | 0.842 | 0.052 | 0.740–0.944 |
| WC | 75.75 | 94.7 | 90.0 | 0.963 | 0.016 | 0.932–0.995 |
| HC | 96.75 | 89.5 | 93.2 | 0.954 | 0.026 | 0.902–1.006 |
| Cohort (%) | Female (%) | Male (%) | |
|---|---|---|---|
| Ref: WHtR | |||
| NC | 263 (23.0) | 155 (19.5) | 108 (31.0) |
| MUAC | 249 (21.8) | 177 (22.3) | 77 (22.1) |
| WC | 357 (31.2) | 250 (31.4) | 107 (30.7) |
| HC | 438 (38.3) | 296 (37.2) | 89 (25.6) |
| BMI% | 352 (30.8) | 274 (34.4) | 105 (30.2) |
| Ref: pBMI | |||
| NC | 260 (22.7) | 153 (19.2) | 72 (20.7) |
| MUAC | 147 (12.9) | 101 (12.7) | 77 (22.1) |
| WC | 323 (28.2) | 250 (31.4) | 81 (23.3) |
| HC | 367 (32.1) | 290 (36.4) | 73 (21.0) |
| WHtR | 342 (29.9) | 259 (32.5) | 73 (21.0) |
| FEMALE | MALE | |||||||
|---|---|---|---|---|---|---|---|---|
| WHtR | pBMI | WC | HC | WHtR | pBMI | WC | HC | |
| 11 yrs | ||||||||
| 5th | 0.386 | 4.80 | 61.00 | 70.15 | 0.382 | 3.80 | 56.00 | 65.00 |
| 25th | 0.421 | 27.40 | 64.75 | 77.75 | 0.413 | 35.60 | 61.00 | 76.00 |
| 50th | 0.452 | 70.20 | 69.00 | 81.00 | 0.445 | 69.50 | 68.00 | 85.00 |
| 75th | 0.494 | 90.50 | 74.50 | 95.00 | 0.507 | 91.80 | 76.00 | 91.00 |
| 85th | 0.519 | 94.70 | 78.55 | 98.20 | 0.542 | 95.40 | 80.00 | 97.00 |
| 95th | 0.571 | 97.90 | 90.25 | 106.70 | 0.636 | 98.60 | 98.00 | 109.00 |
| 12 yrs | ||||||||
| 5th | 0.376 | 5.30 | 57.00 | 72.00 | 0.378 | 1.40 | 57.00 | 70.00 |
| 25th | 0.410 | 27.80 | 62.00 | 75.88 | 0.413 | 34.10 | 62.00 | 76.25 |
| 50th | 0.435 | 53.20 | 66.00 | 84.00 | 0.437 | 54.00 | 65.00 | 83.50 |
| 75th | 0.482 | 82.90 | 73.25 | 91.00 | 0.478 | 81.90 | 72.00 | 91.75 |
| 85th | 0.521 | 93.22 | 81.00 | 97.35 | 0.506 | 93.14 | 78.00 | 98.25 |
| 95th | 0.610 | 98.18 | 97.45 | 110.25 | 0.596 | 98.68 | 92.50 | 105.75 |
| 13 yrs | ||||||||
| 5th | 0.377 | 6.56 | 56.90 | 70.75 | 0.382 | 8.71 | 58.00 | 70.24 |
| 25th | 0.412 | 39.55 | 63.00 | 78.38 | 0.409 | 27.90 | 62.00 | 78.00 |
| 50th | 0.448 | 68.40 | 68.00 | 85.00 | 0.439 | 61.80 | 67.00 | 83.00 |
| 75th | 0.485 | 90.15 | 75.00 | 96.13 | 0.471 | 87.10 | 74.25 | 92.25 |
| 85th | 0.531 | 95.00 | 81.60 | 101.88 | 0.518 | 92.11 | 81.00 | 98.10 |
| 95th | 0.583 | 97.83 | 89.60 | 108.25 | 0.605 | 98.94 | 92.70 | 111.70 |
| 14 yrs | ||||||||
| 5th | 0.368 | 8.49 | 58.05 | 75.15 | 0.382 | 10.45 | 60.20 | 69.60 |
| 25th | 0.413 | 47.25 | 65.00 | 85.00 | 0.409 | 34.00 | 65.25 | 81.00 |
| 50th | 0.451 | 69.05 | 71.00 | 90.25 | 0.433 | 62.20 | 70.00 | 84.00 |
| 75th | 0.505 | 92.45 | 79.25 | 99.00 | 0.501 | 90.15 | 74.50 | 93.50 |
| 85th | 0.528 | 95.00 | 84.00 | 104.00 | 0.522 | 95.21 | 83.75 | 101.49 |
| 95th | 0.595 | 97.59 | 90.98 | 112.00 | 0.596 | 99.07 | 94.95 | 115.95 |
| 15 yrs | ||||||||
| 5th | 0.379 | 14.93 | 60.90 | 79.00 | 0.357 | 0.25 | 57.75 | 67.00 |
| 25th | 0.421 | 52.25 | 67.00 | 88.00 | 0.379 | 19.10 | 62.50 | 80.00 |
| 50th | 0.460 | 79.05 | 74.00 | 95.00 | 0.422 | 54.40 | 70.00 | 85.00 |
| 75th | 0.505 | 91.68 | 81.50 | 104.25 | 0.461 | 78.75 | 75.85 | 94.35 |
| 85th | 0.543 | 95.00 | 85.54 | 109.60 | 0.532 | 91.85 | 84.00 | 100.50 |
| 95th | 0.596 | 95.41 | 97.70 | 119.10 | 0.581 | 98.10 | 97.25 | 112.65 |
| 16 yrs | ||||||||
| 5th | 0.388 | 11.73 | 63.25 | 83.00 | 0.381 | 5.50 | 64.47 | 79.93 |
| 25th | 0.433 | 62.25 | 71.13 | 91.00 | 0.403 | 30.30 | 67.75 | 84.00 |
| 50th | 0.481 | 83.00 | 76.70 | 100.75 | 0.421 | 63.00 | 72.00 | 89.00 |
| 75th | 0.537 | 95.00 | 84.00 | 111.90 | 0.473 | 85.50 | 80.00 | 98.50 |
| 85th | 0.563 | 95.00 | 92.00 | 116.00 | 0.515 | 93.60 | 87.38 | 105.38 |
| 95th | 0.609 | 96.98 | 97.38 | 124.85 | 0.599 | 97.76 | 102.68 | 115.35 |
| 17 yrs | ||||||||
| 5th | 0.396 | 14.30 | 65.45 | 85.45 | 0.379 | 5.00 | 67.00 | 81.00 |
| 25th | 0.443 | 62.50 | 71.63 | 90.25 | 0.412 | 26.00 | 69.25 | 88.15 |
| 50th | 0.475 | 81.50 | 76.00 | 99.50 | 0.425 | 57.50 | 73.75 | 91.75 |
| 75th | 0.526 | 92.75 | 84.75 | 106.00 | 0.477 | 79.75 | 83.75 | 102.75 |
| 85th | 0.562 | 95.00 | 87.33 | 109.83 | 0.514 | 93.05 | 89.15 | 108.70 |
| 95th | 0.608 | 95.00 | 93.10 | 122.37 | 0.519 | 94.00 | 92.00 | 112.50 |
Publisher’s Note: MDPI stays neutral with regard to jurisdictional claims in published maps and institutional affiliations. |
© 2021 by the authors. Licensee MDPI, Basel, Switzerland. This article is an open access article distributed under the terms and conditions of the Creative Commons Attribution (CC BY) license (https://creativecommons.org/licenses/by/4.0/).
Share and Cite
Engwa, G.A.; Schmid-Zalaudek, K.; Anye, C.; Letswalo, B.P.; Anye, P.C.; Mungamba, M.M.; Sewani-Rusike, C.R.; Goswami, N.; Nkeh-Chungag, B.N. Assessment of Anthropometric Indices for Optimal Cut-Offs for Obesity Screening in a South African Adolescent Population. Biology 2021, 10, 1118. https://doi.org/10.3390/biology10111118
Engwa GA, Schmid-Zalaudek K, Anye C, Letswalo BP, Anye PC, Mungamba MM, Sewani-Rusike CR, Goswami N, Nkeh-Chungag BN. Assessment of Anthropometric Indices for Optimal Cut-Offs for Obesity Screening in a South African Adolescent Population. Biology. 2021; 10(11):1118. https://doi.org/10.3390/biology10111118
Chicago/Turabian StyleEngwa, Godwill Azeh, Karin Schmid-Zalaudek, Chungag Anye, Boitumelo P. Letswalo, Paul Chungag Anye, Muhau Muhulo Mungamba, Constance Rufaro Sewani-Rusike, Nandu Goswami, and Benedicta Ngwenchi Nkeh-Chungag. 2021. "Assessment of Anthropometric Indices for Optimal Cut-Offs for Obesity Screening in a South African Adolescent Population" Biology 10, no. 11: 1118. https://doi.org/10.3390/biology10111118
APA StyleEngwa, G. A., Schmid-Zalaudek, K., Anye, C., Letswalo, B. P., Anye, P. C., Mungamba, M. M., Sewani-Rusike, C. R., Goswami, N., & Nkeh-Chungag, B. N. (2021). Assessment of Anthropometric Indices for Optimal Cut-Offs for Obesity Screening in a South African Adolescent Population. Biology, 10(11), 1118. https://doi.org/10.3390/biology10111118