Article

Responses of the Soil Microbial Community to Salinity Stress in Maize Fields

1
State Key Laboratory of Water Resources and Hydropower Engineering Science, Wuhan University, Wuhan 430072, China
2
State Key Laboratory of Hybrid Rice, The Institute for Advanced Studies, Wuhan University, Wuhan 430072, China
3
College of Water Resources and Civil Engineering, China Agricultural University, Beijing 100083, China
*
Author to whom correspondence should be addressed.
Biology 2021, 10(11), 1114; https://doi.org/10.3390/biology10111114
Submission received: 27 September 2021 / Revised: 23 October 2021 / Accepted: 26 October 2021 / Published: 29 October 2021

Abstract

:

Simple Summary

Soil microorganisms are the core of maintaining soil ecological functions. Recognition of microbial community diversity in saline soil contributes to nutrient management and crop production. Meanwhile, microbial activity is easily affected by changes in soil properties. This study addressed how the composition and diversity of bacterial and fungal communities changed under different saline conditions to identify the sensitivity of bacteria or fungi to salinity. The primary objective was to evaluate the relationship between soil’s microbial community diversity and soil’s physicochemical factors, and to explore the vital microbial predictors in salinized soil. The results showed that Firmicutes and Bacteroidetes are pivotal in salinized soil, and this finding can provide guidance for the demand for plant rhizosphere growth-promoting bacteria as a bioindicator in saline soil.

Abstract

To investigate the diversity and structure of soil bacterial and fungal communities in saline soils, soil samples with three increasing salinity levels (S1, S2 and S3) were collected from a maize field in Yanqi, Xinjiang Province, China. The results showed that the K+, Na+, Ca2+ and Mg2+ values in the bulk soil were higher than those in the rhizosphere soil, with significant differences in S2 and S3 (p < 0.05). The enzyme activities of alkaline phosphatase (ALP), invertase, urease and catalase (CAT) were lower in the bulk soil than those in the rhizosphere. Principal coordinate analysis (PCoA) demonstrated that the soil microbial community structure exhibited significant differences between different salinized soils (p < 0.001). Data implied that the fungi were more susceptible to salinity stress than the bacteria based on the Shannon and Chao1 indexes. Mantel tests identified Ca2+, available phosphorus (AP), saturated electrical conductivity (ECe) and available kalium (AK) as the dominant environmental factors correlated with bacterial community structures (p < 0.001); and AP, urease, Ca2+ and ECe as the dominant factors correlated with fungal community structures (p < 0.001). The relative abundances of Firmicutes and Bacteroidetes showed positive correlations with the salinity gradient. Our findings regarding the bacteria having positive correlations with the level of salinization might be a useful biological indicator of microorganisms in saline soils.

1. Introduction

Soil salinization is a major concern of the international community, which poses a considerable threat to ecosystem health [1]. Taking China as an example, the northwest region accounts for 71% of total area, of which 70% is saline-alkali land. Meanwhile, the largest province of China is Xinjiang, and saline-alkali land accounts for more than 32.6% [2,3]. Saline soil has long been known to be an extremely harsh habitat for life; even so, some active microbial communities still exist in it [4]. It is well known that soil microbes are of pivotal importance in integral natural ecosystems, such that the abundance and activity of saline microorganisms determine the agricultural land sustainable productivity. The activity of microorganisms is directly affected by environmental changes [5]. Thus, understanding information on microbial diversity and distribution is indispensable to comprehend microbial processes in extreme agricultural ecosystems.
The microbial community is an important driving factor of soil’s biogeochemical cycle; moreover, microbial activity is easily affected by changes in soil structure and properties [6,7]. However, it is unclear whether bacteria or fungi in soil are more sensitive to increased soil salinization. Chowdhury et al. [8] reported that fungi are more sensitive to salt than bacteria, but higher sensitivity to salinity stress in bacteria has also been reported [9,10,11]. Rath et al. [12] claimed that the growth of bacteria was significantly inhibited by salinity, and yet fungal growth was unrelated to salinity, indicating a higher fungal tolerance to salinity. In addition, the dominant factor affecting bacterial and fungal community structure in saline soils is still a topic of active debate. For example, for bacteria, Hollister et al. [13] showed that the overall soil bacterial communities shared significant correlations with the soil water content, phosphorus and soil organic carbon content, rather than salinity. In contrast, salinity under halophytic vegetation was the main determinant of bacterial communities in saline-alkali land [4,12,14]. With respect to fungi, soil salinity is a decisive factor in the mangroves’ fungal community [15,16]. However, Rath et al. [12] documented that fungi respond to the indirect effects of salinity related to reduced plant C inputs. Therefore, we mainly studied the salt sensitivity of different types of saline bacteria and fungi, and attempted to determine the main environmental factors that affect the community structures.
The microbial growth and activity were negatively affected by soil salinity, such as salt toxicity and decreased water availability, leading to limited energy substrate availability for microorganisms [17,18]. Nevertheless, soil microorganisms are capable of adapting to or tolerating the osmotic stress induced by soil salinity, especially when frequently faced with such salinity stress conditions [9]. Some microorganisms also have the ability to thrive in ponds of high salinity [19], which indicates the evolutionary potential in microbes. In addition, microbial communities with high tolerance and resistance can be enriched in stressful environments. The salt-tolerant rhizospheric beneficial microorganisms are expected to be applied and promoted in the future for saline-alkali soil bioremediation.
In this study, sequencing technology was applied to investigate the diversities of soil bacterial and fungal communities in soils with three different salinities. The purposes of this research were (i) to determine how the composition and diversity of bacterial and fungal communities changed under different saline conditions, (ii) to identify the sensitivity of bacteria or fungi to salinity, (iii) to evaluate the relationships between soil microbial community diversity and soil physicochemical factors and (iv) to explore the vital microbial predictors in salinized soil.

2. Materials and Methods

2.1. Sampling and Soil Physicochemical Characteristics

Samples, including bulk and rhizosphere soil, were collected at three types (S1:0.36 ds/m; S2:3.69 ds/m; S3:6.72 ds/m) of saline soil samples in the October 2019 at Yanqi, Xinjiang Province, China (41°91′ N, 86°49′ E, elevation 1061 m). At each sampling area, apparently healthy maize plants were collected. Three replicate samples were collected at each salinity soil. Plants were uprooted with forked spades. We carefully shook off the loosely attached soil as bulk soil and brushed off the tightly attached soil to collect rhizosphere soil from each plant (total 18 soil samples). Each bulk soil (S1_BS, S2_BS, S2_BS) and rhizosphere soil sample (S1_RS, S2_RS, S2_RS) was then passed through a 2 mm mesh to remove plant roots and other plant material. During the sampling process, sterile paper was used to wipe the residue attached to the spade and disinfect before the next soil sample was collected to avoid contamination between treatments and to keep the sample fresh. At the same time as collecting the maize, bulk soil samples were collected in depth of 10–15 cm. Finally, 50 mL sterile Falcon tubes were used to store soil samples and then transferred to the laboratory [20]. All rhizosphere and bulk soil were liquid nitrogen frozen after collection.
All rhizosphere soil and bulk soil samples were split into two sub-samples in the ice. One subsample at room temperature was air dried and then sieved through a 2 mm sieve for detecting the soil properties, and the other remaining 20 g soil samples were collected and stored at −80 °C for microbial community sequencing. The soil physical and chemical parameters involving the soil electrical conductivity (ECe), pH, soil particle composition (including clay, silt, sand proportion), soil ion (including K+, Na+, Ca2+, Mg2+) values, soil organic matter (SOC) level, soil nutrition (including available nitrogen (AN), available phosphorus (AP), available potassium (AK)) and soil enzyme activity (including alkaline phosphatase (ALP), invertase, catalase (CAT) and urease) were measured using standard soil testing procedures [21,22,23]. The basic soil physical and chemical properties are shown in Table 1.

2.2. Soil DNA Extraction and Sequencing

The Power Soil DNA Isolation Kit (Omega Bio-tek, Norcross, GA, USA) was used to extract fresh soil DNA following the manufacturer’s instructions. Qubit DNA probes (Invitrogen, from Thermo Fisher Scientific, Waltham, MA, USA) were used to quantify nucleic acids, and quality was evaluated by spectrophotometry (A260/A280 ratio). In brief, to explore the bacterial and fungal communities, amplicon libraries were constructed using eubacterial primers: the V3-V4 regions of the bacterial 16S rRNA gene were amplified by 338F (5′-ACTCCTACGGGAGGCAGCAG-3′) and 806R (5′-GGACTACHVGGGTWTCTAAT-3′) primers [24,25], and the fungal internally transcribed spacer (ITS) gene was amplified using ITS1F (5′-CTTGGTCATTTAGAGGAAGTAA-3′) and ITS2R (5′-GCTGCGTTCTTCATCGATGC-3′) primers [26]. The Supplementary Materials provide sequencing data process.

2.3. Statistical Analyses

The alpha diversity (i.e., Shannon diversity, Chao1 richness and coverage) was determined using the “vegan” package in R (version 3.6.2) [27]. Soil basic indexes (ECe, pH, clay, silt, sand, K+, Na+, Ca2+, Mg2+, SOC, AN, AP, AK, ALP, invertase, urease and CAT) were evaluated using one-way ANOVA. The differences between the means were determined using the Duncan test at a probability level of p < 0.05 in SPSS (version 25.0; IBM, Armonk, NY, USA). Principal coordinate analysis (PCoA) based on Bray−Curtis similarity distances were carried out in the R package vegan [28]. Mantel tests with 999 permutations were used to examine the correlation between environmental distance and microbial community distance within the R vegan package [29]. The relationships between the soil dominant environmental factors (Ca2+, AP, ECe, AK and urease) and the soil microbial community were analyzed by using redundancy analysis (RDA). The correlations between the basic soil physical and chemical properties and the specific bacterial and fungal phyla relative abundances were analyzed by using Spearman’s analyses in the ggcorrplot package in R (version 3.6.2) [30].

3. Results

3.1. Soil Physicochemical Properties

Table 1 summarizes the diversity of soil physicochemical properties at three soil salinization levels. The bulk soil salinity varied significantly, ranging from 0.36 to 6.72 ds/m. Soils from the three salinization levels had significant differences in ECe (p < 0.05). In terms of cation content, nutrients and soil enzyme activity, the soil samples also varied from each other (Table 1). In contrast, the soil cation values were significantly elevated in S3, and the cation content in the rhizosphere soil was lower than that in the bulk soil (p < 0.05). The soil nutrient content and enzyme activity decreased with soil salinity increasing, as indicated by SOC, AN, AP, AK, ALP, invertase, urease and CAT (p < 0.05), and basically, there was no significant difference between the rhizosphere and the bulk soil for the same salinity of soil. In addition, there was no statistically significant difference in the soil particle composition for the three salinization levels (p > 0.05).

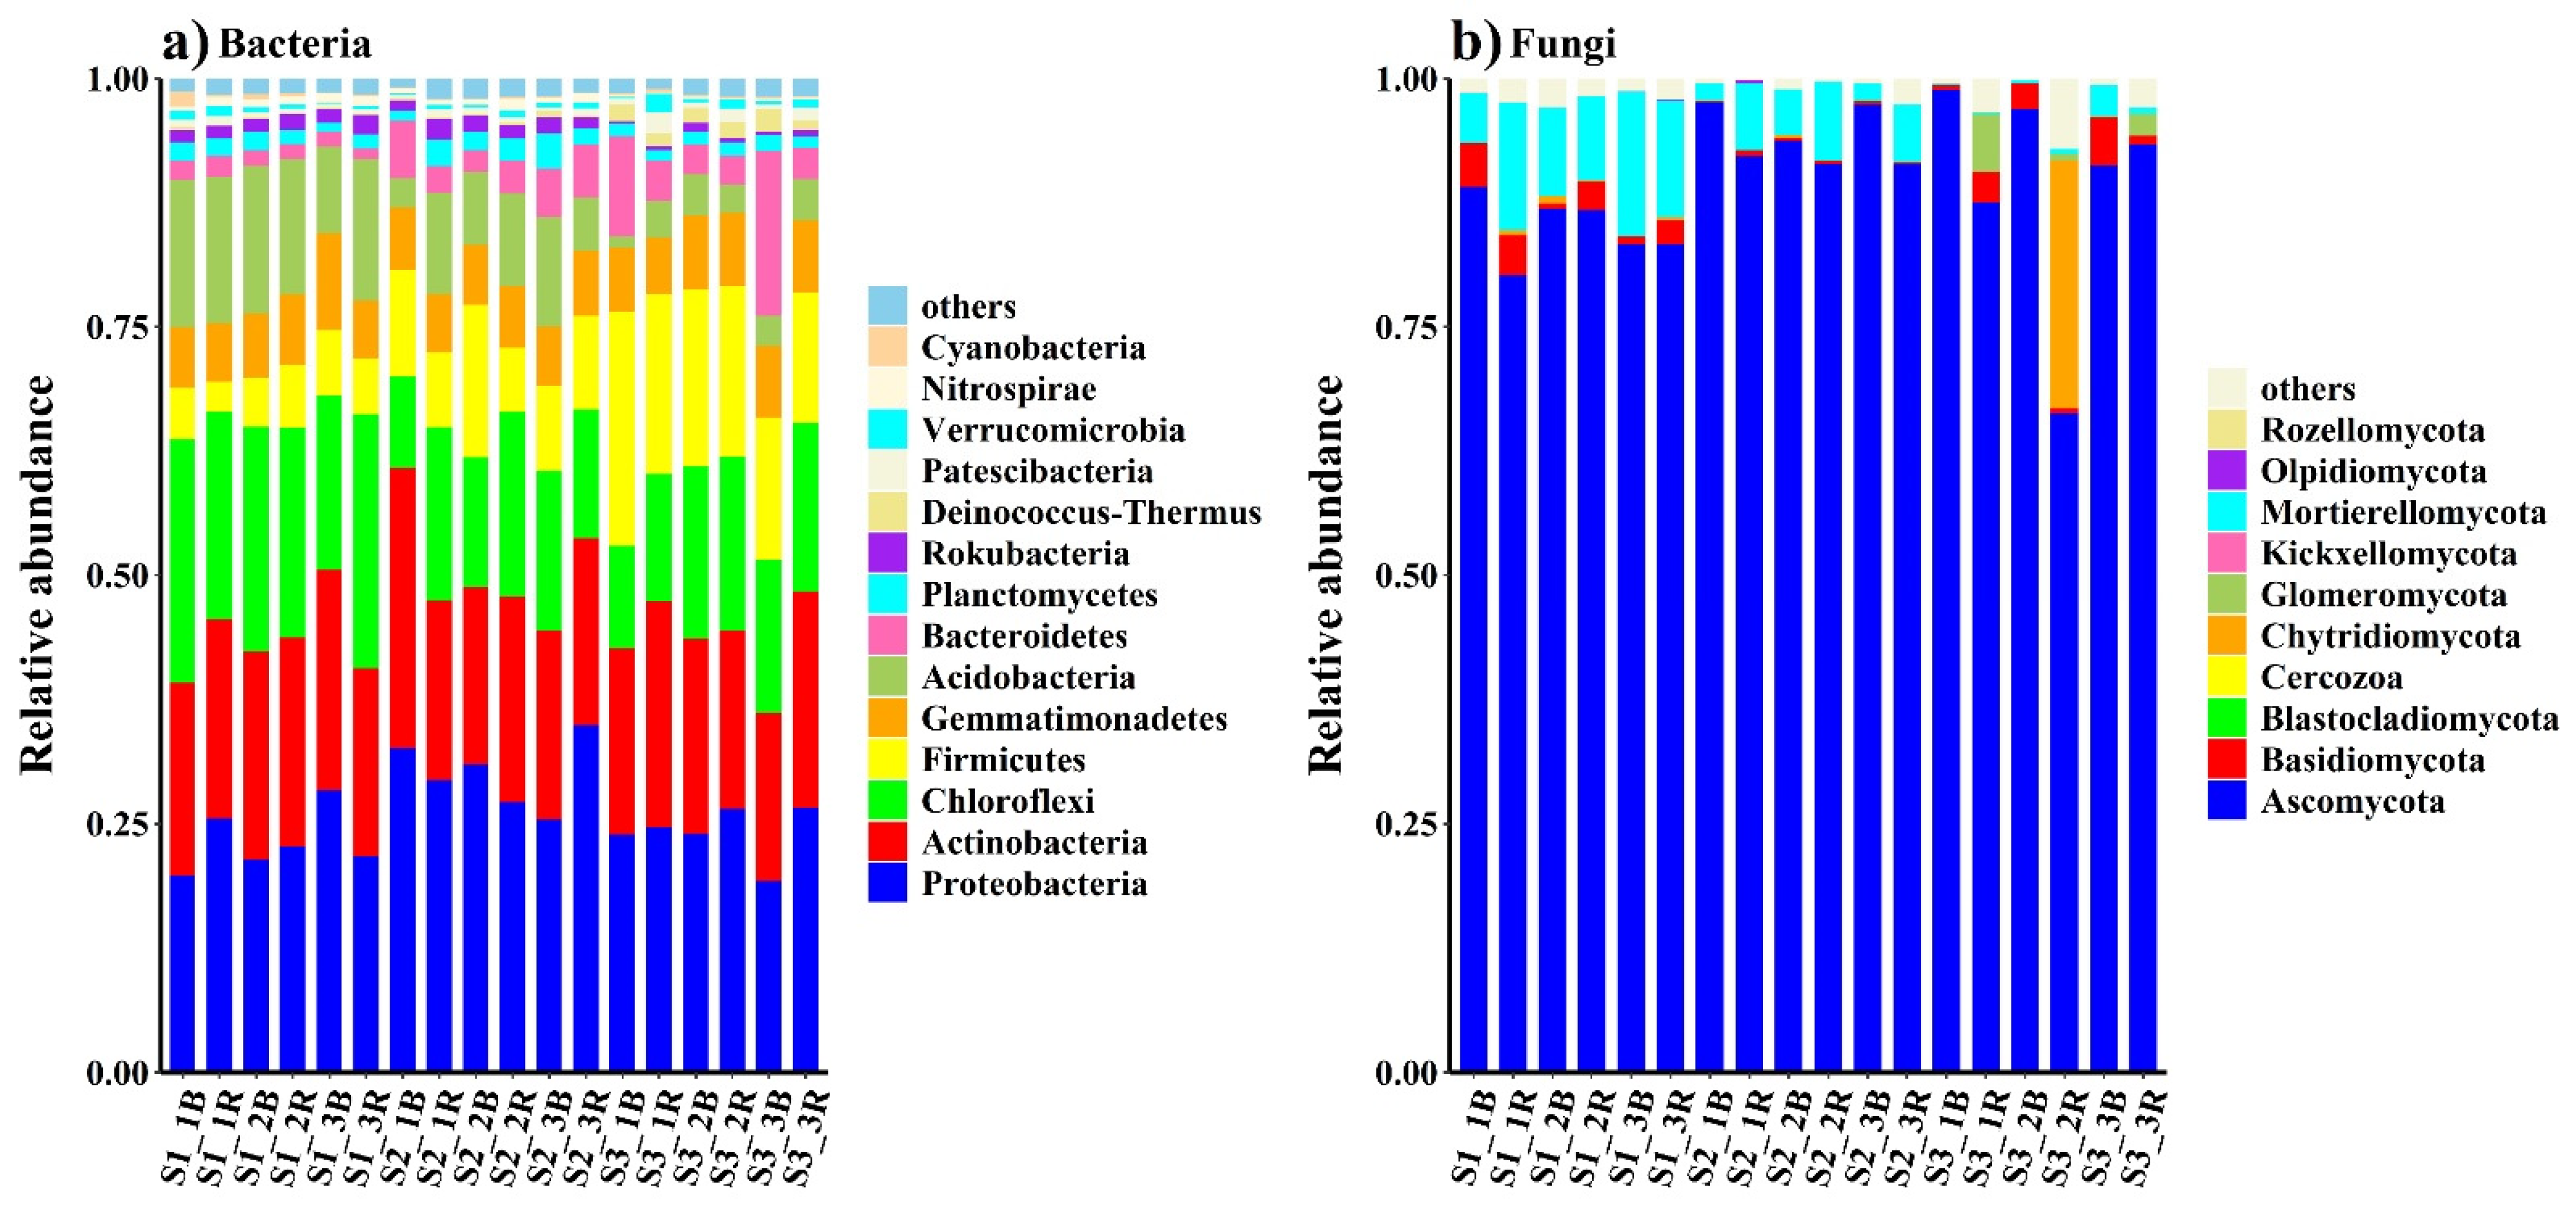
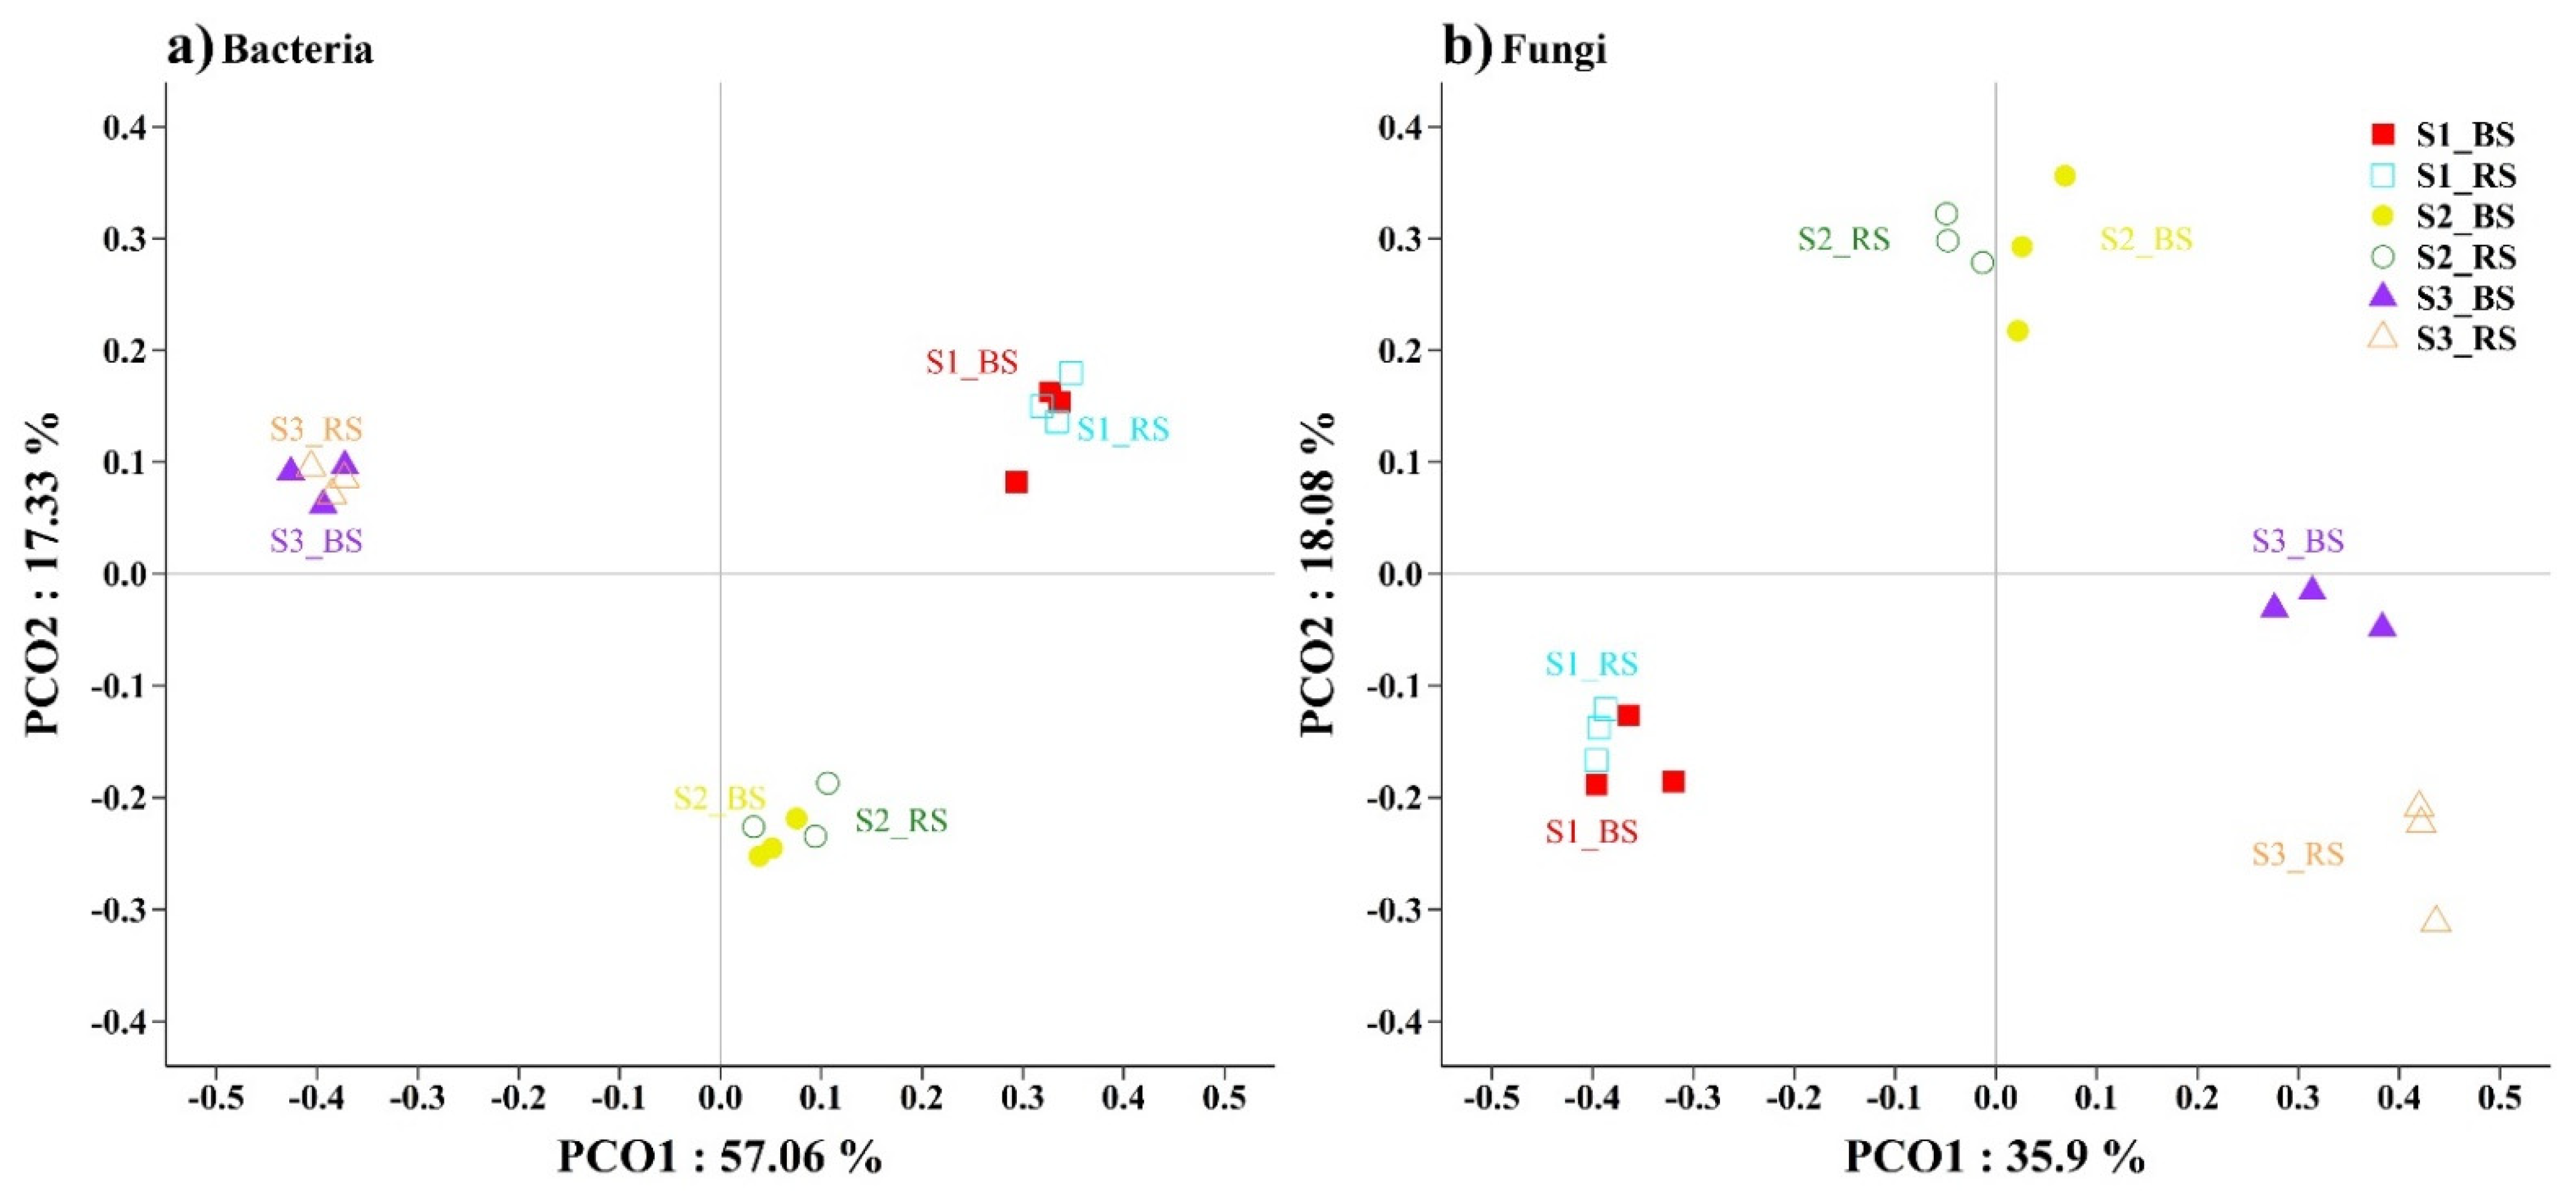
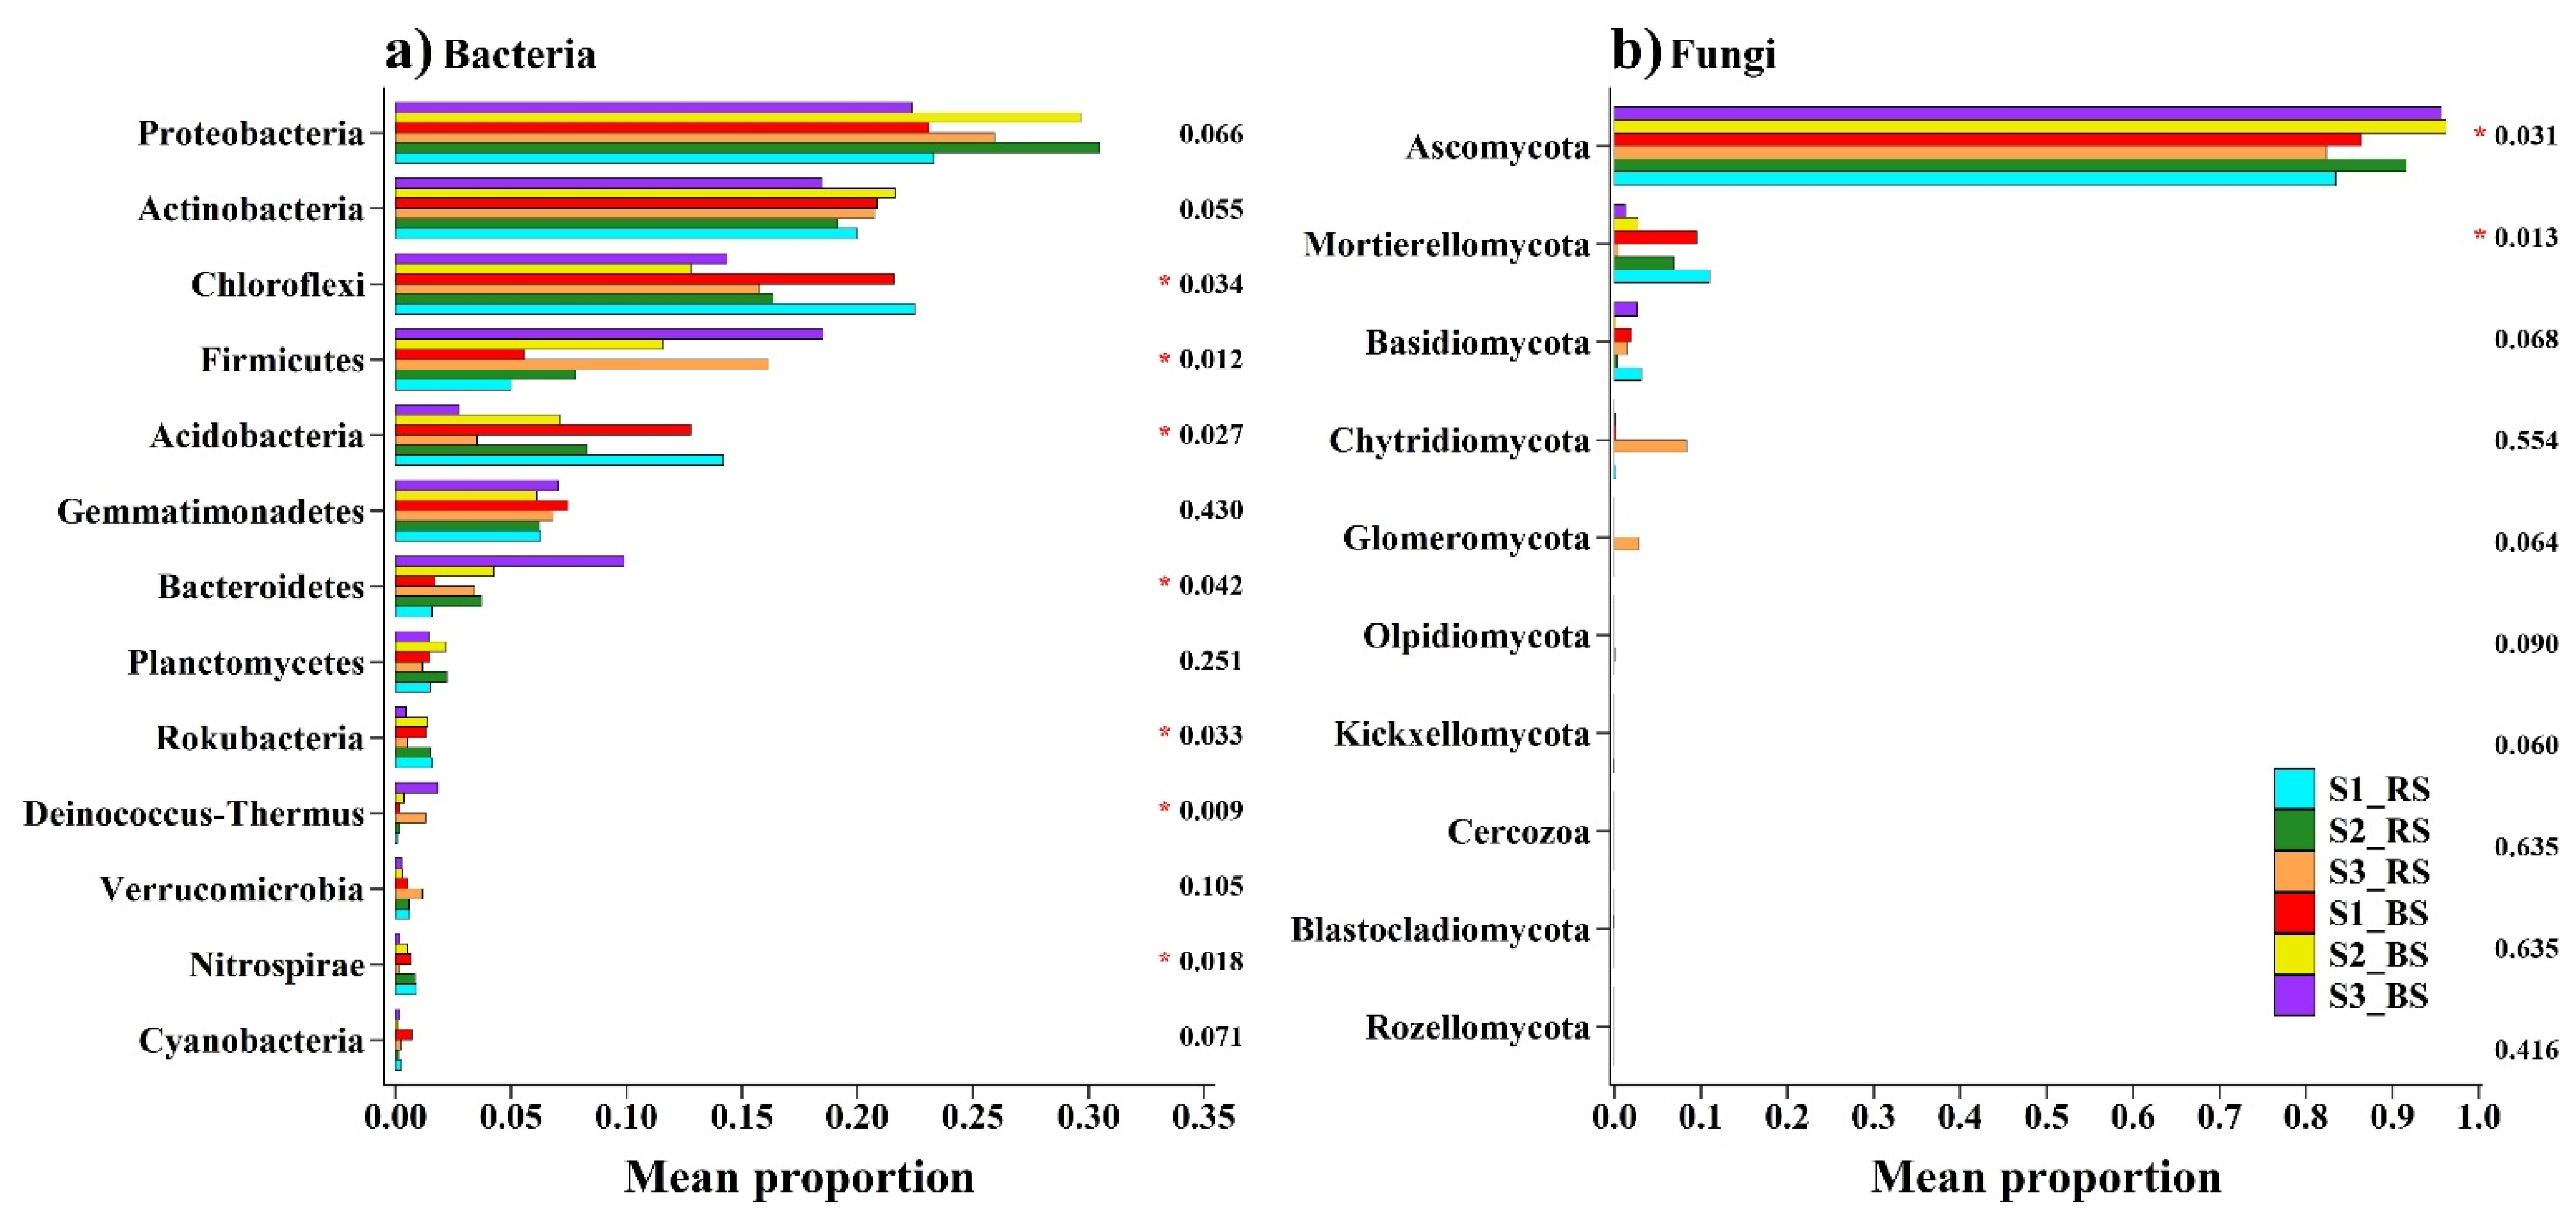
3.2. Soil Microbial Distribution and Diversity

A total of 557,735 high-quality V3-V4 16S rRNA Illumina sequences and 1,274,864 high-quality ITS sequences from the soil samples at the three salinization levels were generated. Based on OTUs (operational taxonomic units) at 3% dissimilarity, the sequences of all the samples were clustered into 5609 bacterial OTUs and 1110 fungal OTUs. Rarefaction curves showed that within the range of 5000 sequencing reads, all soil sample curves increased sharply, and then the curves had a tendency to reach a saturated plateau, indicating that the generated data were sufficient for further analysis (Figure S1). Rank-abundance curves revealed that most of the sequences belonging to rare microorganisms had only several sequence tags, yet highly abundant bacteria and fungi in the soil samples were relatively rare (Figure S2).
The bacterial sequences were from 36 phyla, 100 classes, 274 orders, 498 families and 973 genera. Most of the sequences (90%) were classified as bacterial phyla. The predominant phyla (relative abundance >5%) in all the soils were Proteobacteria (26.2%), Actinobacteria (20.3%), Acidobacteria (8.41%), Chloroflexi (17.3%), Firmicutes (10.6%) and Gemmatimonadetes (6.62%), which together accounted for more than 89.4% of the bacterial sequences (Figure 1a). In addition, Bacteroidetes (3.36%), Planctomycetes (1.67%) and Rokubacteria (1.18%) were present at low relative abundances, and another 17 rarer phyla were also identified (Table S1). The fungal sequences were from 10 phyla, 31 classes, 73 orders, 145 families and 254 genera, and the predominant phyla were Ascomycota (89.3%) and Mortierellomycota (5.29%), which accounted for more than 94.5% of the fungal sequences (Figure 1b). In addition to Basidiomycota (1.63%), the relative abundance of Chytridiomycota (1.48%) was low, and six other scarce phyla were identified (Table S2).
Figure 2 demonstrates the differences in the predominant phyla of bacteria and fungi at the three salinization levels. Comparing S1, S2 and S3, the relative abundances of Chloroflexi, Acidobacteria, Rokubacteria and Nitrospirae were significantly (p < 0.05) lower in the high-salt S3 soil compared to S1 and S2. Conversely, the relative abundances of Firmicutes, Bacteroidetes and Deinococcus-Thermus were both significantly (p < 0.05) higher in the S3 high-salt soil (Figure 2a). With respect to fungi, only Mortierellomycota (p < 0.05) had a greater relative abundance in S3 high-salt soil (Figure 2b).
PCoA served to demonstrate the bacterial and fungal soil samples’ clustering results based on the Bray–Curtis distance. The soil samples from S1 (including S1_BS and S1_RS), S2 (including S2_BS and S2_RS) and S3 (including S3_BS and S3_RS) were distributed in different quadrants, indicating that these soil samples had substantial environmental heterogeneity. Nevertheless, the bulk soil and the rhizosphere soil at the same sampling point were in the same quadrant (Figure 3). These results reveal significant separation of the S1, S2 and S3 communities (ANOSIM, p < 0.05, Table S3).

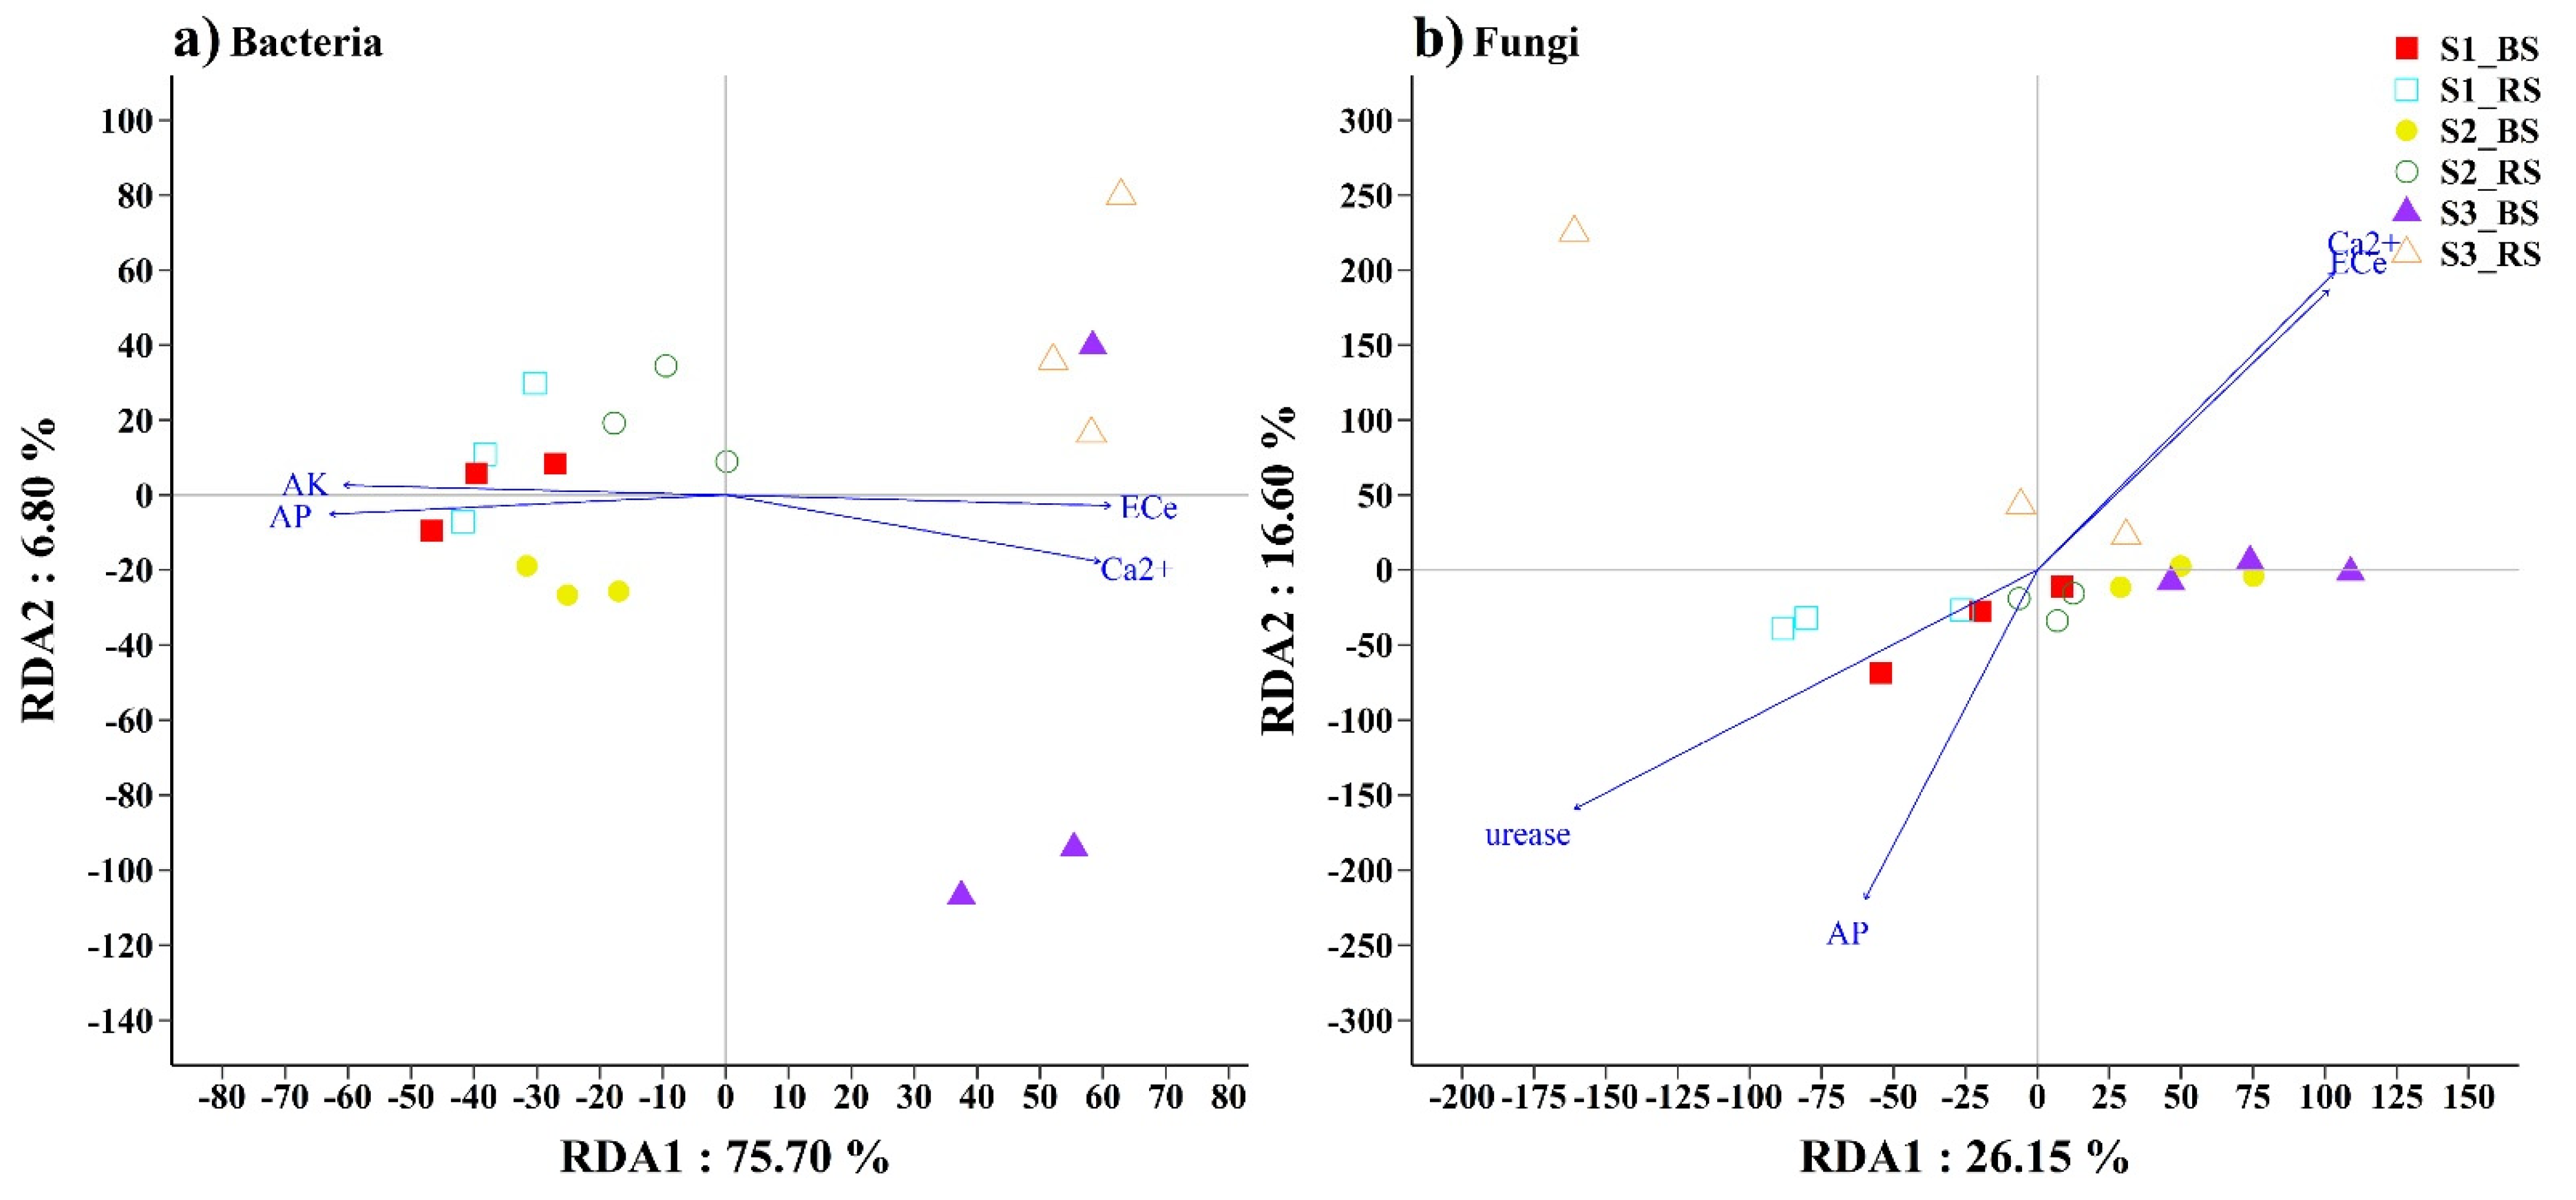
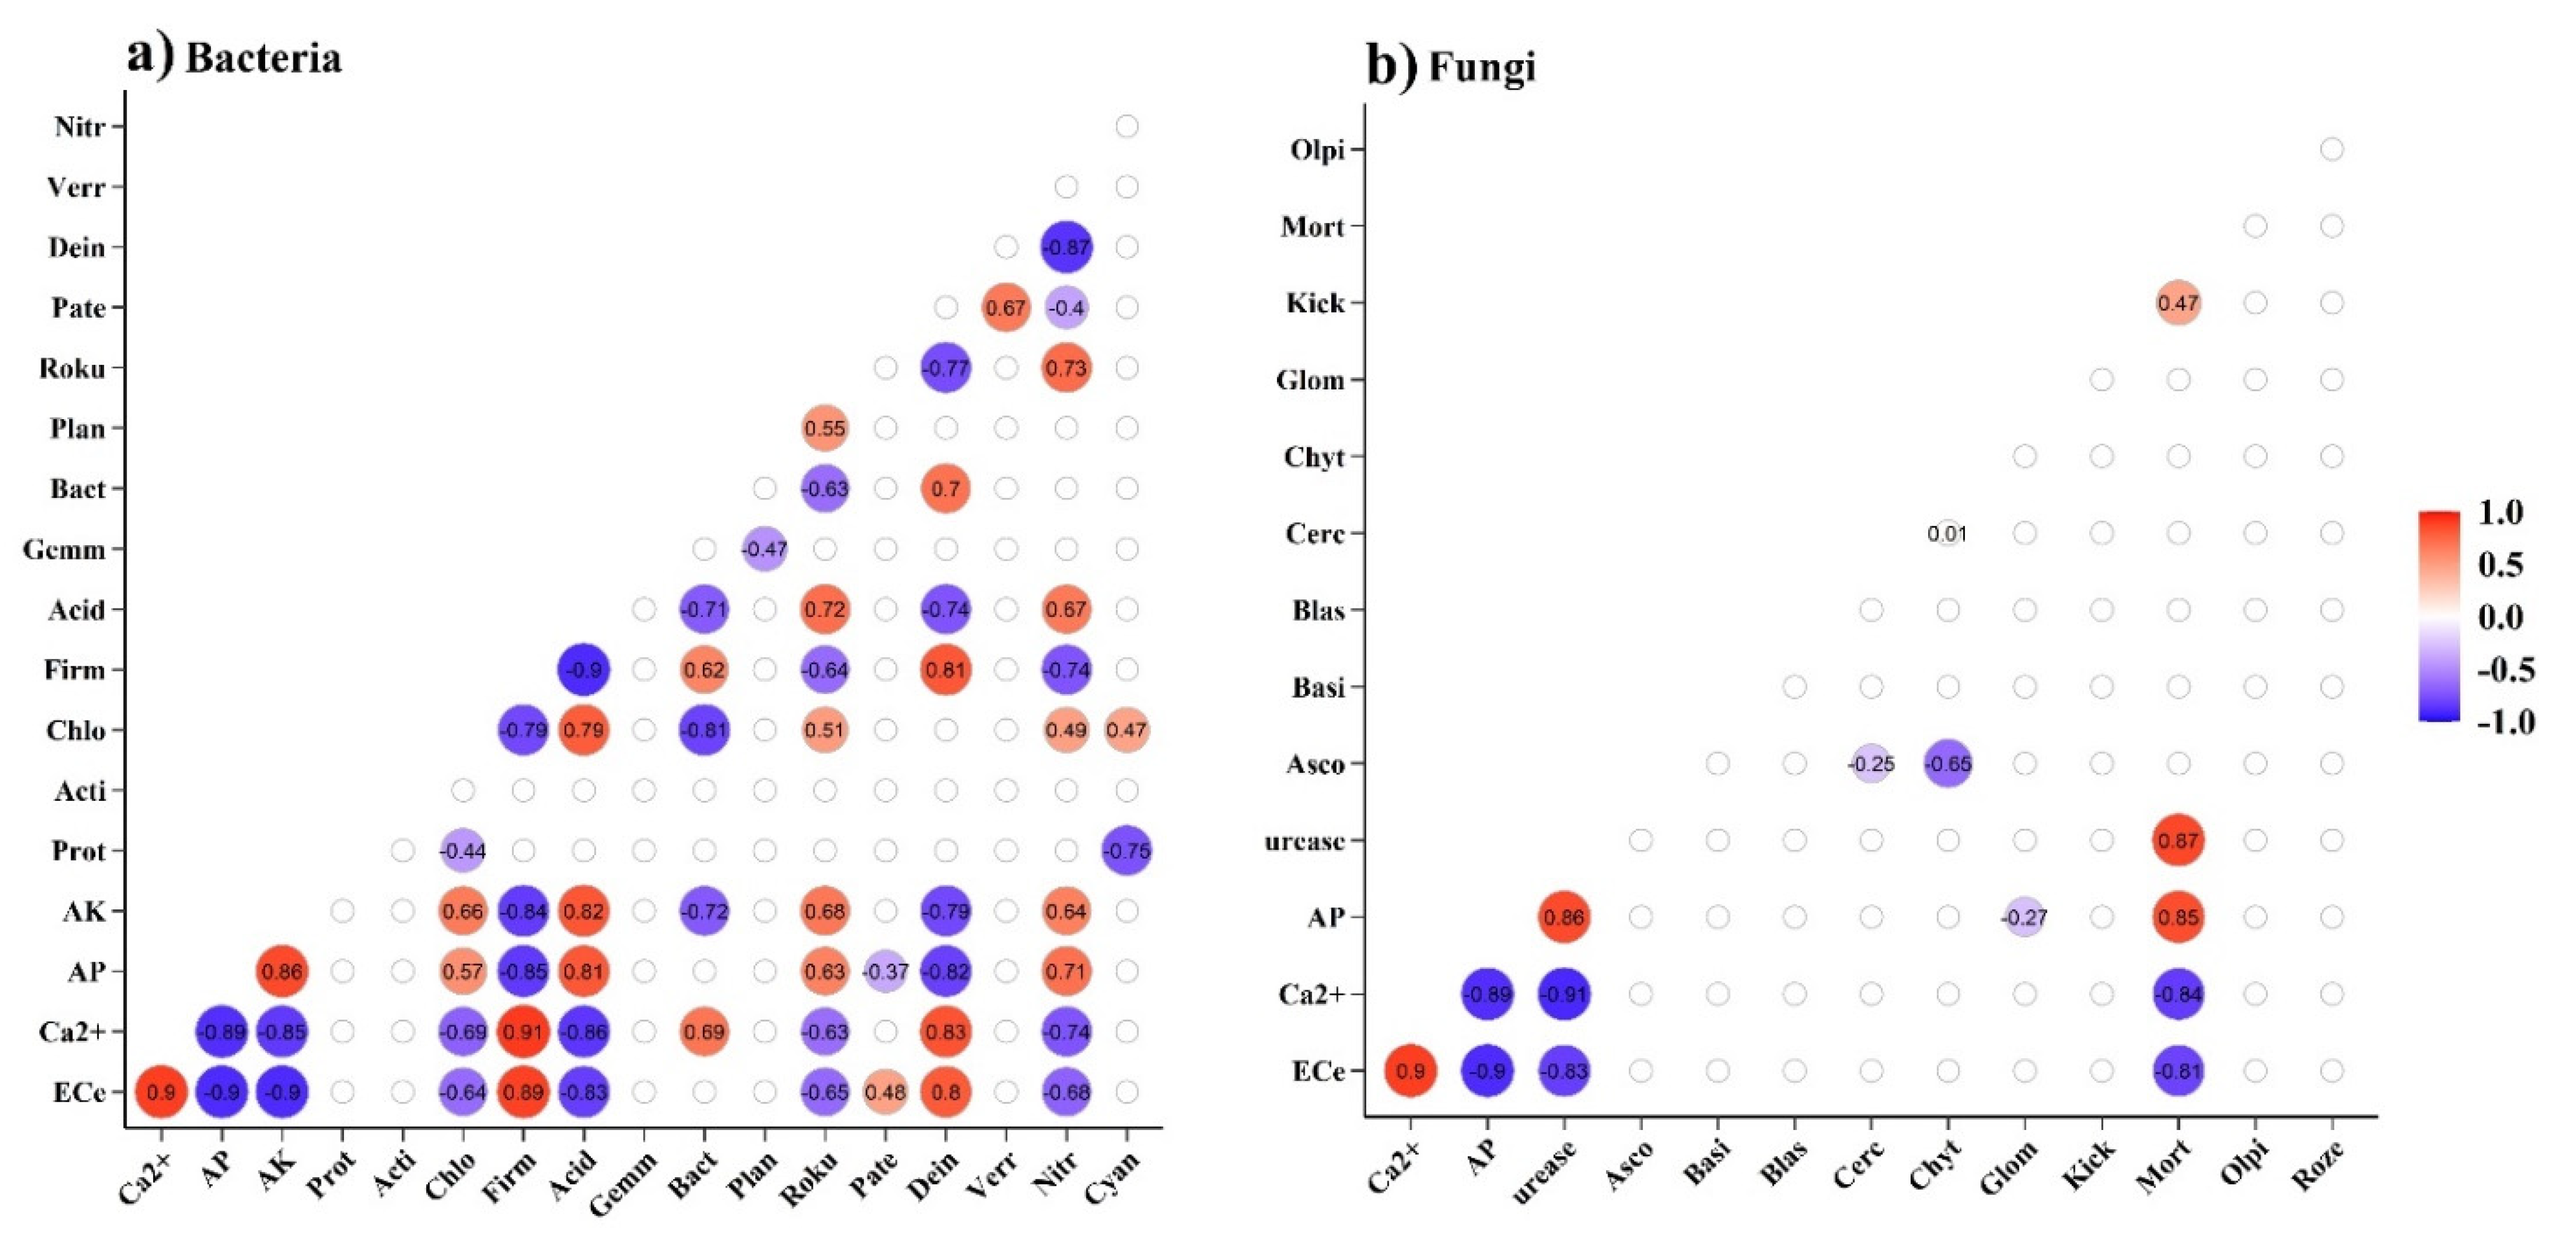
3.3. Soil Microbial Communities Associated with Environmental Factors

Bacterial and fungal alpha-diversity indexes are shown in Table S4. The microbial diversity varied greatly with Shannon index (which ranged from 5.99 to 6.52 for bacteria and from 2.51 to 3.89 for fungi) and the Chao1 index (which ranged from 2641 to 3099 for bacteria and from 136 to 456 for fungi) across the soils (Table S4). The study showed that for both the bacteria and the fungi, the alpha-diversity Shannon index was negatively influenced by the soil salinization (p < 0.05) and positively influenced by soil nutrition and enzyme activities (p < 0.05). Nevertheless, for Chao1 and OTU richness, the bacteria and fungi had opposite relationships with each variable; the bacteria were positively influenced by the soil salinization (p < 0.05) and negatively affected by soil nutrition and enzyme activities (p < 0.05). The fungi were negatively influenced by soil nutrition and enzyme activities (Table 2).
The Mantel tests identified Ca2+, AP, ECe and AK as the dominant environmental factors correlated with the bacterial community structures and AP, urease, Ca2+ and ECe as the dominant factors correlated with the fungal community structures (Table S5). The significant correlations were confirmed by the linear regression relationships between the dominant environmental factor and the Shannon index (p < 0.05), as shown in Figure S3. In the RDA bioplots, the combination of RDA1 and RDA2 variables explained 82.5% of the bacterial community’s variation and 42.75% of the fungal community’s variation (Figure 4).
Spearman’s correlation analysis results indicated that the bacterial abundances of Firmicutes, Deinococcus-Thermus and Bacteroidetes were positively related with the soil Ca2+ and ECe values (p < 0.05) and inversely correlated with the AK and AP values. Additionally, Acidobacteria, Nitrospirae, Chloroflexi and Rokubacteria had positive correlations with the soil AK and AP values, which inversely correlated with the soil Ca2+ and ECe values (Figure 5a). With respect to fungi, Mortierellomycota was significantly positively correlated with the AP and urease values and negatively correlated with the Ca2+ and ECe values (Figure 5b).

4. Discussion

4.1. Responses of Soil Properties to Salinity

At the study site, soil salinity stress is the main cause of crop growth restriction [31]. Typically, Zhao et al. [4] indicated that the relationship between pH value and EC in saline-alkali soil exhibits a significant correlation. Here, the soil ECe, pH, K+, Na+, Ca2+ and Mg2+ increased with the increase of salinization degree. In general, the K+, Na+, Ca2+ and Mg2+ values in the bulk soil were higher than those in the rhizosphere soil, with significant differences in S2 and S3 (p < 0.05). The lower content of salt ions in the rhizosphere soil could be explained by root exudates, which were mixtures of many small-molecule compounds, including fatty acids, amino acids, organic acids, sugars and secondary metabolites [32]. Root exudates could reduce salt stress. Studies have shown that the roots of peanut, maize and barley have strong changes in rhizosphere chemistry and biochemistry, which especially affect salt ions’ (Na+ and Cl) availability [33].
The values of SOC, soil nutrients (AN, AP, AK) and enzyme activities (ALP, invertase, urease, CAT) in bulk soil and rhizosphere soil decreased as the salinity increased. Abiotic stresses, such as salinity, could suppress the enzyme activity and nutrient concentrations [34]. This might be because a high salt concentration and the toxicity of certain ions lead to nutrient imbalances in microbial growth and enzyme synthesis [35]. In addition, the enzyme activity of bulk soil was lower than that of rhizosphere soil in one study, which was the result of microbial activity caused by root exudates and enzyme release [36]. This result was confirmed in the present study.

4.2. Responses of the Bacterial and Fungal Communities to Salinity

To study the microbial community’s composition along the salt gradient, the bacterial community structures and fungal community structures were analyzed at the phylum level. Of all the saline soil samples, bacterial and fungal relative abundances at the phylum level were different. The bacteria were mainly made up of Proteobacteria, Actinobacteria, Chloroflexi, Firmicutes, Acidobacteria and Bacteroidetes, while the fungi were mainly composed of Ascomycota and Mortierellomycota. Furthermore, the results showed that the Firmicutes’ and Bacteroidetes’ relative abundances were positively related with the saline gradient; i.e., the relative abundances increased as the salinity increased.
Microbial communities can respond rapidly to the environmental changes caused by changes in soil salinity. In the current study, the diversity and evenness of bacteria and fungi decreased along a saline gradient (Table S4). Soil salinity caused significant changes in the soil’s microbial community structure, and Herlemann et al. [37] also reported the same results in estuarine and marine environments. One possible explanation is that salt accumulation in the soil increased the extracellular osmotic pressure [38], and numerous microorganisms failing to acclimatize to osmotic stress might have died or become inactive, thereby decreasing microbial diversity and evenness. The present study held that the richness of the rhizosphere soil was lower than that of the bulk soil, which agrees with the results of Thompson et al. [39]. In addition, the richness of bacteria was higher than that of fungi under the same salinity, and the bacterial richness increased along the salt gradient (Table S4). This result indicates that there were some salt-tolerant or halophilic bacteria in the high salinity soil, so as to improve the richness of bacteria. Meanwhile, the bacteria that survived in salty environments had adapted to grow optimally in the high salinity environment to maintain the balance of the intracellular environment [40]. Many fungi were not adapted for such conditions, the reason being that the growth of fungal mycelium was inhibited as the NaCl concentration increased. Soil salinity could directly inhibit fungal mycelial growth through ionic toxicity or indirectly increasing osmotic stress via ion concentrations in the soil [41]. PCoA demonstrated that the soil’s microbial community’s structure significantly changed with different levels of soil salinization. Concurrently, the fungi were less tolerant to salt than the bacteria, based on the Shannon and Chao1 indexes. Consequently, we propose that in the screening of some salt-tolerant plant growth-promoting microorganisms (PGPMs), bacteria should be emphasized.

4.3. Responses of Microbial Distribution to Physicochemical Properties in Saline Soil

An important objective of microbial ecology research is to understand the relationships between environmental variables and soil microbial community structure [42]. Salinity’s contributions to microbial communities in soils have been a debated matter over the past few years because of evidence to the contrary. For example, in the majority of studies, saline soil adversely affected the microbial community and its activities in natural saline soil [43,44,45]. This was probably because increasing salt concentration and specific ion toxicity caused a nutritional imbalance for microbial growth and enzyme synthesis [35]. Conflicting results of the salinity’s effects on soil microbial activities, however, have also been reported. Marinari et al. [35] found that soil salinity and sodicity increased both biochemical activity and the functional diversity of microbial communities. This result was consistent with present result. In the present study, Ca2+, AP, ECe and AK values were the dominant environmental factors related to the bacterial community structure; and the values of AP, urease, Ca2+ and ECe were the dominant factors correlated with the fungal community structure (Table S5), which in turn altered the microbial functional communities. This result indicates that different environmental factors had different effects on microbial diversity. Consistently, Pei et al. [46] showed environmental factors that affected the diversity, composition and structure of microbial communities. Most salts are known to dissolve easily in water, resulting in a solution containing various ions. Therefore, pore water in saline soil contains varieties of dissolved ions, such as Na+, Ca2+, NH4+, Cl and SO42− [38]. Ca2+ is associated with a wide range of bacterial functions, including pathogenicity, differentiation, chemotaxis, cell cycle and heat shock [47]. Xia et al. [48] and Xue et al. [49] indicated that Ca2+ and ECe are closely correlated with the bacterial community’s structure. According to this study, the critical roles of Ca2+ and ECe in shaping the community structure of bacteria and fungi were well characterized, denoting that the Ca2+ and ECe contents act as decisive factors in affecting populations and activity of soil bacteria in Xinjiang saline soils. In addition, Rietz and Haynes [50] implied that soil nutrient concentrations and soil enzyme activity were sensitive indicators of the soil ecosystems stress and severely hampered in salinized soil. Interestingly, soil bacterial community composition was significantly affected by available potassium and phosphorus in wild saline soils and tropical ecosystems [51]. In combination with other soil factors, available potassium and phosphorus influence the individual life cycles of bacteria and fungi through competitive strategies, thereby affecting the community structure of bacteria and fungi [2]. For example, the salinized effect on soil microbial communities might vary depending on some specific salt ions. Therefore, Ca2+ ions might indirectly affect microbial communities.
Additionally, Spearman’s correlation analysis revealed highly covariable relationships between the core bacterial variables and significant environmental variables. Our results showed that predictors varied with the soil types in Xinjiang, China. Acidobacteria, Nitrospirae, Chloroflexi, Rokubacteria and Mortierellomycota were vital predictors of nutrients in biocrusts, likely owing to their diverse metabolism. Boone et al. [52] reported some Nitrospirae genera were aerobic chemolithotrophs. In our study, Nitrospirae showed the excellent relative abundance in the low salt soil S1, with slightly elevated contents of nutrients and enzymes, which could participate in the nutrient cycle. Chloroflexi could provide energy through photosynthesis, the degradation of plant-derived compounds and the decomposition of organic matter [53].
Firmicutes and Bacteroidetes were important and unique predictors of soil salinization. Hashmi et al. [54] also reported that Firmicutes were associated with the development of soil bioremediation for sustainable agriculture. Among the phyla Firmicutes, genus Bacillus members were probably widely used beneficial microorganisms in agroecology. Bacillus-like organisms predominated in salinized soil environments because of their ability to form spores and Gram-positive cell walls [55]. Strains of Bacillus halophilus have numerous advantages, such as promoting plant growth, producing industrially important enzymes and participating in the bioremediation of toxic chemicals [55]. At the same time, a halotolerant Oceanobacillus sp. with 1-aminocyclopropane-1-carboxylate (ACC) deaminase activity was used to inoculate wheat containing a NaCl concentration of up to 200 mM, which caused wheat growth to increased [54]. In addition, the genus Planococcus rifietoensis SAL-15 of Firmicute phylum, which was separated from wheat rhizospheric salinized soil, exhibited some characteristics of secreting indoleacetic acid (IAA), phosphorous solubilization and ACC deaminase activity. Application of P. rifietoensis SAL-15 could improve wheat growth and yield under salt stress, alleviating the deleterious effect of salinity [56]. Bacteroidetes tended to be a dominant phylum within the soil microbiota, reminiscent of human and animal intestines [57]. Bacteroidetes species could secrete a variety of carbohydrate active enzymes (CAZymes) which target a variety of glycans in the soil, thereby having the ability to proliferate. Bacteroidetes species in the environment are thought to specialize in the biosphere, in complex organic matter degradation, especially in the form of polysaccharides [58]. A study involving soils from 18 different sites showed that Bacteroidetes were correlated with higher electrical conductivity [59]. In fact, Bacteroidetes are abundant in mesotrophic and eutrophic waters and are usually associated with high nutrient values [59,60]. Taken together, these results indicate that Firmicutes and Bacteroidetes were pivotal in salinized soil in Xinjiang, China, which could provide guidance for identifying rhizosphere growth-promoting bacteria (PGPB) as bioindicators in saline soil.

5. Conclusions

In the present study, the effects of environmental variances on the bacterial and fungal communities structure in three saline soils were analyzed and quantified. Fungi were more susceptible to salt than the bacteria based on diversity indexes Shannon and Chao1. Therefore, it was suggested to screen halo-tolerant plant growth promoting rhizobacteria from the perspective of soil bacteria in Xinjiang saline land. In addition, PCoA and RDA demonstrated that the soil’s microbial community’s structure exhibited significant differences between different salinized soils. Ca2+, AP, ECe and AK, as the dominant environmental factors, correlated with the bacterial community structures (p < 0.001). These factors were significantly correlated with the relative abundances of Firmicutes and Bacteroidetes, and this finding could provide guidance for the demand for PGPB as a bioindicator in saline soil.

Supplementary Materials

The following are available online at https://www.mdpi.com/article/10.3390/biology10111114/s1, Table S1: Relative abundances of phyla in Bacteria across all various soil salt gradients. Asterisk indicates sequences classified to the domain Bacteria but not to a specific phylum; Table S2: Relative abundances of phyla in Fungi across all various soil salt gradients; Table S3: Analysis of similarity (ANOSIM); Table S4: Diversity indices of soil microbial communities across the soils; Table S5: Correlations (r) and significance (P) determined by Mantel tests, between the microbial community composition and various soil environmental variables; Figure S1: Rarefaction curves for bacterial and fungal OTUs, clustering at 97% sequence similarity at the three salinization level. (a) Bacteria; (b) Fungi; Figure S2: Rank-abundance curves for bacterial and fungal OTUs in the soil samples taken at the three salinization level. (a) Bacteria; (b) Fungi; Figure S3: (a–d) Linear regression relationships between main environmental factor Ca2+, AP, ECe, AK and Shannon of bacterial operational taxonomic units; (e–h) Linear regression relationships between main environmental factor AP, urease, Ca2+, ECe and Shannon of fungal operational taxonomic units.

Author Contributions

Conceptualization, W.Z.; data curation, M.H.; investigation, G.L.; methodology, Z.W. and Y.L.; supervision, W.Z. and J.H.; writing—original draft, Y.H.; writing—review and editing, W.Z., B.Z. and J.H. All authors have read and agreed to the published version of the manuscript.

Funding

We are grateful for the financial support from the Program of the National Natural Science Foundation of China (NSFC) (grant numbers 51790533, 51879196 and 52179039).

Institutional Review Board Statement

Not applicable.

Informed Consent Statement

Not applicable.

Data Availability Statement

The raw data presented in this study are available on request from the corresponding author. The data are not yet publicly available since the project is still ongoing.

Conflicts of Interest

The authors declare no conflict of interest.

References

  1. Wang, J.Z.; Ding, J.L.; Yu, D.L.; Ma, X.K.; Zhang, Z.P.; Ge, X.Y.; Teng, D.X.; Li, X.H.; Liang, J.; Lizag, A.; et al. Capability of Sentinel-2 MSI data for monitoring and mapping of soil salinity in dry and wet seasons in the Ebinur Lake region, Xinjiang, China. Geoderma 2019, 353, 172–187. [Google Scholar] [CrossRef]
  2. Zhao, S.; Liu, J.J.; Banerjee, S.; Zhou, N.; Zhao, Z.Y.; Zhang, K.; Hu, M.F.; Tian, C.Y. Biogeographical distribution of bacterial communities in saline agricultural soil. Geoderma 2020, 361, 114095. [Google Scholar] [CrossRef]
  3. Wang, W.; Wu, Z.; He, Y.; Huang, Y.; Li, X.; Ye, B.C. Plant growth promotion and alleviation of salinity stress in Capsicum annuum L. by Bacillus isolated from saline soil in Xinjiang. Ecotox. Environ. Saf. 2018, 164, 520–529. [Google Scholar] [CrossRef]
  4. Zhao, S.; Liu, J.J.; Banerjee, S.; Zhou, N.; Zhao, Z.Y.; Zhang, K.; Tian, C.Y. Soil pH is equally important as salinity in shaping bacterial communities in saline soils under halophytic vegetation. Sci. Rep. 2018, 8, 4550. [Google Scholar] [CrossRef]
  5. Yang, B.; Qi, K.B.; Bhusal, D.R.; Huang, J.S.; Chen, W.J.; Wu, Q.S.; Hussain, A.; Pang, X.Y. Soil microbial community and enzymatic activity in soil particle-size fractions of spruce plantation and secondary birch forest. Eur. J. Soil Biol. 2020, 99, 103196. [Google Scholar] [CrossRef]
  6. Deng, S.; Ke, T.; Li, L.; Cai, S.; Zhou, Y.; Liu, Y.; Guo, L.; Chen, L.; Zhang, D. Impacts of environmental factors on the whole microbial communities in the rhizosphere of a metal-tolerant plant: Elsholtzia haichowensis Sun. Environ. Pollut. 2018, 237, 1088–1097. [Google Scholar] [CrossRef]
  7. Fu, D.G.; Wu, X.N.; Qiu, Q.T.; Duan, C.Q.; Jones, D.L. Seasonal variations in soil microbial communities under different land restoration types in a subtropical mountains region, Southwest China. Appl. Soil Ecol. 2020, 153, 103634. [Google Scholar] [CrossRef]
  8. Chowdhury, N.; Marschner, P.; Burns, R. Response of microbial activity and community structure to decreasing soil osmotic and matric potential. Plant. Soil 2011, 344, 241–254. [Google Scholar] [CrossRef]
  9. Wichern, J.; Wichern, F.; Joergensen, R.G. Impact of salinity on soil microbial communities and the decomposition of maize in acidic soils. Geoderma 2006, 137, 100–108. [Google Scholar] [CrossRef]
  10. Kamble, P.N.; Gaikwad, V.B.; Kuchekar, S.R.; Baath, E. Microbial growth, biomass, community structure and nutrient limitation in high pH and salinity soils from Pravaranagar (India). Eur. J. Soil Biol. 2014, 65, 87–95. [Google Scholar] [CrossRef]
  11. Rath, K.M.; Maheshwari, A.; Bengtson, P.; Rousk, J. Comparative toxicities of salts on microbial processes in soil. Appl. Microbiol. Biotechnol. 2016, 82, 2012–2020. [Google Scholar] [CrossRef] [PubMed] [Green Version]
  12. Rath, K.M.; Murphy, D.N.; Rousk, J. The microbial community size, structure, and process rates along natural gradients of soil salinity. Soil Biol. Biochem. 2019, 138, 107607. [Google Scholar] [CrossRef]
  13. Hollister, E.B.; Engledow, A.S.; Hammett, A.J.; Provin, T.L.; Wilkinson, H.H.; Gentry, T.J. Shifts in microbial community structure along an ecological gradient of hypersaline soils and sediments. ISME J. 2010, 4, 829–838. [Google Scholar] [CrossRef] [Green Version]
  14. Lozupone, C.A.; Knight, R. Global patterns in bacterial diversity. Proc. Natl. Acad. Sci. USA 2007, 104, 11436–11440. [Google Scholar] [CrossRef] [PubMed] [Green Version]
  15. Zhang, G.; Bai, J.; Tebbe, C.C.; Huang, L.; Jia, J.; Wang, W.; Wang, X.; Yu, L.; Zhao, Q. Spartina alterniflora invasions reduce soil fungal diversity and simplify co-occurrence networks in a salt marsh ecosystem. Sci. Total Environ. 2021, 758, 143667. [Google Scholar] [CrossRef] [PubMed]
  16. Vanegas, J.; Munoz-Garcia, A.; Perez-Parra, K.A.; Figueroa-Galvis, I.; Mestanza, O.; Polania, J. Effect of salinity on fungal diversity in the rhizosphere of the halophyte Avicennia germinans from a semi-arid mangrove. Fungal Ecol. 2019, 42, 100855. [Google Scholar] [CrossRef]
  17. Egamberdieva, D.; Renella, G.; Wirth, S.; Islam, R. Secondary salinity effects on soil microbial biomass. Biol. Fertil. Soils 2010, 46, 445–449. [Google Scholar] [CrossRef]
  18. Yan, N.; Marschner, P. Response of soil respiration and microbial biomass to changing EC in saline soils. Soil Biol. Biochem. 2013, 65, 322–328. [Google Scholar] [CrossRef]
  19. Casamayor, E.O.; Massana, R.; Benlloch, S.; Ovreas, L.; Diez, B.; Goddard, V.J.; Gasol, J.M.; Joint, I.; Rodriguez-Valera, F.; Pedros-Alio, C. Changes in archaeal, bacterial and eukaryal assemblages along a salinity gradient by comparison of genetic fingerprinting methods in a multipond solar saltern. Environ. Microbiol. 2002, 4, 338–348. [Google Scholar] [CrossRef]
  20. Pascual, J.; Blanco, S.; Ramos, J.L.; van Dillewijn, P. Responses of bulk and rhizosphere soil microbial communities to thermoclimatic changes in a Mediterranean ecosystem. Soil Biol. Biochem. 2018, 118, 130–144. [Google Scholar] [CrossRef]
  21. Deng, S.P.; Popova, I.E.; Dick, L.; Dick, R. Bench scale and microplate format assay of soil enzyme activities using spectroscopic and fluorometric approaches. Appl. Soil Ecol. 2013, 64, 84–90. [Google Scholar] [CrossRef]
  22. Diaz, F.J.; Sanchez-Hernandez, J.C.; Notario, J.S. Effects of irrigation management on arid soils enzyme activities. J. Arid. Environ. 2021, 185, 104330. [Google Scholar] [CrossRef]
  23. Xu, H.W.; Qu, Q.; Chen, Y.H.; Liu, G.B.; Xue, S. Responses of soil enzyme activity and soil organic carbon stability over time after cropland abandonment in different vegetation zones of the Loess Plateau of China. Catena 2021, 196, 104812. [Google Scholar] [CrossRef]
  24. Kozich, J.J.; Westcott, S.L.; Baxter, N.T.; Highlander, S.K.; Schloss, P.D. Development of a dual-index sequencing strategy and curation pipeline for analyzing amplicon sequence data on the MiSeq Illumina sequencing platform. Appl. Microbiol. Biotechnol. 2013, 79, 5112–5120. [Google Scholar] [CrossRef] [Green Version]
  25. Yang, C.; Wang, X.Z.; Miao, F.H.; Li, Z.Y.; Tang, W.; Sun, J. Assessing the effect of soil salinization on soil microbial respiration and diversities under incubation conditions. Appl. Soil Ecol. 2020, 155, 103671. [Google Scholar] [CrossRef]
  26. Usyk, M.; Zolnik, C.P.; Patel, H.; Levi, M.H.; Burk, R.D. Novel ITS1 Fungal Primers for Characterization of the Mycobiome. mSphere 2017, 2, e00488-17. [Google Scholar] [CrossRef] [Green Version]
  27. Kang, X.; Wang, Y.; Li, S.; Sun, X.; Lu, X.; Rajaofera, M.J.N.; Lu, Y.; Kang, L.; Zheng, A.; Zou, Z.; et al. Comparative Analysis of the Gut Microbiota of Adult Mosquitoes From Eight Locations in Hainan, China. Front. Cell. Infect. Microbiol. 2020, 10, 596750. [Google Scholar] [CrossRef] [PubMed]
  28. Shahrestani, M.M.; Marcussen, T.; Mehryarza, S.S.; Yousefi, N. Morphological and phylogenetic relationships within Viola sect. Sclerosium (Violaceae) in Iran. Flora 2015, 215, 67–74. [Google Scholar] [CrossRef]
  29. Anslan, S.; Mikryukov, V.; Armolaitis, K.; Ankuda, J.; Lazdina, D.; Makovskis, K.; Vesterdal, L.; Schmidt, I.K.; Tedersoo, L. Highly comparable metabarcoding results from MGI-Tech and Illumina sequencing platforms. PeerJ 2021, 9, e12254. [Google Scholar] [CrossRef]
  30. Rahman, M.S.; Hoque, M.N.; Puspo, J.A.; Islam, M.R.; Das, N.; Siddique, M.A.; Hossain, M.A.; Sultana, M. Microbiome signature and diversity regulates the level of energy production under anaerobic condition. Sci. Rep. 2021, 11, 19777. [Google Scholar] [CrossRef] [PubMed]
  31. Wang, R.S.; Wan, S.Q.; Sun, J.X.; Xiao, H.J. Soil salinity, sodicity and cotton yield parameters under different drip irrigation regimes during saline wasteland reclamation. Agric. Water Manag. 2018, 209, 20–31. [Google Scholar] [CrossRef]
  32. Xiong, Y.W.; Li, X.W.; Wang, T.T.; Gong, Y.; Zhang, C.M.; Xing, K.; Qin, S. Root exudates-driven rhizosphere recruitment of the plant growth-promoting rhizobacterium Bacillus flexus KLBMP 4941 and its growth-promoting effect on the coastal halophyte Limonium sinense under salt stress. Ecotox. Environ. Saf. 2020, 194, 110374. [Google Scholar] [CrossRef]
  33. Inal, A.; Gunes, A. Interspecific root interactions and rhizosphere effects on salt ions and nutrient uptake between mixed grown peanut/maize and peanut/barley in original saline-sodic-boron toxic soil. J. Plant Physiol. 2008, 165, 490–503. [Google Scholar] [CrossRef]
  34. Shi, S.H.; Tian, L.; Nasir, F.; Bahadur, A.; Batool, A.; Luo, S.S.; Yang, F.; Wang, Z.C.; Tian, C.J. Response of microbial communities and enzyme activities to amendments in saline-alkaline soils. Appl. Soil Ecol. 2019, 135, 16–24. [Google Scholar] [CrossRef]
  35. Marinari, S.; Carbone, S.; Vittori Antisari, L.; Grego, S.; Vianello, G. Microbial activity and functional diversity in Psamment soils in a forested coastal dune-swale system. Geoderma 2012, 173–174, 249–257. [Google Scholar] [CrossRef]
  36. Zhang, C.; Liu, G.B.; Xue, S.; Song, Z.L. Rhizosphere soil microbial activity under different vegetation types on the Loess Plateau, China. Geoderma 2011, 161, 115–125. [Google Scholar] [CrossRef]
  37. Herlemann, D.P.; Labrenz, M.; Jurgens, K.; Bertilsson, S.; Waniek, J.J.; Andersson, A.F. Transitions in bacterial communities along the 2000 km salinity gradient of the Baltic Sea. ISME J. 2011, 5, 1571–1579. [Google Scholar] [CrossRef] [Green Version]
  38. Rath, K.M.; Rousk, J. Salt effects on the soil microbial decomposer community and their role in organic carbon cycling: A review. Soil Biol. Biochem. 2015, 81, 108–123. [Google Scholar] [CrossRef]
  39. Thompson, L.R.; Sanders, J.G.; McDonald, D.; Amir, A.; Ladau, J.; Locey, K.J.; Prill, R.J.; Tripathi, A.; Gibbons, S.M.; Ackermann, G.; et al. A communal catalogue reveals Earth’s multiscale microbial diversity. Nature 2017, 551, 457–463. [Google Scholar] [CrossRef] [Green Version]
  40. Gregory, G.J.; Boyd, E.F. Stressed out: Bacterial response to high salinity using compatible solute biosynthesis and uptake systems, lessons from Vibrionaceae. Comp. Struct. Biotechnol. J. 2021, 19, 1014–1027. [Google Scholar] [CrossRef]
  41. McMillen, B.G.; Juniper, S.; Abbott, L.K. Inhibition of hyphal growth of a vesicular-arbuscular mycorrhizal fungus in soil containing sodium chloride limits the spread of infection from spores. Soil Biol. Biochem. 1998, 30, 1639–1646. [Google Scholar] [CrossRef]
  42. Gu, Y.; Bai, Y.; Xiang, Q.; Yu, X.; Zhao, K.; Zhang, X.; Li, C.; Liu, S.; Chen, Q. Degradation shaped bacterial and archaeal communities with predictable taxa and their association patterns in Zoige wetland at Tibet plateau. Sci. Rep. 2018, 8, 3884. [Google Scholar] [CrossRef] [Green Version]
  43. Zahran, H.H. Diversity, adaptation and activity of the bacterial flora in saline environments. Biol. Fertil. Soils 1997, 25, 211–223. [Google Scholar] [CrossRef]
  44. Sardinha, M.; Muller, T.; Schmeisky, H.; Joergensen, R.G. Microbial performance in soils along a salinity gradient under acidic conditions. Appl. Soil Ecol. 2003, 23, 237–244. [Google Scholar] [CrossRef]
  45. Batra, L.; Manna, M.C. Dehydrogenase activity and microbial biomass carbon in salt-affected soils of semiarid and arid regions. Arid Soil Res. Rehabil. 1997, 11, 295–303. [Google Scholar] [CrossRef]
  46. Pei, P.B.; Aslam, M.; Du, H.; Liang, H.H.; Wang, H.; Liu, X.J.; Chen, W.Z. Environmental factors shape the epiphytic bacterial communities of Gracilariopsis lemaneiformis. Sci. Rep. 2021, 11, 8671. [Google Scholar] [CrossRef]
  47. Norris, V.; Grant, S.; Freestone, P.; Canvin, J.; Sheikh, F.N.; Toth, I.; Trinei, M.; Modha, K.; Norman, R.I. Calcium signalling in bacteria. J. Bacteriol. 1996, 178, 3677–3682. [Google Scholar] [CrossRef] [Green Version]
  48. Xia, Z.; Bai, E.; Wang, Q.; Gao, D.; Zhou, J.; Jiang, P.; Wu, J. Biogeographic Distribution Patterns of Bacteria in Typical Chinese Forest Soils. Front. Microbiol. 2016, 7, 1106. [Google Scholar] [CrossRef] [PubMed] [Green Version]
  49. Xue, L.; Ren, H.; Li, S.; Leng, X.; Yao, X. Soil Bacterial Community Structure and Co-occurrence Pattern during Vegetation Restoration in Karst Rocky Desertification Area. Front. Microbiol. 2017, 8, 2377. [Google Scholar] [CrossRef] [PubMed] [Green Version]
  50. Rietz, D.N.; Haynes, R.J. Effects of irrigation-induced salinity and sodicity on soil microbial activity. Soil Biol. Biochem. 2003, 35, 845–854. [Google Scholar] [CrossRef]
  51. Jing, X.; Chen, X.; Fang, J.Y.; Ji, C.J.; Shen, H.H.; Zheng, C.Y.; Zhu, B. Soil microbial carbon and nutrient constraints are driven more by climate and soil physicochemical properties than by nutrient addition in forest ecosystems. Soil Biol. Biochem. 2020, 141, 107657. [Google Scholar] [CrossRef]
  52. Boone, D.R.; Castenholz, R.W.; Garrity, G.M. Bergey’s Manual of Systematic Bacteriology; Springer: New York, NY, USA, 2001; pp. 451–464. [Google Scholar] [CrossRef]
  53. Wang, C.; Liu, S.; Zhang, Y.; Liu, B.; He, F.; Xu, D.; Zhou, Q.; Wu, Z. Bacterial communities and their predicted functions explain the sediment nitrogen changes along with submerged macrophyte restoration. Microb. Ecol. 2018, 76, 625–636. [Google Scholar] [CrossRef] [PubMed]
  54. Hashmi, I.; Bindschedler, S.; Junier, P. Firmicutes. In Beneficial Microbes in Agro-Ecology; Academic Press: Cambridge, MA, USA, 2020; pp. 363–396. [Google Scholar] [CrossRef]
  55. Mukhtar, S.; Mehnaz, S.; Mirza, M.S.; Mirza, B.S.; Malik, K.A. Diversity of Bacillus-like bacterial community in the rhizospheric and non-rhizospheric soil of halophytes (Salsola stocksii and Atriplex amnicola), and characterization of osmoregulatory genes in halophilic Bacilli. Can. J. Microbiol. 2018, 64, 567–579. [Google Scholar] [CrossRef] [Green Version]
  56. Novello, G.; Gamalero, E.; Bona, E.; Boatti, L.; Mignone, F.; Massa, N.; Cesaro, P.; Lingua, G.; Berta, G. The Rhizosphere Bacterial Microbiota of Vitis vinifera cv. Pinot Noir in an Integrated Pest Management Vineyard. Front. Microbiol. 2017, 8, 1528. [Google Scholar] [CrossRef] [PubMed]
  57. Martens, E.C.; Koropatkin, N.M.; Smith, T.J.; Gordon, J.I. Complex glycan catabolism by the human gut microbiota: The Bacteroidetes Sus-like paradigm. J. Biol. Chem. 2009, 284, 24673–24677. [Google Scholar] [CrossRef] [Green Version]
  58. Church, M.J. Resource Control of Bacterial Dynamics in the Sea. In Microbial Ecology of the Oceans, 2nd ed.; John Wiley & Sons, Inc.: Hoboken, NJ, USA, 2008; pp. 335–382. [Google Scholar] [CrossRef]
  59. De Figueiredo, D.R.; Ferreira, R.V.; Cerqueira, M.; de Melo, T.C.; Pereira, M.J.; Castro, B.B.; Correia, A. Impact of water quality on bacterioplankton assemblage along Certima River Basin (central western Portugal) assessed by PCR-DGGE and multivariate analysis. Environ. Monit. Assess. 2012, 184, 471–485. [Google Scholar] [CrossRef]
  60. Muhammad, T.; Zhou, B.; Liu, Z.Y.; Chen, X.Z.; Li, Y.K. Effects of phosphorus-fertigation on emitter clogging in drip irrigation system with saline water. Agric. Water Manag. 2021, 243, 106392. [Google Scholar] [CrossRef]
Figure 1. The relative abundances of the bacterial (a) and fungal (b) phyla in soils with different salinity levels. Less than 1% abundances were classed as “others.”
Biology 10 01114 g001
Figure 2. The relative abundances of phylum bacteria (a) and fungi (b) were significantly different between the samples with different salinization levels. A Kruskal–Wallis H test was used to assess the significance of the differences among the indicated treatments. Note: * p < 0.05.
Biology 10 01114 g002
Figure 3. The bacterial community (a) and fungal community (b) structures were evaluated using PCoA plots of the Bray–Curtis distances.
Biology 10 01114 g003
Figure 4. The relationships between dominant soil physicochemical properties and bacterial (a) and fungal (b) community structures were assessed using redundancy analysis (RDA).
Biology 10 01114 g004
Figure 5. Spearman’s correlation analysis of the relative abundance of the soil’s bacterial community (a) and fungal community (b) with dominant soil property parameters. The color depth indicates the size of the correlation value. Note: Prot, Proteobacteria; Acit, Actinobacteria; Chlo, Chloroflexi; Firm, Firmicutes; Acid, Acidobacteria; Gemm, Gemmatimonadetes; Bact, Bacteroidetes; Plan, Planctomycetes; Roku, Rokubacteria; Pate, Patescibacteria; Dein, Deinococcus-Thermus; Verr, Verrucomicrobia; Nitr, Nitrospirae; Cyan, Cyanobacteria; Asco, Ascomycota; Basi, Basidiomycota; Blas, Blastocladiomycota; Cerc, Cercozoa; Chyt, Chytridiomycota; Glom, Glomeromycota; Kick, Kickxellomycota; Mort, Mortierellomycota; Olpi, Olpidiomycota; Roze, Rozellomycota.
Biology 10 01114 g005
Table 1. Soil physicochemical properties of the three salinization levels.
Physicochemical FactorS1S2S3
S1_RSS1_BSS2_RSS2_BSS3_RSS3_BS
ECe (ds/m)0.34 ± 0.01 c0.36 ± 0.03 c3.24 ± 0.39 b3.69 ± 0.11 b6.13 ± 0.72 a6.72 ± 0.49 a
pH7.88 ± 0.07 c7.99 ± 0.07 bc8.16 ± 0.04 bc8.23 ± 0.04 b8.32 ± 0.23 ab8.58 ± 0.29 a
clay content (%)0.55 ± 0.23 a0.57 ± 0.12 a0.53 ± 0.19 a0.67 ± 0.10 a0.90 ± 0.67 a0.61 ± 0.03 a
silt content (%)26.72 ± 2.88 a25.69 ± 1.57 a30.91 ± 2.15 a33.09 ± 1.37 a32.47 ± 9.25 a30.95 ± 2.70 a
sand content (%)72.73 ± 3.10 a73.74 ± 1.67 a68.56 ± 2.30 a66.24 ± 1.47 a66.63 ± 9.92 a68.44 ± 2.73 a
K+ (mg/kg)24.00 ± 2.29 e41.5 ± 2.18 d63.67 ± 12.75 c76.50 ± 6.38 b67.33 ± 5.84 bc123.83 ± 1.04 a
Na+ (mg/kg)27.00 ± 2.29 e97.33 ± 3.75 e271.00 ± 36.17 d2890.00 ± 193.08 b652.67 ± 37.44 c3334.67 ± 63.49 a
Ca2+ (mg/kg)158.20 ± 5.78 d151.64 ± 2.73 d495.75 ± 18.43 c1132.00 ± 131.76 b2101.50 ± 361.50 a2193.50 ± 161.47 a
Mg2+ (mg/kg)4.19 ± 0.92 d5.71 ± 1.82 d261.00 ± 24.98 c715.42 ± 65.67 b271.08 ± 94.11 c1582.50 ± 68.27 a
SOC (g/kg)12.61 ± 0.20 a11.23 ± 0.77 b6.29 ± 0.46 c6.20 ± 1.11 c5.49 ± 0.20 c5.67 ± 0.11 c
AN (mg/kg)28.24 ± 2.46 a30.57 ± 4.20 a20.54 ± 2.14 bc22.40 ± 4.28 b16.34 ± 1.07 c18.90 ± 2.14 bc
AP (mg/kg)60.33 ± 3.13 a62.07 ± 1.46 a52.00 ± 3.51 b50.17 ± 2.37 b25.33 ± 1.92 d34.70 ± 2.01 c
AK (mg/kg)242.67 ± 9.71 a242.00 ± 21.52 a142.33 ± 7.77 c205.33 ± 13.50 b109.67 ± 5.86 d98.33 ± 2.89 d
ALP (mg/g/d)3.19 ± 0.20 a3.49 ± 0.37 a1.43 ± 0.06 b0.88 ± 0.18 c0.69 ± 0.06 cd0.42 ± 0.02 d
Invertase (mg/g/d)12.36 ± 1.25 a10.97 ± 1.01 b4.31 ± 0.32 c3.24 ± 0.29 c1.46 ± 0.04 d1.07 ± 0.14 d
Urease (mg/g/d)1.57 ± 0.09 a1.63 ± 0.02 a0.87 ± 0.06 b0.75 ± 0.04 c0.49 ± 0.02 b0.42 ± 0.01 d
CAT (mL/g)1.47 ± 0.12 a1.10 ± 0.06 b1.00 ± 0.03 bc0.94 ± 0.06 c0.85 ± 0.02 cd0.80 ± 0.02 d
Note: Values represent means ± SEs of three replicates. Different letters indicate significant differences at the p < 0.05 level among the different treatments based on one-way ANOVA. Abbreviations: S1, low salinity; S2, medium salinity; S3, high salinity; S1_RS, low salinity of rhizosphere soil; S1_BS, low salinity of bulk soil; S2_RS, medium salinity of rhizosphere soil; S2_BS, medium salinity of bulk soil; S3_RS, high salinity of rhizosphere soil; S3_BS, high salinity of bulk soil; ECe, saturated electrical conductivity; SOC, soil organic carbon; AN, available nitrogen; AP, available phosphorus; AK, available kalium; ALP, alkaline phosphatase; CAT, catalase.
Table 2. The relationships between the soil physicochemical properties, the Shannon diversity and Chao1 indexes and the OTU richness of the microbial communities using Spearman’s correlation analysis.
VariableShannonChao1OTU richness
BacteriaFungiBacteriaFungiBacteriaFungi
ECe−0.543 *−0.652 **0.609 **−0.922 **0.627 **−0.937 **
pH−0.616 **−0.025−0.293−0.387−0.077−0.372
clay−0.090−0.0140.1310.0290.0190.072
silt−0.086−0.4410.538 *−0.3500.408−0.317
sand0.0490.408−0.499 *0.300−0.3810.268
K+−0.576 *−0.571 *0.501 *−0.765 **0.515 *−0.764 **
Na+−0.579 *−0.591 **0.606 **−0.779 **0.528 *−0.772 **
Ca2+−0.586 *−0.668 **0.568 *−0.913 **0.535 *−0.916 **
Mg2+−0.536 *−0.513 *0.662 **−0.724 **0.535 *−0.735 **
SOC0.687 **0.709 **−0.488 *0.920 **−0.4000.926 **
AN0.537 *0.694 **−0.4610.783 **−0.4640.779 **
AP0.543 *0.744 **−0.562 *0.915 **−0.527 *0.936 **
AK0.597 **0.539*−0.647 **0.890 **−0.737 **0.896 **
ALP0.670 **0.596 **−0.558 *0.891 **−0.526 *0.895 **
Invertase0.719 **0.659 **−0.514 *0.905 **−0.508 *0.908 **
Urease0.660 **0.652 **−0.515 *0.901 **−0.535 *0.890 **
CAT0.643 **0.676 **−0.568 *0.913 **−0.604 **0.913 **
Note: * p < 0.05; ** p < 0.01. Abbreviations: ECe, saturated electrical conductivity; SOC, soil organic carbon; AN, available nitrogen; AP, available phosphorus; AK, available kalium; ALP, alkaline phosphatase; CAT, catalase.
Publisher’s Note: MDPI stays neutral with regard to jurisdictional claims in published maps and institutional affiliations.

