Abstract
Dyeing is a major contributor to pollution, with high concentrations of hydrolyzed dyes and electrolytes in its effluents. Recent studies suggest the possibility of dyeing cotton substrates with reactive dyes in an oil medium, reducing the need for electrolytes. This study evaluated the dyeing of cotton yarns with reactive Red 195 dye in an oil medium using crude and refined soybean oil. The method employed 75% oil and 25% water, with the oil recovered for reuse, significantly reducing water consumption and effluent generation. Dyeing with crude soybean oil showed higher color intensity than the conventional method and the use of refined soybean oil. Additionally, reducing electrolyte concentration from 75 to 18.75 g/L did not affect color intensity, yielding similar results to conventional aqueous dyeing. The dyed substrates were tested for washing, rubbing, and lightfastness, showing comparable performance to conventional methods. The dyeing followed pseudo-second-order kinetics, and the Freundlich isotherm model better fit the oil medium process. FTIR analysis revealed no changes in the functional groups on the yarn surface, and tensile strength tests showed similar results across methods. These findings indicate that oil medium dyeing can reduce electrolyte use, conserve water, and allow for oil reuse, demonstrating potential for industrial-scale application.
1. Introduction
The increased environmental pollution has highlighted the urgent need to preserve natural resources. In this context, the textile industry plays a crucial role in reducing the environmental impacts caused by different industrial sectors. One of the most significant environmental impacts of the textile sector is the high water consumption and effluent generation, with the removal of dyes from wastewater gaining prominence in recent studies [1]. However, the effluent treatment cost is significant, accounting for around half of the total cost of wet processing in textiles [1]. Therefore, developing alternative processes that reduce waste generation and natural resource consumption is essential.
Since effluent treatment represents a considerable part of process costs, the best strategy is to invest in improvements that reduce effluent discharge by enhancing dye exhaustion and fixation on textile substrates. According to Liu et al. [2], seeking alternatives to combat water scarcity is crucial. One promising alternative would be to replace water in the dyeing of cellulosic fibers without compromising product quality. Conventional processes generate large effluents containing hydrolyzed dyes, salts, and other additives. Thus, one viable alternative is to use oils instead of water, allowing their recovery and reuse [3,4].
Replacing water with soybean oil enables fiber dyeing without the need for salt. Additionally, dyeing in a biphasic water–oil medium (SWDS) uses a small amount of water, reducing the use of dyes and alkalis [1]. The biphasic solvent system (SWDS) fixes 92% of reactive dyes and reduces effluent discharge by 85% [1]. According to Liu et al. [5], dye fixation improved by 33% without salt, maintaining the same quality as conventional dyeing and reducing material and energy consumption using residual cooking oil. Several studies have tested using residual oil to replace part of the water in conventional dyeing [2].
Dyes can be quickly dissolved in the aqueous phase and adsorbed onto cotton fibers from the water–oil interface [2]. Reactive dyes are the most popular class of cellulosic fibers, with bifunctional reactive dyes commonly used due to their easy application and simple structure [6]. In conventional dyeing processes, dyes are applied in an aqueous medium under alkaline conditions, using NaOH and/or Na2CO3 to deprotonate the cellulose hydroxyl groups, generating ionized hydroxyl groups that are much stronger nucleophiles [7]. However, reactive dyes are prone to undesirable hydrolysis in solution, which hinders adequate dye fixation. Reactive dyes react with water molecules through hydrogen bonds, resulting in low colorfastness on cotton fibers [8] and contributing to high and undesirable levels of dissolved solids and high oxygen demand in the effluent [9].
Effluent from conventional reactive dyeing can contain up to 100 g/L of electrolytes and 50% of the initially applied dyes. In contrast, effluent from reactive dyeing with residual cooking oil contains no electrolytes and only a minimal amount of dyes, which can be discharged after simple treatment [2].
The large volume of wastewater generated by the reactive dyeing of cotton, along with soybeans being the most produced oilseed in Brazil [10,11], motivates this study. The proposed method, which aims to perform dyeing using an emulsion of water and crude or refined soybean oil, is both environmentally beneficial and practical, as can also be seen in the work of Mu [1], who used refined soybean oil in his study and showed that the dye fixation is superior to conventional dyeing, as well as the oil can be reused and pilot scale tests demonstrated that its industrial application is viable. This method offers the confidence-inspiring potential of reusing the oil for multiple dyeing cycles, providing a sustainable and feasible solution to the issue of wastewater in textile production.
2. Materials and Methods
2.1. Materials
The study used reactive Red 195 dye (Dystar, Singapore), whose molecular structure is shown in Figure 1, 100% combed cotton yarn, 30/1 Ne count (Fiasul, Toledo, Brazil), refined and crude soybean oil (Bunge, São Paulo, Brazil), emulsifier lauryl alcohol ethoxylated 7 EO (Color Química, Gaspar, Brazil), anionic wetting detergent (Hanier, São Paulo, Brazil), Fe-sequestering agent (Hanier, São Paulo, Brazil), 50% hydrogen peroxide (BSC Química, Itajaí, Brazil), 50% sodium hydroxide (BSC Química, Itajaí, Brazil), anionic dispersant (Hanier, São Paulo, Brazil), anhydrous sodium sulfate (Manuchar, Rio de Janeiro, Brazil), sodium carbonate (Manuchar, Rio de Janeiro, Brazil), 50% citric acid (BSC Química, Itajaí, Brazil), and non-ionic washing detergent (NS Química, Blumenau, Brazil).
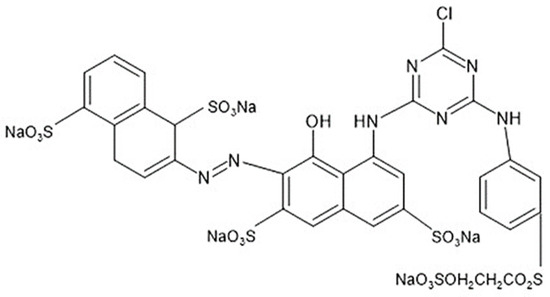
Figure 1.
Molecular structure of the reactive Red 195 dye.
2.2. Conventional Dyeing Process of Cotton Yarn with Reactive Dye
For the dyeing processes, pre-bleached cotton yarns were used with 2.5% H2O2 at 50%, 3% NaOH at 50%, 2% Fe sequestering agent, and 1% anionic wetting detergent at 90 °C for 30 min. The conventional dyeing of the cotton yarns was conducted with a bath ratio 1:20, using 1% anionic dispersant and 2% reactive Red 195 dye, both added at the beginning of the process at 50 °C. After 10 min, 75 g/L of anhydrous sodium sulfate was added. The dye solution was then heated to 80 °C at a 3 °C/min rate. After 30 min, 15 g/L of sodium carbonate was added, and the dyeing was maintained at 80 °C for an additional 60 min.
According to Liu et al. [12], after conventional dyeing or dyeing with the use of oils, it is necessary to wash the dyed substrate to remove hydrolyzed dyes that remain on the fiber surface and are suspended in the dye bath fluid. To remove the hydrolyzed dye, a wash was carried out with clean water at 40 °C for 10 min, followed by a wash at 60 °C with 0.8% citric acid for 10 min. Subsequently, two washes were performed at 90 °C, each with 2% non-ionic detergent, for 10 min each, and a final wash at 40 °C with water only for 10 min. After washing, the samples were dried in an oven at 40 °C.
2.3. Dyeing of Cotton Yarn with Reactive Dye Using Soybean Oil
The oil-based dyeing processes were conducted with a ratio of 25% water and 75% soybean oil, both refined and crude, with the aim of evaluating potential differences in the shade of yarns dyed with oils at different stages of production.
This proportion was defined after preliminary tests, with dyeing according to the formulation and process described below, for ratios of 50% water and 50% oil, 25% eagle and 75% oil, and 10% water and 90% oil. The results can be seen in Figure 2.
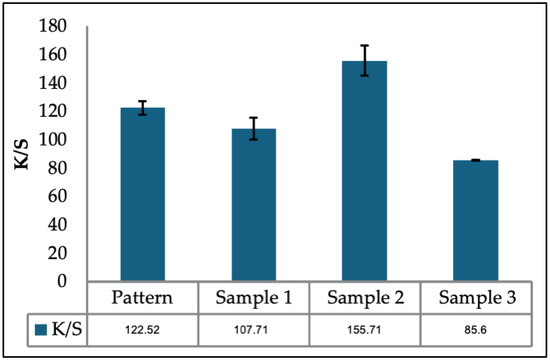
Figure 2.
Preliminary dyeing for determination of the water/oil mixture, where sample 1 is composed of 50% water and 50% oil, sample 2 is composed of 25% water and 75% oil, and sample 3 is composed of 10% water and 90% oil.
The dyeing was carried out with a bath ratio of 1:20. In all samples, 2% o.w.f. of reactive Red 195 dye, 2% dispersant, 3% emulsifier, 15 g/L of sodium carbonate, and the following concentrations of electrolyte (sodium sulfate) were used: 75 g/L (Sample 1), 37.5 g/L (Sample 2), 18.75 g/L (Sample 3), 8.0 g/L (Sample 4), and 0 g/L (Sample 5), aiming to assess the feasibility of reducing or eliminating the use of electrolytes when dyeing cotton with reactive dye in an oil-based medium.
To improve dye dispersion in the oil, 0.1 g of dye was added to 100 mL of oil and stirred for 30 min before starting the dyeing process. For the dyeing process, the required volume of water, emulsifier, dispersant, reactive Red 195 dye solution with soybean oil, electrolyte, and finally a 5 g skein of 30/1 100% cotton yarn were added to the dyeing canister. This mixture was stirred in a KIMAK dyeing machine, model AT1RP, for 10 min, at which point sodium carbonate was added. The entire mixture was then heated to 80 °C and kept under agitation for 60 min. After the dyeing process, the samples were washed and dried according to the procedure described for conventional dyeing.
2.4. Evaluation of the Color Intensity of Dyed Substrates
The color of the samples after each dyeing process was evaluated using a Datacolor spectrophotometer, model Spectrum 500. Measurements of the L*, a*, and b* coordinates in the CIE Lab color spectrum were performed, as well as K/S measurements to determine the color strength for the different dyeings and preparations. Additionally, the color deviation (ΔE) was determined with the standard sample obtained from conventional dyeing with water and the electrolyte concentration recommended by the dye manufacturer.
2.5. Determination of Dye Adsorption Kinetics
With the aim of determining the adsorption kinetics of the dyeing process and understanding the movement of dye compounds from the bath to the cotton yarns, dyeings were carried out in an oil medium using crude soybean oil with a formulation containing 18.75 g/L of electrolyte, which proved to be the most effective in terms of color intensity, as well as conventional dyeing. Dye bath samples were collected at different times and temperatures. These bath samples were analyzed using a UV/Vis spectrophotometer from Bel, model UV-M51, at a wavelength of 544 nm. The results, particularly their application to the pseudo-first-order and pseudo-second-order kinetic models, hold significant implications for the field of textile chemistry and dyeing processes.
The pseudo-first-order kinetic equation was the first to describe the adsorption process in solid–liquid systems. Lagergren proposed this equation in 1898 based on the solid’s adsorption capacity. The model assumes that the solid’s rate of occupation is proportional to the number of available active sites in the adsorbent structure [13]. The linear form of the pseudo-first-order equation is represented by Equation (1) [14,15].
where qe and qt are the amounts of adsorbate adsorbed (mg/g) at equilibrium and at time t (min), respectively, and k1 is the adsorption rate constant (min−1). The pseudo-second-order model is represented by Equation (2) [14,15], where k is the pseudo-second-order rate constant (g/mg∙min), and qe and qt are the amounts of dye adsorbed (mg/g) at equilibrium and at time t (min), respectively.
2.6. Determination of Dyeing Isotherm
To obtain the isotherm model that best fits the dyeing process in an oil medium with crude soybean oil, dyeings were carried out using a formulation containing 18.75 g/L of sodium sulfate and conventional dyeing for comparison. The dyeings were conducted in both processes with 0.5%, 1.0%, 2.0%, 3.0%, and 4.0% o.w.f. of dye. Samples of the dye baths were collected at the beginning and end of the dyeing process for each concentration. The dye baths were analyzed by UV/Vis spectrophotometry at a wavelength of 544 nm. The data were applied to the Langmuir and Freundlich isotherm models. Equation (3) represents the Langmuir isotherm model, where qe represents the amount of solute in the solid phase at equilibrium (mg/g), Ce represents the concentration in the liquid phase at equilibrium (mg/L), KL is the Langmuir constant, related to adsorption capacity and energy, and qm represents the maximum amount of solute adsorbed to form a complete monolayer (mg/g) [16,17].
The Freundlich isotherm model can be described according to Equation (4).
where qe is the amount of solute adsorbed per unit mass (mg/g); Ce is the equilibrium concentration of the solute in the fluid phase (mg/L); 1/n is the surface energy heterogeneity parameter and kF is the Freundlich adsorption capacity constant parameter.
2.7. Oil Recovery Assessment
The dyeing tests for oil recovery were conducted with 3% o.w.f. of reactive Red 195 dye, using a ratio of 75% crude oil, 25% water, and 18.50 g/L of sodium sulfate. According to Liu et al. [5], after the first dyeing cycle using soybean oil, the remaining oil on the textile substrate can be collected from the dyed fabric using a vacuum. This oil is collected with the aim of being reused for three additional dyeing cycles.
2.7.1. Extraction of Oil from the Textile Substrate
According to Liu et al. [5], after the first dyeing cycle using soybean oil, the remaining oil on the textile substrate can be collected from the dyed fabric using a vacuum to reuse it for three additional dyeing cycles. Furthermore, according to the study by [1], removing oil from the cotton substrate can be performed through high-speed centrifugation. After the dyeing process, the oil in the dyed fabric can be collected by vacuum, immersion in hot water, and high-pressure compression [12]. In this study, the oil extraction from the substrate was carried out by vacuum and then by washing the yarn according to the washing methodology.
2.7.2. Extraction of Oil from Bath After Dyeing
The final dye bath was centrifuged at 3500 rpm and left to rest for 30 min. After this time, the oil at the top was removed using a pipette, measured in a graduated cylinder, and separated for the new dyeing cycle.
2.7.3. Reuse of Oil
After each dyeing process, the amount of recovered oil needed to be measured and topped up with crude oil to maintain the required volume for the next dyeing. After each dyeing cycle, the samples were subjected to new color measurements to determine the color strength. Five oil recovery cycles were performed. In the studies by Liu et al. [2], reuse tests were conducted over several dyeing cycles, using the dye fixation rate and K/S value to determine the dyeing quality for each recovery cycle.
2.8. Fourier Transform Infrared Spectroscopy
Fourier transform infrared spectroscopy (FTIR) was used to examine the interaction of characteristic functional groups and verify the presence of soybean oil adhered to the textile substrate. The analyses were performed using a Fourier transform infrared spectrometer in ATR mode (CARY 600—Series FT-IR spectrometer, Agilent Technologies, Santa Clara, CA, USA), with readings in the 4000–450 cm−1 region and a resolution of 2 cm−1. All analyses were carried out under standard environmental conditions (55–60% relative humidity, 25 ± 1 °C).
2.9. Tensile Strength
Samples from the conventional dyeing process and Sample 3 from the oil-based dyeing process were subjected to tensile strength and elongation testing. The tensile strength and elongation analysis aimed to identify possible changes in the yarn’s strength resulting from dyeing in an oil medium. These tests were carried out using a Premier brand single-yarn dynamometer, which determined the force required to break the yarn, indicating any loss or gain in strength after the oil-based dyeing process.
2.10. Color Fastness Tests
The determination of color fastness to washing was based on the ABNT NBR ISO 105 C06 standard, using the Kimak AT1RP laboratory machine (KIMAK, Brusque, Brazil) at a temperature of 60 °C. The dry and wet rubbing fastness tests were conducted by the NBR ISO 105-X12 standard, using a semi-automatic crockmeter from Atlas. The samples were subjected to 10 rubbing cycles.
The lightfastness tests were performed according to the NBR ISO 105-B02 standard. The test involved exposure to light for 25 h using the Q-SUN Xe-2 equipment from Q-LAB, Westlake, OH, USA. The evaluation was performed using the blue scale, with a rating from 1 to 8, where 1 represents very low fastness and 8 represents excellent fastness.
3. Results
3.1. Color Intensity Evaluation
The results of strength, ΔE and K/S, which are parameters for evaluating color intensity, are presented in Table 1.

Table 1.
Color intensity parameters of samples dyed using the conventional (standard) method and for samples with varying oil type and electrolyte concentration.
The K/S values indicate that the color intensity is higher when dyeing is performed with crude soybean oil, which can be explained by the presence of phospholipids [10], which are amphipathic, meaning one end of the molecule is hydrophobic and the other hydrophilic. This characteristic may have facilitated the adsorption of the dye onto the cellulose surface. Regarding the amount of electrolytes added to the dye bath, the concentration that most closely matches the color intensity of the samples to the standard is 18 g/L of sodium sulfate, indicating the possibility of a 75% reduction in the amount of electrolyte used in the dyeing process. To better visualize these results, Figure 3 presents the K/S color intensity values for the standard sample, dyed by the conventional method, and the color intensity for the samples dyed in the oil medium. It can be observed graphically that the color intensity for Sample 3, using crude oil, is like the color intensity of the standard sample, considering the standard deviation.
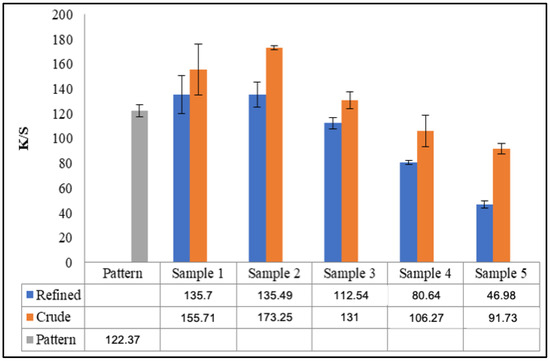
Figure 3.
Graphical representation of K/S values for dyeing performed with refined and crude soybean oils and variation in electrolyte concentration.
In comparison with the conventional dyeing process, the emulsion system eliminates the need for electrolytes to achieve the same depth of shade with 2% o.w.f., thus generating electrolyte-free effluents [1,2,12]. However, in this study, the color intensity at the same dye concentration for the sample without added electrolytes was 38.39% and 74.96% of the standard sample’s color intensity for refined and crude oils, respectively.
3.2. Dyeing Adsorption Kinetics
In Figure 4, it is possible to evaluate the effect of time on the adsorption of the dye in the water phase of the conventional process and in the process in an oily medium with the presence of salt in both phases of the system.
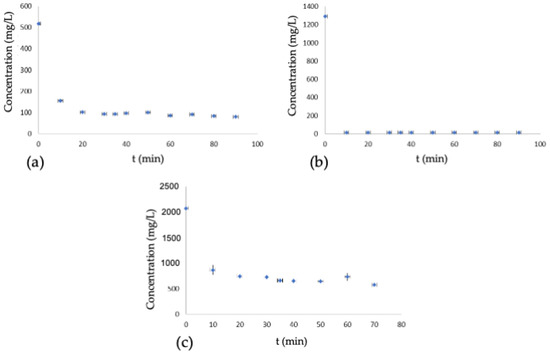
Figure 4.
Dyeing kinetics, (a) conventional dyeing, (b) dyeing with oil and presence of salt, oil phase, (c) dyeing with oil and presence of salt, water phase.
With the increased equilibrium conversion rate, the dye molecules move quickly to the internal phase (water) of the dual-phase dyeing system, resulting in a high concentration of dye in this phase and a substantial increase in dye adsorption [5].
The same behavior is observed in dyeing processes using the oil system, where low dye adsorption occurs in the oil phase due to the low chemical potential. In contrast, in the water phase, the dye’s chemical potential increases substantially. In conventional dyeing, it is impossible to observe the increase in chemical potential due to its homogeneous distribution in the bath. The dyeing did not show any adjustment to the pseudo-first-order kinetic model. The linearization of the pseudo-second order kinetic model, a key aspect of our comprehensive research, is presented in Figure 5.
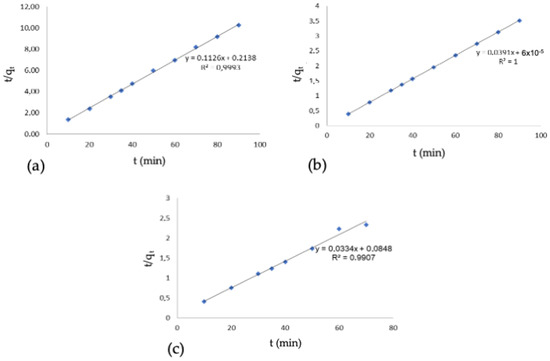
Figure 5.
Pseudo-second-order kinetics, (a) conventional dyeing, (b) dyeing with oil and presence of salt, oil phase, (c) dyeing with oil and presence of salt, water phase.
This model shows good linear fits, with 99.93% for the conventional dyeing and 100% and 99.07% for the oil-based dyeing in the oil and water phases, respectively. The results obtained are consistent with the studies by Mu et al. [1], which show that the fixation kinetics for both the conventional dyeing system and the dual-phase dyeing system are governed by the pseudo-second-order kinetic model. The pseudo-second-order kinetic model, as described by Liu et al. [5], is the most suitable model to describe both dyeing systems, demonstrated by an R2 of 0.99 for the conventional system and 0.99 for the emulsion system.
3.3. Dyeing Isotherms
The mathematical model of the Langmuir isotherm was applied to the conventional dyeing process and the dyeing process in an oil medium, and the results can be seen in Figure 6.
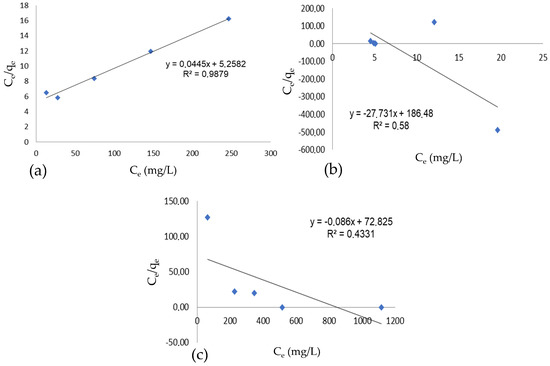
Figure 6.
Langmuir isotherm, (a) conventional dyeing, (b) dyeing with oil and presence of salt, oil phase, (c) dyeing with oil and presence of salt, water phase.
The results found only converge for the conventional dyeing process. When comparing the results of the Langmuir isotherm for oil-based dyeing, this study obtained linearizations of 58% and 43.31%, differing from the results of Mu et al. [1], which showed no significant difference between the two systems. According to the study by Liu et al. [2], the Langmuir model showed a better fit to the data than the Freundlich model, thus better describing the dye fixation behavior in both dyeing systems, with an R2 of 0.97 for conventional dyeing and an R2 of 0.98 for oil-based dyeing. The Freundlich isotherm was also applied to the conventional and oil-based dyeing processes, and the results are shown in Figure 7.
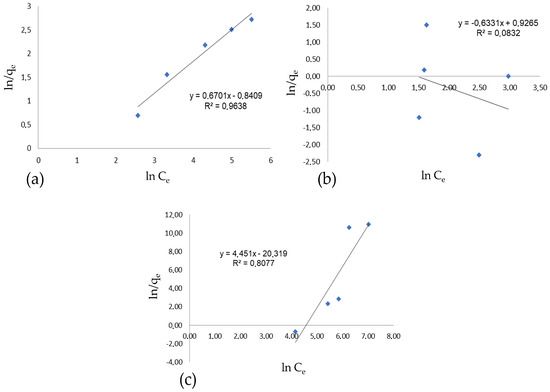
Figure 7.
Freundlich isotherm for dyeing: (a) conventional dyeing, (b) dyeing with oil and the presence of salt, oil phase, (c) dyeing with oil and the presence of salt, water phase.
The adjustment to the Freundlich model for oily dyeing in the oil phase was 8.32%, while in the water phase, it was 80.77%.
3.4. Evaluation of Oil Recovery
Table 2 shows the amount of oil recovered after each dyeing test.
Table 2.
Amount of oil recovered.
According to studies by Mu et al. [1], after five dyeing cycles in the water–oil dual-phase system, good recyclability can be obtained, although the K/S value decreases slightly. Figure 8 shows the residual dye bath.
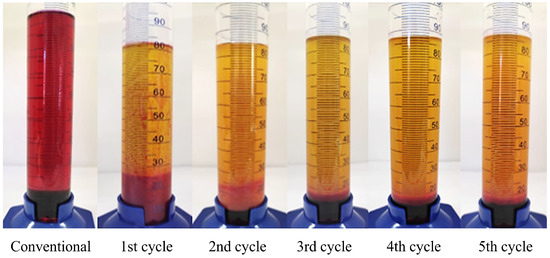
Figure 8.
Residual dye bath.
The samples subjected to dyeing tests to recover the oil in five consecutive cycles presented results of color strength superior to conventional dyeing, with 29.90% greater color intensity in the second cycle, as shown in Table 3.
Table 3.
Coloristic evaluation of samples dyed with recycled oil.
The results presented in Table 3 show that oil reuse is possible when evaluated according to color strength. From the third cycle of oil reuse onward, a different behavior was observed compared to the literature, which reports a noticeable decrease in K/S values. The study by Liu et al. [5] observed that, due to the hydrolysis of the used cooking oil, the dye fixation and K/S values of cotton fabrics significantly decreased over the first three additional dyeing cycles. According to the studies by Liu et al. [2], it was also concluded that the dye fixation rate and K/S values drastically decreased as the water and oil system was repeatedly used for cotton dyeing.
3.5. FTIR Analysis
Figure 9a,b present the FTIR spectrum of refined and crude soybean oil, respectively, highlighting several identifiable absorption bands. The prominent absorption bands at 1745 and 1748 cm⁻1 correspond to the stretching mode of the ester carbonyl group (C=O). The bands at 2851, 2852, 2927, and 2922 cm⁻1 are associated with the symmetric and asymmetric stretching vibrations of the -C-H bond (CH2), while the bands at 2948 and 2946 cm⁻1 correspond to the asymmetric stretching vibrations of -C-H (CH3), and also the bands at 3008 and 3010 cm⁻1 correspond to the asymmetric stretching vibrations of =C-H, respectively [18,19]. Additionally, the bands observed at 1458 and 1456 cm⁻1 are attributed to the scissoring vibrations of CH2, along with medium-intensity C–O stretching bands at 1155 and 1156 cm⁻1. According to the authors [14], a weak peak at 1653 and 1650 cm⁻1 is related to C=C stretching vibrations. The spectrum also features a medium-intensity bands at 728 and 725 cm⁻1, attributed to the rocking vibrations of long-chain methylene groups, characteristic of long-carbon-chain fatty acids—(CH2)n—[20].
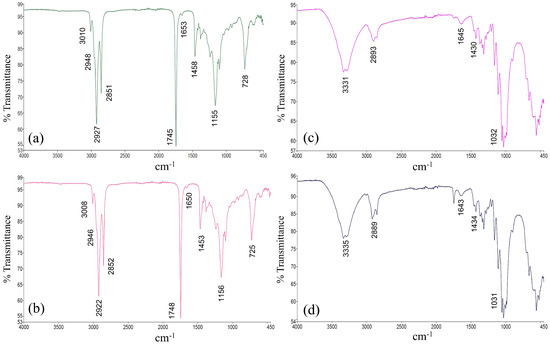
Figure 9.
Fourier transform infrared spectroscopy characterization. (a) crude oil; (b) refined oil, (c) conventional dyeing; (d) dyeing in oil medium.
Figure 9c,d show the FTIR spectrum of cotton yarns dyed by the conventional process (with water), and the best result dyed in an oily medium, respectively. The main absorption bands observed include bands at 3331 and 3335 cm⁻1 due to the stretching vibrations of hydroxyl groups (O-H) present in cellulose. Between 2893 and 2889 cm⁻1, related to the C-H stretching in CH, CH2, and CH3 groups [21]. Bands at 1643 and 1645 cm⁻1 are related to adsorbed water molecules. Bands around 1031 cm⁻1 correspond to cellulose chains’ glycosidic bonds (C-O-C stretching). Bands at 1430 and 1434 cm⁻1 correspond to CH2 bending vibrations. The remaining bands observed in the 710–900 cm⁻1 region are typically due to CH and CH2 wagging and rocking movements in the cellulose structure [22,23].
In evaluating the results presented, significant changes in the organic functional groups on the surface of the dyed yarns were not detectable. This indicates that there is no chemical bond between the oils and the cotton fiber and that the processes of extracting the residual oil from the fabric were effective in cleaning the fiber.
3.6. Tensile Strength
Tensile strength tests are presented in Table 4.
Table 4.
Resistance parameters.
It can be observed that dyeing in an oil medium reduces the strength of the yarn compared to the results obtained for raw and conventionally dyed yarns, with reductions of 10.18% and 7.53%, respectively. In terms of elongation, there was an increase of 10.56% compared to the raw yarn and a reduction of 7.53% compared to the standard dyed yarn. Regarding tenacity, it was lower for the yarn dyed using the oil method, but none of the results prevented the yarn from being used in subsequent textile processes.
3.7. Color Fastness Tests
In evaluating color transfer in the wash fastness test, it was found that all grayscale results were four/five, indicating no variation in fastness when comparing conventional and oil-based dyeing. These results are like those obtained by Liu et al. [5], who dyed cotton with reactive dye using waste cooking oil to minimize dye and salt discharge.
The dry and wet rubbing fastness tests evaluated the dye transfer from the dyed yarn to the test fabric. Table 5 presents the results of color transfer from the dyed yarn to the test fabric in the dry and wet rubbing fastness tests.
Table 5.
Color transfer from the dyed yarn to the test fabric in the dry and wet rubbing fastness tests.
The results of the wet rubbing fastness tests show a gradual improvement as the amount of sodium sulfate used in dyeing decreases. The work of Liu et al. [5] and the studies by Mu et al. [1] present similar results regarding rubbing fastness. Compared to the studies by Mu et al. [1], the results are identical in the dry rubbing fastness test, where maximum dry rubbing fastness ratings were obtained.
It is observed that the lightfastness ratings in oil-based dyeing are seven and six for salt amounts between 75 and 18.75 g/L, while the absence of salt reduces the lightfastness by one point compared to conventional dyeing. This indicates that salt in dyeing facilitates better dye–fiber interaction, promoting the dye–fiber reaction. The studies by Liu et al. [2,12] and Mu et al. [1] found lightfastness ratings of six and five, respectively, in their experiments. Table 6 shows the color change after the light fastness test.
Table 6.
Color change after light fastness test.
4. Discussion
This study assessed the performance of dyeing cotton yarns in an oil-based medium compared to conventional methods, focusing on color intensity, dye adsorption kinetics, isotherms, oil recovery, FTIR analysis, tensile strength, and color fastness. The findings reveal significant advantages and challenges of the oil-based process, emphasizing its sustainability and efficiency.
The higher color intensity observed when using crude soybean oil is linked to the amphipathic nature of phospholipids, which enhance dye adsorption onto cellulose. An amount of 18 g/L of sodium sulfate reduced electrolyte usage by 75%, minimizing environmental impact. However, color intensity was significantly lower without added electrolytes, highlighting the need for optimized conditions. The oil emulsion system eliminated electrolytes while maintaining similar shade depths, generating cleaner effluents.
Kinetic studies showed that the pseudo-second-order model best describes dye adsorption in the oil-based system, with excellent linear fits (R2 ≥ 99%). This suggests chemisorption as the dominant mechanism, with unique dynamics in the dual-phase system favoring dye migration to the water phase.
For the conventional dyeing system, both the Langmuir isotherm and the Freundlich isotherm presented adjustments to the mathematical models. Oil–water phase dyeing no longer presented the same behavior. It is known that dyeings registered by the Langmuir isotherm are those in which fiber and dye interact strongly, dyes and fibers have opposite polarity, and the dye presents specific affinity. In the case of dyeings governed by the Freundlich isotherm, dyes and fibers have the same polarity, the interaction between the dye and the fiber is weak, and the bonds are usually by H-bridges or Van der Valls forces. Since the results of the experiments did not show a tendency towards an isotherm model, in oil–water phase dyeings, it is possible that the dye–fiber interaction does not occur in a similar way to dyeings in aqueous medium, requiring further investigation to determine the best dyeing mechanism.
Oil recovery results confirmed the reuse feasibility, with higher color intensity observed during the second cycle. However, a decline in K/S values after the third cycle aligns with the literature, likely due to the oil’s hydrolysis. Managing oil quality is essential for maintaining performance in repeated cycles. FTIR analysis confirmed that no chemical bonds formed between the oils and cotton fibers, and the residual oil was effectively removed, preserving the fiber’s chemical integrity.
The tensile strength of yarns dyed in the oil medium decreased slightly compared to raw and conventionally dyed yarns but remained within acceptable limits. Elongation increased compared to raw yarns, but was slightly lower than conventionally dyed samples. These mechanical changes require process adjustments to balance dyeing performance with fiber properties.
Color fastness tests showed comparable results between conventional and oil-based processes. Wash fastness ratings were consistent (4/5), and wet rubbing fastness improved with reduced sodium sulfate. Lightfastness was slightly higher in oil-based dyeing with salt but decreased in its absence, underlining the importance of controlled salt concentrations for optimal performance.
Overall, the oil-based dyeing system demonstrates potential as a sustainable alternative to conventional methods, offering reduced electrolyte usage, oil recyclability, and comparable color and fastness properties. Further research is needed to refine process parameters and address challenges such as maintaining oil quality during reuse and optimizing the mechanical properties of dyed fibers for industrial applications.
The technique used in this study can be used on an industrial scale, in exhaust dyeing equipment, such as jet dyeing, for example. However, for this technique to be used, further studies on equipment, such as pump and valve sizing, are necessary. There is also a need to separate the machine feed pipes so that there is no contamination of existing systems and to maintain the aqueous medium, as well as the separation of effluents for both disposal and reuse or treatment. The industrial application of this technique can be a specific study, with data on environmental impacts, layout requirements, costs, and feasibility.
5. Conclusions
This study evaluated the possibility of reducing the consumption of natural resources, such as water, and pollutants, such as salts, by comparing the conventional dyeing process with the dual-phase oil and water dyeing process through laboratory tests. Experiments were conducted with different proportions of water and crude soybean oil. The proportion of 75% crude soybean oil and 25% water provided results equivalent to the conventional dyeing process, considering color strength and K/S values. A small amount of water was necessary to ensure the effectiveness of the cotton yarn dyeing.
After determining the best oil-to-water ratio for cotton yarn dyeing in an oil medium, the reduction in electrolyte concentration was evaluated through laboratory tests, varying from 75.00 g/L, 37.50 g/L, 18.75 g/L, 8.00 g/L, and finally, without electrolyte. To maintain a quality standard equivalent to conventional dyeing, 18.75 g/L of electrolyte concentration showed satisfactory results in the wash fastness, dry/wet rubbing fastness, and light fastness tests.
With the proportions of crude soybean oil, water, and electrolytes defined, tests were conducted to reuse the oil used in dyeing. Over five cycles, oil and water residues containing hydrolyzed dyes were separated, achieving an average recovery rate of 85.67% per cycle. This successful reuse of oil not only ensures the sustainability of the process but also maintains color strength and K/S values higher than those of the conventional process from the first to the fifth dyeing cycle.
The FTIR analysis results showed no significant changes in the organic functional groups on the surface of cotton yarns dyed with either the conventional or oil-based process. This reiterates the high quality and consistency of the dyed yarns, regardless of the dyeing process used. The results indicate that oil-based dyeing has the potential for industrial-scale production. It can achieve satisfactory results with reduced salt use and, most notably, the reuse of oil for five consecutive cycles.
Author Contributions
Conceptualization, C.R.S.d.O., S.M.d.A.G.U.d.S. and C.R.L.d.A.; methodology, C.R.S.d.O. and C.R.L.d.A.; validation, S.M.d.A.G.U.d.S., C.R.L.d.A., C.R.S.d.O. and A.H.d.S.J.; formal analysis, S.M.d.A.G.U.d.S., C.R.L.d.A., C.R.S.d.O. and A.H.d.S.J.; investigation, E.L., C.R.S.d.O. and A.H.d.S.J.; data curation, C.R.L.d.A., S.M.d.A.G.U.d.S., E.L., C.R.S.d.O. and A.H.d.S.J.; writing—original draft preparation, C.R.L.d.A., S.M.d.A.G.U.d.S., E.L., C.R.S.d.O. and A.H.d.S.J.; writing—review and editing, C.R.L.d.A., S.M.d.A.G.U.d.S., E.L., C.R.S.d.O. and A.H.d.S.J.; supervision, C.R.L.d.A. and S.M.d.A.G.U.d.S. All authors have read and agreed to the published version of the manuscript.
Funding
This research received no external funding.
Institutional Review Board Statement
Not applicable.
Informed Consent Statement
Not applicable.
Data Availability Statement
Data are contained within the article.
Conflicts of Interest
The authors declare no conflicts of interest.
References
- Mu, B.; Liu, L.; Li, W.; Yang, Y. High Sorption of Reactive Dyes onto Cotton Controlled by Chemical Potential Gradient for Reduction of Dyeing Effluents. J. Environ. Manag. 2019, 239, 271–278. [Google Scholar] [CrossRef]
- Liu, L.; Mu, B.; Li, W.; Xu, H.; Yang, J.; Yang, Y. Clean Cotton Dyeing in Circulated Dyebath of Waste Cooking Oil: A Feasible Industrialization Strategy for Pollution Minimization. J. Clean. Prod. 2021, 278, 123799. [Google Scholar] [CrossRef]
- Pei, L.; Gu, X.; Wang, J. Sustainable Dyeing of Cotton Fabric with Reactive Dye in Silicone Oil Emulsion for Improving Dye Uptake and Reducing Wastewater. Cellulose 2021, 28, 2537–2550. [Google Scholar] [CrossRef]
- Wang, J.; Zhang, Y.; Dou, H.; Pei, L. Influence of Ethylene Oxide Content in Nonionic Surfactant to the Hydrolysis of Reactive Dye in Silicone Non-Aqueous Dyeing System. Polymers 2018, 10, 1158. [Google Scholar] [CrossRef]
- Liu, L.; Mu, B.; Li, W.; Yang, Y. Cost-Effective Reactive Dyeing Using Spent Cooking Oil for Minimal Discharge of Dyes and Salts. J. Clean. Prod. 2019, 227, 1023–1034. [Google Scholar] [CrossRef]
- Patel, M.J.; Tandel, R.C. Dyeing and Printing Study of Synthesized Reactive Dyes Using Phenyl Urea Bifunctional Reactive Dyes on Cotton Fabric. Mater. Today Proc. 2022, 51, 770–778. [Google Scholar] [CrossRef]
- Burkinshaw, S.M.; Salihu, G. The Role of Auxiliaries in the Immersion Dyeing of Textile Fibres: Part 1 an Overview. Dyes Pigments 2019, 161, 519–530. [Google Scholar] [CrossRef]
- Lee, C.H.; Tang, A.Y.L.; Wang, Y.; Kan, C.W. Effect of Reverse Micelle-Encapsulated Reactive Dyes Agglomeration in Dyeing Properties of Cotton. Dyes Pigments 2019, 161, 51–57. [Google Scholar] [CrossRef]
- Khatri, A.; Peerzada, M.H.; Mohsin, M.; White, M. A Review on Developments in Dyeing Cotton Fabrics with Reactive Dyes for Reducing Effluent Pollution. J. Clean. Prod. 2015, 87, 50–57. [Google Scholar] [CrossRef]
- dos Passos, R.M.; da Silva, R.M.; de Almeida Pontes, P.V.; Morgano, M.A.; Meirelles, A.J.A.; Stevens, C.V.; Ferreira, M.C.; Sampaio, K.A. Phospholipase Cocktail: A New Degumming Technique for Crude Soybean Oil. LWT 2022, 159, 113197. [Google Scholar] [CrossRef]
- Pei, L.; Luo, Y.; Saleem, M.A.; Wang, J. Sustainable Pilot Scale Reactive Dyeing Based on Silicone Oil for Improving Dye Fixation and Reducing Discharges. J. Clean. Prod. 2021, 279, 123831. [Google Scholar] [CrossRef]
- Liu, L.; Mu, B.; Li, W.; Yang, Y. Semistable Emulsion System Based on Spent Cooking Oil for Pilot-Scale Reactive Dyeing with Minimal Discharges. ACS Sustain. Chem. Eng. 2019, 7, 13698–13707. [Google Scholar] [CrossRef]
- Aksu, Z.; Tezer, S. Biosorption of Reactive Dyes on the Green Alga Chlorella vulgaris. Process Biochem. 2005, 40, 1347–1361. [Google Scholar] [CrossRef]
- Ho, Y.S.; McKay, G. Pseudo-Second Order Model for Sorption Processes. Process Biochem. 1999, 34, 451–465. [Google Scholar] [CrossRef]
- Ramaraju, B.; Manoj Kumar Reddy, P.; Subrahmanyam, C. Low-Cost Adsorbents from Agricultural Waste for Removal of Dyes. Environ. Prog. Sustain. Energy 2014, 33, 38–46. [Google Scholar] [CrossRef]
- Ho, Y. Review of Second-Order Models for Adsorption Systems. J. Hazard. Mater. 2006, 136, 681–689. [Google Scholar] [CrossRef]
- Langmuir, I. The Adsorption of Gases on Plane Surfaces of Glass, Mica and Platinum. J. Am. Chem. Soc. 1918, 40, 1361–1403. [Google Scholar] [CrossRef]
- Kuligowski, J.; Quintás, G.; Esteve-Turrillas, F.A.; Garrigues, S.; de la Guardia, M. On-Line Gel Permeation Chromatography–Attenuated Total Reflectance–Fourier Transform Infrared Determination of Lecithin and Soybean Oil in Dietary Supplements. J. Chromatogr. A 2008, 1185, 71–77. [Google Scholar] [CrossRef]
- Lerma-García, M.J.; Ramis-Ramos, G.; Herrero-Martínez, J.M.; Simó-Alfonso, E.F. Authentication of Extra Virgin Olive Oils by Fourier-Transform Infrared Spectroscopy. Food Chem. 2010, 118, 78–83. [Google Scholar] [CrossRef]
- Kadamne, J.V.; Jain, V.P.; Saleh, M.; Proctor, A. Measurement of Conjugated Linoleic Acid (CLA) in CLA-Rich Soy Oil by Attenuated Total Reflectance−Fourier Transform Infrared Spectroscopy (ATR−FTIR). J. Agric. Food Chem. 2009, 57, 10483–10488. [Google Scholar] [CrossRef]
- de Oliveira, C.R.S.; Batistella, M.A.; Ulson de Souza, S.M.d.A.G.; Ulson de Souza, A.A. Development of Flexible Sensors Using Knit Fabrics with Conductive Polyaniline Coating and Graphite Electrodes. J. Appl. Polym. Sci. 2017, 134, 44785. [Google Scholar] [CrossRef]
- de Oliveira, C.R.S.; Batistella, M.A.; Ulson de Souza, S.M.d.A.G.; Ulson de Souza, A.A. Functionalization of Cellulosic Fibers with a Kaolinite-TiO2 Nano-Hybrid Composite via a Solvothermal Process for Flame Retardant Applications. Carbohydr. Polym. 2021, 266, 118108. [Google Scholar] [CrossRef] [PubMed]
- de Oliveira, C.R.S.; Batistella, M.A.; Lourenço, L.A.; Ulson de Souza, S.M.d.A.G.; Ulson de Souza, A.A. Cotton Fabric Finishing Based on Phosphate/Clay Mineral by Direct-Coating Technique and Its Influence on the Thermal Stability of the Fibers. Prog. Org. Coat. 2021, 150, 105949. [Google Scholar] [CrossRef]


Disclaimer/Publisher’s Note: The statements, opinions and data contained in all publications are solely those of the individual author(s) and contributor(s) and not of MDPI and/or the editor(s). MDPI and/or the editor(s) disclaim responsibility for any injury to people or property resulting from any ideas, methods, instructions or products referred to in the content. |
© 2025 by the authors. Licensee MDPI, Basel, Switzerland. This article is an open access article distributed under the terms and conditions of the Creative Commons Attribution (CC BY) license (https://creativecommons.org/licenses/by/4.0/).