Article

Synthesis of High Near-Infrared Reflective Black Pigment Based on YMn2O5

Department of Chemistry and Biotechnology, Faculty of Engineering, and Center for Research on Green Sustainable Chemistry, Tottori University, 4-101, Koyama-cho Minami, Tottori 680-8552, Japan
*
Author to whom correspondence should be addressed.
Colorants 2023, 2(4), 705-715; https://doi.org/10.3390/colorants2040036
Submission received: 14 September 2023 / Revised: 2 November 2023 / Accepted: 30 November 2023 / Published: 6 December 2023
(This article belongs to the Special Issue Feature Papers in Colorant Chemistry)

Abstract

:
Y(Mn0.95M0.05)2O5 (M = Al, Fe, Ga, Ti, and Zr) samples were synthesized via a sol–gel method using citric acid to find a new near-infrared (NIR) reflective black pigment. Among these samples, the optical reflectance of Y(Mn0.95Fe0.05)2O5 and Y(Mn0.95Ga0.05)2O5 in the near-infrared region was found to be larger than that of YMn2O5. Then, the concentration of the dopant (Fe or Ga) was changed between 0 and 15%, and the resulting UV–Vis–NIR reflectance spectra were measured. As a result, the optical reflectance of the Fe-doped samples decreased in the near-infrared region, while that of the Ga-doped samples increased. Accordingly, Y(Mn1−xGax)2O5 (0 ≤ x ≤ 0.20) samples were synthesized, and the crystal structure, particle size, optical properties, and color of the samples were characterized. The single-phase samples were obtained in the composition range of 0 ≤ x ≤ 0.15, and the lattice volume decreased with increasing Ga3+ concentration. Optical absorption below 850 nm was attributed to the charge transfer transition between O2p and Mn3d orbitals, and the absorption wavelength of Y(Mn1−xGax)2O5 shifted to the shorter wavelength side as the Ga3+ content increased, because of the decrease in the Mn3+ concentration. Although the sample color became slightly reddish black by the Ga3+ doping, the solar reflectance in the near-infrared region reached 47.6% at the composition of Y(Mn0.85Ga0.15)2O5. Furthermore, this NIR reflectance value was higher than those of the commercially available products (R < 45%).

Graphical Abstract

1. Introduction

As the need for power and energy conservation increases, there is a growing demand for thermal barrier coatings. A black color, in particular, usually causes a large rise in room temperature and requires a large amount of cooling energy when it is applied to roofing materials and automobiles. Therefore, black thermal barrier pigments with high performance are required. Existing black thermal barrier inorganic pigments such as iron titanate (Fe2TiO4) and iron–chromium mixed oxide ((Fe,Cr)2O3) have typically been used so far [1]. However, these materials are not pure black, and their solar reflectance is not sufficient. Furthermore, safety considerations have recently led to a demand for chromium-free materials, and new black thermal barrier materials are needed to replace existing materials [2,3,4,5].
Based on this situation, we focused on YMn2O5 as a base material with the aim of developing a novel environmentally friendly black heat-blocking pigment. YMn2O5 adopts an orthorhombic structure (space group: Pbam), where Mn3+ and Mn4+ ions are anti-ferromagnetically ordered; the former are coordinated with five O2− ions and the latter are six coordinated [6,7]. Although this compound has been reported as a catalyst [8,9] and a ferroelectric material [10,11], there have been few studies on its color and optical properties. YMnO3, which is composed of the same metallic elements but has a different composition, is already known as a black heat-blocking pigment [12,13]. However, this compound has a slightly bluish black color, and its solar reflectance in the wavelength range of 700–1300 nm, which is most involved in heat generation, is not so high. There are similar challenges with respect to other conventional black pigments, such as manganese–bismuth oxide and calcium–manganese–titanium oxide. Thus, the development of a black pigment with a higher solar reflectance in the wavelength range of 700–1300 nm is desired.
The band structure of YMn2O5 is composed of a valence band consisting of O2p orbitals and a conduction band consisting of Mn3d orbitals [14]. Accordingly, it is considered that YMn2O5 strongly absorbs visible light (300~700 nm) due to the O2p–Mn3d charge transfer transition and reflects near-infrared (NIR) light (700–2500 nm). In this study, we synthesized Y(Mn0.95M0.05)2O5 (M = Al, Fe, Ga, Ti, and Zr) samples and characterized their NIR reflectance property to obtain a new environmentally friendly pigment that possesses high thermal barrier performance and a sufficient black color. Among these samples, the optical reflectance of Y(Mn0.95Fe0.05)2O5 and Y(Mn0.95Ga0.05)2O5 in the near-infrared region was improved compared with that of YMn2O5. Accordingly, Y(Mn1−xMx)2O5 (M = Fe or Ga, 0 ≤ x ≤ 0.15) samples were synthesized, and it was found that Ga3+-doping was more effective than Fe3+ in enhancing the NIR reflectivity. In this study, therefore, Y(Mn1−xGax)2O5 (0 ≤ x ≤ 0.20) samples were synthesized, and the crystal structure, particle size, optical properties, and color of the samples were characterized. From the viewpoint of practical application, a color comparison with YMnO3 and commercially available black pigments and an evaluation of chemical stability were carried out. As a result, we found that the Y(Mn0.85Ga0.15)2O5 pigment exhibits higher solar reflectance in the wavelength range of 700–1300 nm compared to conventional black pigments and has the potential to become a new NIR-reflective inorganic black pigment.

2. Materials and Methods

2.1. Synthesis

The Y(Mn0.95M0.05)2O5 (M = Al, Fe, Ga, Ti, and Zr) samples were synthesized using a citrate sol–gel method. Y(NO3)3·6H2O (Kishida Chemical, Osaka, Japan, 99.9%), (CH3COO)2Mn·4H2O (FUJIFILM Wako Pure Chemical, Osaka, Japan, 99.9%), Al(NO3)3·9H2O (FUJIFILM Wako Pure Chemical, 98.0%), Fe(NO3)3·9H2O (FUJIFILM Wako Pure Chemical, 99.9%), Ga(NO3)3·8H2O (Kishida Chemical, 99.0%), [(CH3)2CHO]4Ti (FUJIFILM Wako Pure Chemical, 95.0%), ZrO(NO3)2·2H2O (FUJIFILM Wako Pure Chemical, 97.0%), and citric acid (FUJIFILM Wako Pure Chemical, 98.0%) powders were weighed as shown in Table 1. [(CH3)2CHO]4Ti was dissolved in a mixed solution of 5 cm3 of deionized water, 10 cm3 of nitric acid, and 45 cm3 of ethanol. ZrO(NO3)2·2H2O was dissolved in a mixed solution of 50 cm3 of deionized water and 5 cm3 of nitric acid, and the other nitrates were dissolved in 50 cm3 of deionized water. Each raw material solution was mixed and stirred homogeneously; then, citric acid (CA) powder was added as a chelating agent. The mixed solution was stirred at 90 °C until a gel was obtained, and the gel was dried at 120 °C in an oven for 24 h. The dried gel was placed in an alumina crucible and calcined at 500 °C in air for 6 h. After calcination, the samples were again heated at 1100 °C in air for 12 h. Before characterization, the samples were ground in an agate mortar.
The Y(Mn1−xFex)2O5 (0 ≤ x ≤ 0.15) and Y(Mn1−xGax)2O5 (0 ≤ x ≤ 0.20) samples were synthesized via the same procedure described above for the Y(Mn0.95M0.05)2O5 (M = Fe or Ga) samples. The starting materials were weighed as listed in Table 2 and Table 3.

2.2. Characterization

Crystalline phases and structures were identified by means of X-ray powder diffraction (XRD; Rigaku, Ultima IV). The diffraction patterns were measured using Cu Kα radiation at 40 kV and 40 mA. The XRD data were collected by scanning in the 2θ range of 20–80°. The sampling width was 0.02°, and the scan speed was 6° min−1. The lattice volumes were calculated from the XRD peak angles refined using CellCalc Ver. 2.20 software with α-Al2O3 as a standard. Optical reflectance spectra were recorded using an ultraviolet–visible–near-infrared (UV–Vis–NIR) spectrometer (JASCO, Hachioji, Japan, V-770 with an integrating sphere attachment) using a standard white plate as a reference. The step width was 1 nm, and the scan rate was 1000 nm min−1. Electron micrographs of the sample particles were taken using a Hitachi H-7650 transmission electron microscope (TEM) operating at 100 kV. The sample particles were dispersed ultrasonically in ethanol and then supported on amorphous carbon film on a copper TEM grid. The color properties of the powder samples were evaluated in the Commission Internationale de l’Éclairage (CIE) L*a*b*C system using a color chromatometer (Konica-Minolta, CR-400). The L* parameter indicates brightness or darkness on a neutral gray scale. The a* and b* values represent the red–green and yellow–blue axes, respectively. The chroma parameter (C) represents saturation and is calculated by the formula C = [(a*)2 + (b*)2]1/2. The standard deviation of all values in the L*a*b*C color coordinate data was less than 0.1. The NIR solar reflectance (R) was calculated using the following equation [15]:
R = 700 2500 r λ i λ d λ 700 2500 i λ d λ
where r(λ) is the spectral reflectance obtained from experiments and i(λ) is the standard solar spectrum (W m−2 nm−1). The NIR reflectance value (R) is expressed as the integral of the product of the observed spectral reflectance and the solar irradiance divided by the product of the solar radiation, both integrated over the range of 700 to 2500 nm.

3. Results and Discussion

3.1. Y(Mn0.95M0.05)2O5 (M = Al, Fe, Ga, Ti, and Zr)

3.1.1. X-ray Powder Diffraction (XRD)

Figure 1 shows the XRD patterns of the Y(Mn0.95M0.05)2O5 (M = Al, Fe, Ga, Ti, and Zr) samples. In the samples with Al, Fe, Ga, and Ti, the target YMn2O5 phase was obtained as a single phase. On the other hand, in the sample with Zr, the target YMn2O5 phase was obtained as the main phase, but YMnO3 and ZrO2 peaks were detected as impurities, resulting in a mixed phase.

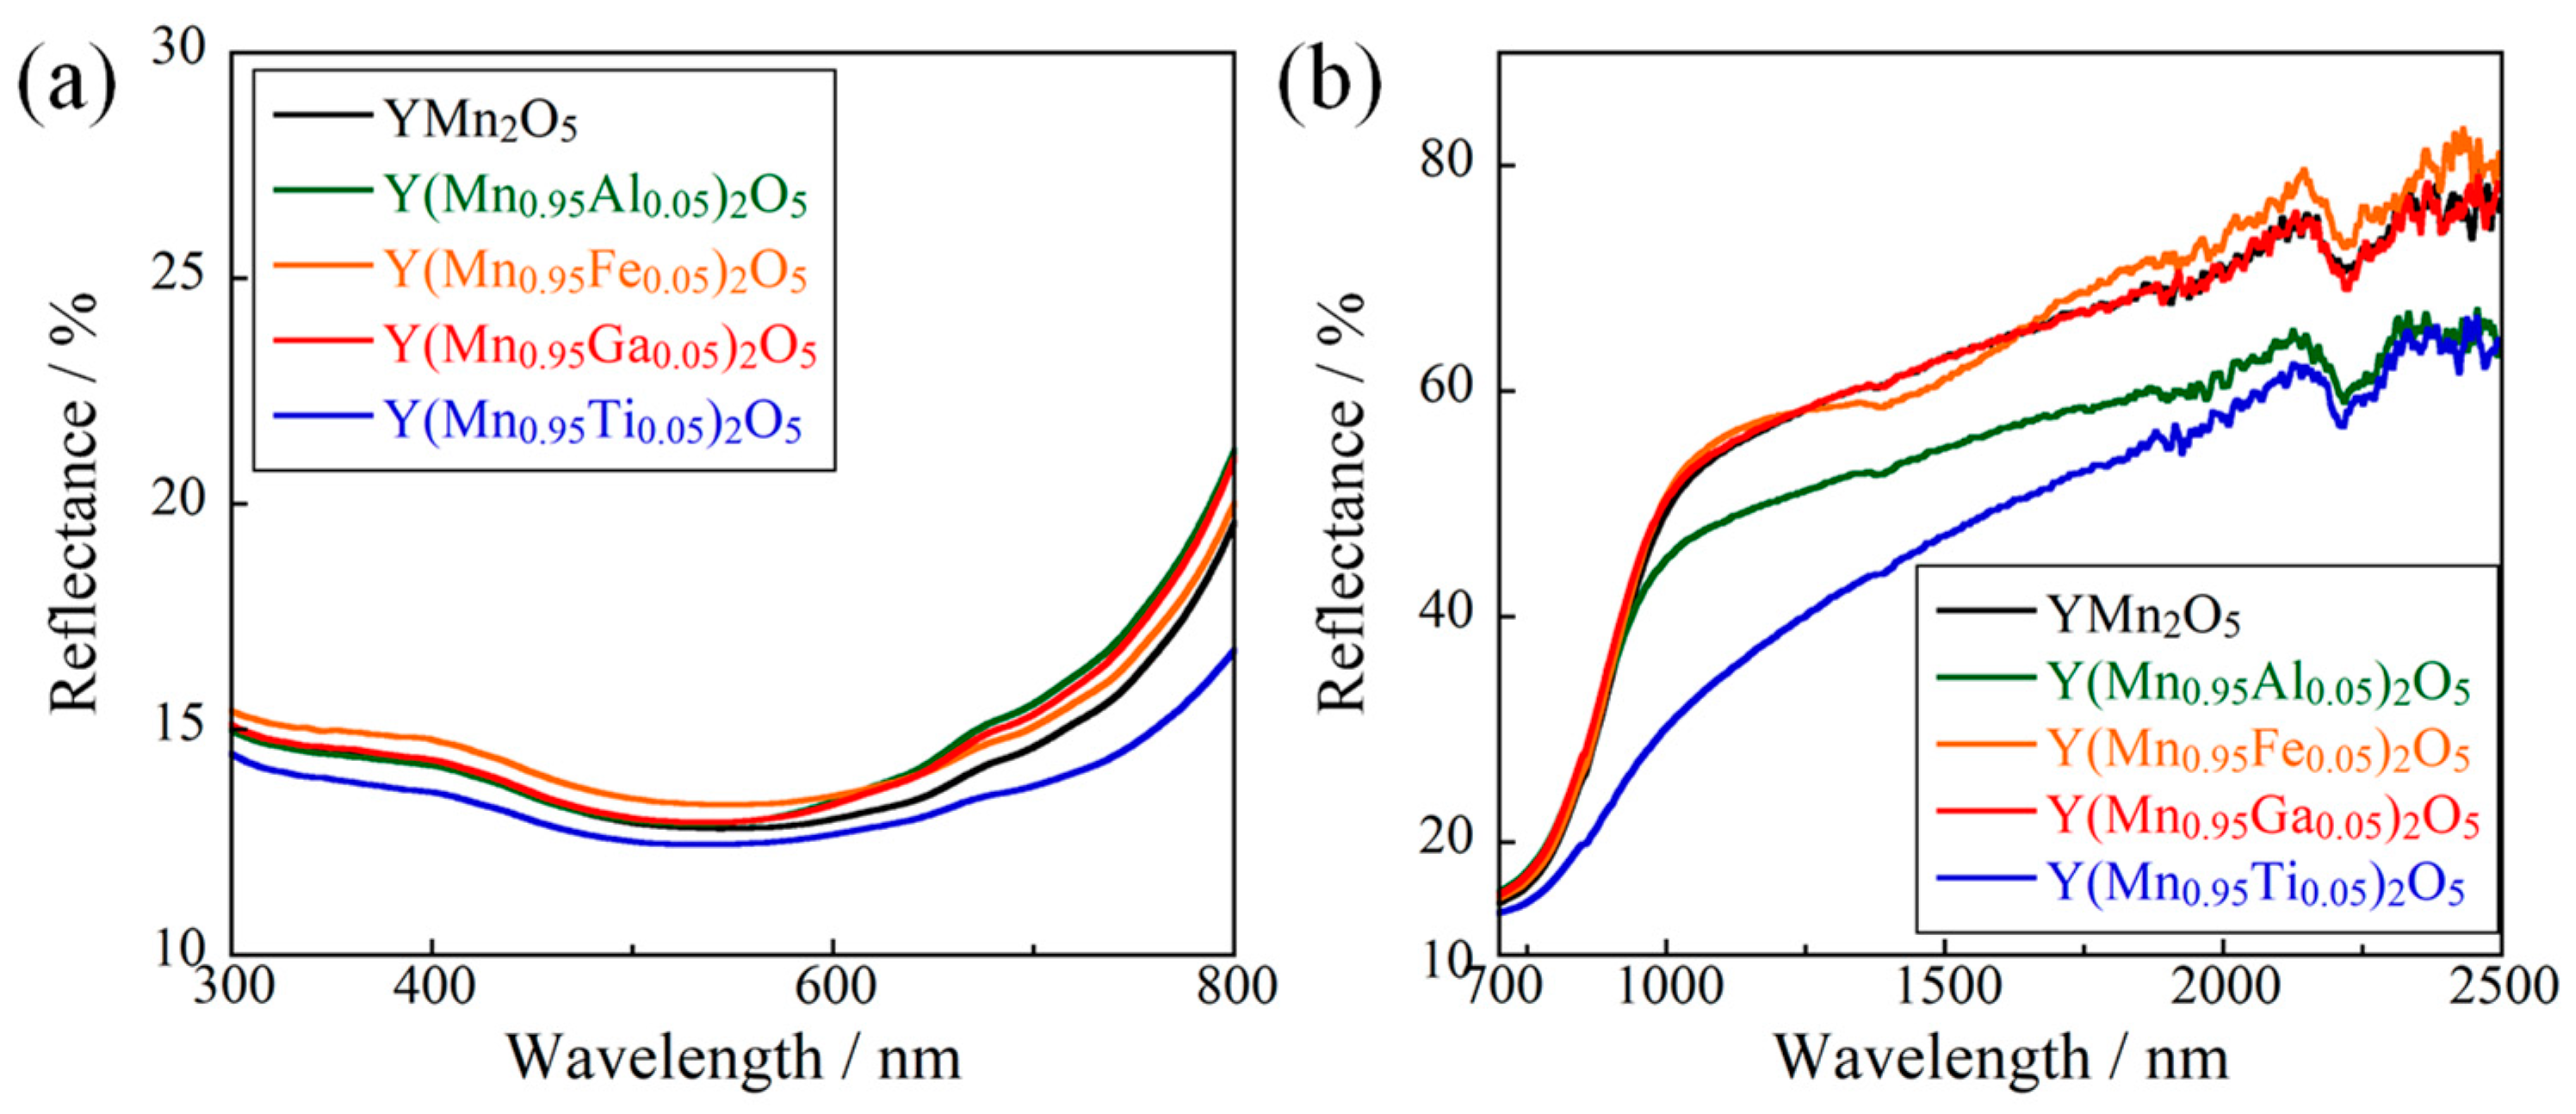
3.1.2. Ultraviolet–Visible–Near-Infrared (UV–Vis–NIR) Reflectance Spectra

The UV–Vis and NIR reflectance spectra of YMn2O5 and Y(Mn0.95M0.05)2O5 (M = Al, Fe, Ga, and Ti) obtained with a single target phase in Section 3.1.1 are shown in Figure 2a,b, respectively. In the visible region, the optical absorption around 700 nm due to the O2p–Mn3d charge transfer transition [14] was weakened by the doping of Al, Fe, and Ga. The O2p–Mn3d charge transfer transition of the Mn3+-doped sample was weaker than that of the host material because Mn3+ in the host lattice was partially replaced by Al3+, Fe3+, and Ga3+, resulting in a lower Mn3+ concentration. On the other hand, the Ti4+-doped sample showed enhanced optical absorption around 700 nm. The O2p–Mn3d charge transfer transition was not inhibited because Ti4+ should have replaced the Mn4+ sites. The ionic radius of Ti4+ (ionic radius at the six-coordination site: 0.0605 nm [16]) is larger than that of Mn4+ (ionic radius at the six-coordination site: 0.053 nm [16]), suggesting that the MnO6 octahedron is distorted by Ti4+ doping. As a result, the spin-forbidden 4A2g2Eg, 2T1g transitions of Mn4+ were enhanced [17]. These are the reasons for the enhanced optical absorption around 700 nm due to Ti4+ doping.
In the case of M = Fe and Ga, the reflectance in the near-infrared region from 700 nm to 2500 nm was slightly improved compared to that of YMn2O5. This is probably due to the partial substitution of Mn3+ with trivalent Fe3+ and Ga3+, which reduced the concentration of Mn3+ and weakened the charge transfer absorption between Mn3+ and Mn4+ [18].
On the other hand, for M = Al, the reflectance in the near-infrared region was lower than for YMn2O5. This is considered to be because of the ionic radius of Al3+ (ionic radius: 0.048 nm at five-coordination sites [16]), which distorts the crystal structure significantly and increases lattice defects. For M = Ti, the reflectance in the near-infrared region was significantly lower than that of YMn2O5. This is considered to be due to the partial substitution of Ti4+ for Mn4+, which strengthens the d-d transition absorption attributed to the 5Eg to 5T2g transition of Mn3+ [19].

3.1.3. Color Properties

The L*a*b*C color coordinate data and NIR solar reflectance (R) of the YMn2O5 and Y(Mn0.95M0.05)2O5 (M = Al, Fe, Ga, and Ti) powder samples are summarized in Table 4. All the Y(Mn0.95M0.05)2O5 samples exhibited lower L* values than the YMn2O5 sample. However, the C value of the Al-doped sample increased, and its R value decreased. In the case of M = Ti, although the C value was lower compared to that of the host material, the R value also declined significantly. Only the samples with Fe or Ga additions exceeded the solar reflectance of YMn2O5. Thus, some Fe- or Ga-doped samples with different compositions were additionally synthesized, and their optical properties are evaluated in the next section.

3.2. Y(Mn1−xFex)2O5 (0 ≤ x ≤ 0.15)

Figure 3 shows the XRD patterns of the Y(Mn1−xFex)2O5 (0 ≤ x ≤ 0.15) samples. In the x range of 0 to 0.10, the YMn2O5 phase was obtained as a single phase. However, in the case of x = 0.15, the target phase and some impurities were detected. Therefore, the solid solubility limit of Y(Mn1–xFex)2O5 is less than 15%. Figure 4a shows the UV–visible reflectance spectra of the Y(Mn1−xFex)2O5 samples, where x is from 0 to 0.15. All samples absorbed visible light at wavelengths shorter than 700 nm, due to the O2p–Mn3d charge transfer transition [14]; as a result, these samples were black. However, as shown in Figure 4b, the reflectance at wavelengths of 700 nm to 2500 nm was decreased with increasing Fe3+ content, because of the d-d transition attributed to the 6A1 to 4T1 transition of Fe3+ [20].
The L*a*b*C color coordinate data and NIR solar reflectance (R) of the Y(Mn1−xFex)2O5 powder samples, where x is from 0 to 0.15, are summarized in Table 5. Similarly to the results in Figure 4, the NIR reflectance value decreased with increasing Fe3+ content. Unfortunately, we found that increasing the amount of iron doping degraded performance, so we decided to study the Ga-doped samples in detail.

3.3. Y(Mn1−xGax)2O5 (0 ≤ x ≤ 0.20)

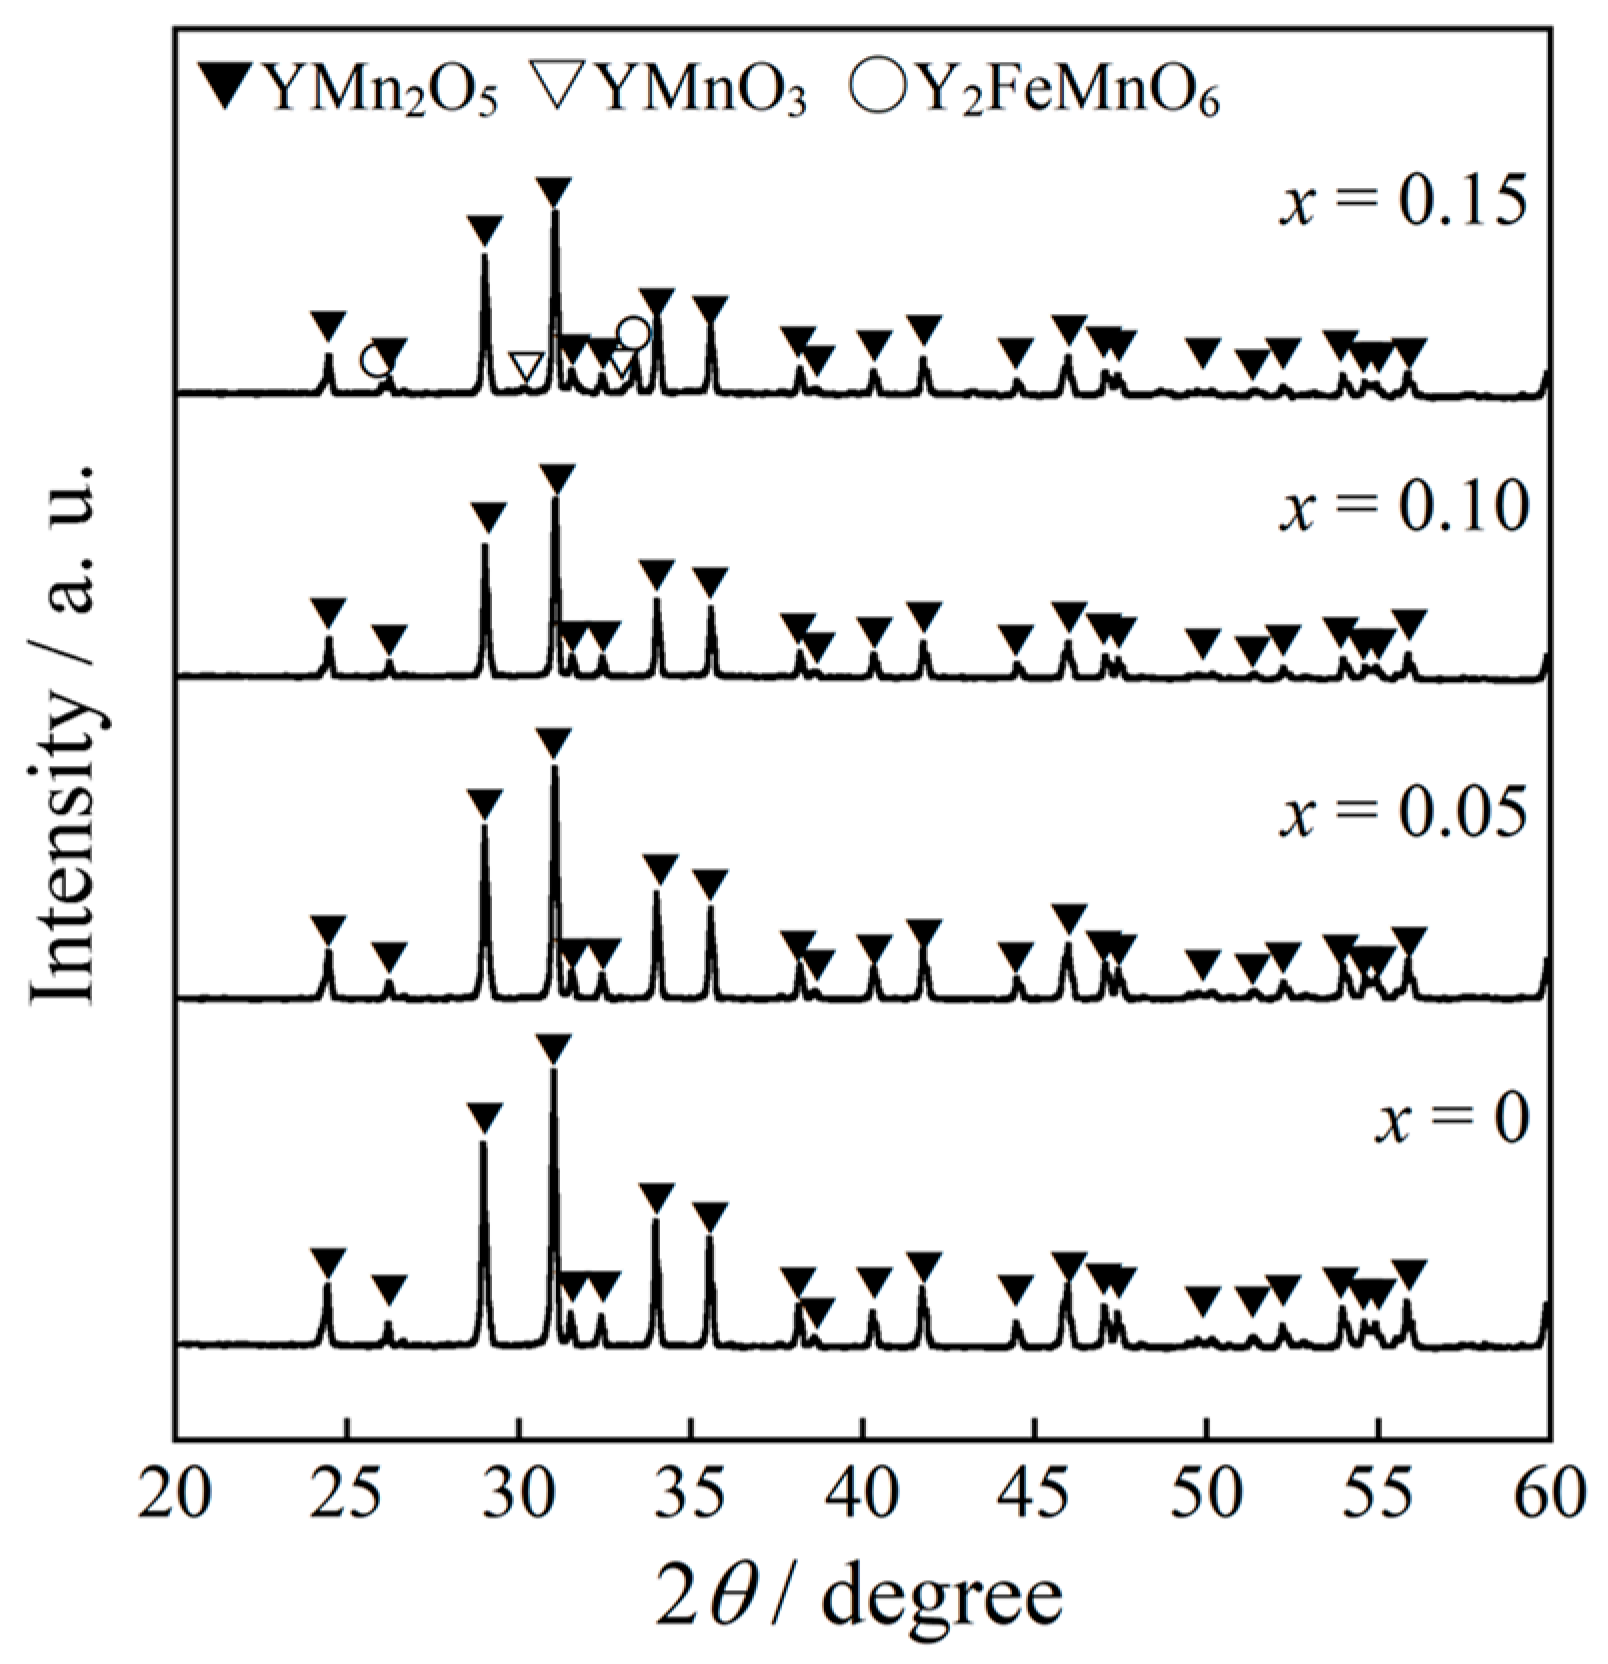
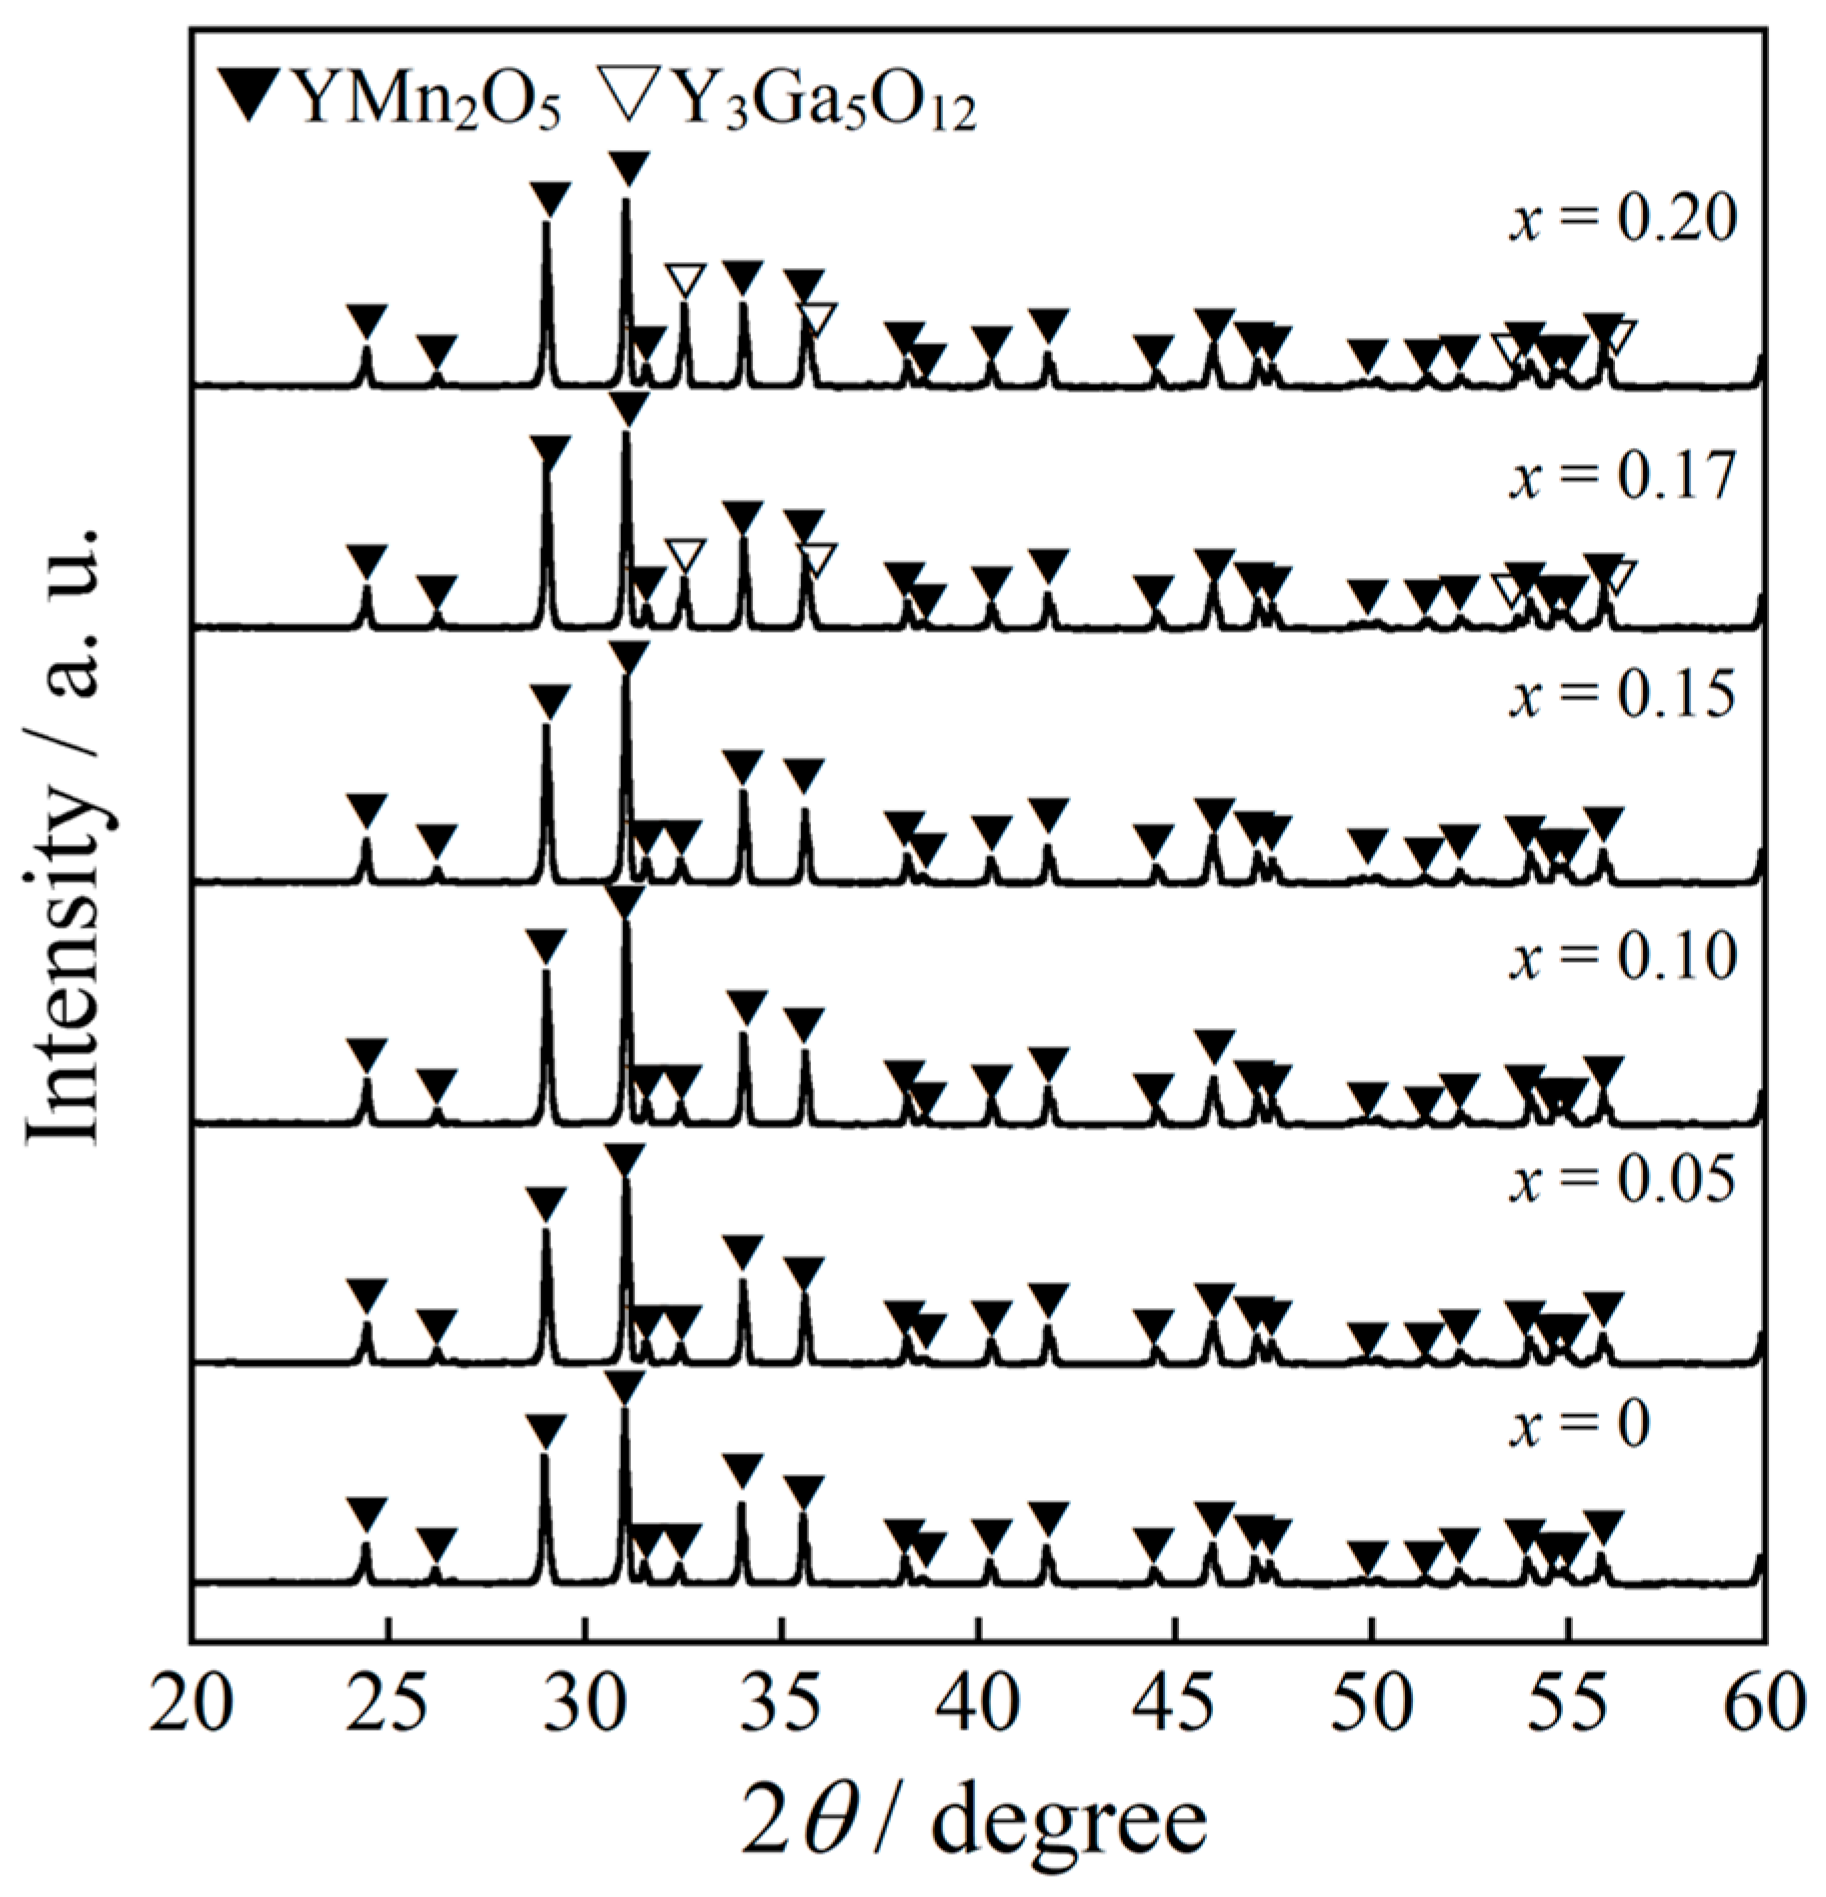
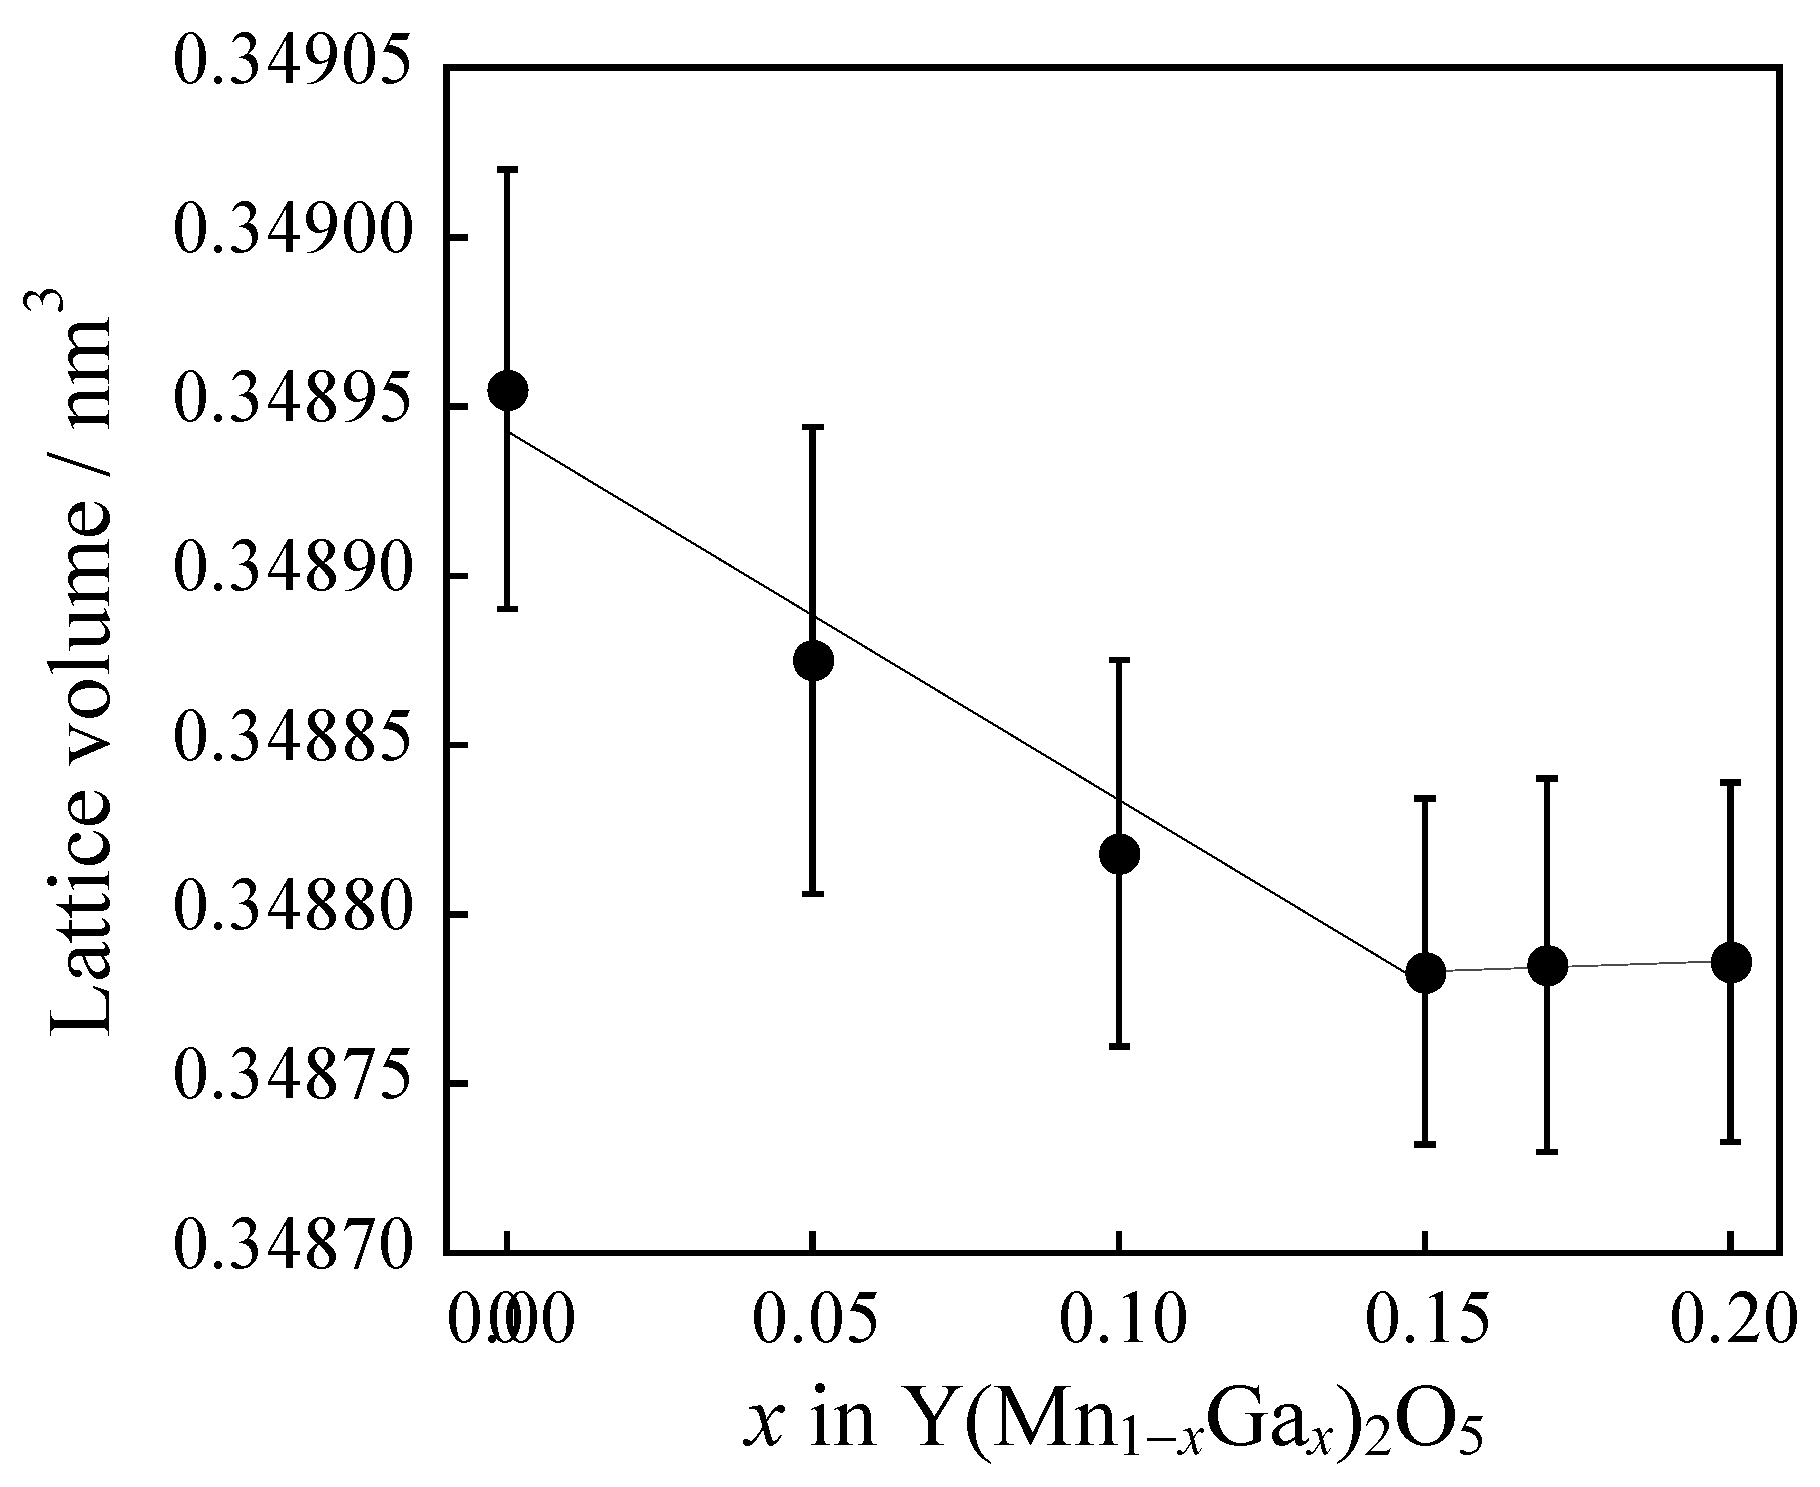
3.3.1. X-ray Powder Diffraction (XRD)

Figure 5 shows the XRD patterns of the Y(Mn1−xGax)2O5 (0 ≤ x ≤ 0.20) samples. For x ranging from 0 to 0.15, the YMn2O5 phase was obtained as a single phase. In contrast, for x ≥ 0.17, the target phase was observed as the main phase, but an additional impurity indexed as Y3Ga5O12 was also detected. The composition dependence of the lattice volume of the samples calculated from each XRD pattern is shown in Figure 6. The introduction of small Ga3+ (ionic radius: 0.055 nm, five-coordination site [16]) ions into the Mn3+ (ionic radius: 0.058 nm, five-coordination site [16]) sites resulted in a linear increase in lattice volume with increasing Ga3+ content in the x ≤ 0.15 range. The substitution of six-coordinated Mn4+ sites with Ga3+ is ruled out, because the ionic radius of hexacoordinated Ga3+ (0.062 nm [16]) is larger than that of Mn4+ (0.053 nm [16]), so the lattice volume should increase with increasing Ga3+ concentration. The cell volumes at x = 0.17 and 0.20 were almost equal to that at x = 0.15. Thus, Y(Mn1−xGax)2O5 solid solutions were successfully synthesized in the x = 0 to 0.15 region.
Figure 7 shows TEM images of YMn2O5 and Y(Mn0.85Ga0.15)2O5 samples obtained as a single phase. In both samples, the primary particles were very small, about 500 nm. These primary particles aggregated to form secondary particles of about 3 µm in size. No effect of Ga doping on particle size was observed. Therefore, the improvement in NIR solar reflectance due to Ga doping, which is discussed in the next section, is not due to a difference in particle size.

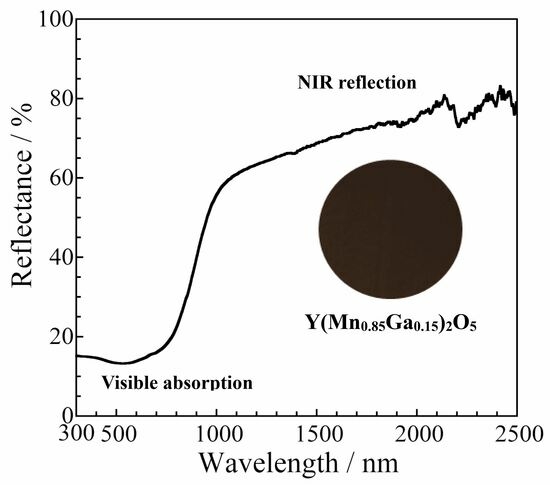
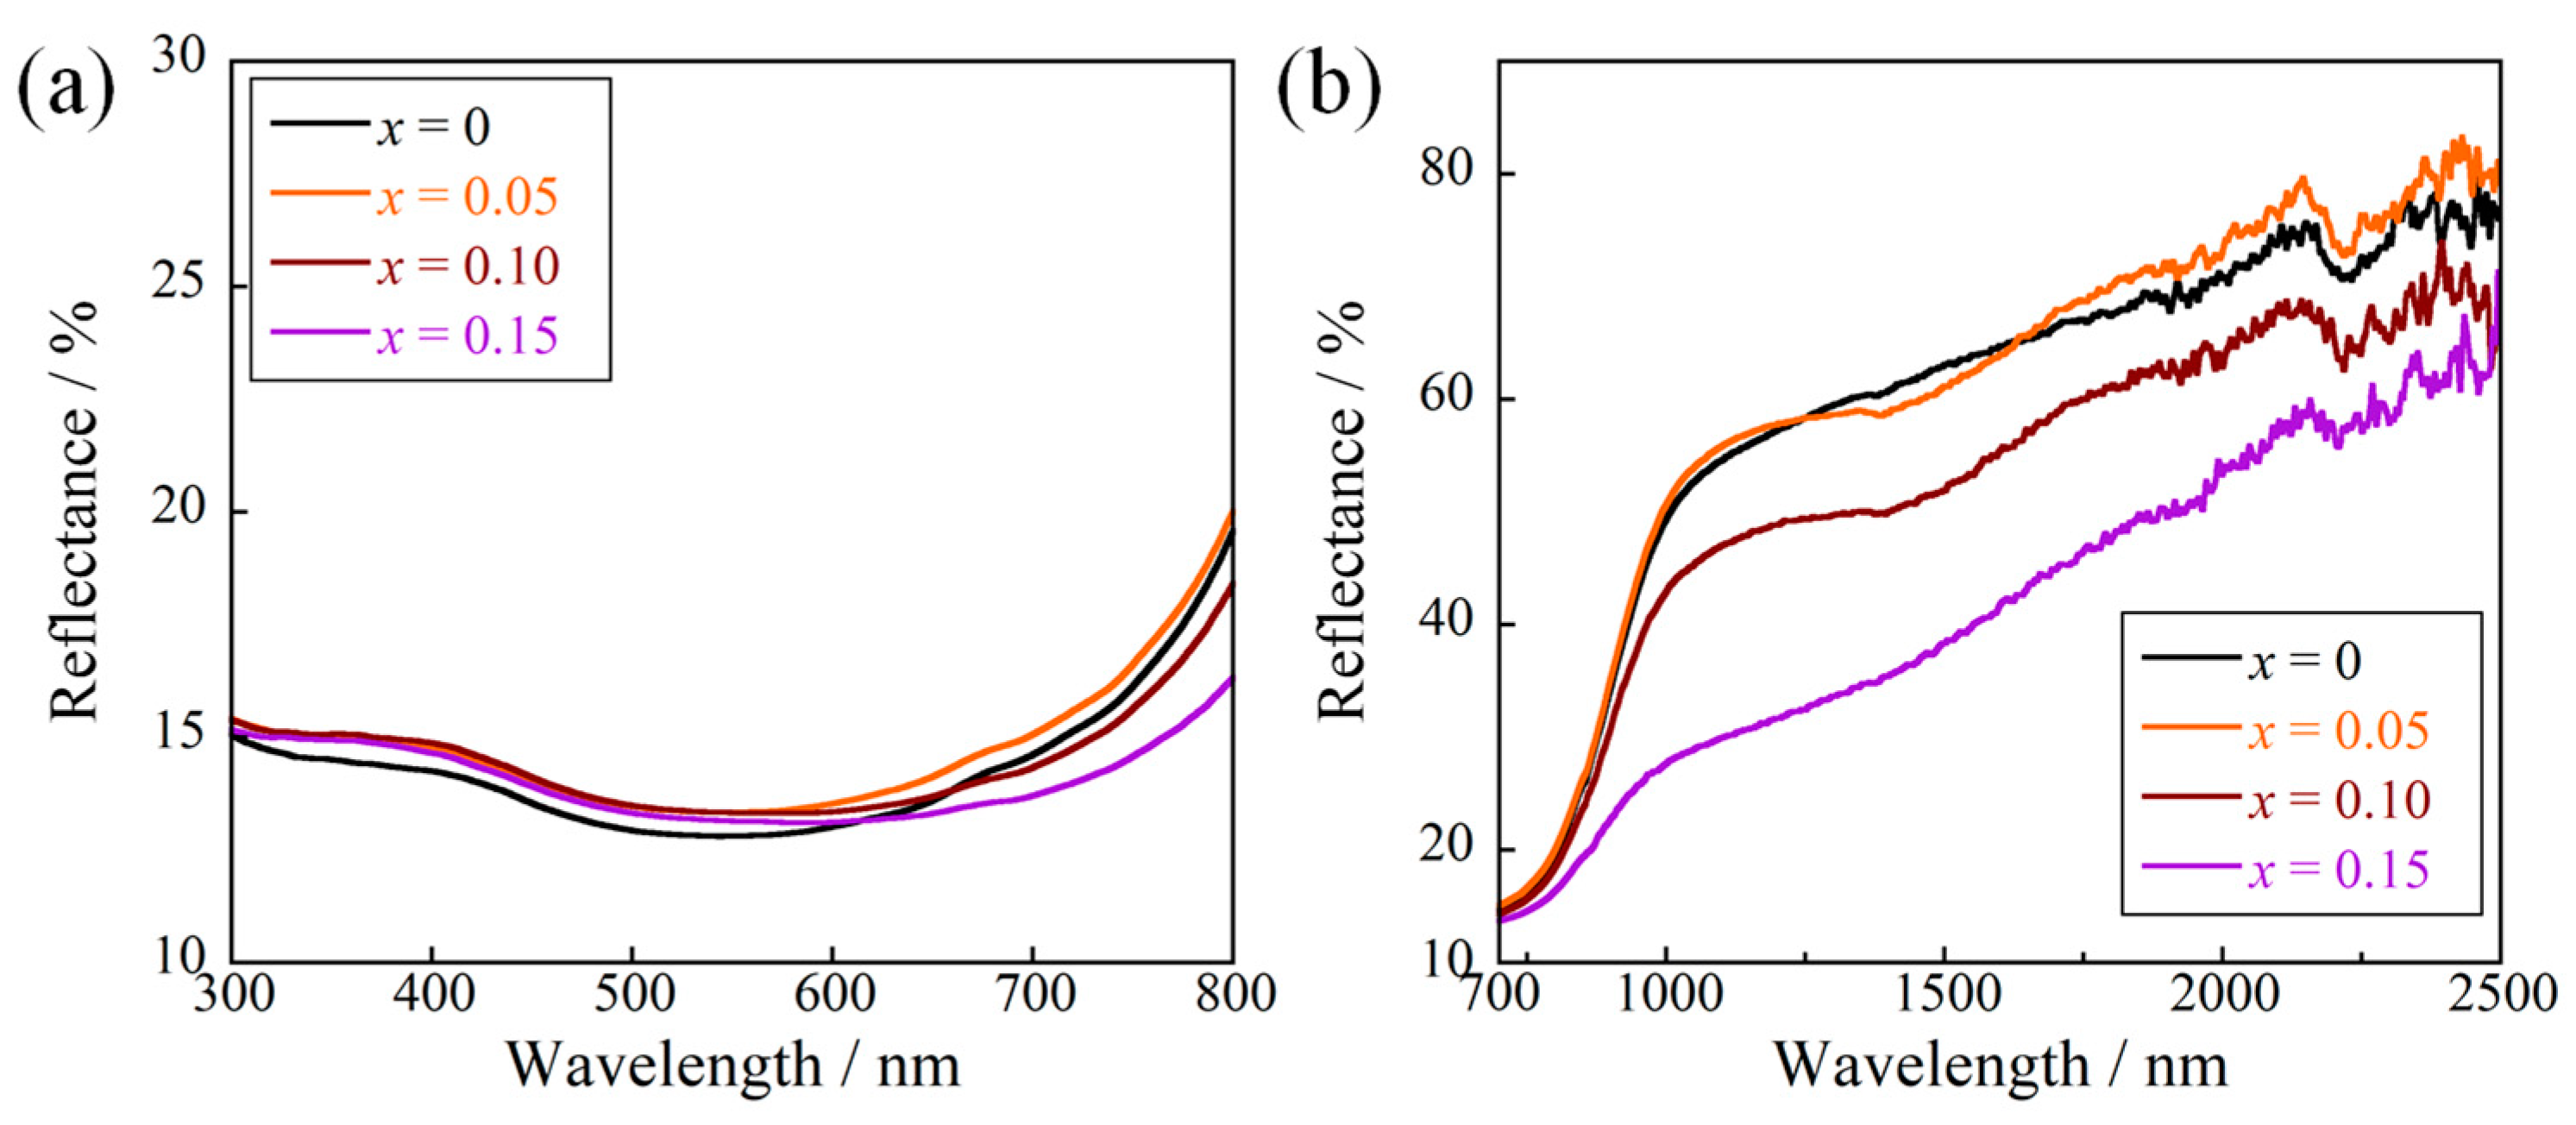
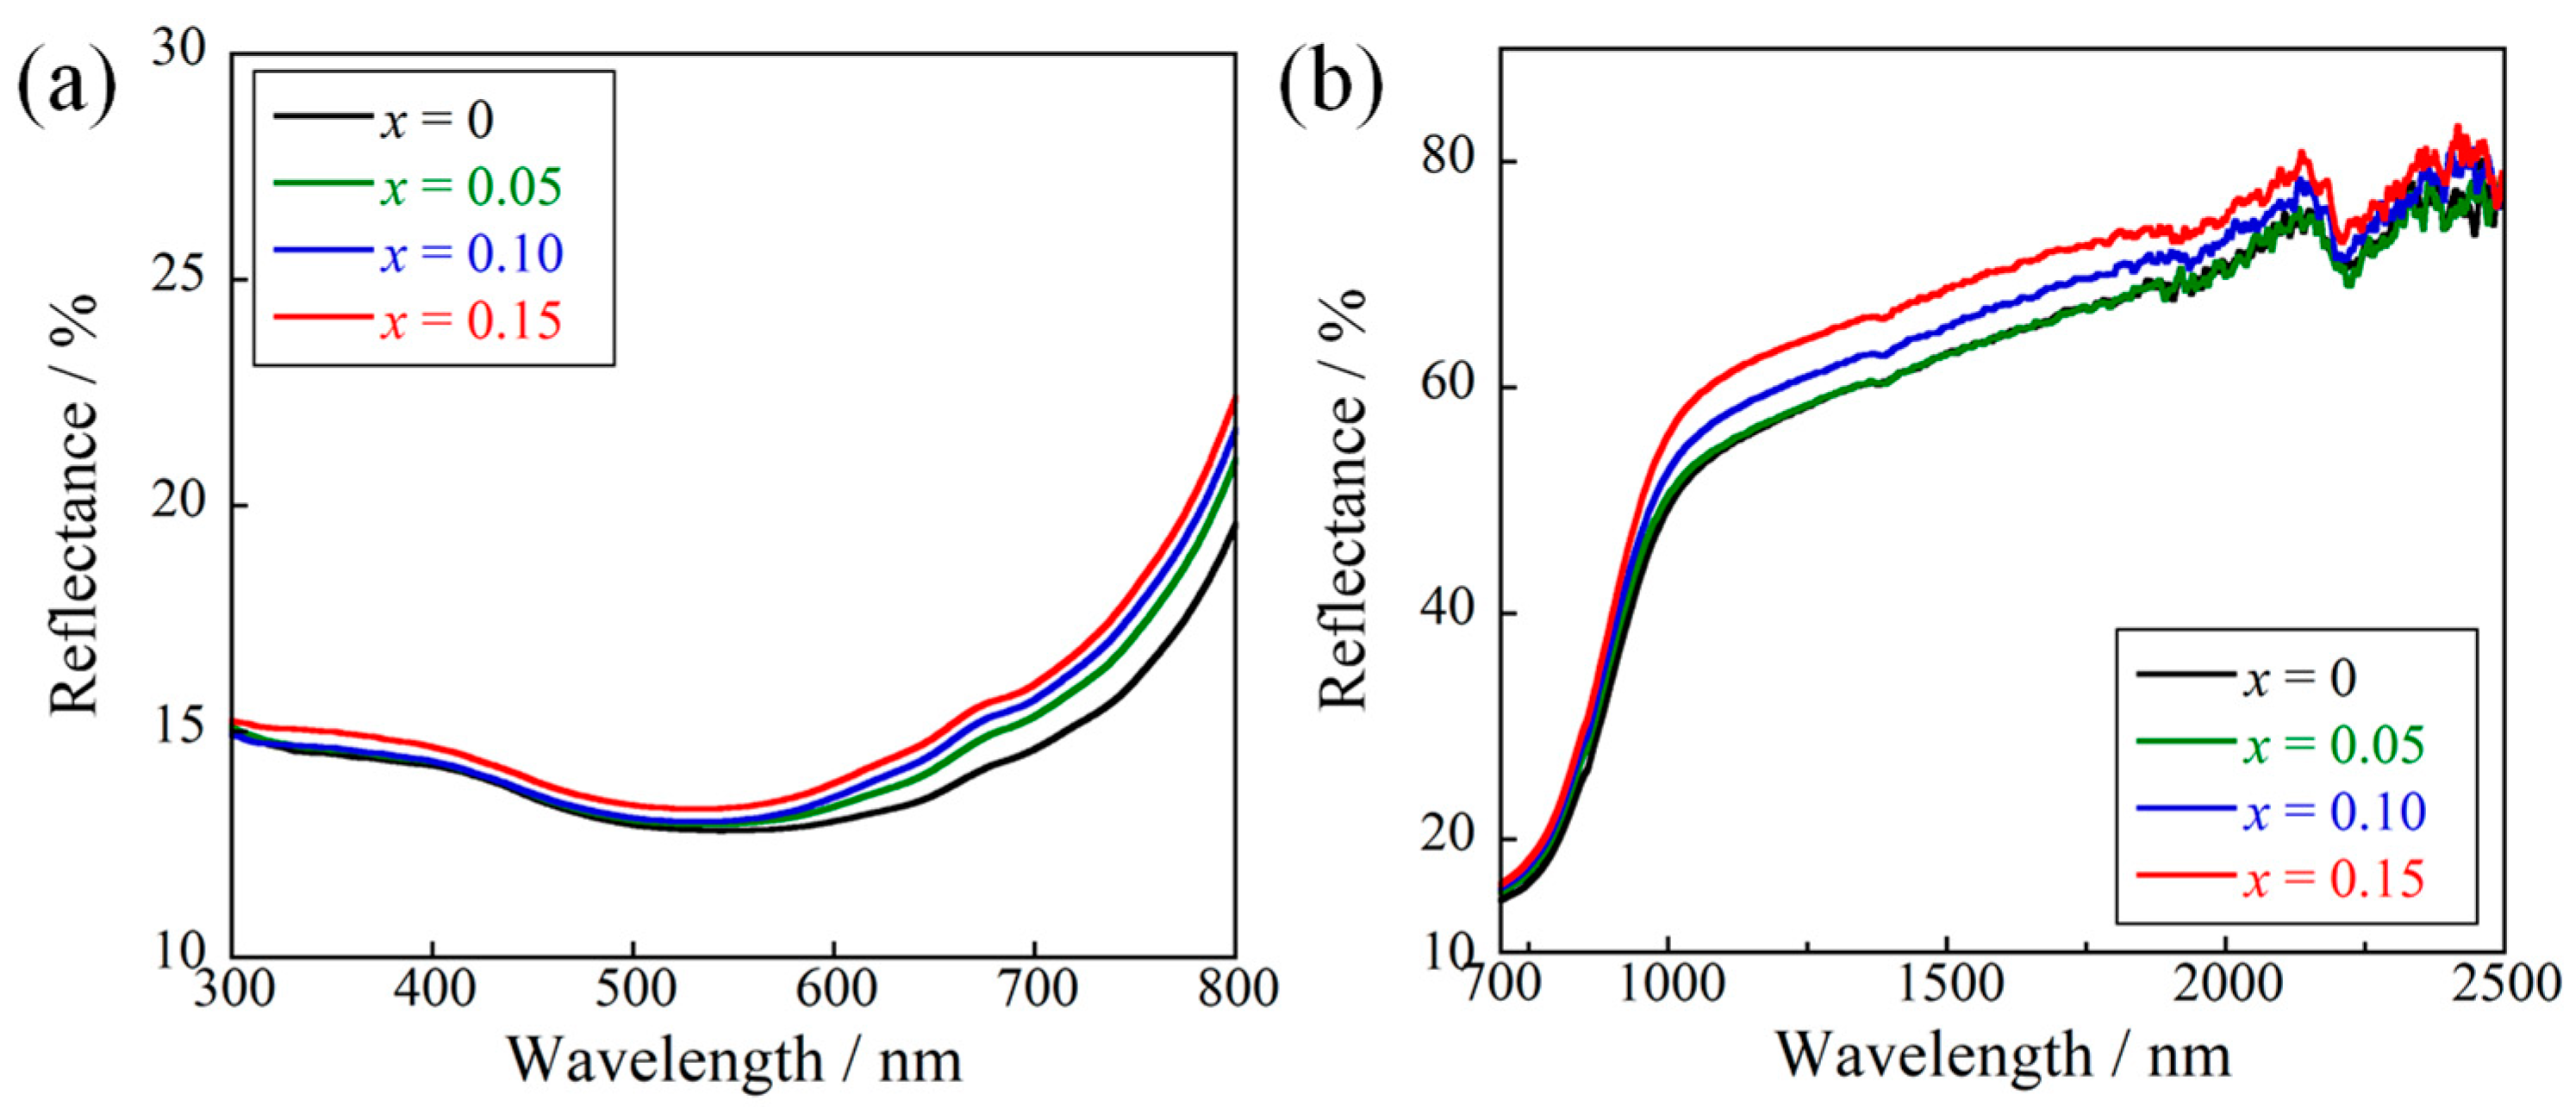
3.3.2. Ultraviolet–Visible–Near-Infrared (UV–Vis–NIR) Reflectance Spectra

UV–visible–NIR reflectance measurements were performed for the Y(Mn1−xGax)2O5 (0 ≤ x ≤ 0.15) samples obtained as a single phase. The reflectance spectra in the 300–800 nm wavelength region and 700–2500 nm wavelength region are shown Figure 8a,b. All samples were found to strongly absorb visible light at wavelengths shorter than 700 nm, and this optical absorption was attributed to the O2p–Mn3d charge transfer transition [14]. The optical absorption was slightly weakened by the decrease in Mn concentration with increasing Ga content. Since the optical reflection in the visible light was low, these samples were black.
It was found that the reflectance at wavelengths of 700 nm to 2500 nm improved when Ga3+ was dissolved in YMn2O5. This is thought to be due to the partial substitution of Mn3+ with Ga3+, which decreased the Mn3+ concentration and weakened the charge transfer transition between O2p and Mn3d orbitals. Furthermore, the reflectance in the near-infrared region was improved by introducing Ga3+. This is probably because the reduction in the Mn3+ concentration also weakened the charge transfer absorption of Mn3+–Mn4+ [16] in the near-infrared region. In the case of x = 0.15, the reflectance of wavelengths between 700 and 1300 nm, which is most involved in heat generation, was significantly improved.

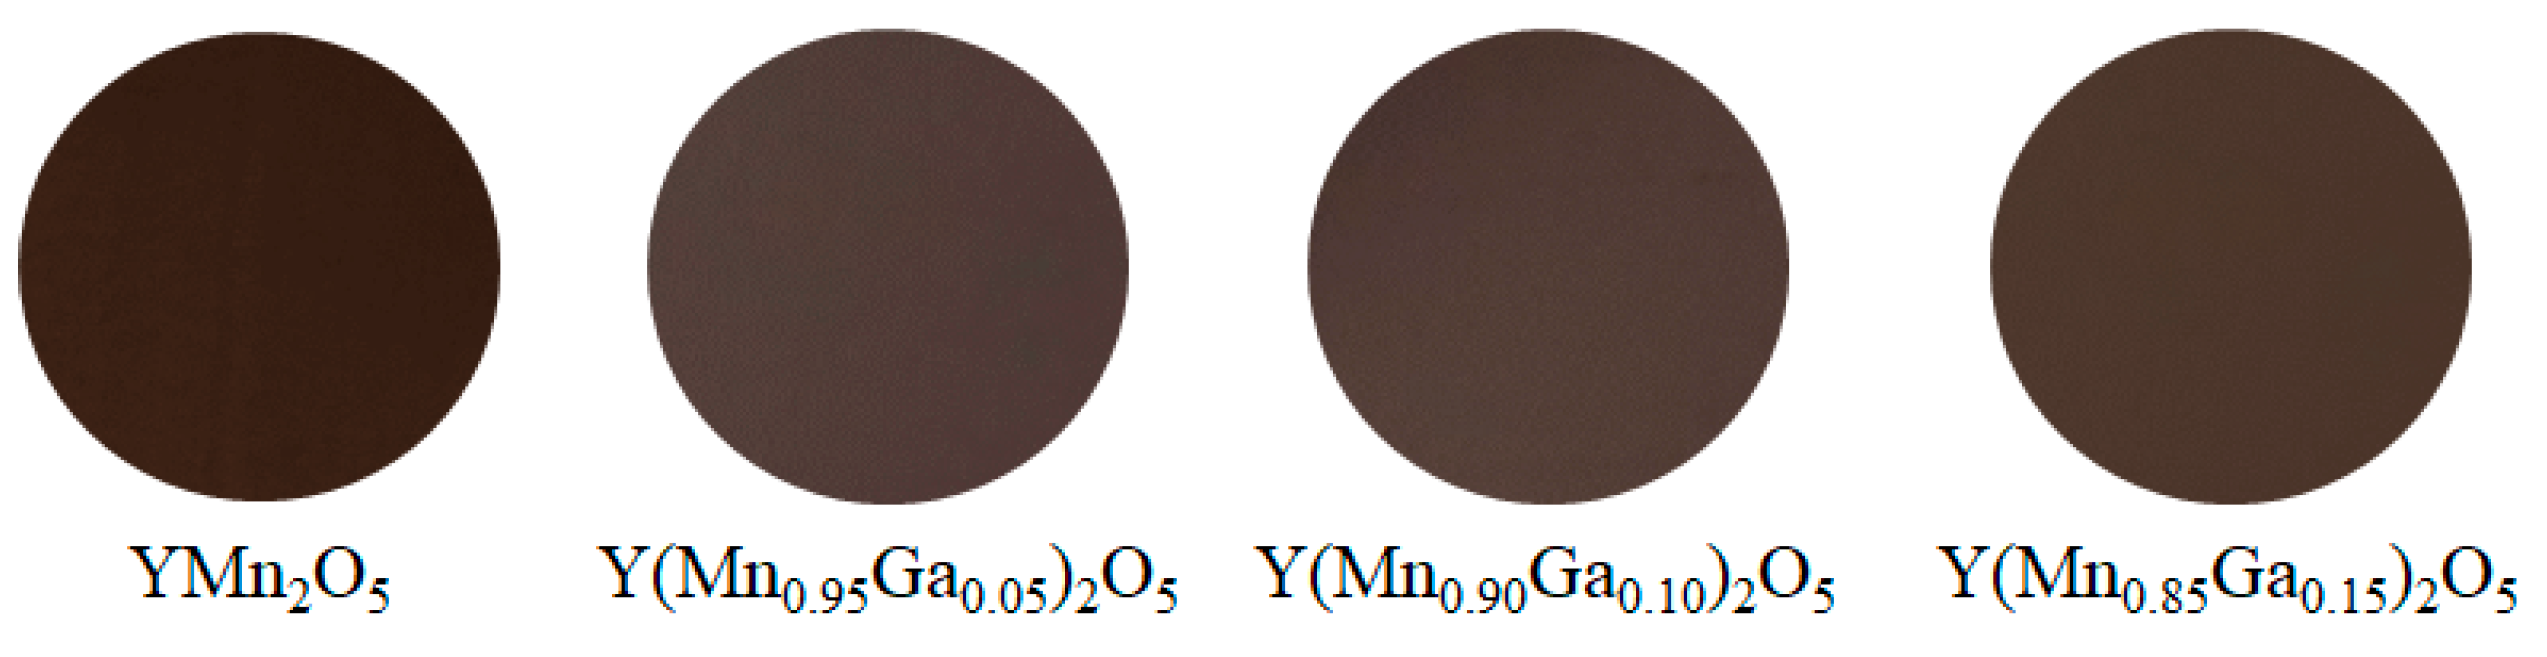
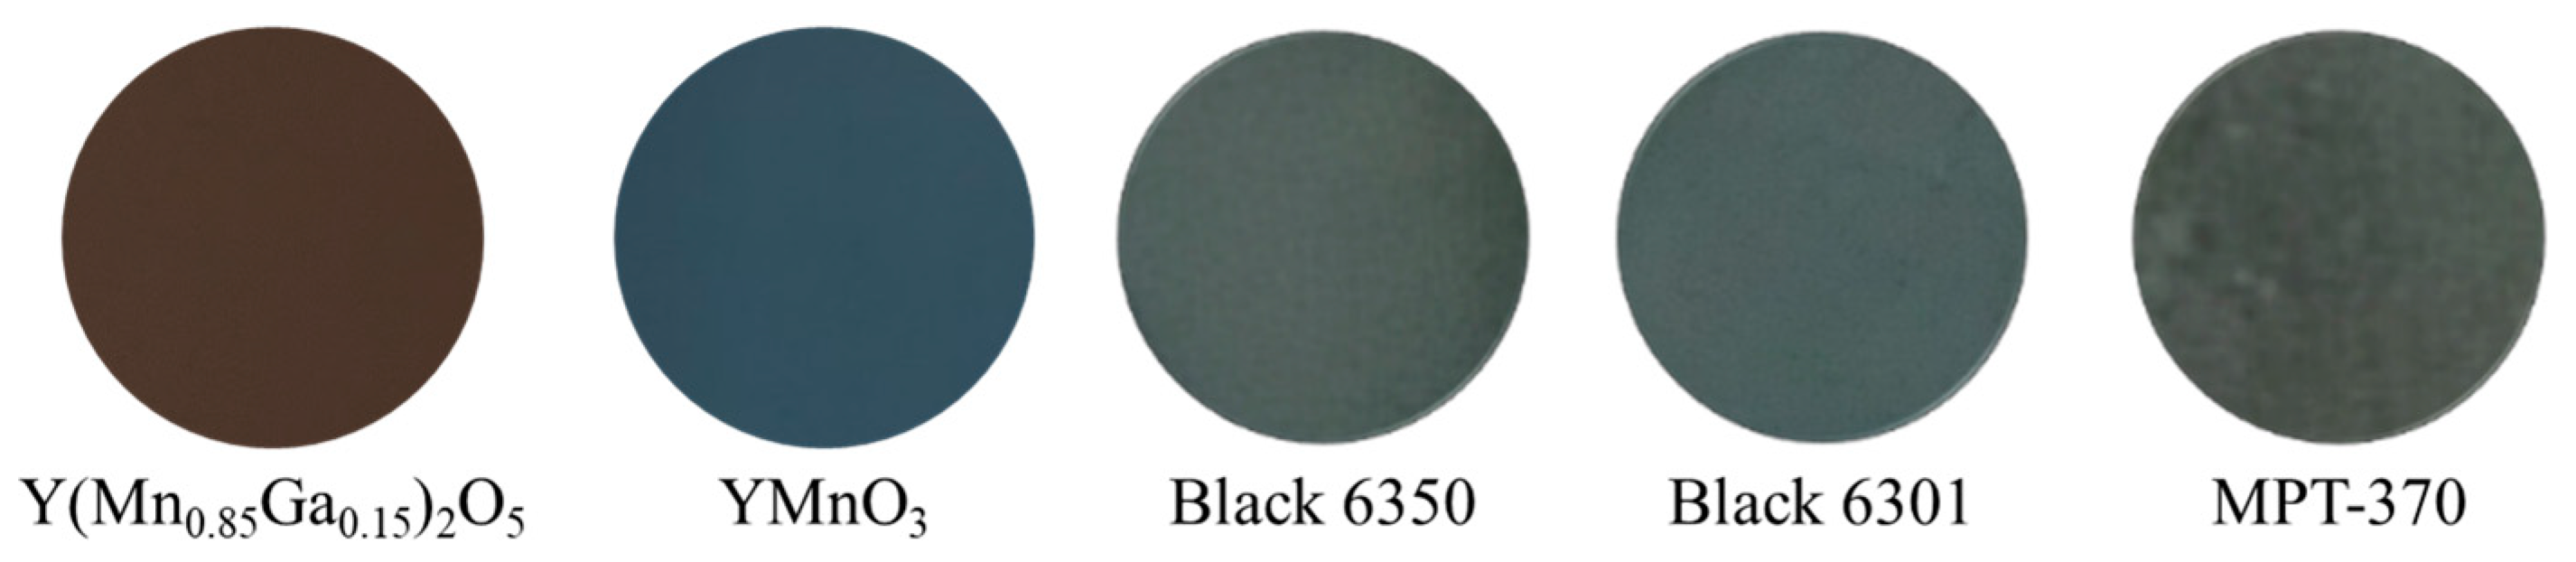
3.3.3. Color Properties

The L*a*b*C color coordinate data and NIR solar reflectance (R) of the Y(Mn1−xGax)2O5 (0 ≤ x ≤ 0.15) powder samples are listed in Table 6. Photographs of the samples are also shown in Figure 9. Although there was no regular change in brightness, the redness (a*), yellowness (b*), and chroma (C) values showed an increasing trend with the Ga3+ doping. As the Ga3+ content increased, the color of the samples gradually changed to reddish black; among the samples listed in Table 6, the darkest black color was obtained for Y(Mn0.85Ga0.15)2O5. As discussed in Figure 8, substituting some of the Mn3+ with Ga3+ increased the optical reflection in the near-infrared region (700–2500 nm), resulting in the increased R value. Among the samples in Table 6, Y(Mn0.85Ga0.15)2O5 showed the highest R value (47.6%). This sample is considered to be the best black pigment with good NIR reflectance properties.
The color coordinate data for the Y(Mn0.85Ga0.15)2O5 sample in this study were compared with those of YMnO3 and commercially available NIR-reflective black pigments such as Black 6350 (iron and chromium oxide; Asahi Kasei), Black 6301 (manganese and bismuth oxide, Asahi Kasei), and MPT-370 (calcium, manganese, and titanium oxide, Ishihara Sangyo), as shown in Table 7. Photographs of these pigments are also displayed in Figure 10.
The Y(Mn0.85Ga0.15)2O5 sample synthesized in this study exhibited a reddish black color with a redness (a*) value higher than those of YMnO3 and the commercial products, indicating that its black color was inferior. However, Y(Mn0.85Ga0.15)2O5 has high near-infrared reflectance, and its solar reflectance is higher than that of YMnO3 and the commercial products, indicating that it has sufficient performance as a thermal barrier pigment.

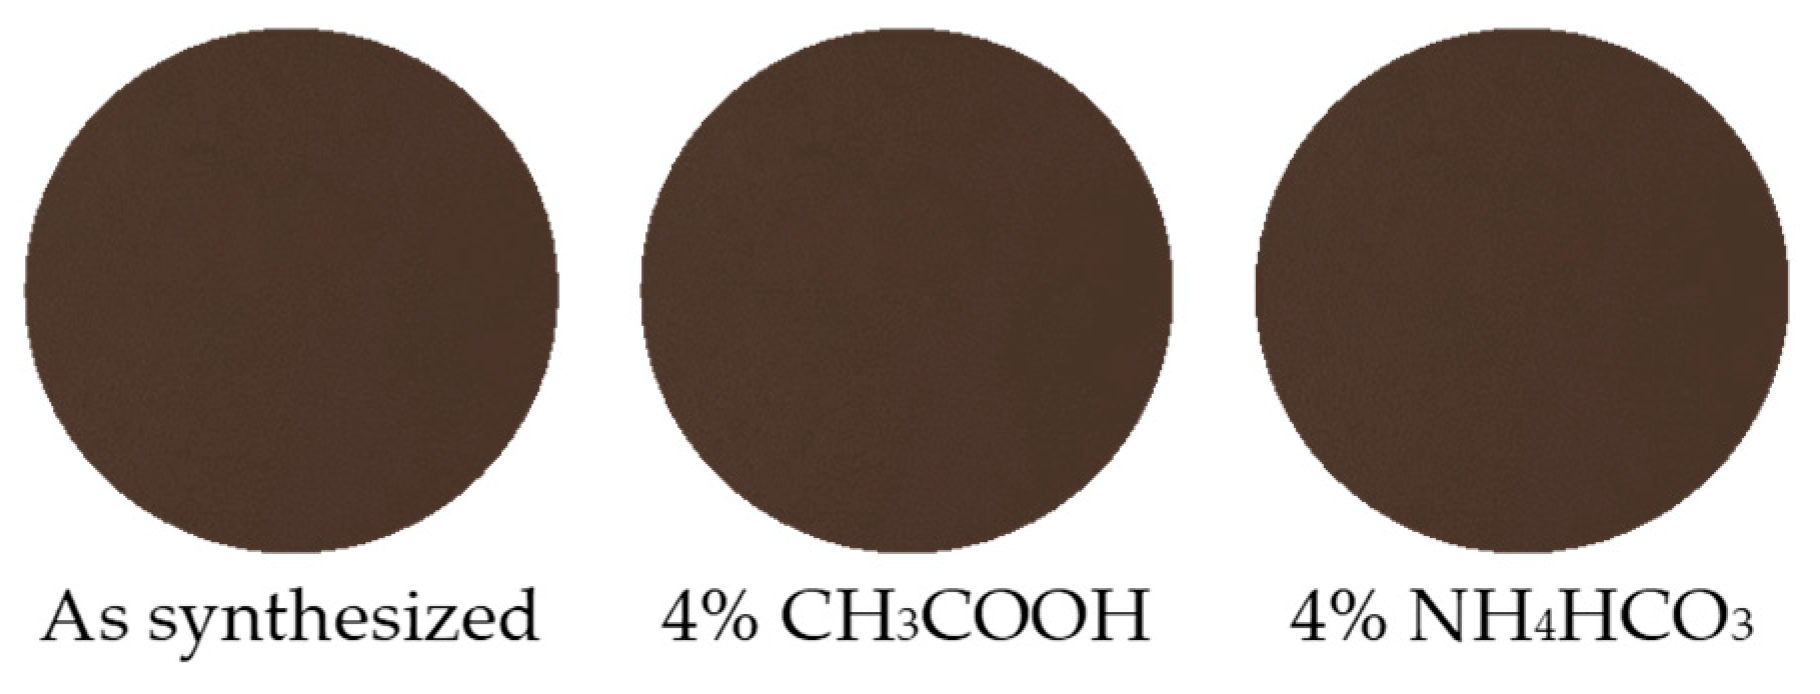
3.3.4. Chemical Stability Test

The chemical stability of Y(Mn0.85Ga0.15)2O5 was evaluated using powder samples. The powder samples were soaked in 4% CH3COOH and 4% NH4HCO3 aqueous solutions, assuming vinegar and baking soda. After 24 h at room temperature, they were washed with deionized water and ethanol. The samples were then dried at room temperature. The color coordinate data of the samples after the chemical stability tests are summarized in Table 8, and photographs of the samples are also shown in Figure 11. The color tone and NIR solar reflectance changed slightly after the leaching tests in acid and base solutions. Although the Y(Mn0.85Ga0.15)2O5 pigment was slightly less chemically stable, the R value of the sample still remained as high as those of commercial pigments.

4. Conclusions

Y(Mn1−xGax)2O5 (0 ≤ x ≤ 0.20) samples were synthesized as environmentally benign inorganic NIR-reflective black pigments. In the x range from 0 to 0.15, the samples were obtained in a single phase and the lattice volume decreased linearly. These results indicate that solid solutions were successfully obtained in this x region. The Y(Mn1−xGax)2O5 (0 ≤ x ≤ 0.15) samples exhibited optical absorption in the visible light region due to the charge transfer transition between O2− and Mn3+ and were reddish black in color. Among the synthesized samples, Y(Mn0.85Ga0.15)2O5 showed the highest NIR reflectance (47.6%), which was also higher than that of conventional black pigments. In particular, this pigment exhibited higher solar reflectance in the wavelength range of 700–1300 nm, which is most involved in heat generation. Therefore, the Y(Mn0.85Ga0.15)2O5 pigment will provide cooler roofs and exteriors for applications such as energy conservation buildings, as compared with the case of using conventional black pigments. The chemical stability of this sample is sufficient, and it has the potential to become a new NIR-reflective inorganic black pigment.

Author Contributions

The following are the author contributions to this study: Conceptualization, T.M. (Toshiyuki Masui); methodology, K.Y., T.M. (Takuro Morimoto), and T.M. (Toshiyuki Masui); validation, K.Y. and T.M. (Toshiyuki Masui); investigation, K.Y., S.M, and Y.N.; data curation, K.Y, S.M., Y.N., and T.M. (Takuro Morimoto); writing—original draft preparation, K.Y.; writing—review and editing, T.M. (Toshiyuki Masui); supervision, T.M. (Toshiyuki Masui); funding acquisition, T.M. (Toshiyuki Masui). All authors have read and agreed to the published version of the manuscript.

Funding

This research was funded by JSPS KAKENHI, grant numbers JP22K04698 and JP20H02439.

Institutional Review Board Statement

Not applicable.

Informed Consent Statement

Not applicable.

Data Availability Statement

Data are contained within the article.

Conflicts of Interest

The authors declare no conflict of interest.

References

  1. Faulkner, E.B.; Schwartz, R.J. High Performance Pigments, 2nd ed.; Wiley-VCH: Weinheim, Germany, 2009. [Google Scholar]
  2. Oka, R.; Masui, T. Synthesis and characterization of black pigments based on calcium manganese oxides for high near-infrared (NIR) reflectance. RSC Adv. 2016, 6, 90952–90957. [Google Scholar] [CrossRef]
  3. Oka, R.; Iwasaki, S.; Masui, T. Improvement of near-infrared (NIR) reflectivity and black color tone by doping Zn2+ into the Ca2Mn0.85Ti0.15O4 structure. RSC Adv. 2019, 9, 38822–38827. [Google Scholar] [CrossRef]
  4. Oka, R.; Hayakawa, T. Raman spectroscopic investigation and electronic state calculation for Ca2(Mn,Ti)O4 black pigments with high near-Infrared (NIR) reflectivity. Inorg. Chem. 2022, 61, 6500–6507. [Google Scholar] [CrossRef] [PubMed]
  5. Morimoto, T.; Oka, R.; Minagawa, K.; Masui, T. Novel near-infrared reflective black inorganic pigment based on cerium vanadate. RSC Adv. 2022, 12, 16570–16575. [Google Scholar] [CrossRef]
  6. Alonso, J.A.; Casais, M.T.; Martínez-Lope, M.J.; Martínez, J.L.; Ferandez-Díaz, M.T. A structural study from neutron diffraction data and magnetic properties of RMn2O5 (R = La, rare earth). J. Phys. Condens. Matter 1997, 9, 8515–8526. [Google Scholar] [CrossRef]
  7. Kagomiya, I.; Kakimoto, K.; Ohsato, H. Precursor phenomenon on ferroelectric transition in multiferroic YMn2O5. J. Eur. Ceram. Soc. 2010, 30, 255–258. [Google Scholar] [CrossRef]
  8. Yin, C.; Xia, Q.; Zhou, J.; Li, B.; Guo, Y.; Khan, A.; Li, X.; Xu, A. Direct electron transfer process-based peroxymonosulfate activation via surface labile oxygen over mullite oxide YMn2O5 for effective removal of bisphenol A. Sep. Purif. Technol. 2022, 280, 119924. [Google Scholar] [CrossRef]
  9. Zhang, T.; Li, H.; Ynag, Z.; Cao, F.; Chen, H.; Liu, H.; Xiong, K.; Wu, J.; Hong, Z.; Wnag, W. Electrospun YMn2O5 nanofibers: A highly catalytic activity for NO oxidation. Appl. Catal. B Environ. 2019, 247, 133–141. [Google Scholar] [CrossRef]
  10. Han, T.-C.; Lin, J.G. Enhancement of magnetic moment in Ca-doped helimagnetic YMn2O5. J. Magn. Magn. Mater. 2006, 304, e424–e426. [Google Scholar] [CrossRef]
  11. Kim, J.-H.; Lee, S.-H.; Park, S.I.; Kenzelmann, M.; Harris, A.B.; Schefer, J.; Chung, J.-H.; Majkrzak, C.F.; Takeda, M.; Wakimoto, S.; et al. Spiral spin structures and origin of the magnetoelectric coupling in YMn2O5. Phys. Rev. B 2008, 78, 245115. [Google Scholar] [CrossRef]
  12. Han, A.; Zhao, M.; Ye, M.; Liao, J.; Zhang, Z.; Li, N. Crystal structure and optical properties of YMnO3 compound with high near-infrared reflectance. Sol. Energy 2013, 91, 32–36. [Google Scholar] [CrossRef]
  13. Chen, Y.; Ma, Y.; Wang, Z.; Wang, X.; Liu, H.; Cheng, G.J. Molten salt synthesis of YMnO3 powder with high near-infrared reflectivity. Mater. Lett. 2018, 229, 171–173. [Google Scholar] [CrossRef]
  14. Chen, Z.; Xiao, R.-J.; Ma, C.; Qin, Y.-B.; Shi, H.-L.; Wang, Z.-W.; Song, Y.-J.; Wang, Z.; Tian, H.-F.; Yang, H.-X.; et al. Electronic structure of YMn2O5 studied by EELS and first-principles calculations. Front. Phys. 2012, 7, 429–434. [Google Scholar] [CrossRef]
  15. Raj, A.K.V.; Rao, P.P.; Sameera, S.; Divya, S. Pigments based on terbium-doped yttrium cerate with high NIR reflectance for cool roof and surface coating applications. Dyes Pigm. 2015, 122, 116–125. [Google Scholar] [CrossRef]
  16. Shannon, R.D. Revised effective ionic radii and systematic studies of interatomic distances in halides and chalcogenides. Acta Cryst. A 1976, 32, 751–767. [Google Scholar] [CrossRef]
  17. Tamilarasan, S.; Laha, S.; Natarajan, S.; Gopalakrishnan, J. Li2MnO3: A Rare Red-Coloured Manganese (IV) Oxide Exhibiting Tunable Red−Yellow−Green Emission. J. Mater. Chem. C 2015, 3, 4794–4800. [Google Scholar] [CrossRef]
  18. Kovaleva, N.N.; Gavartin, J.L.; Shluger, A.L.; Boris, A.V.; Stoneham, A.M. Lattice relaxation and charge-transfer optical transitions due to self-trapped holes in nonstoichiometric LaMnO3 crystal. J. Exp. Theor. Phys. 2002, 94, 178–190. [Google Scholar] [CrossRef]
  19. Kim, T.G.; Kim, S.J.; Lin, C.C.; Liu, R.S.; Chan, T.S.; Im, S.J. Melilite-type blue chromophores based on Mn3+ in a trigonal-bipyramidal coordination induced by interstitial oxygen. J. Mater. Chem. C 2013, 1, 5843–5848. [Google Scholar] [CrossRef]
  20. Wang, D.; Su, D.; Zhong, M. Chromatic and near-infrared reflective properties of Fe3+ doped KZnPO4. Sol Energy 2014, 110, 1–6. [Google Scholar] [CrossRef]
Figure 1. XRD patterns of the Y(Mn0.95M0.05)2O5 (M = Al, Fe, Ga, Ti, and Zr) samples.
Colorants 02 00036 g001
Figure 2. (a) UV–Vis and (b) NIR reflectance spectra for YMn2O5 and Y(Mn0.95M0.05)2O5 (M = Al, Fe, Ga, and Ti).
Colorants 02 00036 g002
Figure 3. XRD patterns of the Y(Mn1−xFex)2O5 (0 ≤ x ≤ 0.15) samples.
Colorants 02 00036 g003
Figure 4. (a) UV–Vis and (b) NIR reflectance spectra for the Y(Mn1−xFex)2O5 samples, where x is from 0 to 0.15.
Colorants 02 00036 g004
Figure 5. XRD patterns of the Y(Mn1−xGax)2O5 (0 ≤ x ≤ 0.20) samples.
Colorants 02 00036 g005
Figure 6. Compositional dependence of the lattice volume for the Y(Mn1−xGax)2O5 (0 ≤ x ≤ 0.20) samples.
Colorants 02 00036 g006
Figure 7. TEM images of the YMn2O5 (left) and Y(Mn0.85Ga0.15)2O5 (right) samples.
Colorants 02 00036 g007
Figure 8. (a) UV–Vis and (b) NIR reflectance spectra for the Y(Mn1−xGax)2O5 (0 ≤ x ≤ 0.15) samples.
Colorants 02 00036 g008
Figure 9. Photographs of the Y(Mn1−xGax)2O5 (0 ≤ x ≤ 0.15) samples.
Colorants 02 00036 g009
Figure 10. Photographs of Y(Mn0.85Ga0.15)2O5, YMnO3, Black 6350, Black 6301, and MPT-370 pellets made from powder samples.
Colorants 02 00036 g010
Figure 11. Photographs of Y(Mn0.85Ga0.15)2O5 samples before and after the chemical stability test.
Colorants 02 00036 g011
Table 1. Amounts of reagents used to synthesize Y(Mn0.95M0.05)2O5 (M = Al, Fe, Ga, Ti, and Zr).
SampleY(NO3)3·6H2O(CH3COO)2Mn·4H2OReagent of DopantCA
YMn2O51.3739 g1.7582 g4.1350 g
Y(Mn0.95Al0.05)2O51.3879 g1.6872 gAl(NO3)3·9H2O
0.1360 g
4.1766 g
Y(Mn0.95Fe0.05)2O51.3735 g1.6699 gFe(NO3)3·9H2O
0.1448 g
4.1335 g
Y(Mn0.95Ga0.05)2O51.3666 g1.6617 gGa(NO3)·8H2O
0.1426 g
4.1129 g
Y(Mn0.95Ti0.05)2O51.3775 g1.6746 g[(CH3)2CHO]4Ti
0.1022 g
4.1455 g
Y(Mn0.95Zr0.05)2O51.3564 g1.6489 gZrO(NO3)2·2H2O
0.0946 g
4.0819 g
Table 2. Amounts of reagents used to synthesize Y(Mn1−xFex)2O5 (0 ≤ x ≤ 0.15).
SampleY(NO3)3·6H2O(CH3COO)2Mn·4H2OFe(NO3)3·9H2OCA
Y(Mn0.95Fe0.05)2O51.3735 g1.6699 g0.1448 g4.0973 g
Y(Mn0.90Fe0.10)2O51.3729 g1.5813 g0.2895 g4.1322 g
Y(Mn0.85Fe0.15)2O51.3725 g1.4930 g0.4343 g4.1308 g
Table 3. Amounts of reagents used to synthesize Y(Mn1−xGax)2O5 (0 ≤ x ≤ 0.20).
SampleY(NO3)3·6H2O(CH3COO)2Mn·4H2OGa(NO3)·8H2OCA
Y(Mn0.95Ga0.05)2O51.3666 g1.6617 g0.1426 g4.1129 g
Y(Mn0.90Ga0.10)2O51.3595 g1.5658 g0.2839 g4.0914 g
Y(Mn0.85Ga0.15)2O51.3523 g1.4710 g0.4236 g4.0702 g
Y(Mn0.83Ga0.17)2O51.3494 g1.4335 g0.4790 g4.0616 g
Y(Mn0.80Ga0.20)2O51.3452 g1.3773 g0.5617 g4.0489 g
Table 4. Color coordinates and NIR solar reflectance (R) of the YMn2O5 and Y(Mn0.95M0.05)2O5 (M = Al, Fe, Ga, and Ti) powder samples.
SampleL*a*b*CR
YMn2O528.2+2.83−0.442.8642.9
Y(Mn0.95Al0.05)2O527.5+4.95+1.735.2439.5
Y(Mn0.95Fe0.05)2O525.5+3.24+0.103.2443.5
Y(Mn0.95Ga0.05)2O525.8+3.93+0.533.9743.7
Y(Mn0.95Ti0.05)2O525.2+2.58+0.202.5931.2
Table 5. Color coordinates and NIR solar reflectance (R) of the Y(Mn1−xFex)2O5 powder samples, where x is from 0 to 0.15.
SampleL*a*b*CR
YMn2O528.2+2.83−0.442.8642.9
Y(Mn0.95Fe0.05)2O525.3+3.24+0.103.2443.5
Y(Mn0.90Fe0.10)2O526.2+2.07−0.982.5037.7
Y(Mn0.85Fe0.15)2O524.7+1.58+1.021.8828.1
Table 6. Color coordinates and NIR solar reflectance (R) of the Y(Mn1−xGax)2O5 (0 ≤ x ≤ 0.15) powder samples.
SampleL*a*b*CR
YMn2O528.2+2.83−0.442.8642.9
Y(Mn0.95Ga0.05)2O525.8+3.93+0.533.9743.7
Y(Mn0.90Ga0.10)2O527.0+4.30+0.744.3645.4
Y(Mn0.85Ga0.15)2O525.8+4.82+1.254.9847.6
Table 7. Color coordinates and NIR solar reflectance (R) of various black pigments.
SampleL*a*b*CR
Y(Mn0.85Ga0.15)2O525.8+4.82+1.254.9847.6
YMnO322.6−2.17−9.049.3043.9
Black 635025.3+1.20+4.064.2341.3
Black 630123.7+0.43+1.051.1338.7
MPT-37023.0+0.67−0.270.7244.0
Table 8. Color coordinate data of Y(Mn0.85Ga0.15)2O5 samples before and after the chemical stability test.
TreatmentL*a*b*CR
As synthesized25.8+4.82+1.254.9847.6
4% CH3COOH25.2+4.39+1.074.5242.8
4% NH4HCO324.3+4.49−1.204.6542.2
Disclaimer/Publisher’s Note: The statements, opinions and data contained in all publications are solely those of the individual author(s) and contributor(s) and not of MDPI and/or the editor(s). MDPI and/or the editor(s) disclaim responsibility for any injury to people or property resulting from any ideas, methods, instructions or products referred to in the content.

