Abstract
Fiber-reinforced polymers (FRP) are rapidly gaining acceptance from the construction sector due to their large effectiveness. They are mainly used as confining reinforcement for concrete columns and as tensile reinforcement for concrete beams, columns and slabs. FRPs are already used to a large extent for applications such as bridges and parking lots, where elevated temperatures are not the main risk. Their increasing use as structural reinforcement is hampered by the concern related to their behavior at elevated temperatures as the relevant research is deficient. Thanks to the significant advantage of FRPs’ mechanical properties, further investigation into the influence of heating on their mechanical behavior may solve many doubts. The present study examines the influence of temperatures, ranging among 50, 100 and 250 °C, on the tensile strength of FRP laminates with carbon fibers (CFRP). In addition, the resistance of CFRP specimens to low-cycle thermal loading at the temperatures of 50, 100 and 250 °C under constant tensile load was investigated. The experiments were carried out in the laboratory of Experimental Strength of Materials and Structures of Aristotle University of Thessaloniki.
1. Introduction
The FRPs are composite materials consisting of continuous high-strength fibers, which are embedded into a polymer matrix (usually organic) [1,2,3,4,5]. The fibers are the reinforcing elements, whereas the polymer matrix is the connecting material, which protects them and transfers the loads to and between the fibers [1,2,3]. In the construction sector, the main types of fibers used are glass, carbon (inorganic) and aramid fibers (organic polymers) [2,3,4,5,6]. The use of these materials in civil engineering applications is constantly expanding due to their important advantages [6,7,8,9]. High resistance to corrosion, high strength-to-weight ratio, high stiffness, appropriate fatigue performance, electric insulation and easy installation are some of them [4,6,7,8,9,10]. Composite reinforcement can be in the form of bars, sheets, strips, tapes, laminates and prestressing tendons [1,7,11]. In addition, their cost is decreasing, especially in recent years [1]. However, FRPs, according to the literature, show sensitivity to high temperatures [7,12,13,14,15,16]. Elevated temperatures cause a reduction in elastic modulus and strength [7,12,13,14,15,16,17,18]. These possibly result in large deflections, loss of reinforcement and eventually collapse [7,19]. The modes of failure at elevated temperatures are different for the FRP material [17]. It fails in brittle rupture at 100–150 °C [17]. At higher temperatures, where the epoxy adhesive softens, the adhesive is burned at 300 °C and the specimen fails [14,15,16,17].
Specifically, the glass transition temperature Tg is an important parameter to be considered, as above this, the mechanical characteristics of the FRPs are reduced dramatically [15,16,20,21]. Indicatively, the temperature Tg ranges between 65 and 120 °C [22]. The polymer is converted from a hard, glassy material to a soft and rubbery one [7]. This leads to loss of adhesion and fibers’ removal from the matrix [16,19,20]. The resin is no longer able to transfer the loads evenly to the fibers [16,20]. As a result, some of the fibers are being further loaded and probably exceed their strength and fail [20]. Being exposed to higher temperatures in the range of 300–500 °C causes the chemical bonds of the resin and the fibers to break [22,23,24,25,26]. In addition, at these temperatures, where the resin decomposition temperature Td is, heat, smoke, ash and volatile substances are released [22,27]. It is also marked that a significant increase in temperature, except in the case of fire, can be caused by direct exposure to sunlight [20]. Especially, dark surfaces are able to reach temperatures of 70 °C [20].
In recent decades, some research has been undertaken on the effect of high temperatures on the mechanical properties of FRPs [7,14,28,29]. It is known that an increase in temperature causes a decrease in the strength of materials [7,13,14,15,16,27,28]. Specifically for concrete structures, the deterioration of the mechanical properties of FRP reinforcement due to fire is considered dangerous [7]. High temperatures result in a reduction in the modulus of elasticity and tensile strength that can cause large deformations, loss of reinforcement and eventual collapse of the structure [7,18,19,27,29].
Saafi (2002) presented the effect of elevated temperatures on the mechanical properties of FRPs and structural steel [1,30]. The tensile strength of aramid fiber-reinforced polymer (AFRP) rebars and CFRP rebars was the same up to 100 °C, and then it decreased dramatically at higher temperatures [30]. The tensile strength of GFRP rebars reduced consistently with the increase in the temperature, whereas the tensile strength of steel rebars was not affected up to 350 °C [30]. Then it decreased linearly with an increase in the temperature, and it reduced by 90% at 700 °C [30]. The modulus of elasticity of all the FRP rebars and the steel rebars was not affected by heat up to 100 °C [30]. However, the modulus of elasticity of all the FRP rebars reduced linearly with an increase in temperature [30]. The modulus of elasticity of the steel rebars reduced by 40% at 500 °C and 90% at 700 °C [30].
Tensile strength
The tensile strength of FRPs is important, as it is required to calculate the load-bearing capacity of reinforced elements [7]. The research of Sen et al. (1993) on the tensile strength of various types of glass fiber-reinforced polymers (GFRP) at different temperatures concluded that glass fibers lose about 50% of their initial tensile strength above 550 °C [7,31]. Carbon fibers, on the other hand, have higher resistance to high temperatures [7,31]. At the same time, they do not show any change in their tensile strength at temperatures higher than 1000 °C [7,31].
Gates (1991) investigated the variation of the modulus of elasticity in the longitudinal, transverse and shear direction of a carbon/thermoplastic FRP and a carbon/bismaleimide thermoset FRP at the temperatures of 23–200 °C [27,32]. He observed that changes in the transverse and shear direction of CFRPs were more visible at elevated temperatures than those in the longitudinal direction [27,33]. In the longitudinal direction, there were no significant changes up to 200 °C for any of the FRPs [27,33]. It would be a significant omission not to mention that the glass transition temperature of the matrix in this study was 220 °C, which is unusually high for FRP composites [27,33]. Gates (1991) also studied the stress–strain response of CFRPs at elevated temperatures [27,32]. He found that the tensile strength decreased by about 40–50% at 125 °C and by 80–90% at 200 °C, which shows a significant degradation of the tensile strength at temperatures lower than the Tg of the matrix [27,32]. According to Bank (1993) FRPs are anisotropic, as their properties in the transverse direction, where the matrix dominates, are more strongly influenced by the elevated temperatures than the properties in the longitudinal direction, where the fibers dominate [27,33]. Therefore, in a unidirectional FRP, the transverse strength and stiffness decrease at a faster rate as the temperature approaches the Tg [27,33].
Kumahara et al. (1993) studied the tensile strength and the modulus of elasticity in the longitudinal direction of various FRP bars, made of carbon, glass and aramid at high temperatures [34]. Aramid FRPs showed the highest rate of reduction in tensile strength and Young’s modulus. The tensile strength decreased by 20% at 100 °C and 80% at 400 °C, while the reduction in the modulus of elasticity was 15% at 100 °C and 30% at 250 °C. Glass FRPs behaved differently depending on the material of their matrix. The matrix used in the FRP Glass/vinyl ester material was less resistant to high temperatures compared to that of the Glass/polyphenylene sulfide (PPS) material, which showed little reduction in the tensile strength at temperatures up to 250 °C. The tensile strength of CFRP bars decreased by 0–25% at 100 °C, 0–50% at 250 °C and more than 40% at 400 °C. Both GFRP and CFRP materials did not show any significant reduction in the elastic modulus at temperatures up to 250 °C. It is also noted that the anchorage zones of the FRP were insulated against high temperatures. According to the researchers, high temperatures have a significant effect on tensile strength and the modulus of elasticity of FRPs [34]. It depends to a large extent on the type of fibers and the material of the resin, while the use of a matrix with high glass transition temperature is recommended [34]. It should also be noted, according to Fujisaki et al. (1993), that the insulation of anchorage zones against heat results in greater residual strength after exposure to high temperature [35].
Kodur and Baingo (1998) conducted a detailed literature review of the properties of FRPs at elevated temperatures and suggested a strength versus temperature curve for glass FRP reinforcements exposed to high temperatures [36]. The variation of tensile strength with temperature for GFRP was compered to concrete, steel and wood. The tensile strength of the GFRPs reduced by about 15% of the strength at room temperature at 100 °C and 75% at 250 °C. This variation is similar to the wood. However, the concrete and the steel show a significant reduction in their tensile strength at 400 °C. The tensile strength of steel reduces by about 20% at 600 °C, and the strength of concrete reduces by about 40% at 800 °C [36].
Creep
Creep is defined as the increase in strain with time under constant load and is caused by a combination of elastic deformation and plastic flow [27]. This phenomenon occurs after long-term loading, which is at a high level but does not exceed the strength of the material [27]. Creep can be a critical factor in the design of FRP-reinforced concrete structures, as excessive long-term deformations can lead to irreparable damage or loss of FRP reinforcement [27]. It is emphasized that in the case of exposure of FRPs to high temperatures, a thermally accelerated creep is observed, which is dangerous for causing large deformations and failure [27].
In general, Mallick (1988) found that creep deformations in FRPs increase with increasing temperature and depend on the matrix material and the orientation of the fibers [37]. Regarding the material of the matrix, highly cross-linked thermoset matrices with high Tg show less creep than thermoplastics [37]. In addition, according to Mallick, if the fibers are in the direction of charge, then their creep determines the creep of the composite material [37]. Most available fibers do not have significant creep apart from some aramid fibers [37].
The effects of elevated temperatures on the mechanical properties of FRPs are of concern, and research into this is limited. However, thanks to the significant advantages of FRPs, it is worth further investigation. The present experimental work focuses on the thermo-mechanical behavior of the CFRPs laminates under monotonic mechanical loading, low-cycle fatigue and thermal loading. The experiments were carried out in the laboratory of Experimental Strength of Materials and Structures of Aristotle University of Thessaloniki, and the investigation parameters were the tensile stress and the temperature.
2. Relevant Experiments from the Literature
Before the presentation of the experimental part of the present study, it is useful to focus on some relevant experimental studies from the international literature. By discussing the results of the literature, a better interpretation of the FRPs’ behavior under elevated temperatures can be made.
Hamad, Johari and Haddad (2017) studied the effect of elevated temperatures on the mechanical properties of four different types of FRP bars (basalt fiber-reinforced polymer (BFRP), carbon fiber-reinforced polymer (CFRP), glass fiber-reinforced polymer (GFRP), and steel bars of 600 mm length and 10 mm diameter) [23]. Eighteen samples of each bar type were used [23]. Three of them were tested at ambient temperature while the others were exposed in triplicates to temperatures of 125, 250, 325, 375 and 450 °C for 30 min [23]. After the specimens were left to cool down, they were tested under monotonic, uniaxial tension up to failure [23]. The stress–strain relationship of the FRP bars was almost linear up to failure for temperatures of 23–325 °C [23]. Then it became non-linear at higher temperatures because of the damage of the epoxy resin, which leads to loss of bonds between the fibers [23]. The tensile stiffness and elastic modulus decreased significantly, especially prior to failure because the stress was not evenly distributed among the fibers [23].
Due to the results of the experimental study of Hamad, Johari and Haddad (2017), the exposure to high temperatures affected more the mechanical properties of the FRP bars than those of the steel bars [23]. The temperature of 325 °C was determined as critical, as it caused 45–55% degradation in the tensile strength of FRP bars and 21–32% reduction in the elastic modulus [23]. It was obtained that the CFRP bars retained 10% and 37% of their tensile strength and elastic modulus, respectively at 450 °C, while the GFRP and BFRP bar were totally damaged and the tensile testing was not conducted [23].
Regarding the mode of failure of the specimens, a sudden fracture failure was noticed at the middle length of the bars exposed to the temperatures of 250 °C and below [23]. The specimens heated to 325 °C and greater showed some repeated minor load drops before failure, so the tests stopped before bar separation [23]. Significant differences between triplicate readings were observed at these temperatures, due to the effect of the decomposition of the polymer matrix on the bond between the fibers [23].
Li, Zhao and Wang (2018) studied the mechanical properties of GFRP bars under cyclic tensile loading after exposure to high temperatures [18]. They used 150 bars of 1200 mm length and 12 mm diameter, which were exposed to the temperatures of 100, 150, 200, 250, 300 and 350 °C for 0, 1 or 2 h [18]. After the cooling of the specimens, parts of them were tested under monotonic, uniaxial tension, and the others were subjected to fatigue load (4000, 6000, 8000, 10,000 and 14,000 cycles) [18]. After the fatigue test was completed, the specimens were subjected to monotonic, uniaxial tension up to failure [18].
The fatigue failure process of GFRP bars consists of four stages: matrix cracking, crack coupling interfacial debonding, fiber breaking and fracture [18]. The modes of failure after the exposure to elevated temperatures were similar to these at tension testing at room temperature [18]. The types of failure modes of the tensile fatigue test were three: blasting, splitting and fracture [18].
Resulting from the tensile strength–temperature curves, the deterioration effect of holding time on the tensile strength of the GRFP bar increased gradually at temperatures higher than 200 °C [18]. The tensile strength of the GFRP bars was not significantly affected by heat up to 150 °C, and then it decreased at higher temperatures [18]. The tensile strength reduced by 0.5% at 100 °C, 5.8% at 200 °C and 21.2% at 300 °C at a holding time of 1 h [18]. Holding time had a greater effect on the elastic modulus [18]. The elastic modulus decreased by 1.1% at 100 °C, 1.8% at 200 °C and 9.8% at 300 °C at a holding time of 1 h [18].
After their experimental study, Li, Zhao and Wang (2018) concluded that the tensile strength and the elastic modulus decrease with the increase in elevated temperature and holding time and more significantly at temperatures above 200 °C [18]. They also observed that the effect of elevated temperature on the tensile strength was higher than that on the elastic modulus, as the reduction in the first one was 28.0% and of the second one was 18.3% [18]. Another result was that the cyclic load accelerated the GFRP bars’ tensile strength reduction after elevated temperature exposure [18]. It also affected the reduction in the tensile elastic modulus as it decreased 17.6% compared to that without cyclic load temperature [18].
Our study focuses on the thermo-mechanical behavior of the CFRPs laminates under monotonic mechanical loading, low-cycle fatigue and thermal loading. The following paragraphs include the material and methods, the experimental results, a discussion and a comparison with the literature.
3. Materials and Methods
The material of the specimens that were used in the current research was a typical FRP laminate with unidirectional carbon fiber layers embedded in an organic matrix with Tg = 58 °C. The manufacturer of the tested material is Sika Hellas, under the name “SikaWrap-230 C”, and is gratefully acknowledged. According to the manufacturer data sheet, the layer’s thickness was tfiber = 0.129 mm, the warp was black carbon fibers and constituted 99% of the total areal weight, and the weft was white thermoplastic heatset fibers and constituted the remaining 1% of the total areal weight. The tensile strength and the elastic modulus of dry fibers were 4000 and 230,000 MPa, respectively. Twenty CFRP specimens of length Lo = 250 mm, width b = 15 mm and thickness t = 1.8 mm were prepared for the tests (see Figure 1). The samples were cut according to these dimensions from the FRP laminate piece of the manufacturer, and then they were measured accurately using a digital caliper before the beginning of the experiments. Nine of them were tested at room temperature (RT = 25 °C), and they were used as controls while the rest of the specimens were exposed to elevated temperatures (50, 100, 250 °C).
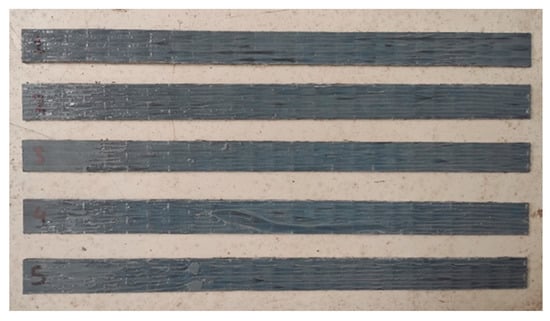
Figure 1.
Investigated specimens (MRT-MF_1; t = 1.63 mm, b = 15.74 mm, MRT-MF_2; t = 1.74 mm, b = 17.26 mm, MRT-MF_3; t = 1.71 mm, b = 14.68 mm, MRT-MF_4; t = 1.65 mm, b = 16.56 mm, MRT-MF_5; t = 1.78 mm, b = 15.95 mm).
An electronic caliper was used to measure the dimensions of the specimens. The width b as well as the thickness t were measured at three points of the central part of the specimens. This part was not held by the grips of the charging machine. The lowest values of these three measurements were chosen for each dimension, as it is considered that the specimen is more sensitive to failure in this area.
The tensile tests were performed using the universal testing machine Instron (model 5969) with a maximum capacity of 50 kN. Concurrently, the Bluehill software was used for the data export (time (s), imposed tensile load (kg), extension of the specimen (mm), strain of the specimen (mm/mm)) (see Figure 2). A clip-on extensometer was installed in order to measure the strain values directly and accurately. The tensile testing was conducted using a standard head stroke rate of 2.0 mm/min until failure.
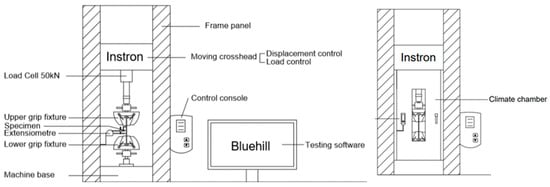
Figure 2.
Sketch of experimental setup for room temperature and for elevated temperatures [38].
The Instron machine was equipped with an electric furnace for the heating of the specimens (see Figure 2). The maximum operating temperature of the furnace is 260 °C, and the applied heating rate was 10 °C/min. The experimental setup for both room and elevated temperatures is shown in Figure 3.
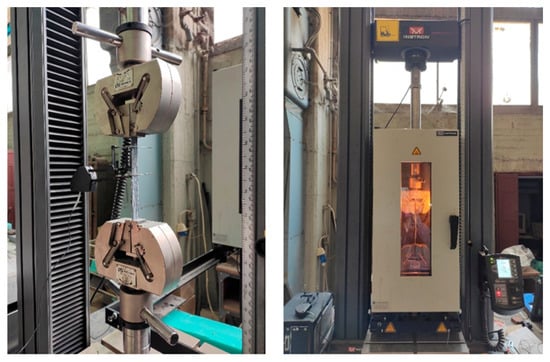
Figure 3.
Experimental setup for room temperature and for elevated temperatures.
In total, nine tests occurred at room temperature (25 °C). The first five specimens (MRT-MF_1-5) were tested under monotonic, uniaxial tension until failure. From the average value of these specimens’ strength, their maximum tensile strength was determined. Subsequently, four specimens were submitted to low-cycle fatigue tests of fifty loading–unloading cycles. The maximum load of the cycle was equal to 50% of the average tensile strength for the two specimens (C50RT-MF_1-2) and 75% for the other two specimens (750RT-MF_1-2). The rate of the tensile loading was 1000 N/min for the cyclic tests. After the fatigue loading the four specimens were tested under monotonic, uniaxial tension up to failure. The information of experiments under room temperature is shown in Table 1, and the characteristics of the specimens are shown in Table 2.

Table 1.
Detailed information of experiments under room temperature.

Table 2.
Characteristics of specimens of experiments under room temperature.
The designation of the tested specimens emerged as described below. The first character depicts the type of loading: M stands for monotonic uniaxial tension, C50 stands for low cycle fatigue with a max load 50% of the tensile strength, C75 stands for low cycle fatigue with a max load of 75% of the tensile strength. The second character depicts the temperature of the experiment: RT stands for room temperature. The third character depicts the type of loading at the time of failure: MF stands for monotonic uniaxial tension up to failure. The fourth character depicts the number of specimens of each type of experiment. The second and the third characters are separated by “-”, and the third and the fourth characters are separated by “_”.
The remaining eleven specimens were exposed to elevated temperatures. The first six of them were submitted to thermal loading at temperatures of 50 °C (T50-MF_1-2), 100 °C (T100-MF_1-2) and 250 °C (T250-MF_1-2). Once the furnace reached the target temperature, each specimen remained at this temperature for 30 min in order to obtain a uniform temperature distribution. When the specimen T50-MF_1 was heated at 50 °C, the uniaxial tensile test was performed at that temperature level. However, the tensile tests for the T50-MF_2, the T100-MF_1-2 and the T250-MF_1-2 at 50 °C, 100 °C and 250 °C, respectively, were performed after the specimens were left to cool down to room temperature (25 °C). The cooling process was achieved by opening the door of the furnace. The heating–cooling curves are shown in Figure 4. The first branch of each curve refers to the heating process. The second branch, which is stable, represents the holding time of 30 min at the target temperature. The third branch refers to the cooling process. After the cooling, the specimens were tested under monotonic, uniaxial tension until failure, as described before.
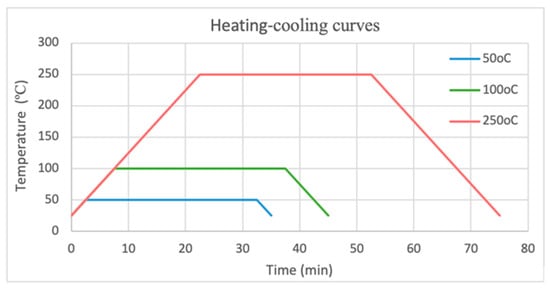
Figure 4.
Temperature–time curves of thermal loading before the tension testing (heating process, holding time 30 min at 50, 100 and 250 °C, cooling process to RT = 25 °C).
More realistically, CFRPs applied in concrete structures are usually under both imposed load and elevated temperatures from the environmental changes. Therefore, we decided to investigate the last five specimens under cyclic thermal loading while applying at the same time uniform axial tensile loading. These specimens were subjected to monotonic, uniaxial tension constantly at 50% of their average tensile strength. A standard head stroke rate of 2.0 mm/min was used until the target load value. Then, the specimens remained under this constant axial load. After three minutes, cyclic thermal loading was imposed to the specimens. We reached the temperatures of 50 °C (MCT50-MF_1), 100 °C (MCT100-MCTF_1-2) and 250 °C (MCT250-MCTF_1-2). The low-cycle thermal loading consisted of heating–cooling cycles up to failure. The maximum number of cycles was three. Each cycle concluded the heating process with a rate of 10 °C/min, a holding time of 15 min at the target temperature and the cooling process to the room temperature (25 °C). Figure 5 presents the thermal protocol for each temperature. The curves start at the time when cyclic thermal loading was imposed on the samples. During the cyclic thermal loading, the specimens remained under constant tensile load. Each curve consists of three heating–cooling cycles. The first branch of each cycle refers to the heating process. The second branch, which is stable, represents the holding time of 15 min at the target temperature, and the third branch refers to the cooling process. Specifically, the sample MCT50-MF_1, which completed the three thermal loading cycles successfully, was additionally subjected to monotonic, uniaxial tension until failure at the temperature of 50 °C.
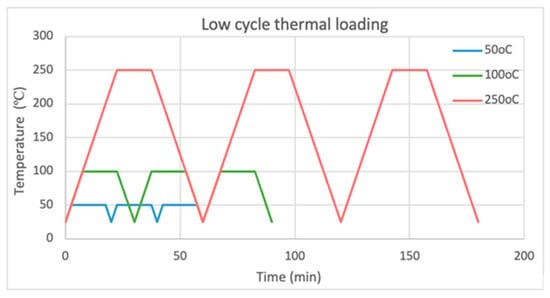
Figure 5.
Time–temperature curves for cyclic thermal loading of max 3 cycles under constant tensile load (heating process, holding time 15 min at 50, 100 and 250 °C, cooling process to RT = 25 °C).
The information of experiments under elevated temperature is shown in Table 3, and the characteristics of the specimens are shown in Table 4. The designation of the tested specimens emerged as described below. The first character depicts the type of loading: T stands for thermal loading, MCT stands for low cycle thermal loading under monotonic uniaxial tension. The second character depicts the temperature of the experiment: 50 stands for 50 °C, 100 stands for 100 °C, 250 stands for 250 °C. The third character depicts the type of loading at the time of failure: MF stands for monotonic uniaxial tension up to failure, MCTF stands for low cycle thermal loading under constant uniaxial tension. The fourth character depicts the number of specimens of each type of experiment. The second and the third characters are separated by “-”, and the third and the fourth characters are separated by “_”.

Table 3.
Detailed information of experiments under elevated temperatures.

Table 4.
Characteristics of specimens of experiments under elevated temperatures.
Comprehensively, the detailed design of experiments (DoE) is described in Table 5.

Table 5.
Design of experiments (DoE).
4. Results
The results are summarized in the following Table 6, which presents the maximum stress and strain together with the measured modulus of elasticity and the developed mode of failure of all the CFRP specimens. Figure 6 clearly shows the fracture of fibers of the specimens.

Table 6.
Summarized results.
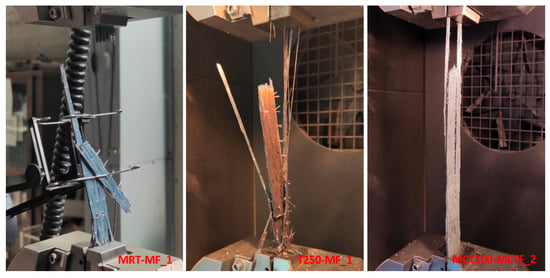
Figure 6.
Mode of failure of the specimens.
4.1. At Room Temperature
The stress–strain curves of the control specimens MRT-MF_1-5 are shown in Figure 7. All five specimens showed a similar linear elastic behavior. The average tensile strength, calculated at the thickness of dry fibers, was measured equally to 4410.82 MPa with an equivalent average ultimate strain of 17.29‰. The average modulus of elasticity of dry fibers was recorded equal to 255.12 GPa. The failure of the samples was brittle and it happened because of the fracture of fibers.
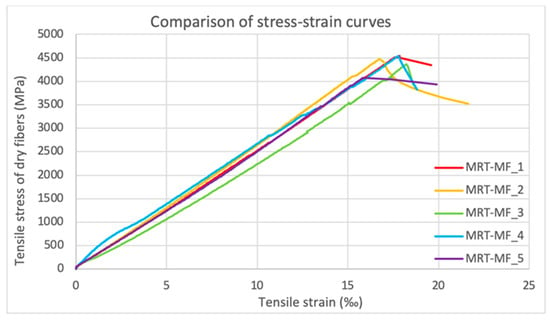
Figure 7.
Stress–strain curves for monotonic uniaxial tension at room temperature.
The specimens C50RT-MF_1-2 and C75RT-MF_1-2 were submitted to low-cycle fatigue tests of fifty loading–unloading cycles with maximum target load imposed of 50% and 75% of the average tensile strength, respectively. The stress–strain curves for low-cycle fatigue are shown in Figure 8 and Figure 9, respectively, for 50% and 75%.
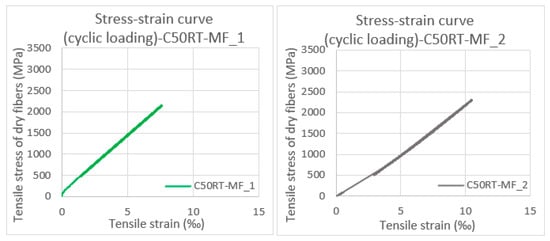
Figure 8.
Stress–strain curves for low-cycle fatigue with max load 50% of the tensile strength.
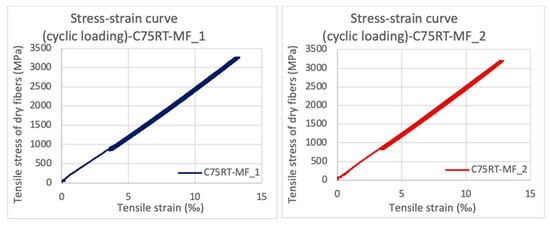
Figure 9.
Stress–strain curves for low-cycle fatigue with max load 75% of the tensile strength.
After the completeness of the load–unload cycles, all four specimens were imposed to monotonic tensile loading up to failure. The stress–strain curves of all coupons are shown in Figure 10. The overall mechanical behavior after 50 cycles remained similar for all specimens. The mode of failure was also the same. The failure happened abruptly because of the fracture of fibers.
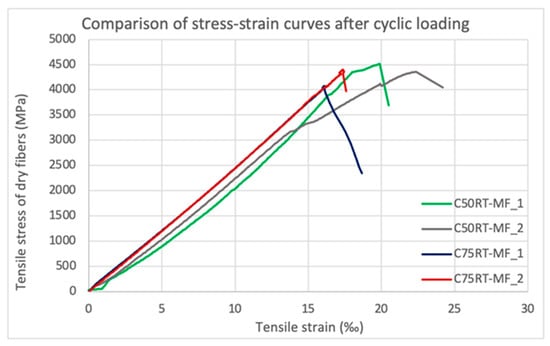
Figure 10.
Stress–strain curves of monotonic, uniaxial tension at room temperature after low-cycle fatigue.
4.2. At Elevated Temperatures
During the experimental investigation specimens T50-MF_1-2, T100-MF_1-2, T250-MF_1-2, MCT50-MF_1, MCT100-MCTF_1-2, MCT250-MCTF_1-2 were exposed to differ-ent temperature levels. Figure 11 presents the stress–strain curves of monotonic, uniaxial tensile tests, which were conducted after the specimens’ thermal protocol (heating and cooling for T50-MF_1-2, T100-MF_1-2, T250-MF_1-2).
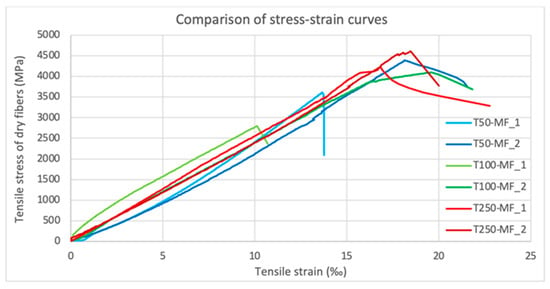
Figure 11.
Stress–strain curves of monotonic, uniaxial tensile tests after exposure to the temperatures of 50, 100 and 250 °C and then cooling.
The fibers of the specimens started to fail abruptly. The samples that were exposed to the temperature of 250 °C acquired a black color, their fibers separated from each other more, and all the samples failed because of the fibers’ fracture.
The specimens MCT50-MF_1, MCT100-MCTF_1-2 and MCT250-MCTF_1-2 were under both constant tensile service load (50% of the maximum) and thermal loading of a maximum of three heatin–cooling cycles. The stress–strain curves of these tests are shown in Figure 12.
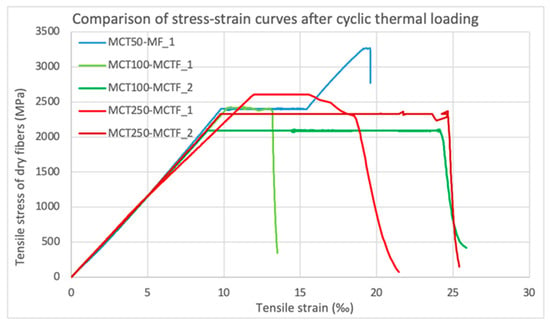
Figure 12.
Stress–strain curves for low cycle thermal loading under constant tensile load. The maximum temperatures of the cycles were 50, 100 and 250 °C.
MCT50-MF_1 was the only sample that managed to complete three heating–cooling cycles before failure. The maximum temperature of each cycle at this test was 50 °C. After the thermal cyclic loading, MCT50-MF_1 was tested under monotonic tension and it failed because of the fracture of the fibers. MCT100-MCTF_1 failed at the heating process at 64 °C, MCT100-MCTF_2 failed at the cooling process at 31 °C, MCT250-MCTF_1 failed at the heating process at 61 °C and MCT250-MCTF_2 failed at the heating process at 151 °C. The first two of these samples were supposed to be exposed to a maximum temperature of 100 °C and the last two to a maximum temperature of 250 °C. The sample failure happened because of the fibers’ fracture. Additionally, the fibers of the specimens MCT100-MCTF_2 and MCT250-MCTF_2, which remained at elevated temperatures for more time, separated from each other more.
5. Discussion of the Results of the Present Study
5.1. At Room Temperature
The following stress–strain graph is the average graph of the five control specimens (MRT-MF_1-5), which were monotonically loaded at room temperature up to failure. (fu,ave,fibers = 4410.82 MPa, εave,fibers = 17.29‰ and Εave,fibers = 255.12 GPa, see Table 6). The average graph depicted in Figure 13 will be used as a reference curve and be compared with the equivalent curves that exhibit thermal constrains and low-cycle fatigue.
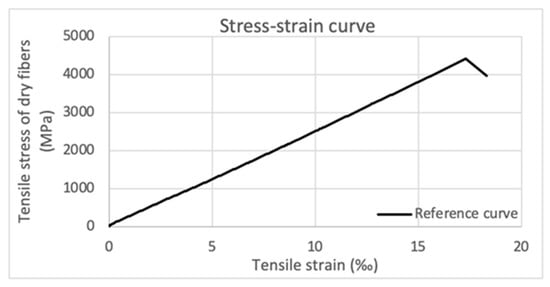
Figure 13.
Stress–strain curve for monotonic, uniaxial tension at room temperature.
Specimens C50RT-MF_1-2 and C75RT-MF_1-2 were submitted to fatigue tests of fifty loading–unloading cycles with a maximum load of 50% and 75% of the average tensile strength, respectively. Resulting from the monotonic, uniaxial tension that followed, the average tensile strength of dry fibers was 4438.88 and 4237.14 MPa for the C50RT-MF_1-2 and the C75RT-MF_1-2, respectively. Consequently, the repeated loading up to a level of 50% did not affect the specimen’s ultimate strength. Whereas when the loading reached 75% of the ultimate strength, the maximum stress was recorded as 3.94% smaller than the reference strength.
In addition, the average ultimate strain did not show a significant change or influence as its value was 21.07‰ and 17.48‰ for the C50RT-MF_1-2 and the C75RT-MF_1-2, respectively, compared to the 17.29‰ of the reference coupons. It should also be mentioned that low-cycle fatigue does not affect the stiffness of the CFRPs as their elastic modulus of dry fibers remains unchanged at the same level. The investigated carbon fiber-reinforced polymer is a composite material with linear elastic behavior up to failure. As a result, the load–unload of this material for a number of cycles at the range of 50 cycles is not expected to influence the modulus of elasticity and consequently the stiffness [29]. The comparison is shown graphically in Figure 14 in terms of stress–strain curves.
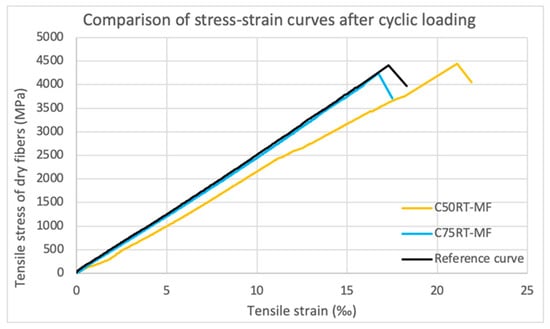
Figure 14.
Stress–strain curves of monotonic, uniaxial tension at room temperature after low-cycle fatigue with max load 50% (C50RT-MF) and 75% (C75RT-MF) of the tensile strength.
5.2. At Elevated Temperatures
Specimens T50-MF_1-2, T100-MF_1-2, T250-MF_1-2, MCT50-MF_1, MCT100-MCTF_1-2, MCT250-MCTF_1-2 were exposed to different temperature protocols during the experimental campaign. Specimens T50-MF_2, T100-MF_1-2 and T250-MF_1-2 were tested under monotonic, uniaxial tensile tests, which were conducted after the specimens’ heating and cooling (with a small constant load, 10% of the ultimate).
More specifically, T50-MF_1 was the only specimen that was tested and failed as the tensile test was held at the temperature of 50 °C. For this specimen, the tensile strength of dry fibers was measured equal to 3615.14 MPa and its ultimate strain was 13.67‰. On the contrary, T50-MF_2 was also exposed to the same temperature of 50 °C and left to cool down to room temperature. Then it was subjected to a tensile test up to failure. The tensile strength of dry fibers for T50-MF_2 was 4396.47 MPa, the ultimate strain was 18.15‰ and the elastic modulus of dry fibers was 242.23 GPa.
Consequently, it is established that when exposed to elevated temperatures, at a max of 50 °C, CFPRs lose their tensile strength, whereas when they are left to cool down and are under stress, their strength remains the same. More specifically, the tensile strength of dry fibers of the sample T50-MF_1 decreased by 18.04% and its elastic modulus of dry fibers increased by 3.69%. The stress–strain curves of T50-MF_1 and T50-MF_2 are shown in Figure 15.
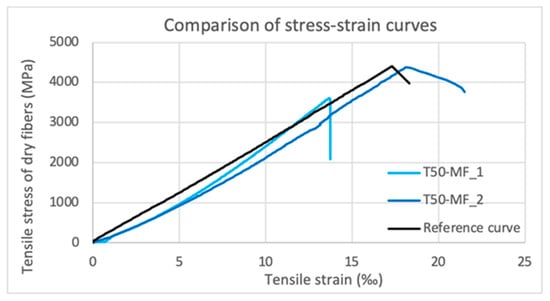
Figure 15.
Stress–strain curves of monotonic, uniaxial tensile tests at 50 °C (T50-MF_1) and at room temperature (T50-MF_2) after exposure to 50 °C.
Observing the samples after heating optically, those exposed to 100 and 250 °C developed a significant softening, and the resin turned easily into powder with the application of a small pressure by the machine. This happens because the viscosity of the resin decreases. Because of this, the resin is not able to transfer the loads evenly to the fibers when the FRP is at elevated temperatures. The fact that the resin and the fibers do not work appropriately results in changes of the FRP’s mechanical properties. In addition, T250-MF_1-2 specimens acquired a dark black color (see Figure 21). However, it was observed that the samples regained their hardness after cooling and the resin was no longer frail. A conclusion worth noting is that the tensile strength of dry fibers of the specimens after exposure at the temperatures of 50, 100 and 250 °C for 30 min did not show any significant decrease. The fact that the samples were left to cool contributed to this result. The ultimate strain and the elastic modulus of dry fibers of these specimens did not show any important change either. As a consequence, after cooling, the mechanical properties of the FRPs are restored. Figure 16 shows the stress–strain curves of monotonic, uniaxial tensile tests performed after heating and cooling the samples T50-MF_2, T100-MF_2 and T250-MF_1-2. The average curve of T250-MF_1 and T250-MF_2, which were both exposed to 250 °C, is presented. The tensile strength of dry fibers of T100-MF_2 was 4097.00 MPa, the ultimate strain was 19.57‰ and the modulus of elasticity of dry fibers was 209.32 GPa. The average tensile strength of dry fibers of T250-MF_1 and T250-MF_2 was 4427.86 MPa, the ultimate strain was 17.66‰ and the elastic modulus of dry fibers was 250.80 GPa.
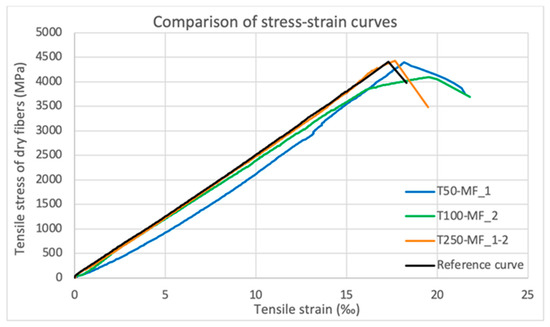
Figure 16.
Stress–strain curves of monotonic, uniaxial tensile tests after exposure to the temperatures of 50, 100 and 250 °C and then cooling.
Specimens MCT50-MF_1, MCT100-MCTF_1-2 and MCT250-MCTF_1-2 were under both constant tensile load and thermal loading of a maximum of three heating–cooling cycles. The only sample that managed to complete three heating–cooling cycles with a maximum temperature of 50 °C without premature failure was MCT50-MF_1. After the thermal cyclic loading, MCT50-MF_1 was tested under monotonic tension. The specimen’s tensile strength of dry fibers was 3269.66 MPa, its ultimate strain was 19.32‰ and its elastic modulus of dry fibers was 169.27 GPa. According to this, the tensile strength and the elastic modulus of dry fibers decreased after the heating–cooling cycles by 25.87% and 33.65%, respectively, as shown in Figure 17. At the same time, the ultimate strain increased due to the exposure of the sample to 50 °C for a long time. The time–strain/temperature curves from the beginning to the end of the experiment of MCT50-MF_1 are shown in Figure 18.
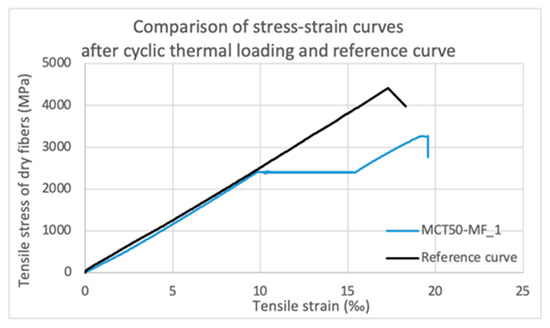
Figure 17.
Stress–strain curve of MCT50-MF_1 for low cycle thermal loading under constant tensile load with maximum temperature of the cycles at 50 °C and then a monotonic, uniaxial tensile test.
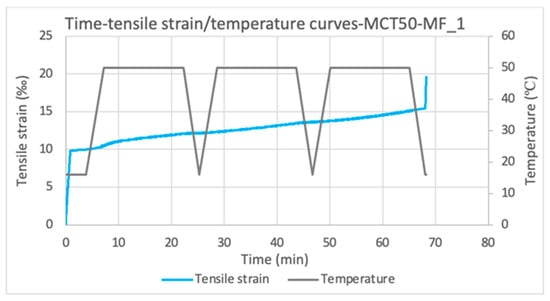
Figure 18.
Time–strain/temperature curves of MCT50-MF_1.
At higher temperatures, heating combined with the continuous loading had an important impact on the CFRPs’ strength as the four samples failed during the first cycle. The time–strain/temperature curves of the specimens MCT100-MCTF_1-2 and MCT250-MCTF_1-2 are shown in Figure 19.
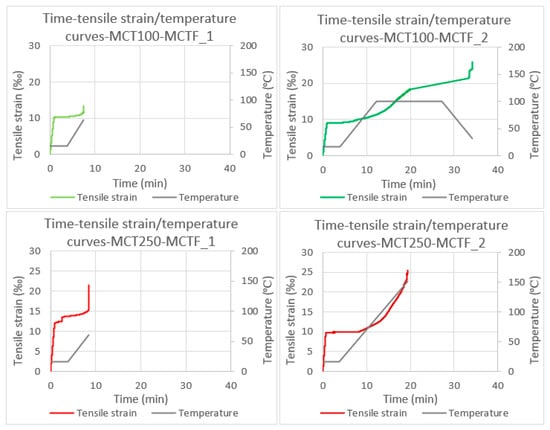
Figure 19.
Time–strain/temperature curves of MCT100-MCTF_1-2 and MCT250-MCTF_1-2.
It is necessary to mention that the heating rate was 10 °C/min. Because of this slow rate, the specimens remained at a high temperature for a long time. It is worth investigating in the future the influence of the heating rate. The deterioration of the CFRP, due to the long time remaining at high temperature, was also obvious from the mode of failure of MCT250-MCTF_2 and its fibers’ dark color.
From the specimens that were supposed to be exposed to maximum temperature of 100 °C and 250 °C, MCT100-MCTF_2 and MCT250-MCTF_2 remained at high temperatures for a longer time than MCT100-MCTF_1 and MCT250-MCTF_1, which failed earlier. It is also evident from Figure 20, which shows the time/strain curves of the specimens, that staying at high temperatures under constant load for a longer time results in greater deflections and significant reduction in the modulus of elasticity. The ultimate strain and elastic modulus of dry fibers of MCT100-MCTF_2 were 24.14‰ and 87.23 GPa, respectively, and of MCT250-MCTF_2 were 23.63‰ and 100.36 GPa, respectively. As a result, the ultimate strain of MCT100-MCTF_2 increased by 39.63%, and the elastic modulus decreased by 65.81%. The ultimate strain of MCT250-MCTF_2 increased by 36.69%, and the elastic modulus decreased by 60.66%.
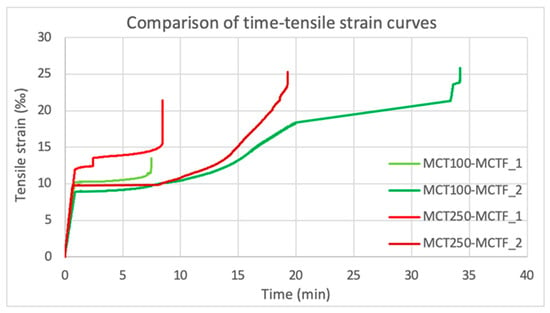
Figure 20.
Time–strain curves of the specimens MCT50-MF_1, MCT100-MCTF_1-2 and MCT250-MCTF_1-2.
Concerning the FRPs’ mode of failure, it is characterized as brittle because of the sudden fracture of the fibers. The color of the specimens become dark because of the thermal exposure, and at high temperature (250 °C), the separation of the fibers is obvious. The specimens are shown after their failure in Figure 21.
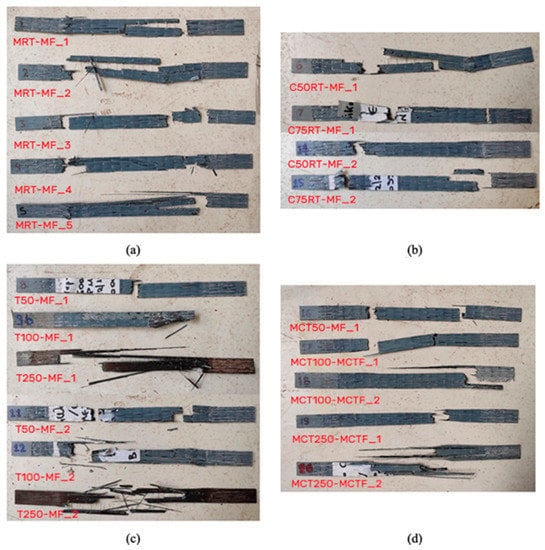
Figure 21.
Specimens after their failure: (a,b) experiments at room temperature; (c,d) experiments at elevated temperatures.
6. Discussion with Results from the Literature
The results of the tension testing after exposure to elevated temperatures (samples T50-MF_2, T100-MF_2 and T250-MF_1-2) can be compared to the relevant literature. Saafi (2002) presented the effect of elevated temperature on the mechanical properties of FRPs and structural steel, which was presented in the introduction. Saafi relied on the experiments of Blontrok et al. (1999) and concluded the following equations of the reduction factors of the CFRP bars’ characteristics [30].
The equation of the tensile strength reduction factor kf in regard to the temperature is:
where ffu20 °C and ffuT are the tensile strength of the CFRP bars at 20 °C and T °C, respectively [30].
ffuTffu20 °C = kf
The equation of the elastic modulus reduction factor kE in regard to the temperature is:
where Ef20 °C and EfT are the elastic modulus of the CFRP bars at 20 °C and T °C, respectively [30].
EfTEf20 °C = kE
Additionally, kf and kE described from Saafi as follows:
kf = 1 for 0 ≤ T ≤ 100
kf = 1.267 − 0.00267T for 100 ≤ T ≤ 475
kf = 0 for 475 ≤ T
kE = 1 for 0 ≤ T ≤ 100
kE = 1.175 − 0.00175T for 100 ≤ T ≤ 300
kE = 1.625 − 0.00325T for 300 ≤ T ≤ 500
kE = 0 for 500 ≤ T
As already mentioned, at the experiments of Hamad, Johari and Haddad (2017) CFRP bars were exposed for 30 min at temperatures of 125, 250, 325, 375 and 450 °C and after cooling they were tested in monotonic, uniaxial tension up to failure [23]. The results of them were compared with the results of monotonic, uniaxial tensile experiments of corresponding samples at 23 °C [23]. Therefore, the current experimental study, which followed the same methodology, is comparable with the experiments of Hamad, Johari and Haddad (2017).
Li, Zhao and Wang (2018) investigated the mechanical behavior of GFRP bars after exposure to high temperatures for different holding times [18]. The closest holding time in relation to the experiments of the present study was 1 h, so the results of these experiments were chosen to be compared. The procedure followed in these experiments of the GFRP samples included their exposure to the temperatures of 100, 150, 200, 250, 300 and 350 °C and the tension testing after cooling up to failure [18]. The results of these tests were compared with the results of monotonic, uniaxial tensile experiments of corresponding samples at 25 °C [18].
The values of the reduction factors of the present experimental work (CFRP-Experimental) are shown in Table 7. Figure 22 and Figure 23 show the temperature–tensile strength reduction factor curves and the temperature–elastic modulus reduction factor curves according to Saafi’s model, the experiments mentioned above and the experiments of the specimens T50-MF_2, T100-MF_2 and T250-MF_1-2 of the present study [18,23,30].

Table 7.
Tensile strength and elastic modulus reduction factors of the present experimental work (CFRP-Experimental).
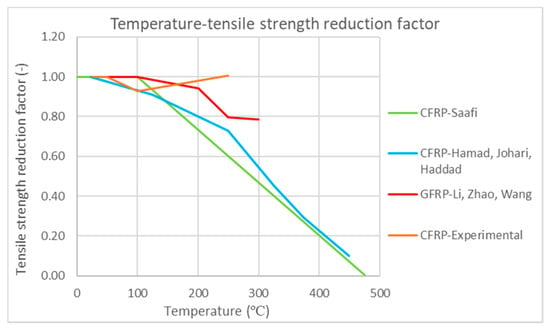
Figure 22.
Temperature–tensile strength reduction factor curves [18,23,30].
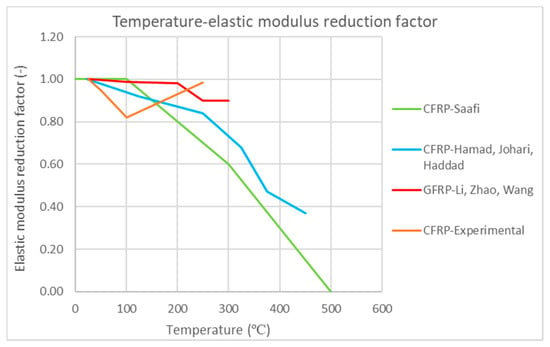
Figure 23.
Temperature–elastic modulus reduction factor curves [18,23,30].
According to Figure 22, the present investigation shows a minimal reduction in the tensile strength of CFRP laminates after exposure to 250 °C. This reduction has a significant deviation from the Saafi model. The two curves agree that up to 50 °C the tensile strength of CFRPs is not reduced. However, according to Saafi, the resistance remains unaffected for the temperature of 100 °C, while a small decrease appeared in the present study. At 250 °C, the deviation is large, as in the present investigation there was no further reduction, while the equivalent factor according to the Saafi model reaches the value of 0.60. The results of the present experiments appear to be consistent with the results of the experiments of Hamad, Johari and Haddad for temperatures up to 100 °C. However, for the temperature of 250 °C they show a significant deviation, as the present study did not show a decrease in tensile strength, while according to Hamad, Johari and Haddad, the value of the reduction coefficient was 0.73. The results of the present experiments differ in relation to the experiments of the GFRP bars of Li, Zhao and Wang for the temperatures above 50 °C. Especially, for the temperature of 250 °C, the reduction factor of the last one has a significantly lower value, as it reaches the value of 0.80. In addition, Saafi and Hamad, Johari and Haddad agree that after exposure to even higher temperatures, the tensile strength of CFRPs decreases sharply and reaches almost zero at temperatures above 450 °C.
According to the results of the experiments of the present study, the modulus of elasticity decreases after exposure to the temperatures of 50 and 100 °C. According to Figure 23, this is in contrast to the other surveys, in which either no reduction occurs or it is much smaller. For the temperature of 250 °C, the reduction in the modulus of elasticity of the present study is minimal, as the value of the reduction factor is 0.98. This behavior deviates greatly from the conclusions of Saafi and Hamad, Johari and Haddad, in which the values of the reduction factors are much lower, 0.70 and 0.84, respectively. There is also a smaller deviation compared to the experiments of GFRP bars. In addition, Saafi and Hamad, Johari and Haddad agree that the exposure of CFRPs to even higher temperatures decreases the modulus of elasticity reduction factor sharply. According to the Saafi model, the modulus of elasticity is zeroed at temperatures above 500 °C, while according to Hamad, Johari and Haddad, the reduction factor of the modulus of elasticity of CFRP bars is equal to 0.37 after exposure to the temperature of 450 °C.
7. Conclusions
The main conclusions of the present experimental investigation can be summarized as follows:
- At room temperature, CFRP laminates show high tensile strength and elastic modulus.
- Low-cycle fatigue at room temperature does not affect the tensile strength of CFRP laminates.
- Low-cycle fatigue at room temperature does not affect the stiffness of the CFRPs, as their elastic moduli remain at the same level.
- When CFRP laminates are exposed to elevated temperatures (100, 250 °C), the viscosity of the resin decreases, and it decomposes easily with the application of loading. In addition, FRPs acquire a dark, black color at 250 °C, depicting the change of matrix composition.
- When CFRP laminates are exposed to elevated temperatures, they show a reduction in their tensile strength. The rate of this reduction was 18.04% after exposure to the temperature of 50 °C.
- CFRPs which were exposed to high temperatures regain their hardness after cooling and the resin is no longer frail and brittle. In addition, their tensile strength does not decrease when they return to normal temperature.
- The cyclic thermal loading when combined with constant tensile load causes reduction in the tensile strength of CFRP laminates after the heating–cooling cycles. The tensile strength of the CFRP laminate that was under cyclic thermal loading of a maximum temperature of 50 °C was reduced by 25.87%.
- The cyclic thermal loading under constant tensile load reduces the elastic modulus of CFRP laminates. The elastic modulus of the CFRP laminate that was under cyclic thermal loading of a maximum temperature of 50 °C was reduced by 33.65%. The higher temperatures the CFRPs are exposed to, the greater the reduction in the elastic modulus.
- The longer time the CFRP laminates remain at high temperatures under constant tensile load, the greater the deflections and reductions in their elastic modulus. The ultimate strain of the CFRP laminate that was under cyclic thermal loading of a maximum temperature of 100 °C increased by 39.63%, and the elastic modulus decreased by 65.81%. The ultimate strain of the CFRP laminate that was under cyclic thermal loading of a maximum temperature of 250 °C increased by 36.69% and the elastic modulus decreased by 60.66%.
- CFRPs fail due to fracture of fibers. When they are exposed to higher temperatures of 250 °C, separation of the fibers is also observed during their failure. This happens because of the change in the viscosity of the resin, which is the bonding together of the fibers.
- The measured ultimate stress from the present study is in good agreement with the equivalent results from the literature up to the imposed temperature of 100 °C.
- The measured modulus of elasticity reached a bigger decrease than the equivalent in the literature for the temperature of 100 °C. This reduction factor is 0.82.
Author Contributions
Conceptualization, K.K.; methodology, K.K.; software, K.K., C.P., L.M., L.K. and N.M.; validation, investigation, K.K., C.P., L.M., L.K. and N.M.; resources, K.K.; data curation, K.K., C.P., L.M., L.K. and N.M.; writing—original draft preparation, K.K., C.P., L.M., L.K. and N.M.; writing—review and editing, K.K.; supervision, K.K.; project administration, K.K.; funding acquisition, K.K. All authors have read and agreed to the published version of the manuscript.
Funding
This research was funded by Greece and European Union through the Operational Program “EDBM-103: Support for Researchers Emphasizing Young Researchers—2nd Cycle” (project code: 5047899), which are gratefully acknowledged.
Institutional Review Board Statement
Not applicable.
Informed Consent Statement
Not applicable.
Acknowledgments
Part of the research “Mechanical Properties Characterisation of FRPs under Elevated Temperatures” has been co-funded by Greece and European Union through the Operational Program “EDBM-103: Support for Researchers Emphasizing Young Researchers—2nd Cycle” (project code: 5047899), which are gratefully acknowledged. Sika Hellas is also acknowledged for providing the material.

Conflicts of Interest
The authors declare no conflict of interest.
Symbolisms
| Afrp | cross-sectional area of the fiber-reinforced polymer (FRP) (mm2) |
| Afibers | cross-sectional area of the FRP’s dry fibers (mm2) |
| Efibers | elastic modulus of the FRP’s dry fibers (GPa) |
| Eave,fibers | average elastic modulus of the FRP’s dry fibers (GPa) |
| Lo | initial length of the FRP (mm) |
| T | thickness of the FRP (mm) |
| tfiber | thickness of the FRP’s dry fiber layer (mm) |
| n | number of the FRP’s dry fiber layers |
| b | width of the FRP (mm) |
| fu,fibers | tensile strength of the FRP’s dry fibers (MPa) |
| fu,ave,fibers | average tensile strength of the FRP’s dry fibers (MPa) |
| εfibers | ultimate strain of the FRP’s dry fibers at the maximum tensile stress of the FRP (‰) |
| εave,fibers | average ultimate strain of the FRP’s dry fibers at the maximum tensile stress of the FRP (‰) |
| rf | tensile strength reduction factor of the FRP’s dry fibers (-) |
| rE | elastic modulus reduction factor of the FRP’s dry fibers (-) |
| Tg | glass transition temperature (°C) |
References
- Naser, M.Z.; Hawileh, R.A.; Abdalla, J.A. Fiber-reinforced polymer composites in strengthening reinforced concrete structures: A critical review. Eng. Struct. 2019, 198, 109542. [Google Scholar] [CrossRef]
- Katakalos, K. Experimental and Numerical Investigation of R/C Beams Strengthened Externally with Open Hoop Strips of Either CFRP or SFRP with or without Anchorage under Monotonic or Cyclic Loadings. Ph.D. Thesis, Aristotle University of Thessaloniki, Thessaloniki, Greece, 2013; pp. 3, 8–9. [Google Scholar]
- Dritsos, S.I. Composite materials in structures. In Proceedings of the 15th Concrete Conference, Technical Chamber of Greece, Technical Chamber of Cyprus, Alexandroupoli, Greece, 25–27 October 2006. [Google Scholar]
- Manos, G.; Katakalos, K. Reinforced Concrete Beams Retrofitted with External CFRP Strips towards Enhancing the Shear Capacity. Appl. Sci. 2021, 11, 7952. [Google Scholar] [CrossRef]
- Talikoti, R.S.; Kandekar, S.B. Strength and Durability Study of Concrete Structures Using Aramid-Fiber-Reinforced Polymer. Fibers 2019, 7, 11. [Google Scholar] [CrossRef]
- Thermou, G.; Katakalos, K.; Manos, G. Influence of the loading rate on the axial compressive behavior of concrete specimens confined with SRG jackets. In Proceedings of the COMPDYN 2013: 4th International Conference on Computational Methods in Structural Dynamics and Earthquake Engineering, Kos Island, Greece, 12–14 June 2013; National Technical University of Athens: Athens, Greece; pp. 1107–1122. [Google Scholar] [CrossRef]
- Singh, S.B.; Sethi, A. A review of performance of fibre reinforced polymer strengthened structures under fire exposure. Proc. Indian Natl. Sci. Acad. 2017, 83, 521–532. [Google Scholar]
- Ashrafi, H.; Bazli, M.; Najifabadi, E.P.; Oskouei, A.V. The effect of mechanical and thermal properties of FRP bars on their tensile performance under elevated temperatures. Constr. Build. Mater. 2017, 157, 1001–1010. [Google Scholar] [CrossRef]
- Manos, G.; Katakalos, K.; Papakonstantinou, C. Shear behavior of rectangular beams strengthened with either carbon or steel fiber rein-forced polymers. Appl. Mech. Mater. 2011, 82, 571–576. [Google Scholar] [CrossRef]
- Manos, G.C.; Theofanous, M.; Katakalos, K. Numerical simulation of the shear behaviour of reinforced concrete rectangular beam specimens with or without FRP-strip shear reinforcement. Adv. Eng. Softw. 2014, 67, 47–56. [Google Scholar] [CrossRef]
- Karabinis, A.I.; Pantazopoulou, S. The Use of Composite Materials in the Design and Reinforcement of RC members. Tech. Chron. Sci. Publ. Tech. Chamb. Greece I 2000, 20, 13. [Google Scholar]
- Krzywoń, R. Behavior of EBR FRP strengthened beams exposed to elevated. Procedia Eng. 2017, 193, 297–304. [Google Scholar] [CrossRef]
- Juon, P.H.; Saeedipour, H.; Goh, K.L. Thermal damage in carbon-fiber-reinforced polymer composites: A critical review. Compos. Mater. Manuf. Prop. Appl. 2021, 285–305. [Google Scholar] [CrossRef]
- Najafabadi, E.P.; Oskouei, A.V.; Khaneghahi, M.H.; Shoaei, P.; Ozbakkaloglu, T. The tensile performance of FRP bars embedded in concrete under elevated temperatures. Constr. Build. Mater. 2019, 211, 1138–1152. [Google Scholar] [CrossRef]
- Ray, B.C.; Rathore, D. Durability and integrity studies of environmentally conditioned interfaces in fibrous polymeric composites: Critical concepts and comments. Adv. Colloid Interface Sci. 2014, 209, 68–83. [Google Scholar] [CrossRef]
- Li, Y.; Liu, X.; Wu, M. Mechanical properties of FRP-strengthened concrete at elevated temperature. Constr. Build. Mater. 2017, 134, 424–432. [Google Scholar] [CrossRef]
- Hawileh, R.A.; Abu-Obeidah, A.; Abdalla, J.A.; Al-Tamimi, A. Temperature effect on the mechanical properties of carbon, glass and carbon–glass FRP laminates. Constr. Build. Mater. 2015, 75, 342–348. [Google Scholar] [CrossRef]
- Li, G.; Zhao, J.; Wang, Z. Fatigue Behavior of Glass Fiber-Reinforced Polymer Bars after Elevated Temperatures Exposure. Materials 2018, 11, 1028. [Google Scholar] [CrossRef] [PubMed]
- Gawil, B.; Wu, H.; Elarbi, A. Modeling the Behavior of CFRP Strengthened Concrete Beams and Columns at Different Temperatures. Fibers 2020, 8, 10. [Google Scholar] [CrossRef]
- Spirakos, K. Reinforcement of Structures for Seismic Loads; Technical Chamber of Greece: Athens, Greece, 2004; pp. 170, 175–181. [Google Scholar]
- Cerniauskas, G.; Tetta, Z.; Bournas, D.A.; Bisby, L.A. Concrete confinement with TRM versus FRP jackets at elevated temperatures. Mater. Struct. 2020, 53, 58. [Google Scholar] [CrossRef]
- Bazli, M.; Abolfazli, M. Mechanical Properties of Fibre Reinforced Polymers under Elevated Temperatures: An Overview. Polymers 2020, 12, 2600. [Google Scholar] [CrossRef] [PubMed]
- Hamad, R.J.A.; Johari, M.A.M.; Haddad, R.H. Mechanical properties and bond characteristics of different fiber reinforced polymer rebars at elevated temperatures. Constr. Build. Mater. 2017, 142, 521–535. [Google Scholar] [CrossRef]
- Bai, Y.; Vallée, T.; Keller, T. Modeling of thermal responses for FRP composites under elevated and high temperatures. Compos. Sci. Technol. 2008, 68, 47–56. [Google Scholar] [CrossRef]
- Wang, Y.; Wong, P.; Kodur, V. An experimental study of the mechanical properties of fibre reinforced polymer (FRP) and steel reinforcing bars at elevated temperatures. Compos. Struct. 2007, 80, 131–140. [Google Scholar] [CrossRef]
- Bisby, L.A.; Green, M.F.; Kodur, V.K.R. Response to fire of concrete structures that incorporate FRP. Prog. Struct. Eng. Mater. 2005, 7, 136–149. [Google Scholar] [CrossRef]
- Bisby, L.A. Fire Behaviour of Fibre-Reinforced Polymer (FRP) Reinforced or Confined Concrete. Ph.D. Thesis, Queen’s University, Kingston, ON, Canada, 2003; pp. 34–52. [Google Scholar]
- Al-Abdwais, A.; Al-Mahaidi, R.; Al-Tamimi, A. Performance of NSM CFRP strengthened concrete using modified cement-based adhesive at elevated temperature. Constr. Build. Mater. 2017, 132, 296–302. [Google Scholar] [CrossRef]
- Papakonstantinou, C.; Katakalos, K. Mechanical Behavior of High Temperature Hybrid Carbon Fiber/Titanium Laminates. J. Eng. Mater. Technol. 2009, 131, 021008. [Google Scholar] [CrossRef]
- Saafi, M. Effect of fire on FRP reinforced concrete members. Compos. Struct. 2002, 58, 11–20. [Google Scholar] [CrossRef]
- Sen, R.; Mariscal, D.; Shahawy, M. Durability of fiberglass pretensioned beams. ACI Struct. J. 1993, 90, 525–533. [Google Scholar]
- Gates, T.S. Effects of Elevated Temperature on the Viscoelastic Modeling of Graphite/Polymeric Composites; NASA Technical Memorandum 104160, National Aeronautics and Space Administration: Langley, VA, USA, 1991; p. 29. [Google Scholar]
- Bank, L.C. Properties of FRP Reinforcements for Concrete. In Fibre-Reinforced-Plastic (FRP) Reinforcements for Concrete Structures: Properties and Applications; Nanni, A., Ed.; Elsevier: Amsterdam, The Netherlands, 1993; pp. 59–86. [Google Scholar]
- Kumahara, S.; Masuda, Y.; Tanano, H.; Shimizu, A. Tensile Strength of Continuous Fibre Bar under High Temperature. In Proceedings of the Fibre-Reinforced-Plastic Reinforcement for Concrete Structures: An International Symposium, Vancouver, BC, Canada, 28–31 March 1993; Nanni, A., Dolan, C.W., Eds.; American Concrete Institute: Detroit, MI, USA, 1993; pp. 731–742. [Google Scholar]
- Fujisaki, T.; Nakatsuji, T.; Sugita, M. Research and Development of Grid Shaped FRP Reinforcement. In Proceedings of the Fibre-Reinforced-Plastic Reinforcement for Concrete Structures: An International Symposium, Vancouver, BC, Canada, 28–31 March 1993; Nanni, A., Dolan, C.W., Eds.; American Concrete Institute: Detroit, MI, USA, 1993; pp. 177–192. [Google Scholar]
- Kodur, V.K.R.; Baingo, D. Fire Resistance of FRP Reinforced Concrete Slabs. Natl. Res. Counc. Can. Inst. Res. Constr. 1998, 39. [Google Scholar] [CrossRef]
- Mallick, P.K. Fibre-Reinforced Composites: Materials, Manufacturing and Design; Marcel Dekker Inc.: New York, NY, USA, 2007; pp. 355–361. [Google Scholar]
- Piliafa, S. Investigation of the Thermomechanical for Smart Materials to Monotonic and Low-Cycle Fatigue Conditions. Master’s Thesis, Aristotle University of Thessaloniki, Thessaloniki, Greece, 2020; p. 72. [Google Scholar]
Publisher’s Note: MDPI stays neutral with regard to jurisdictional claims in published maps and institutional affiliations. |
© 2021 by the authors. Licensee MDPI, Basel, Switzerland. This article is an open access article distributed under the terms and conditions of the Creative Commons Attribution (CC BY) license (https://creativecommons.org/licenses/by/4.0/).