
Experimental Investigation and Modelling of the Layered Concrete with Different Concentration of Short Fibers in the Layers

 ,
, 
Abstract
1. Introduction
2. Materials and Methods
2.1. Physical Properties of Steel Fibers
2.2. Concrete Mix Design and Materials
2.3. Preparation of Pull-Out Specimens
2.4. Specimens’ Preparation for Compressive Strength Testing and Curing Conditions
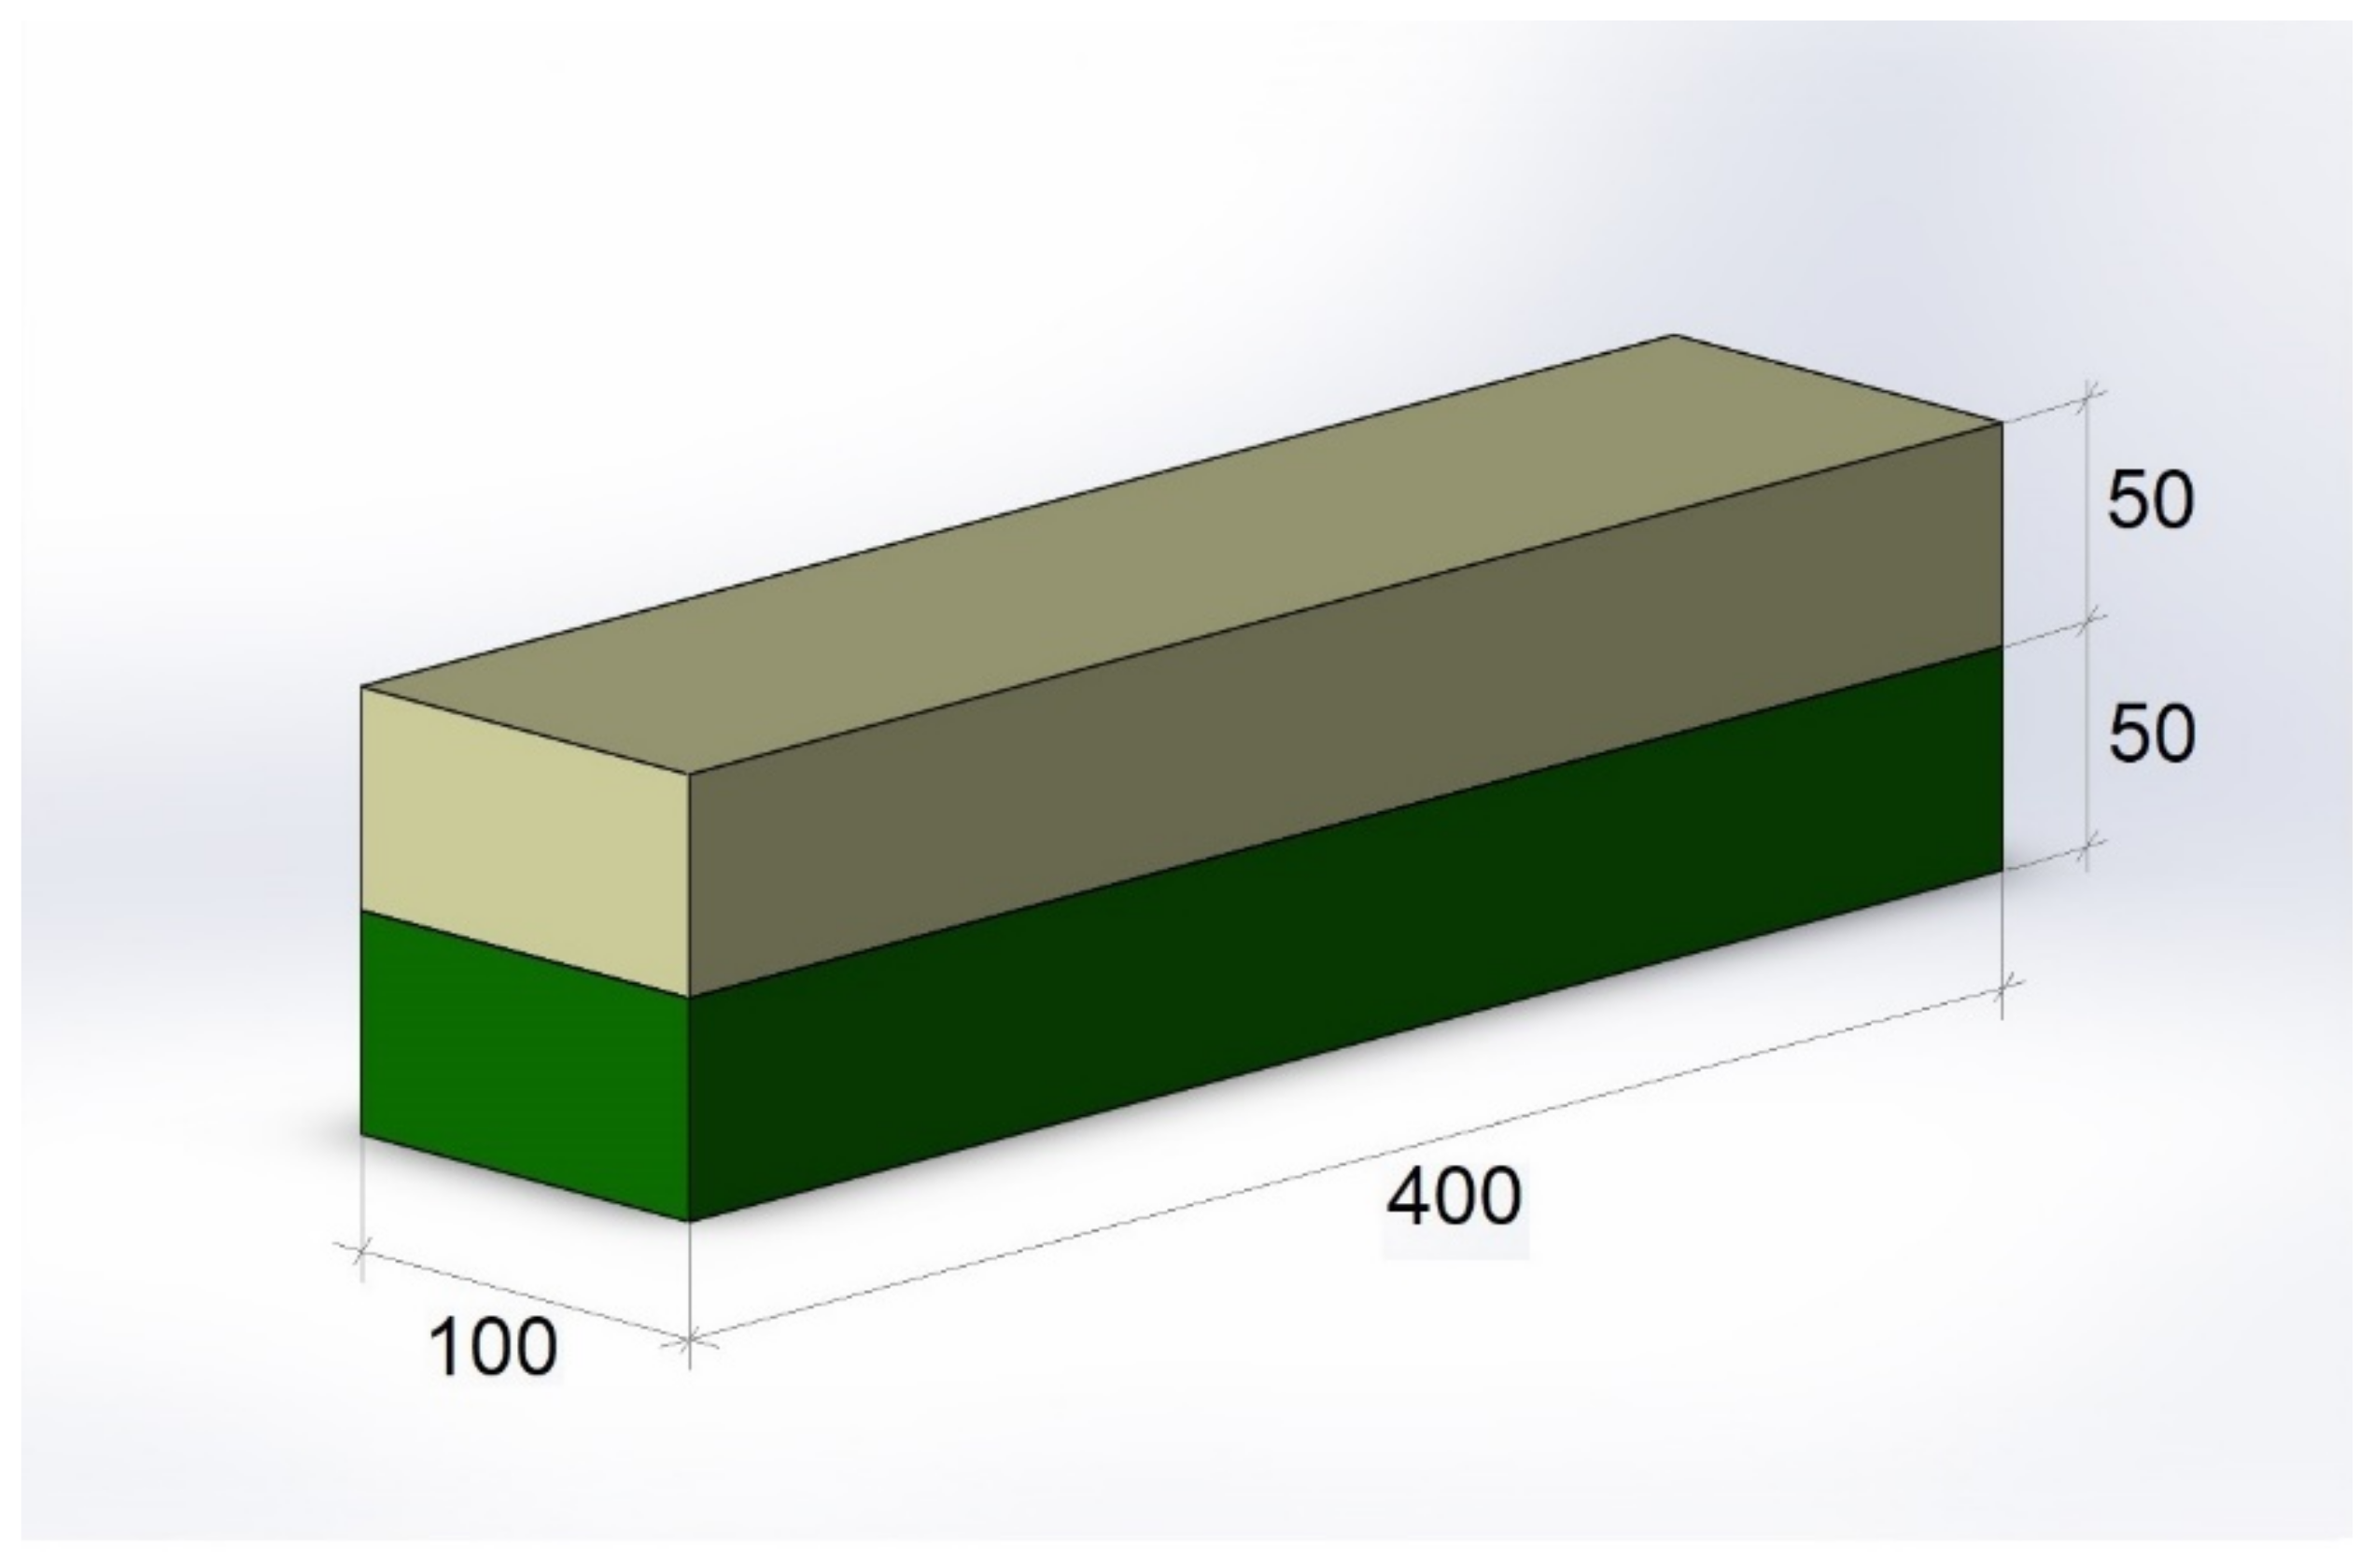
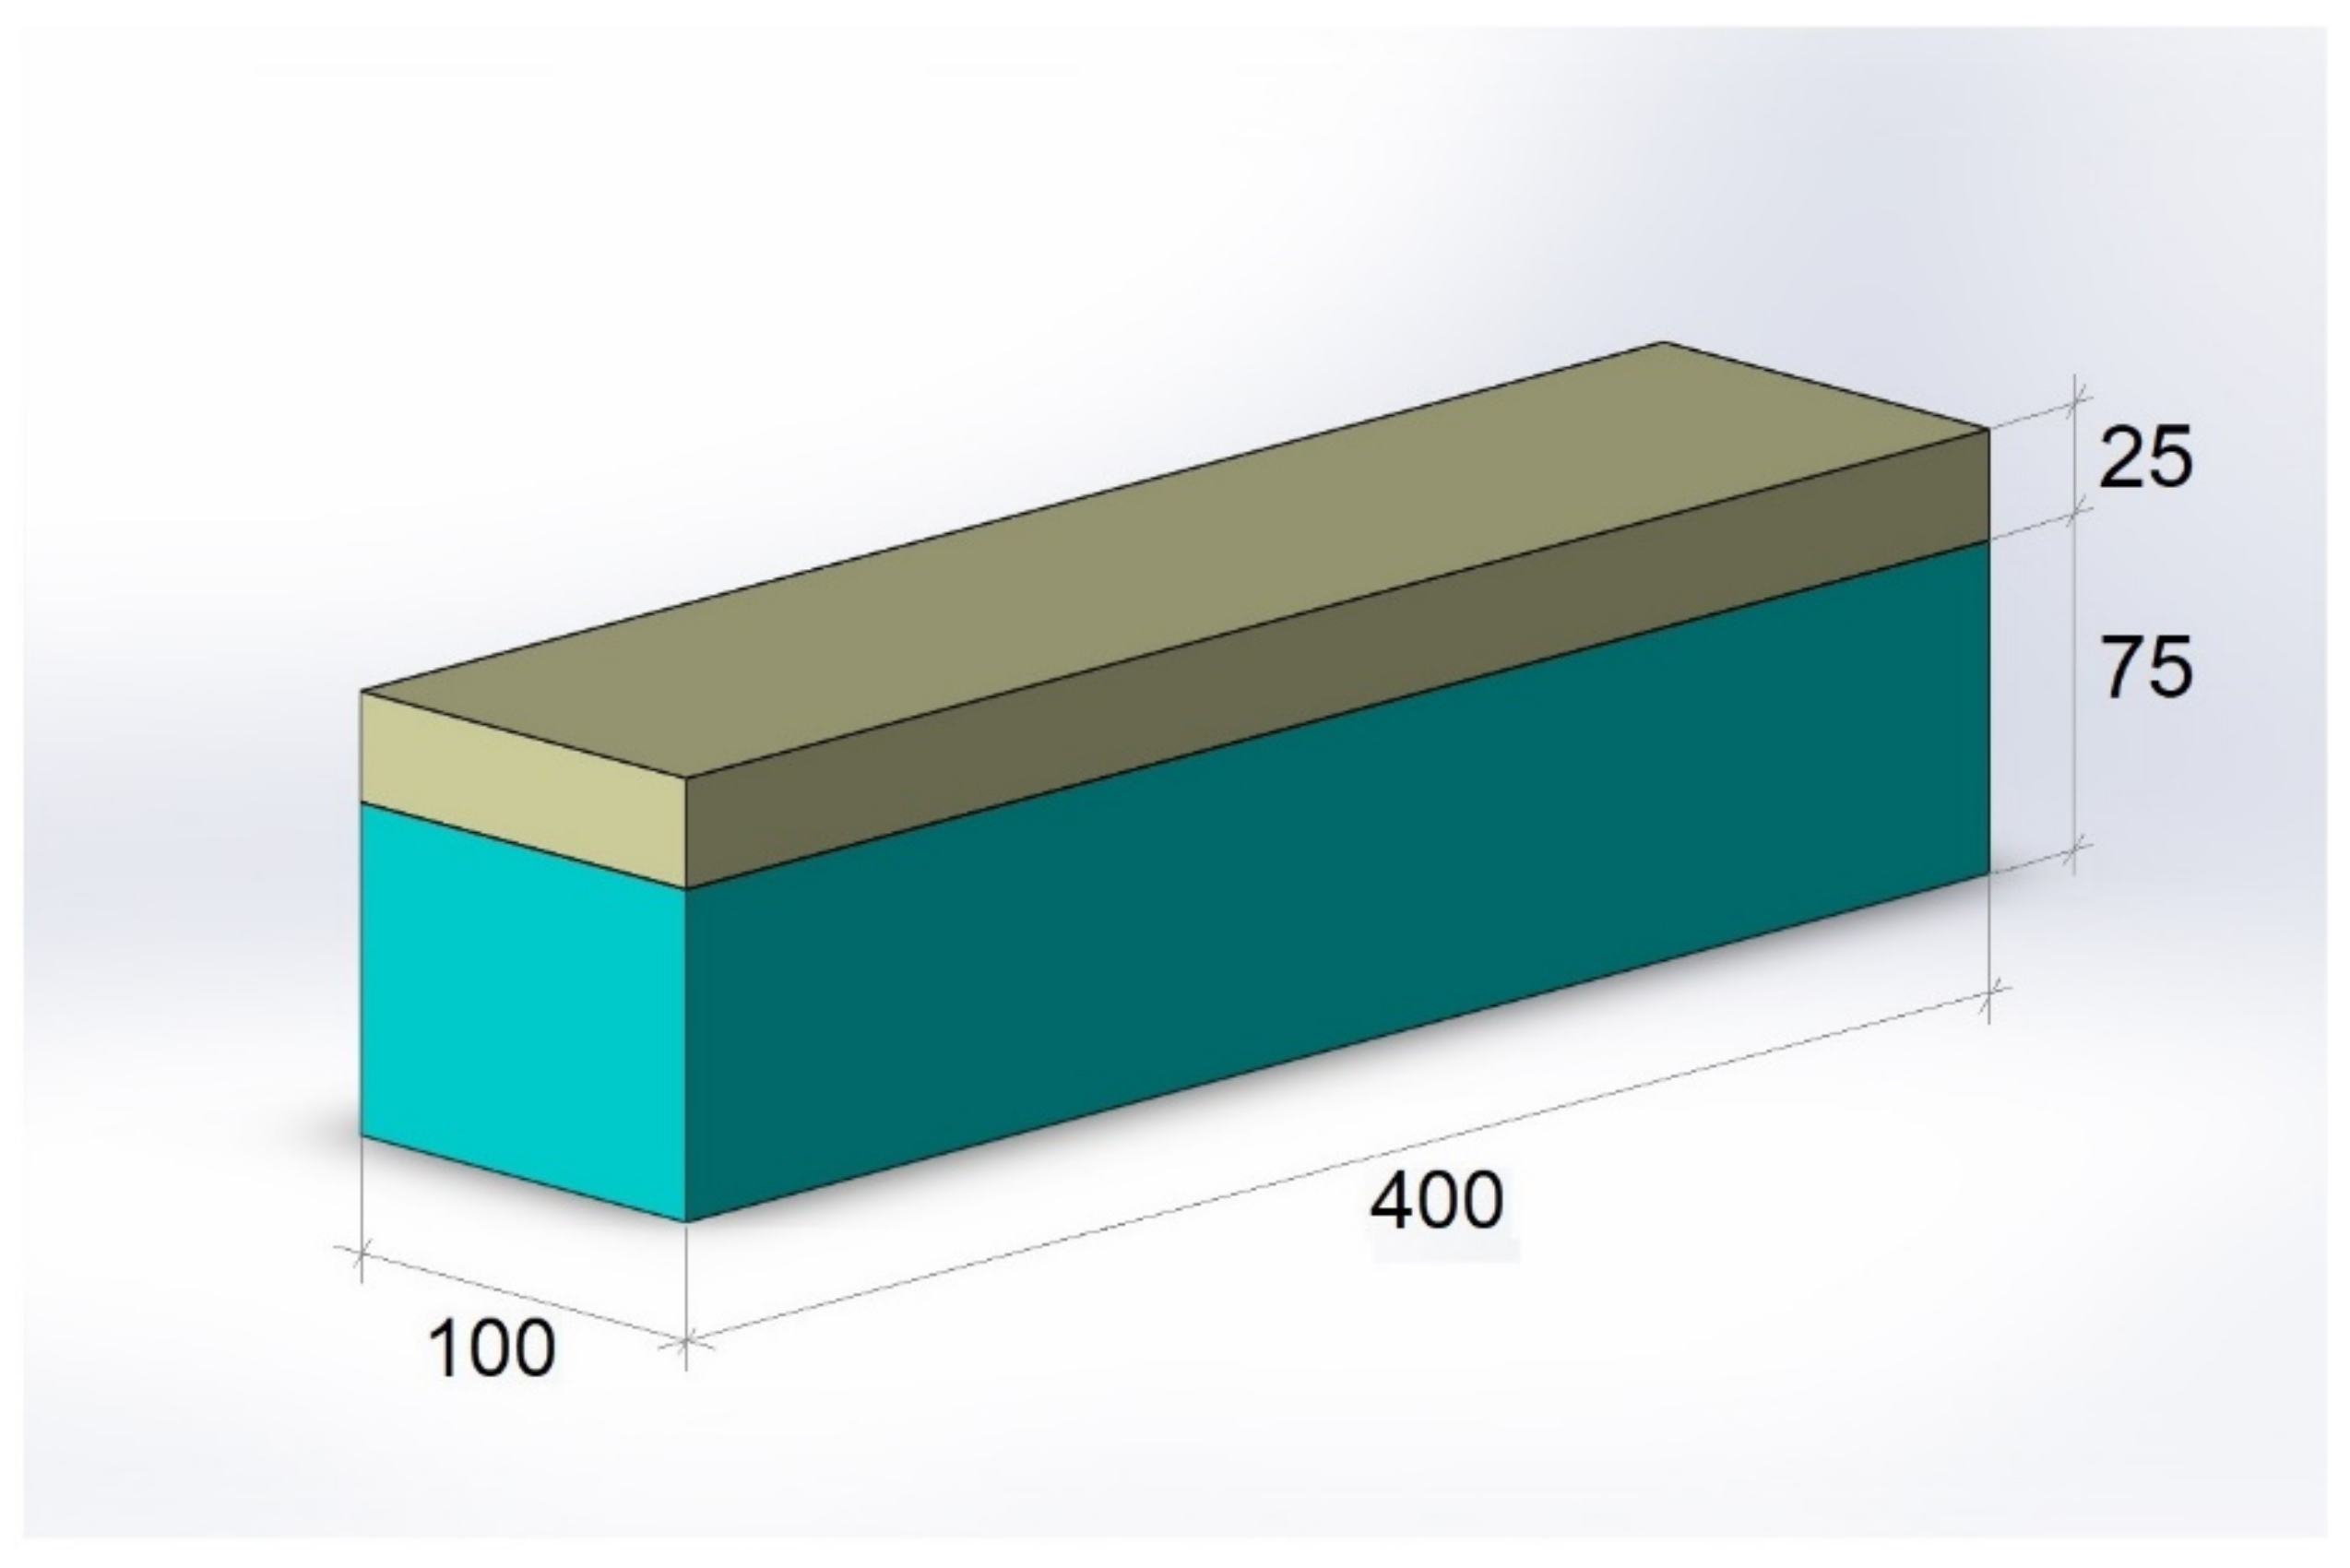
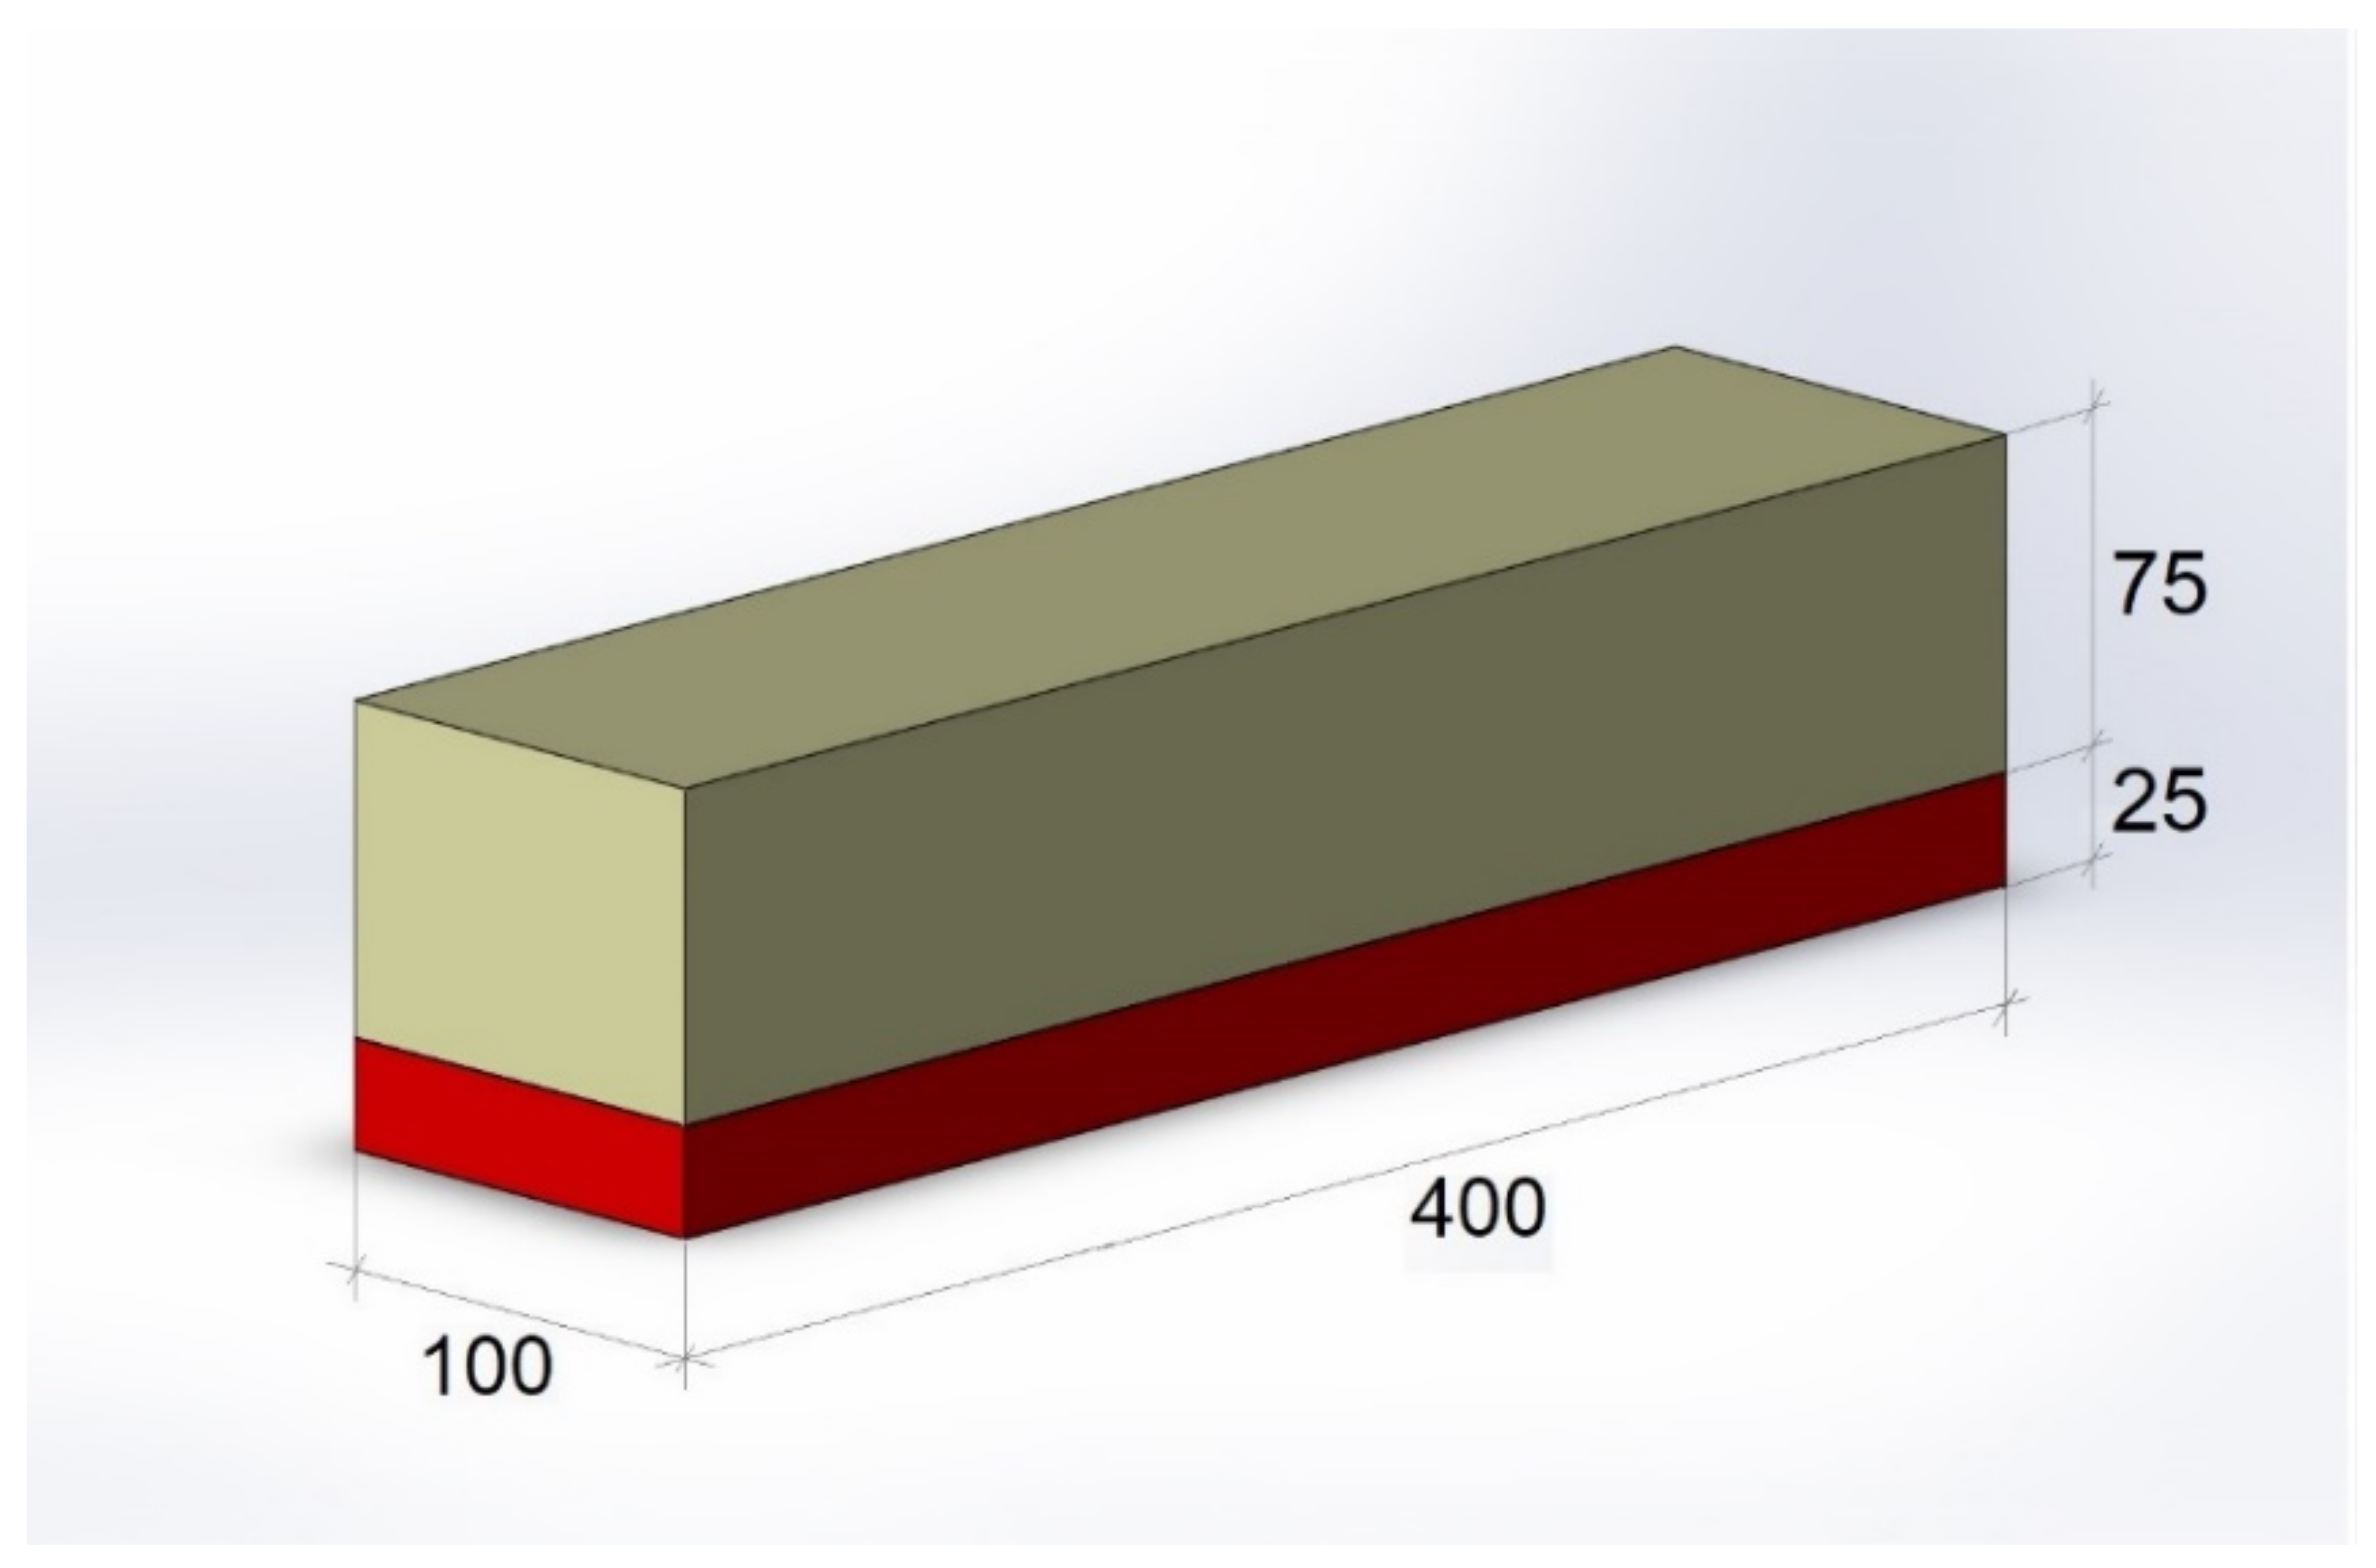
2.5. Specimen Preparation, Fiber Distribution and Concentration in the Layers of SFRC Prisms


3. Mechanical Testing Methods
3.1. Description of Specimen Testing
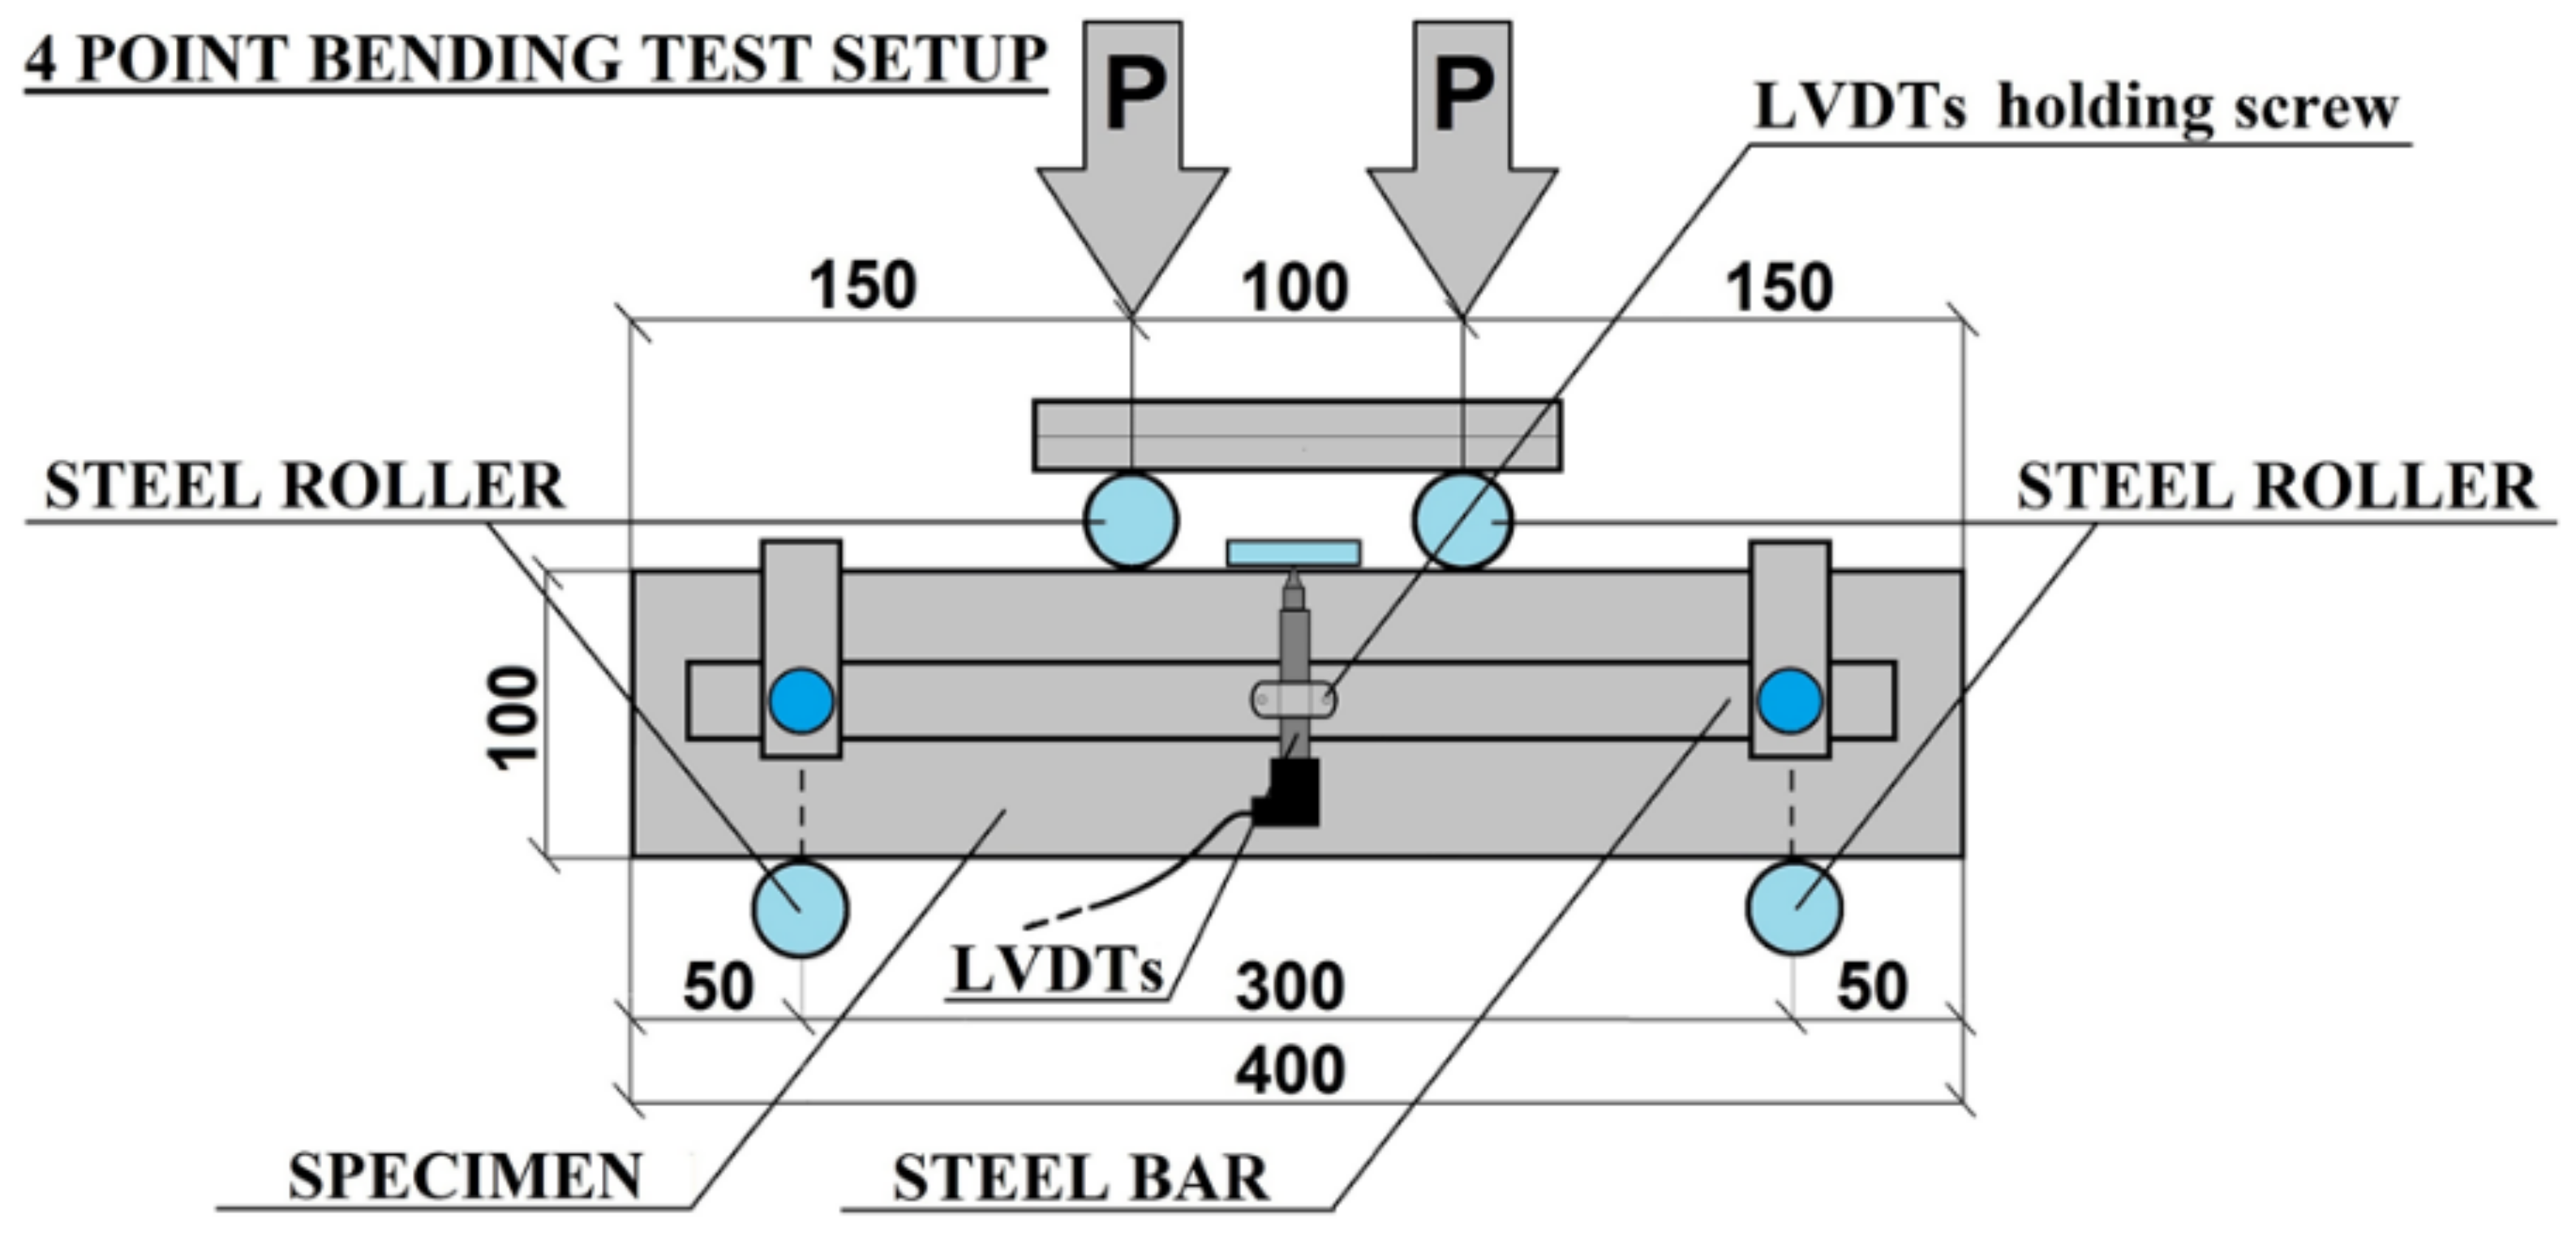
3.2. Mechanical Testing. 4PBT Procedure
4. Experimental Results and Discussion
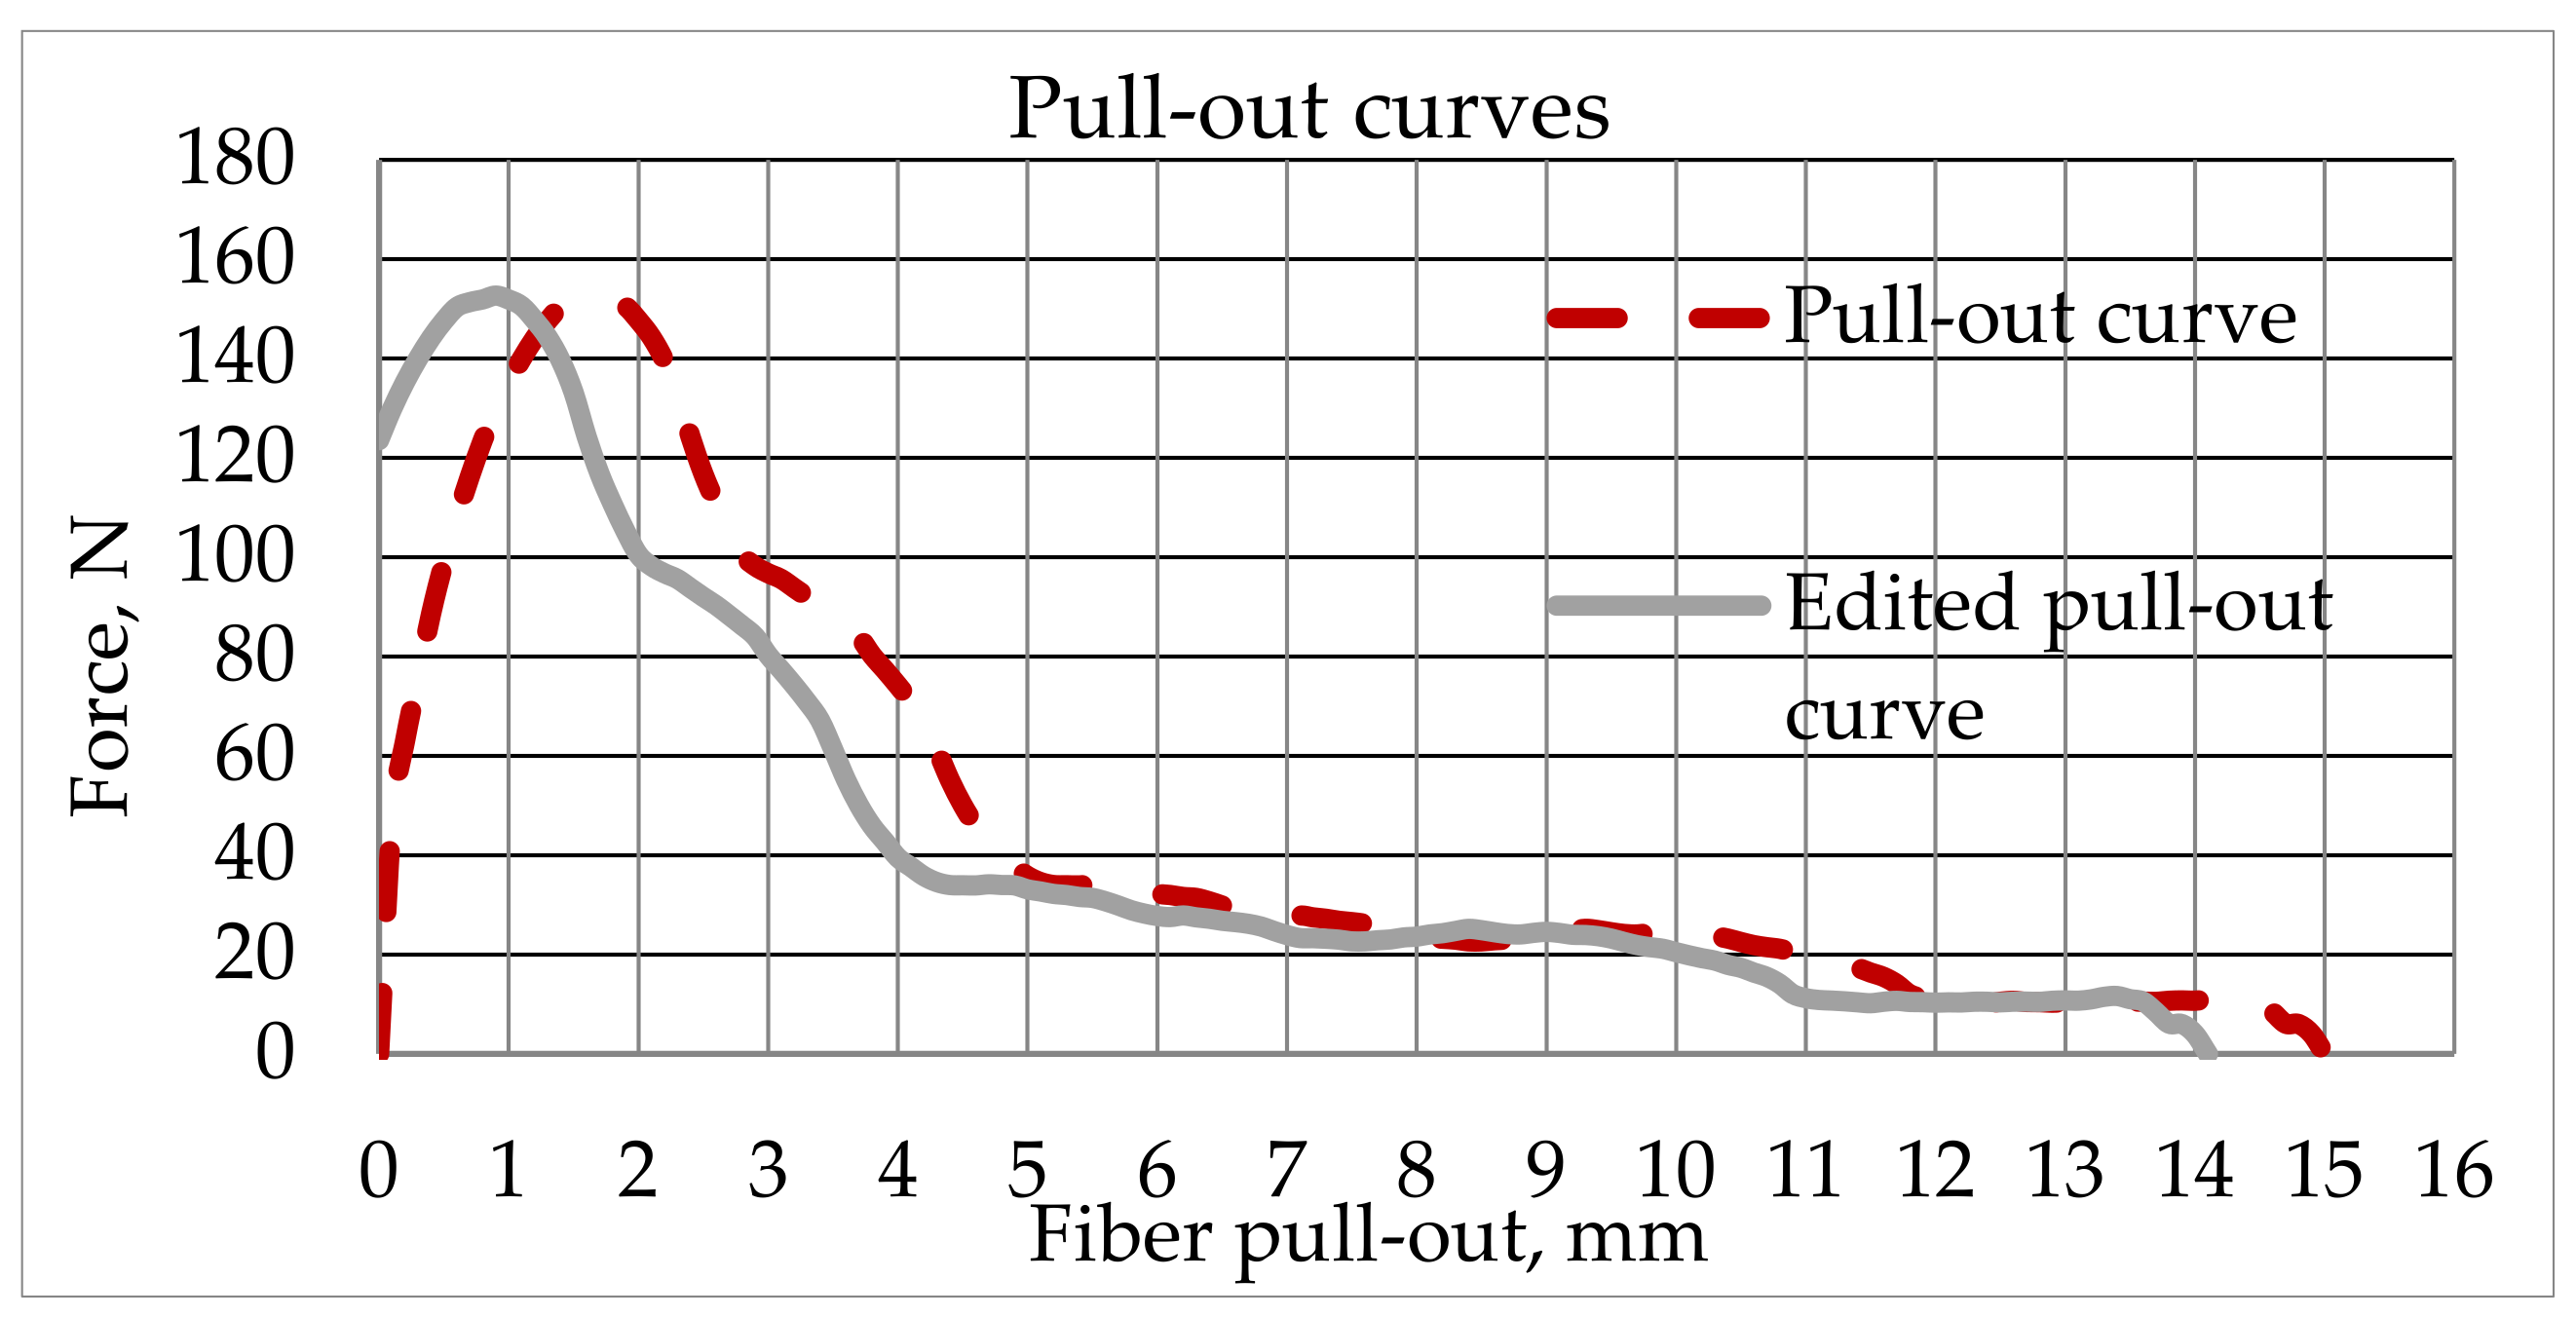
4.1. Fibers Pull-Out Process. Experimental Results
4.2. Testing Compressive Strength of the Specimens
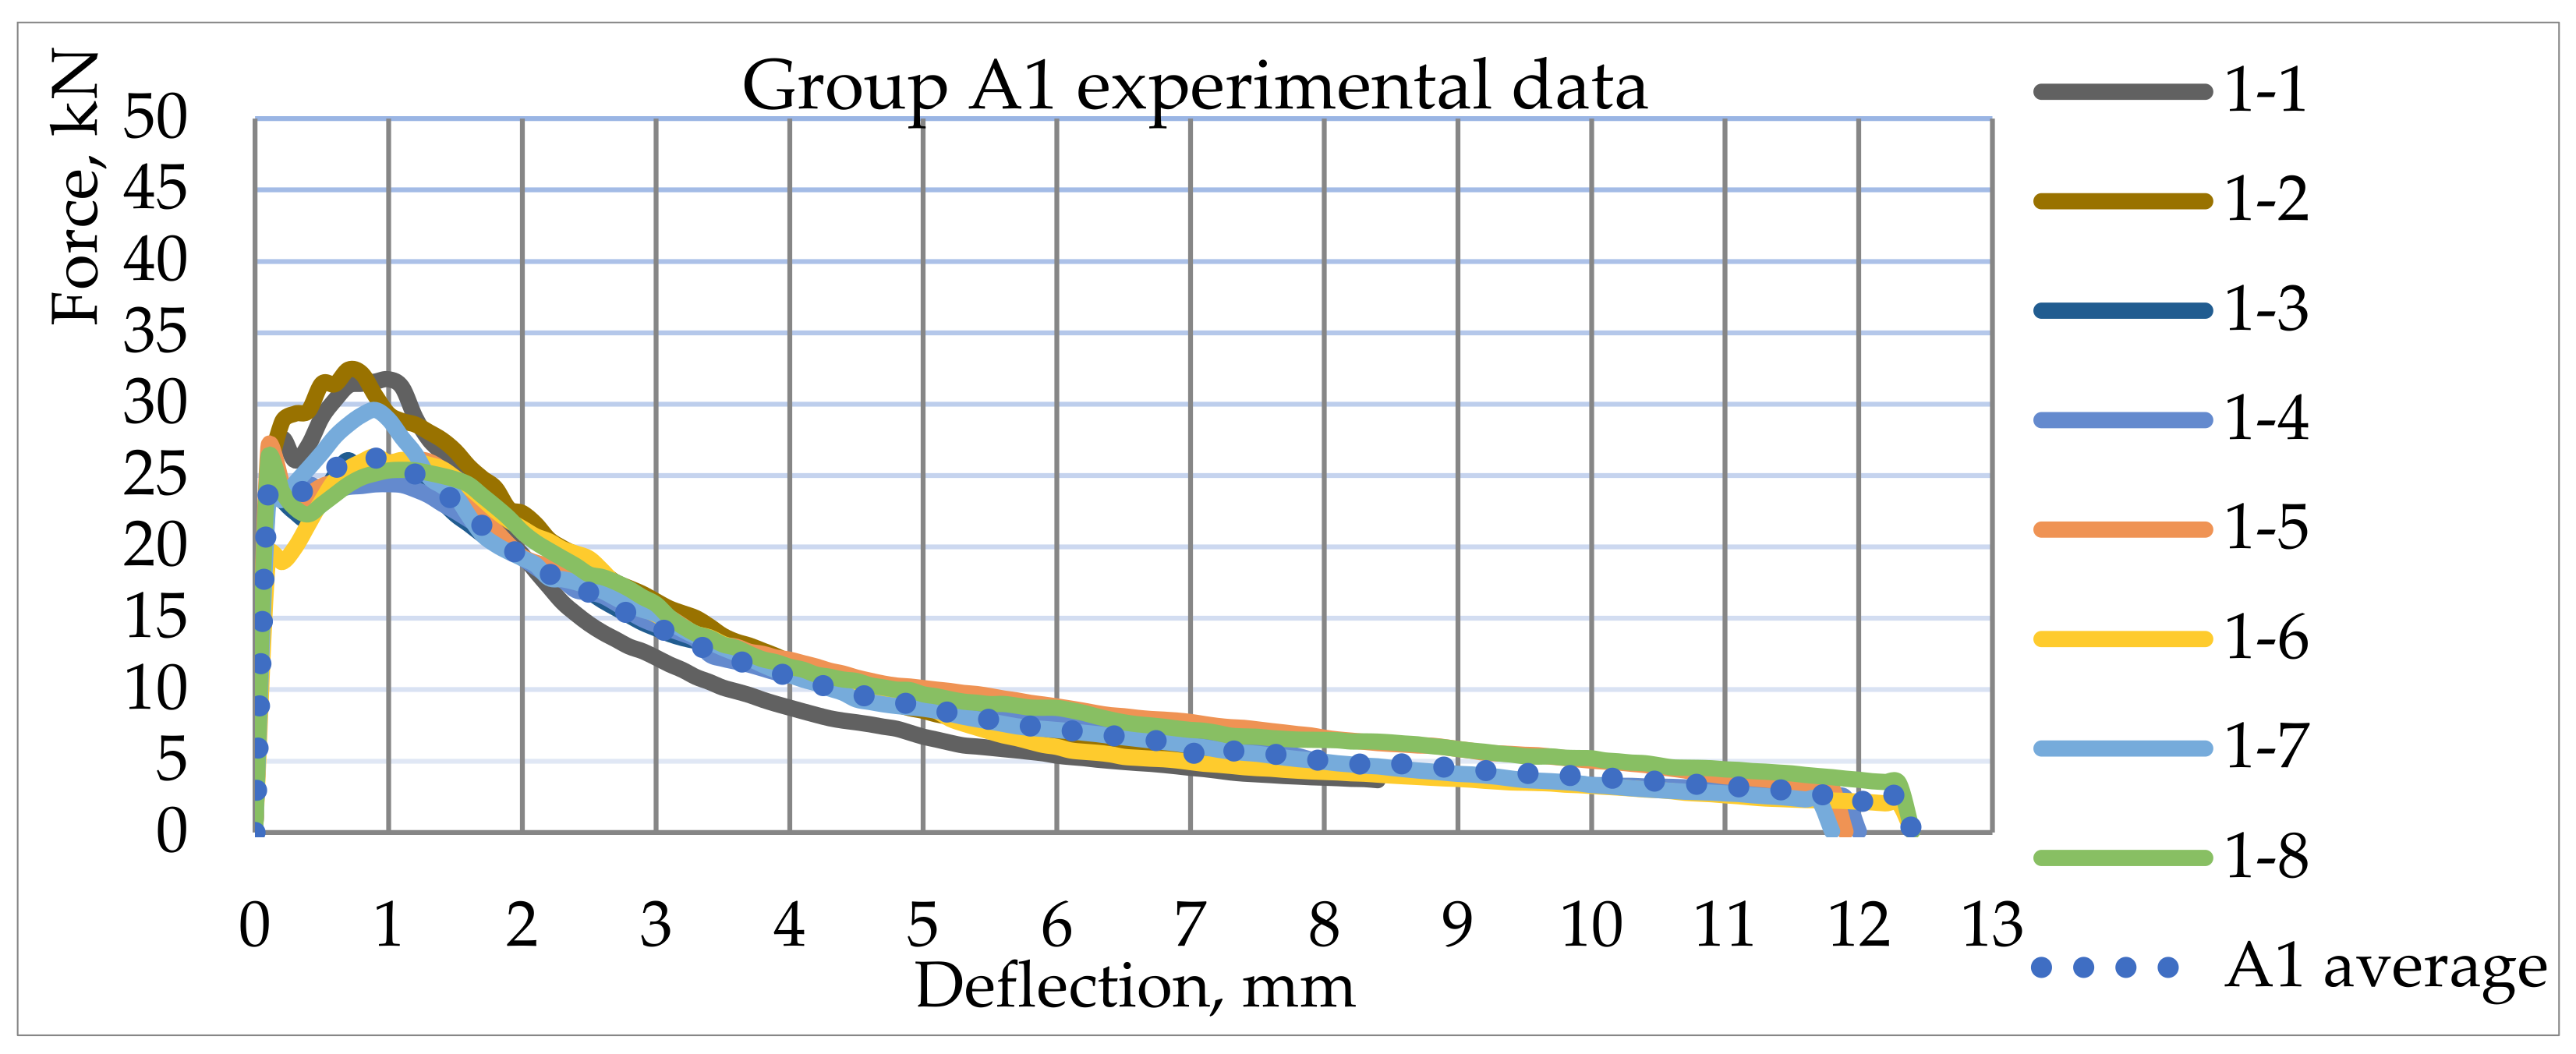
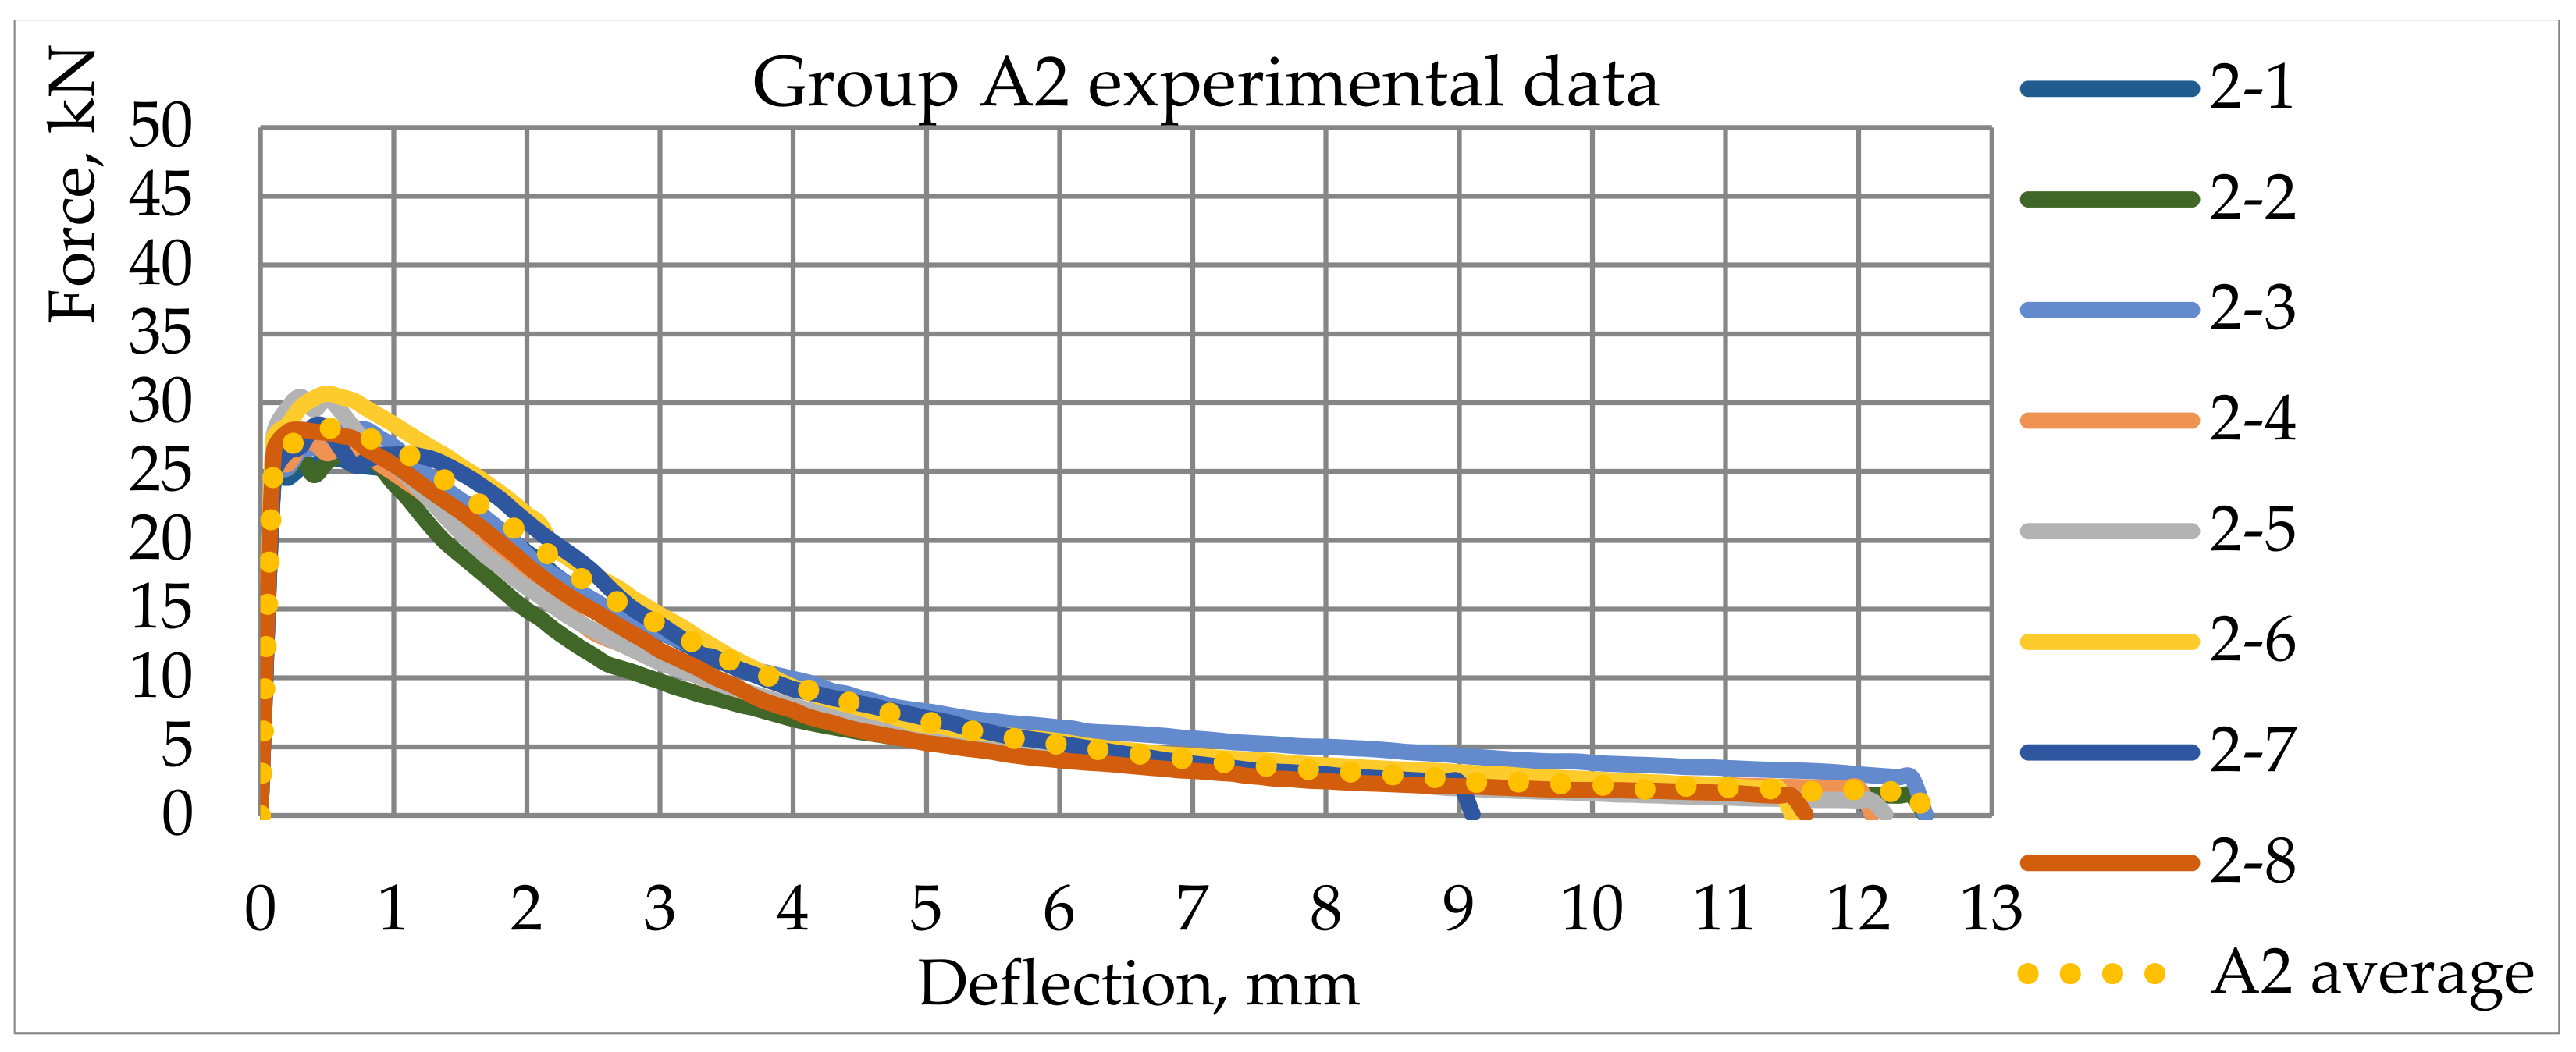
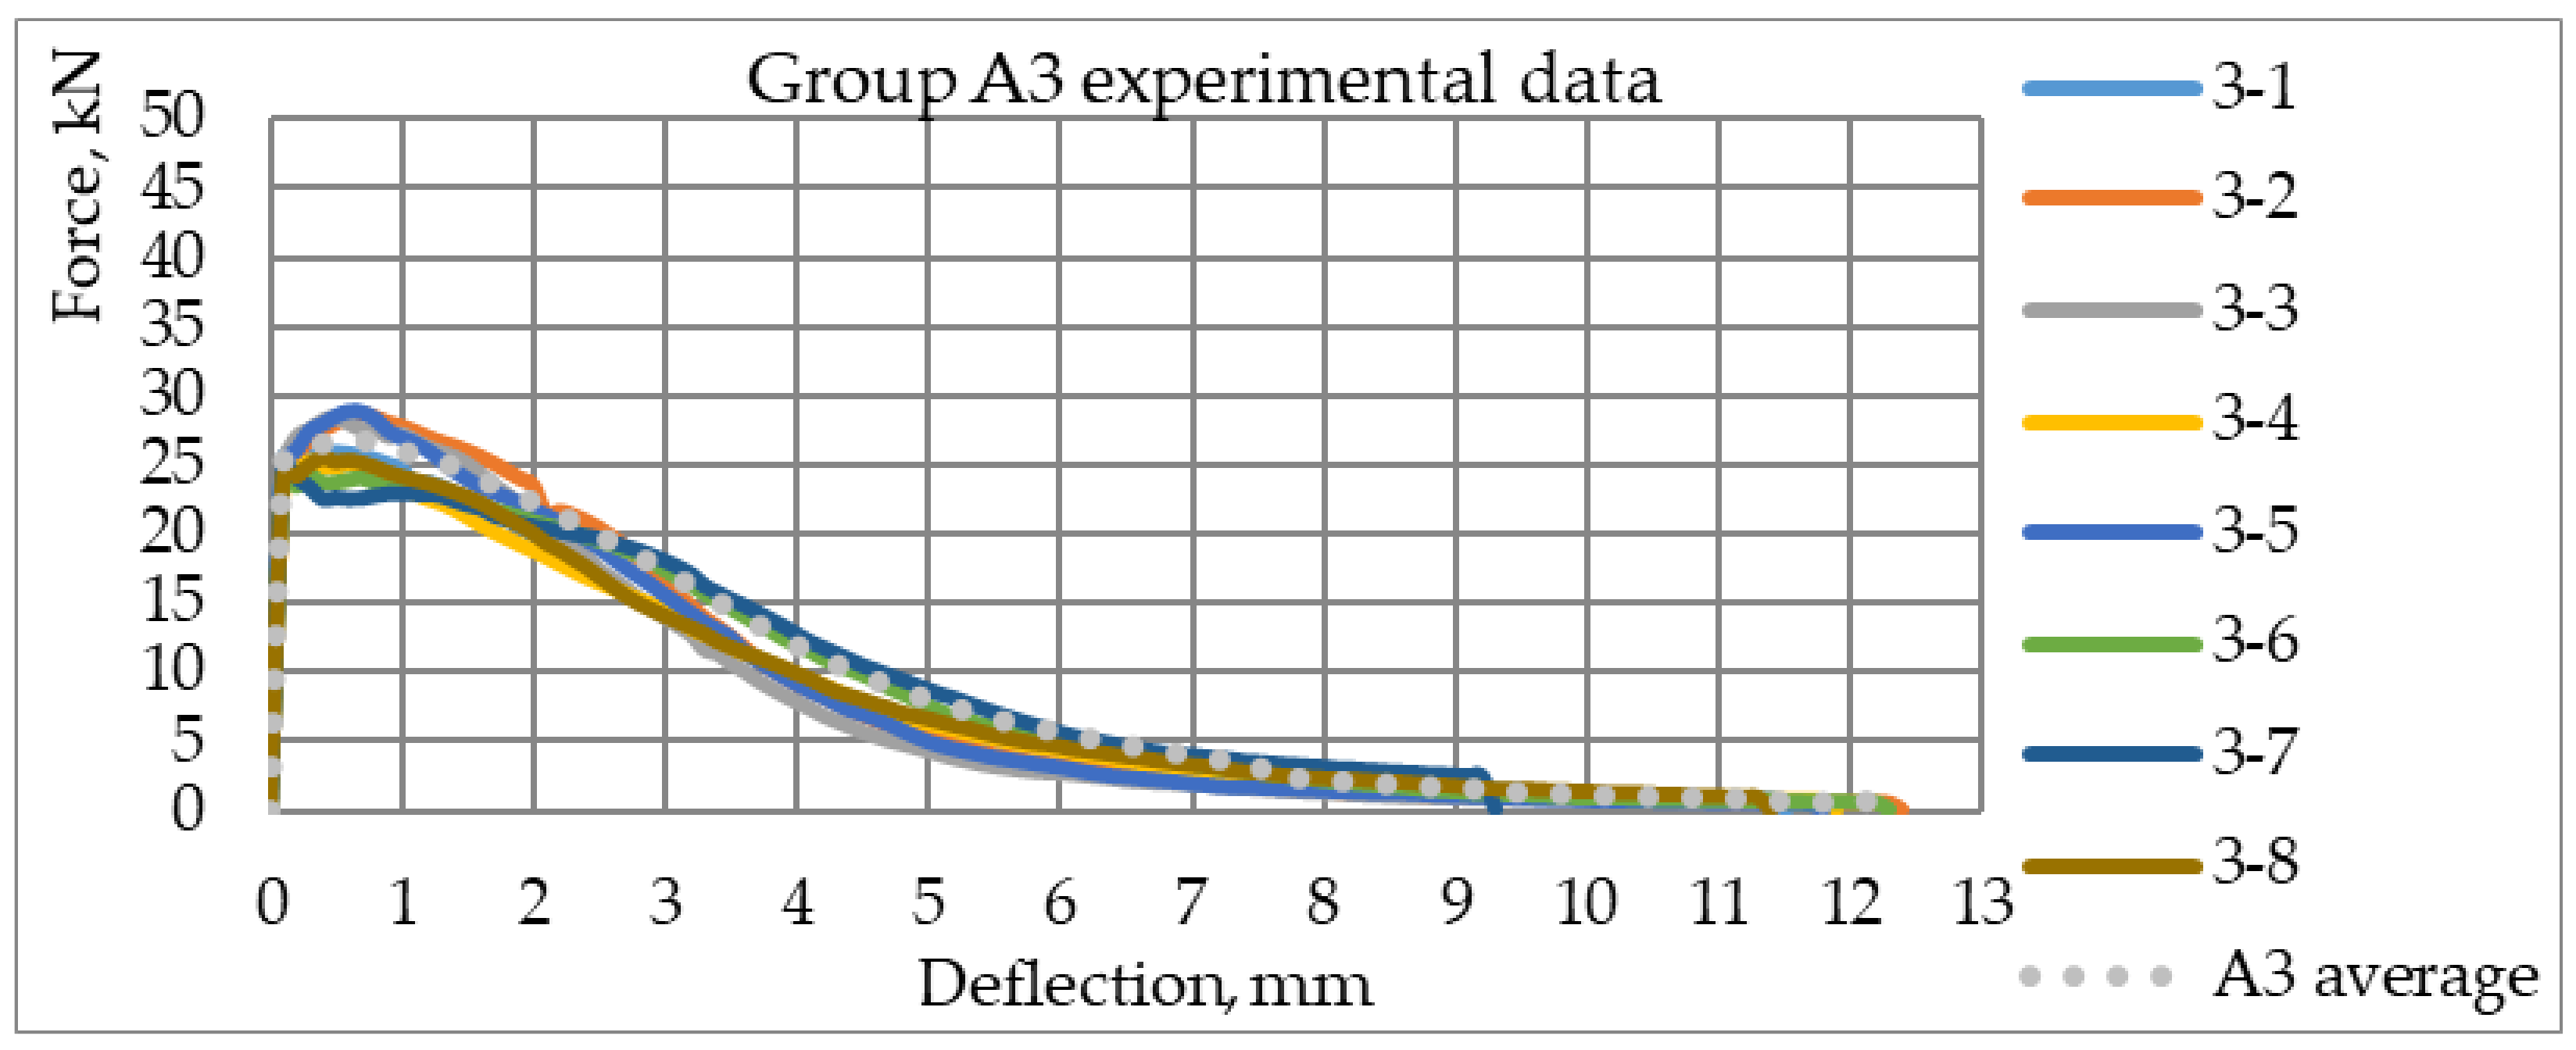
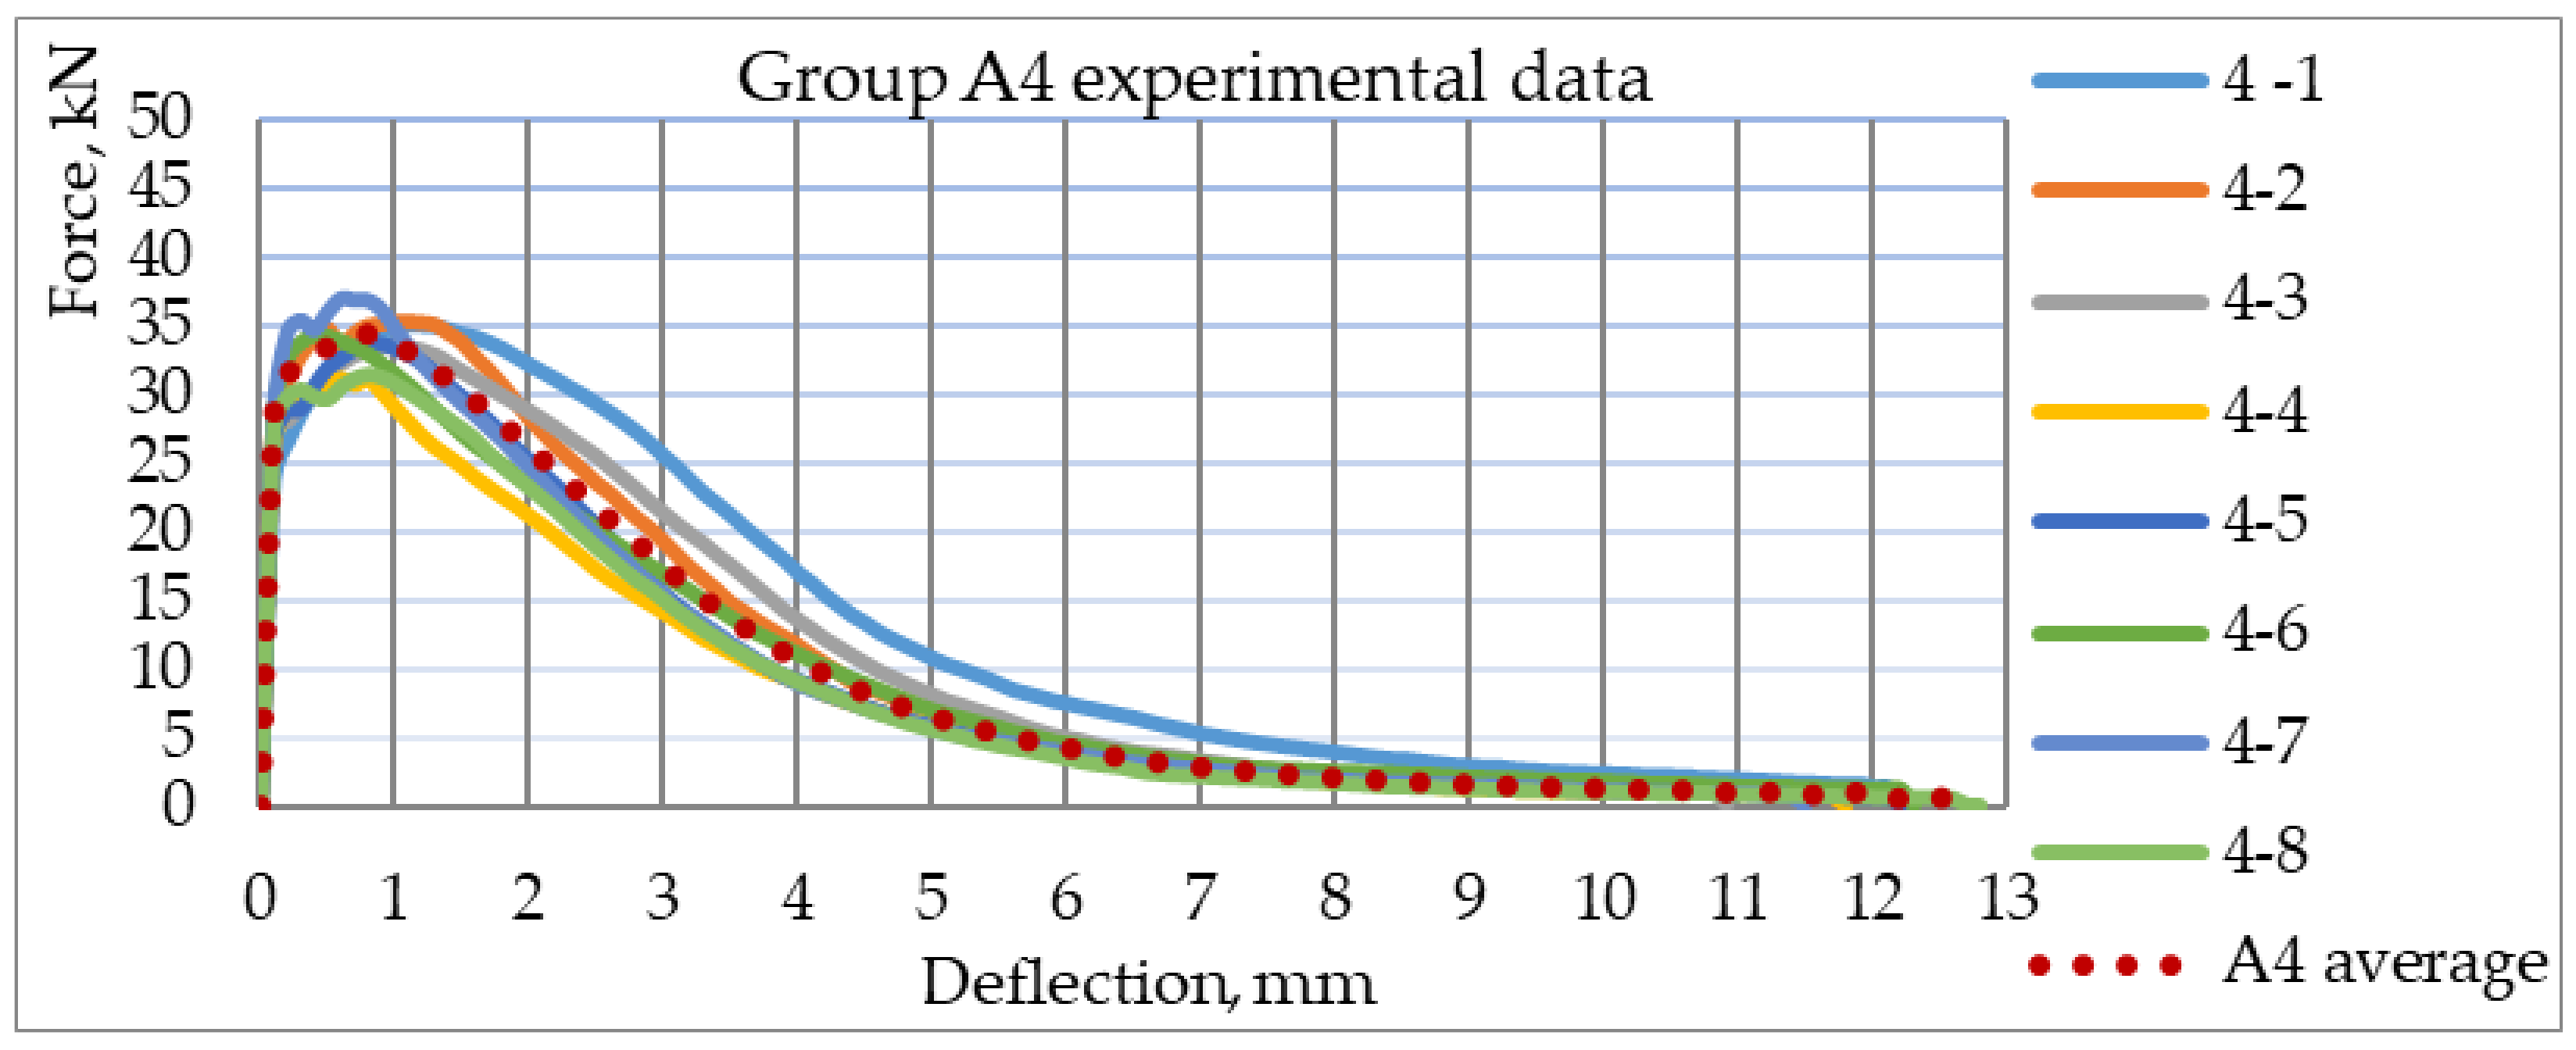
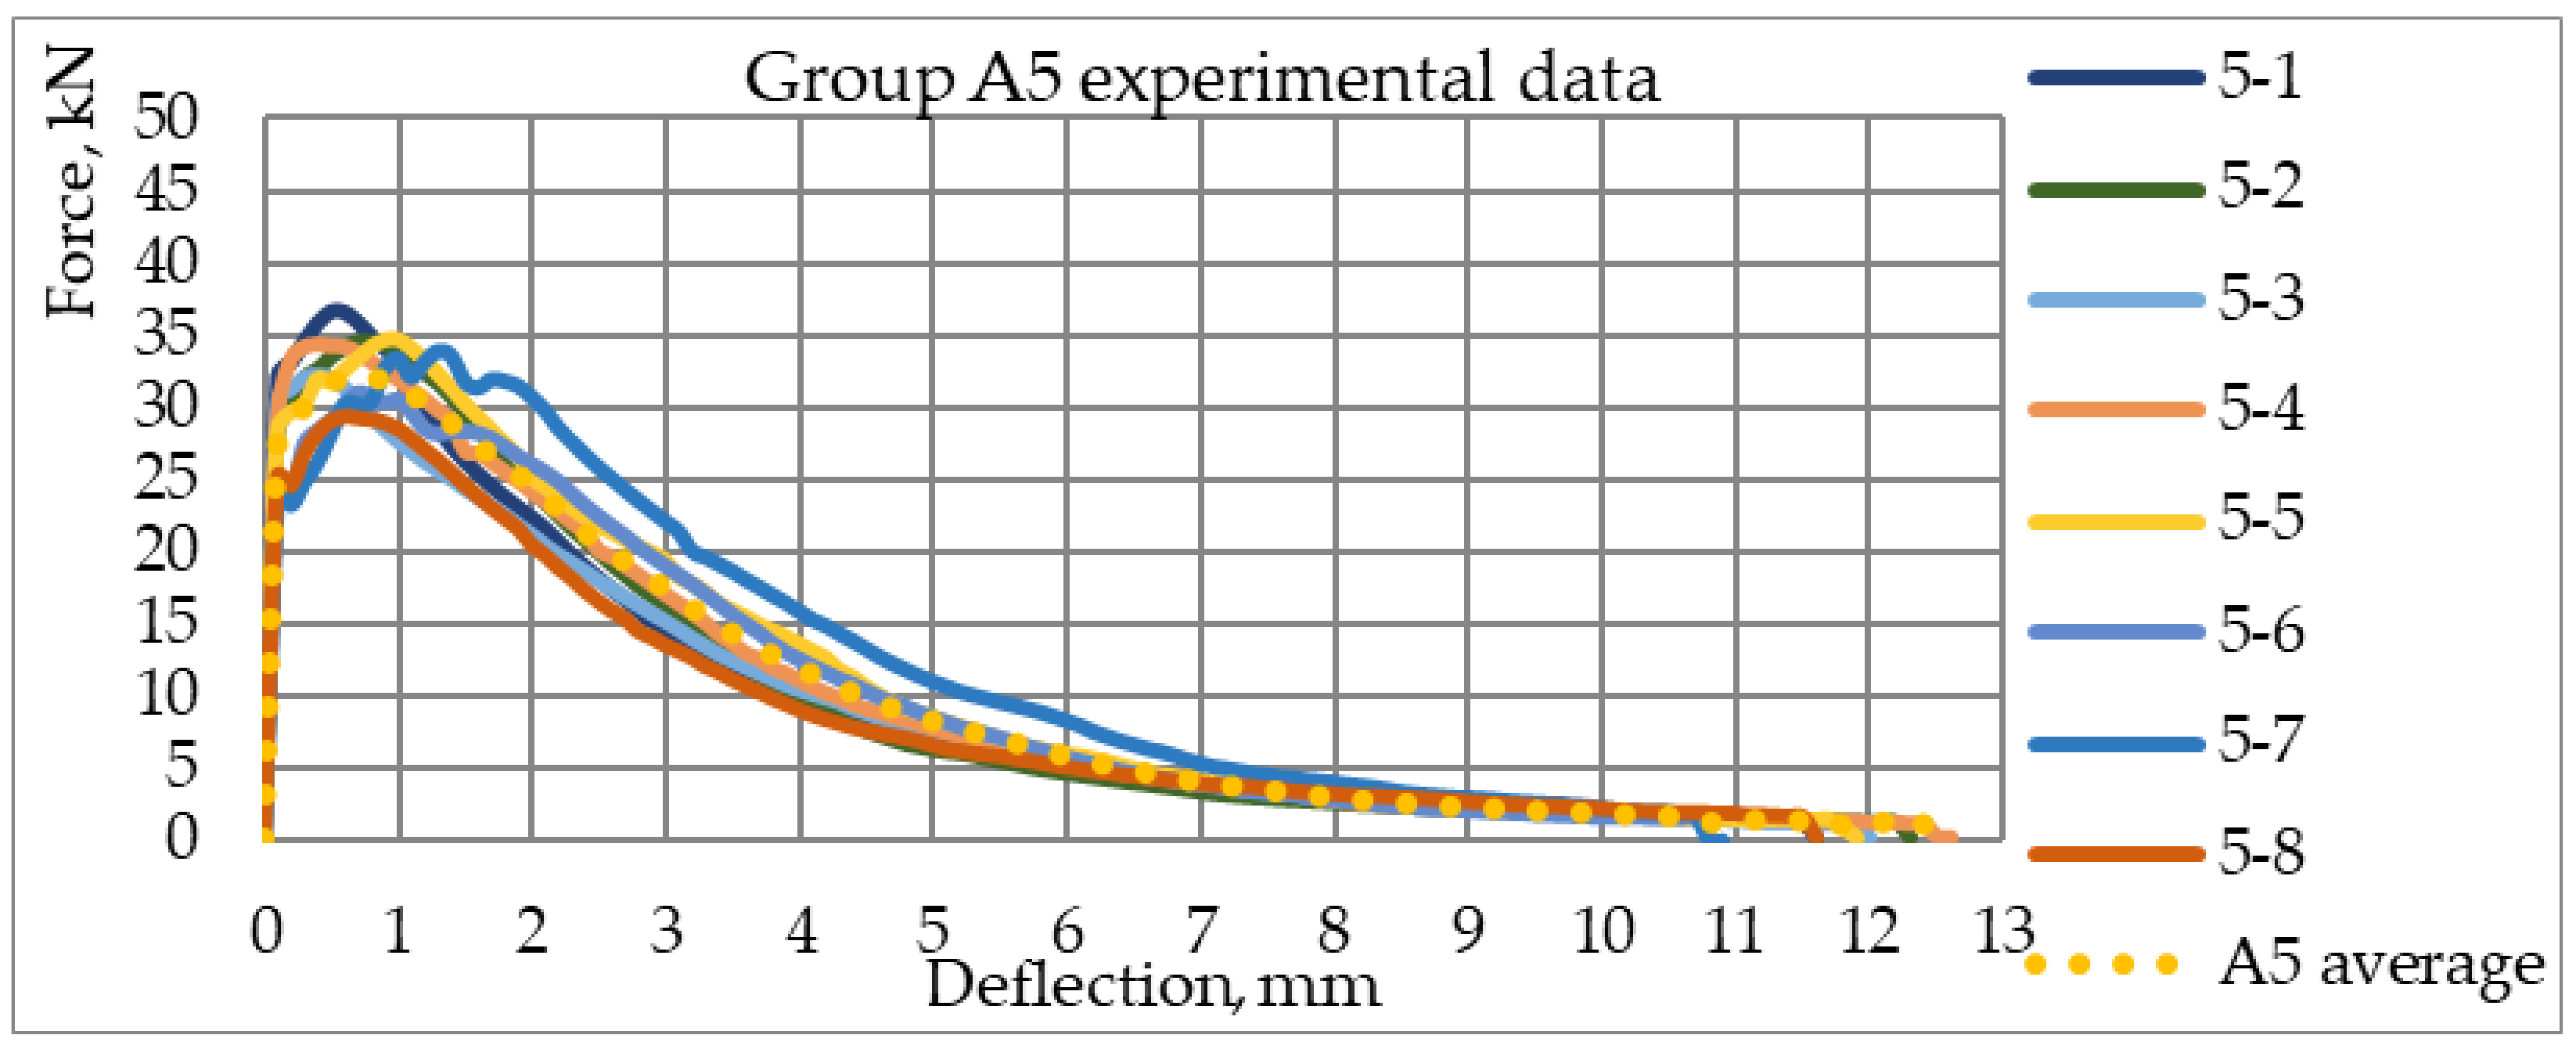
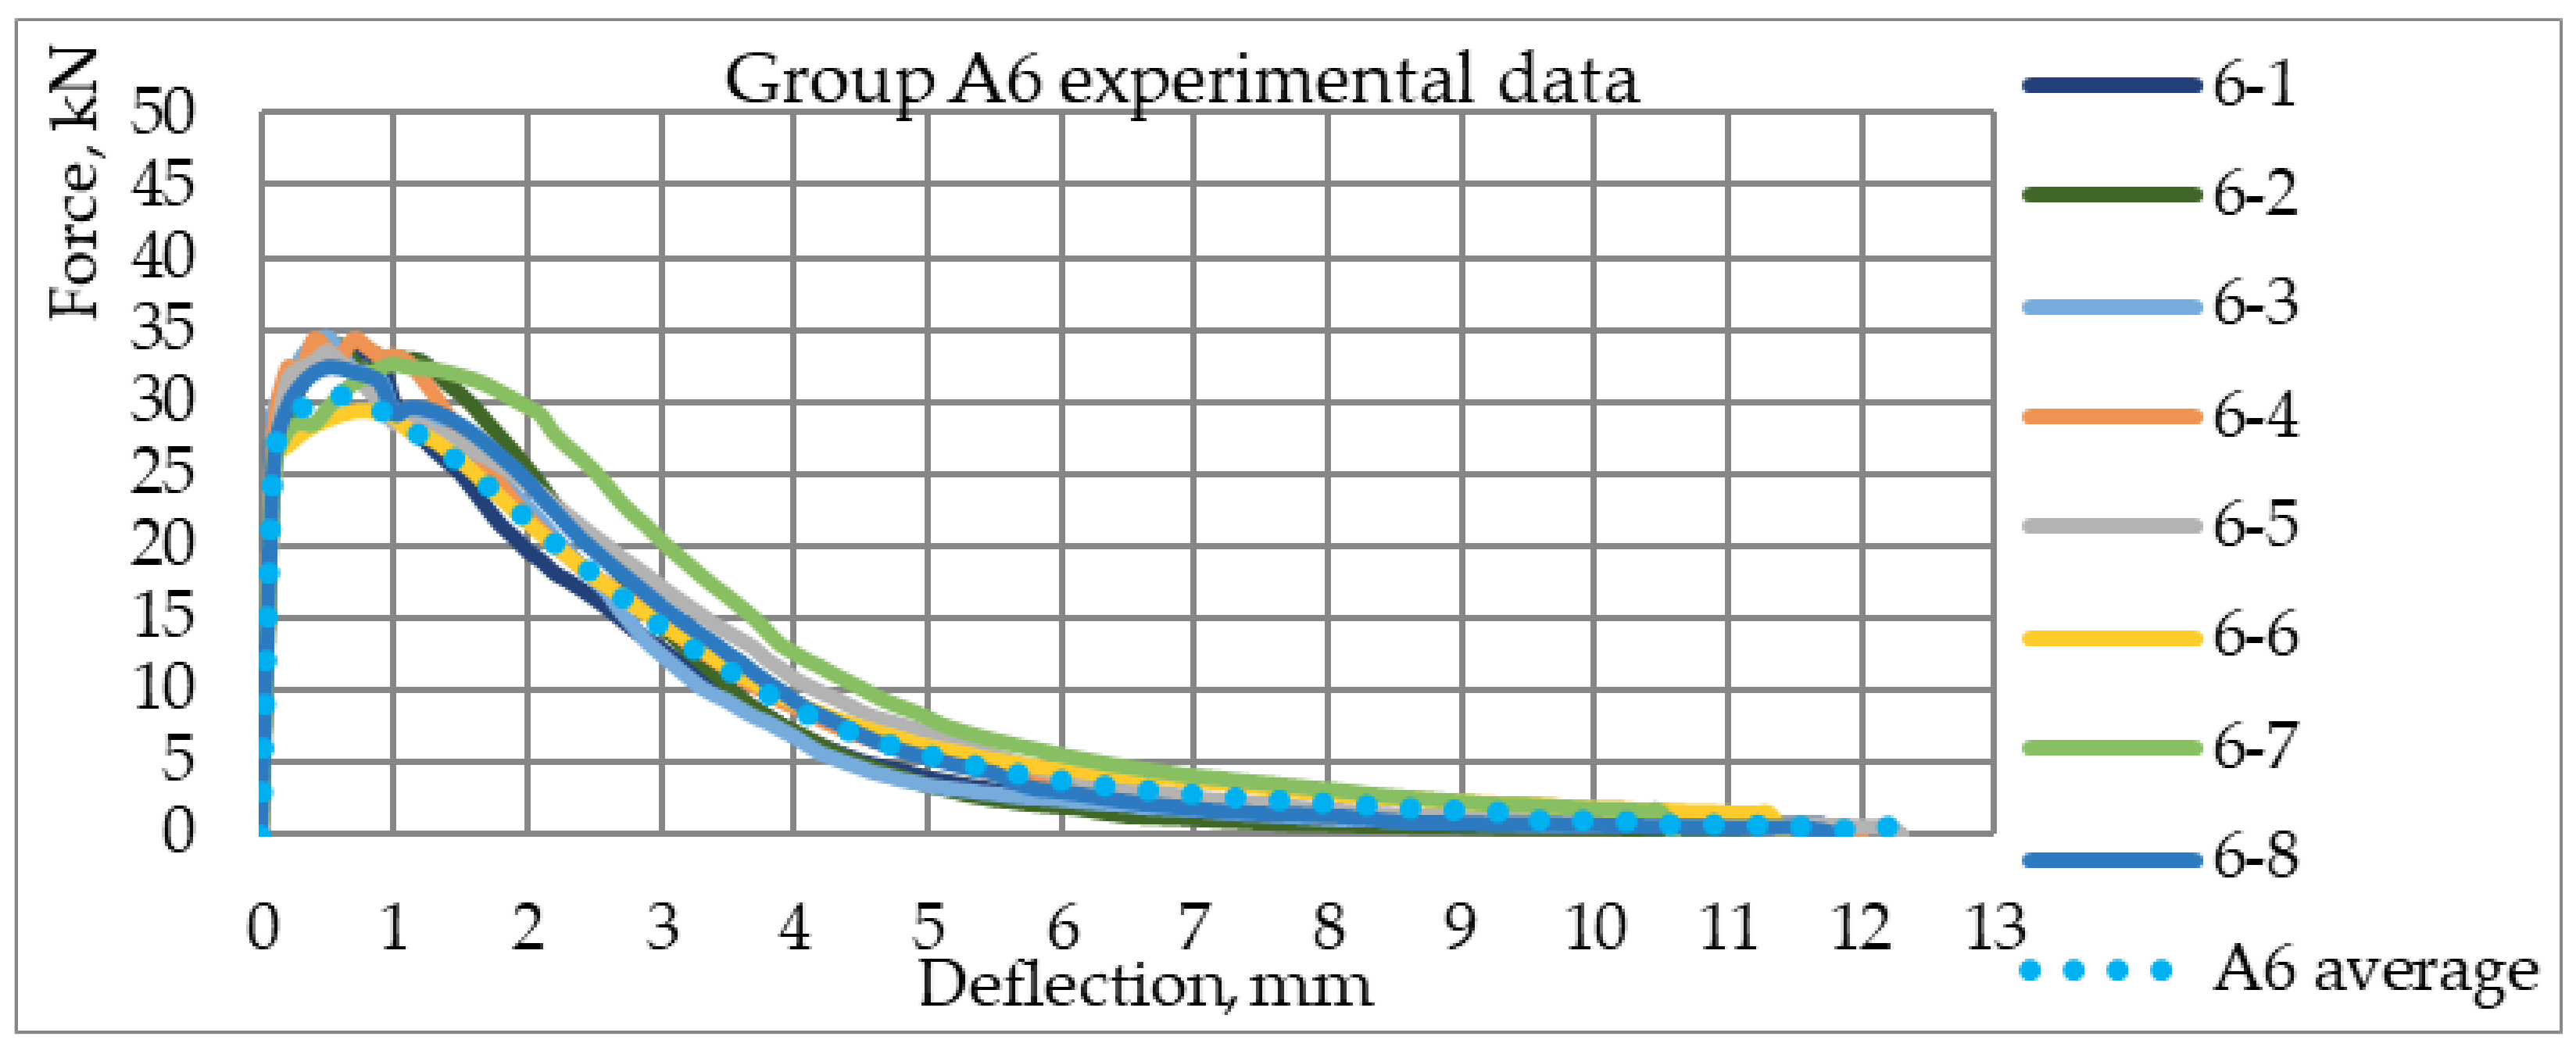
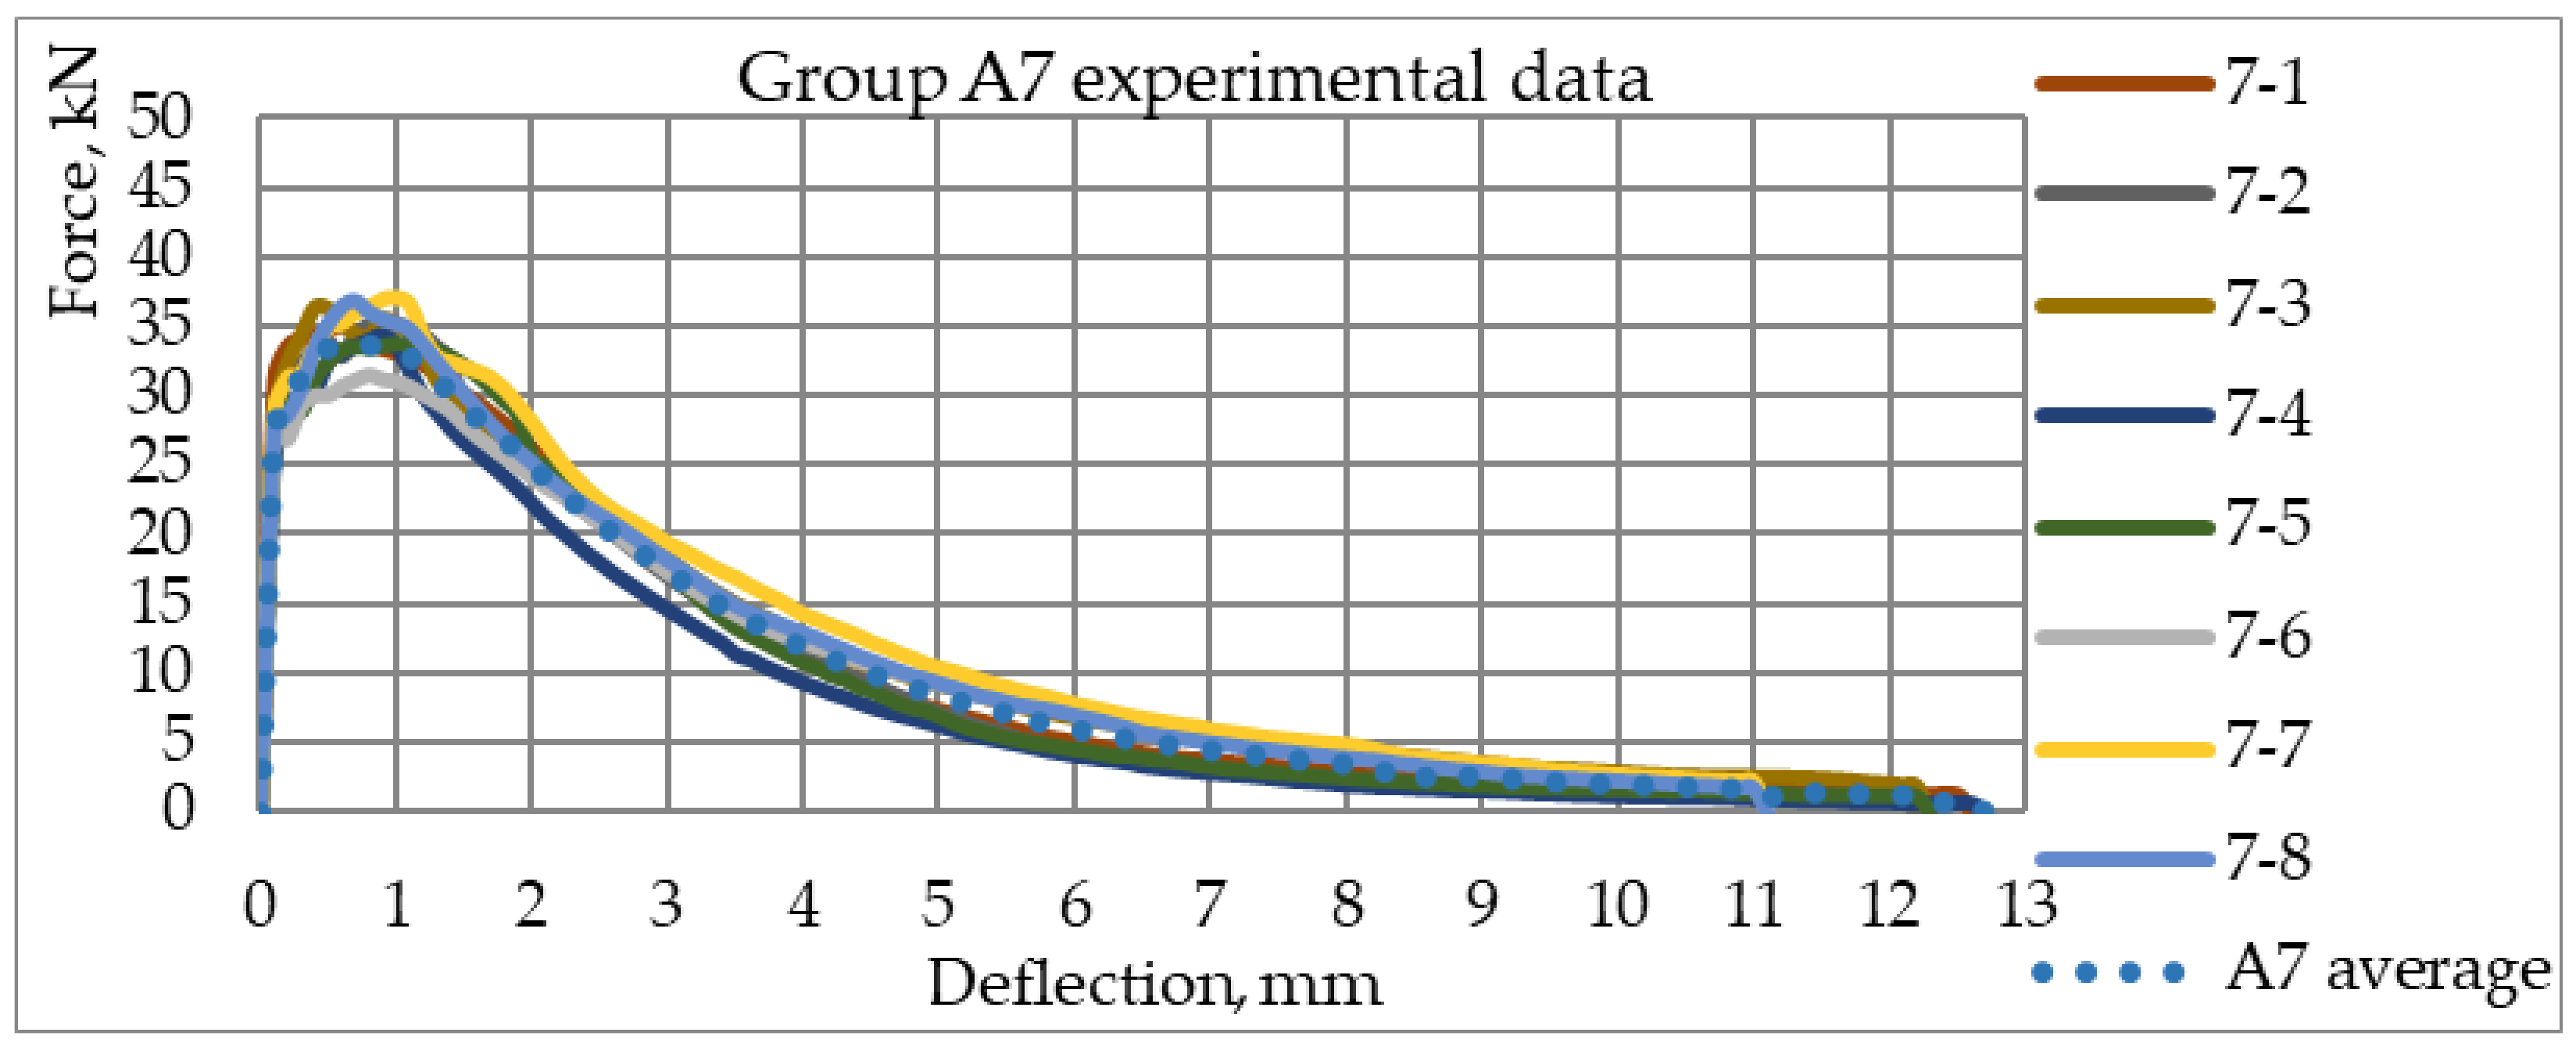
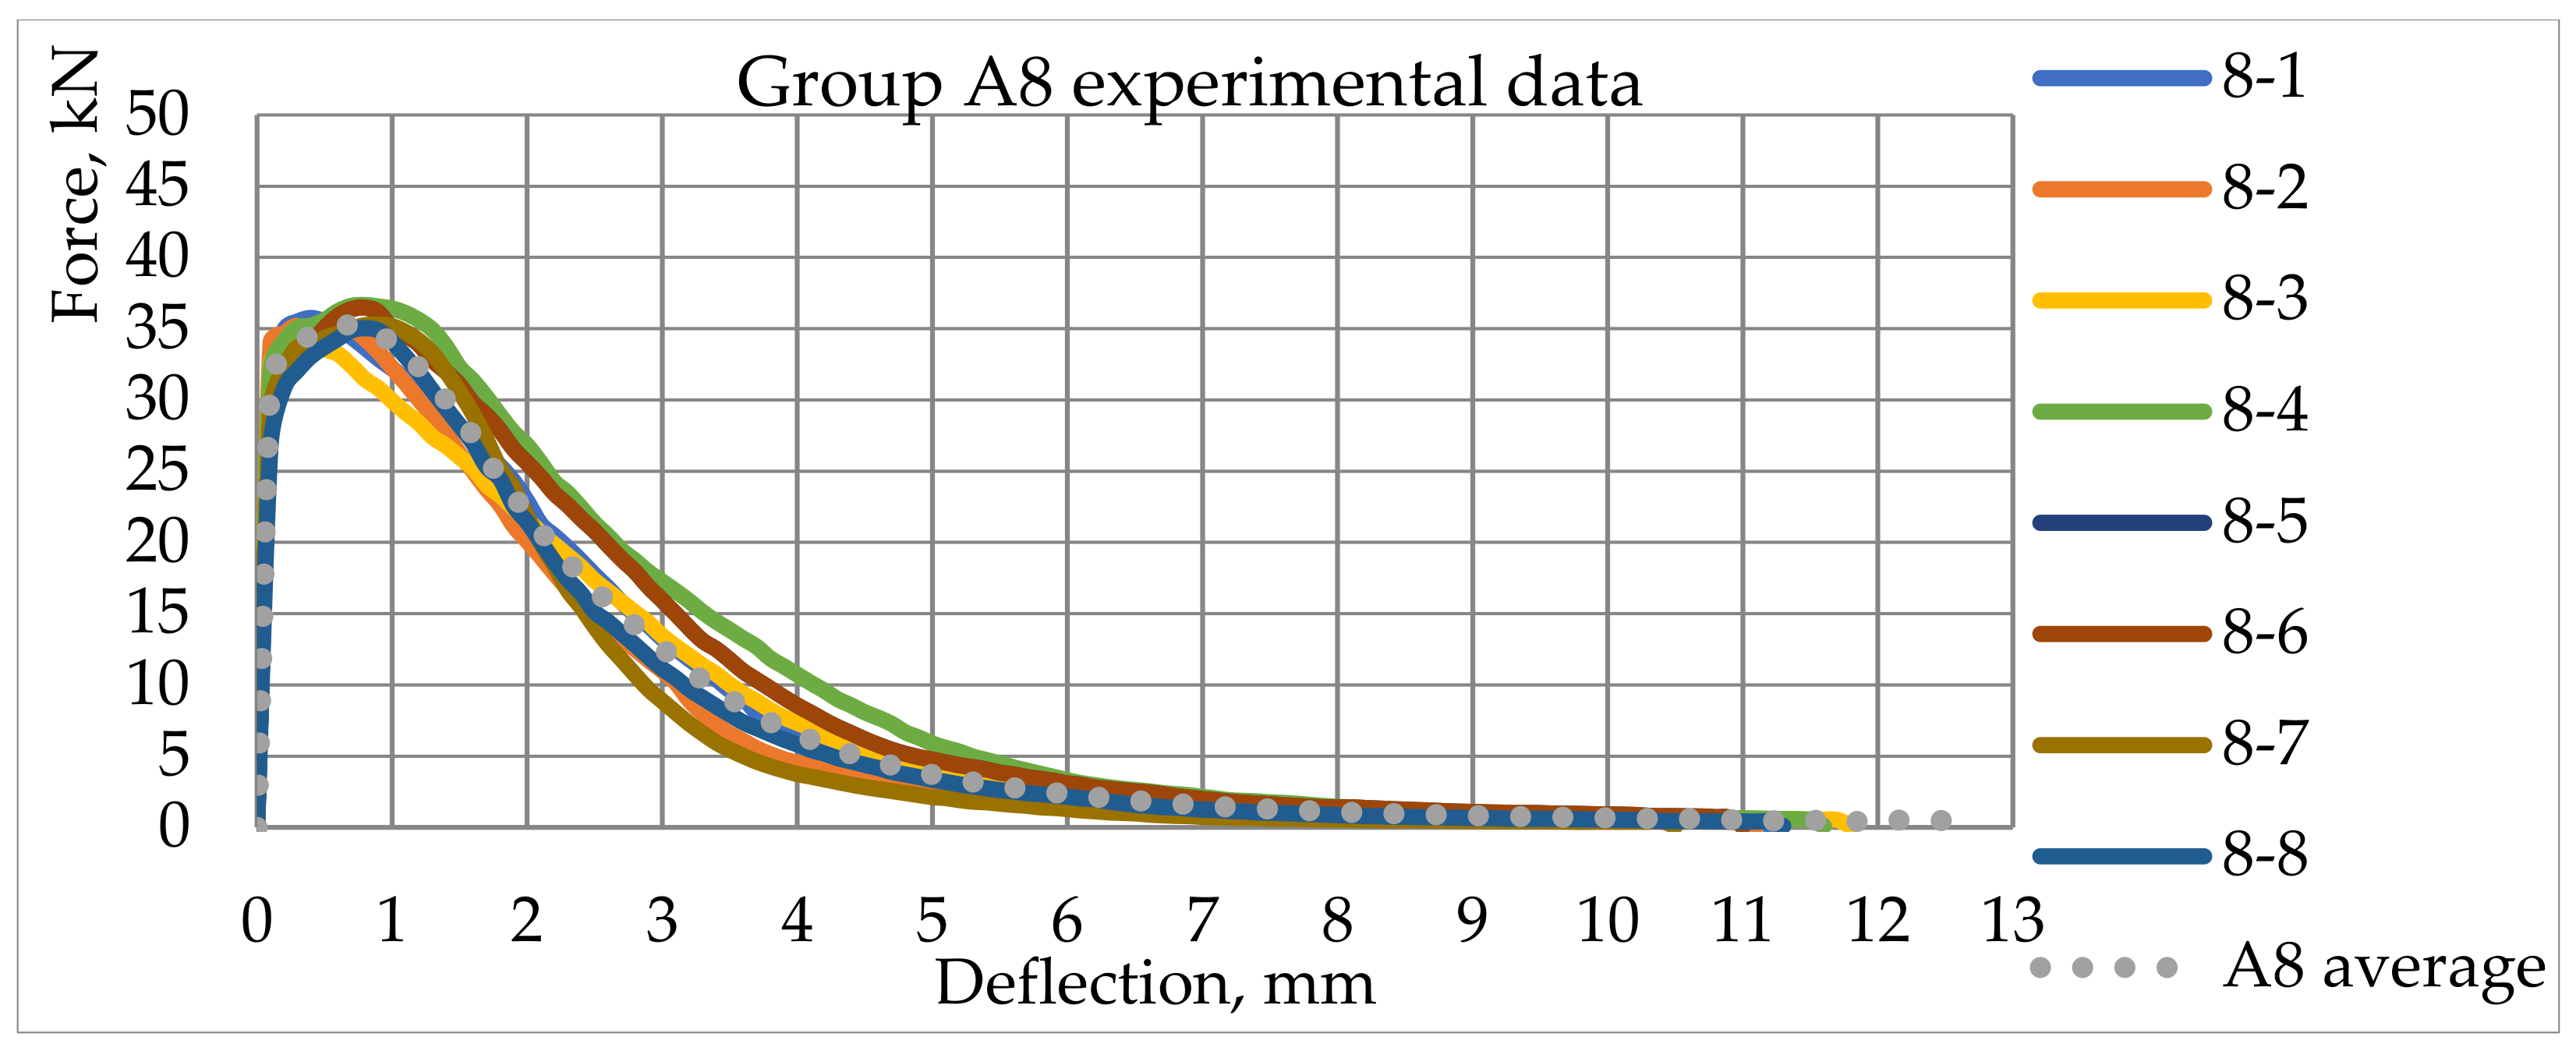
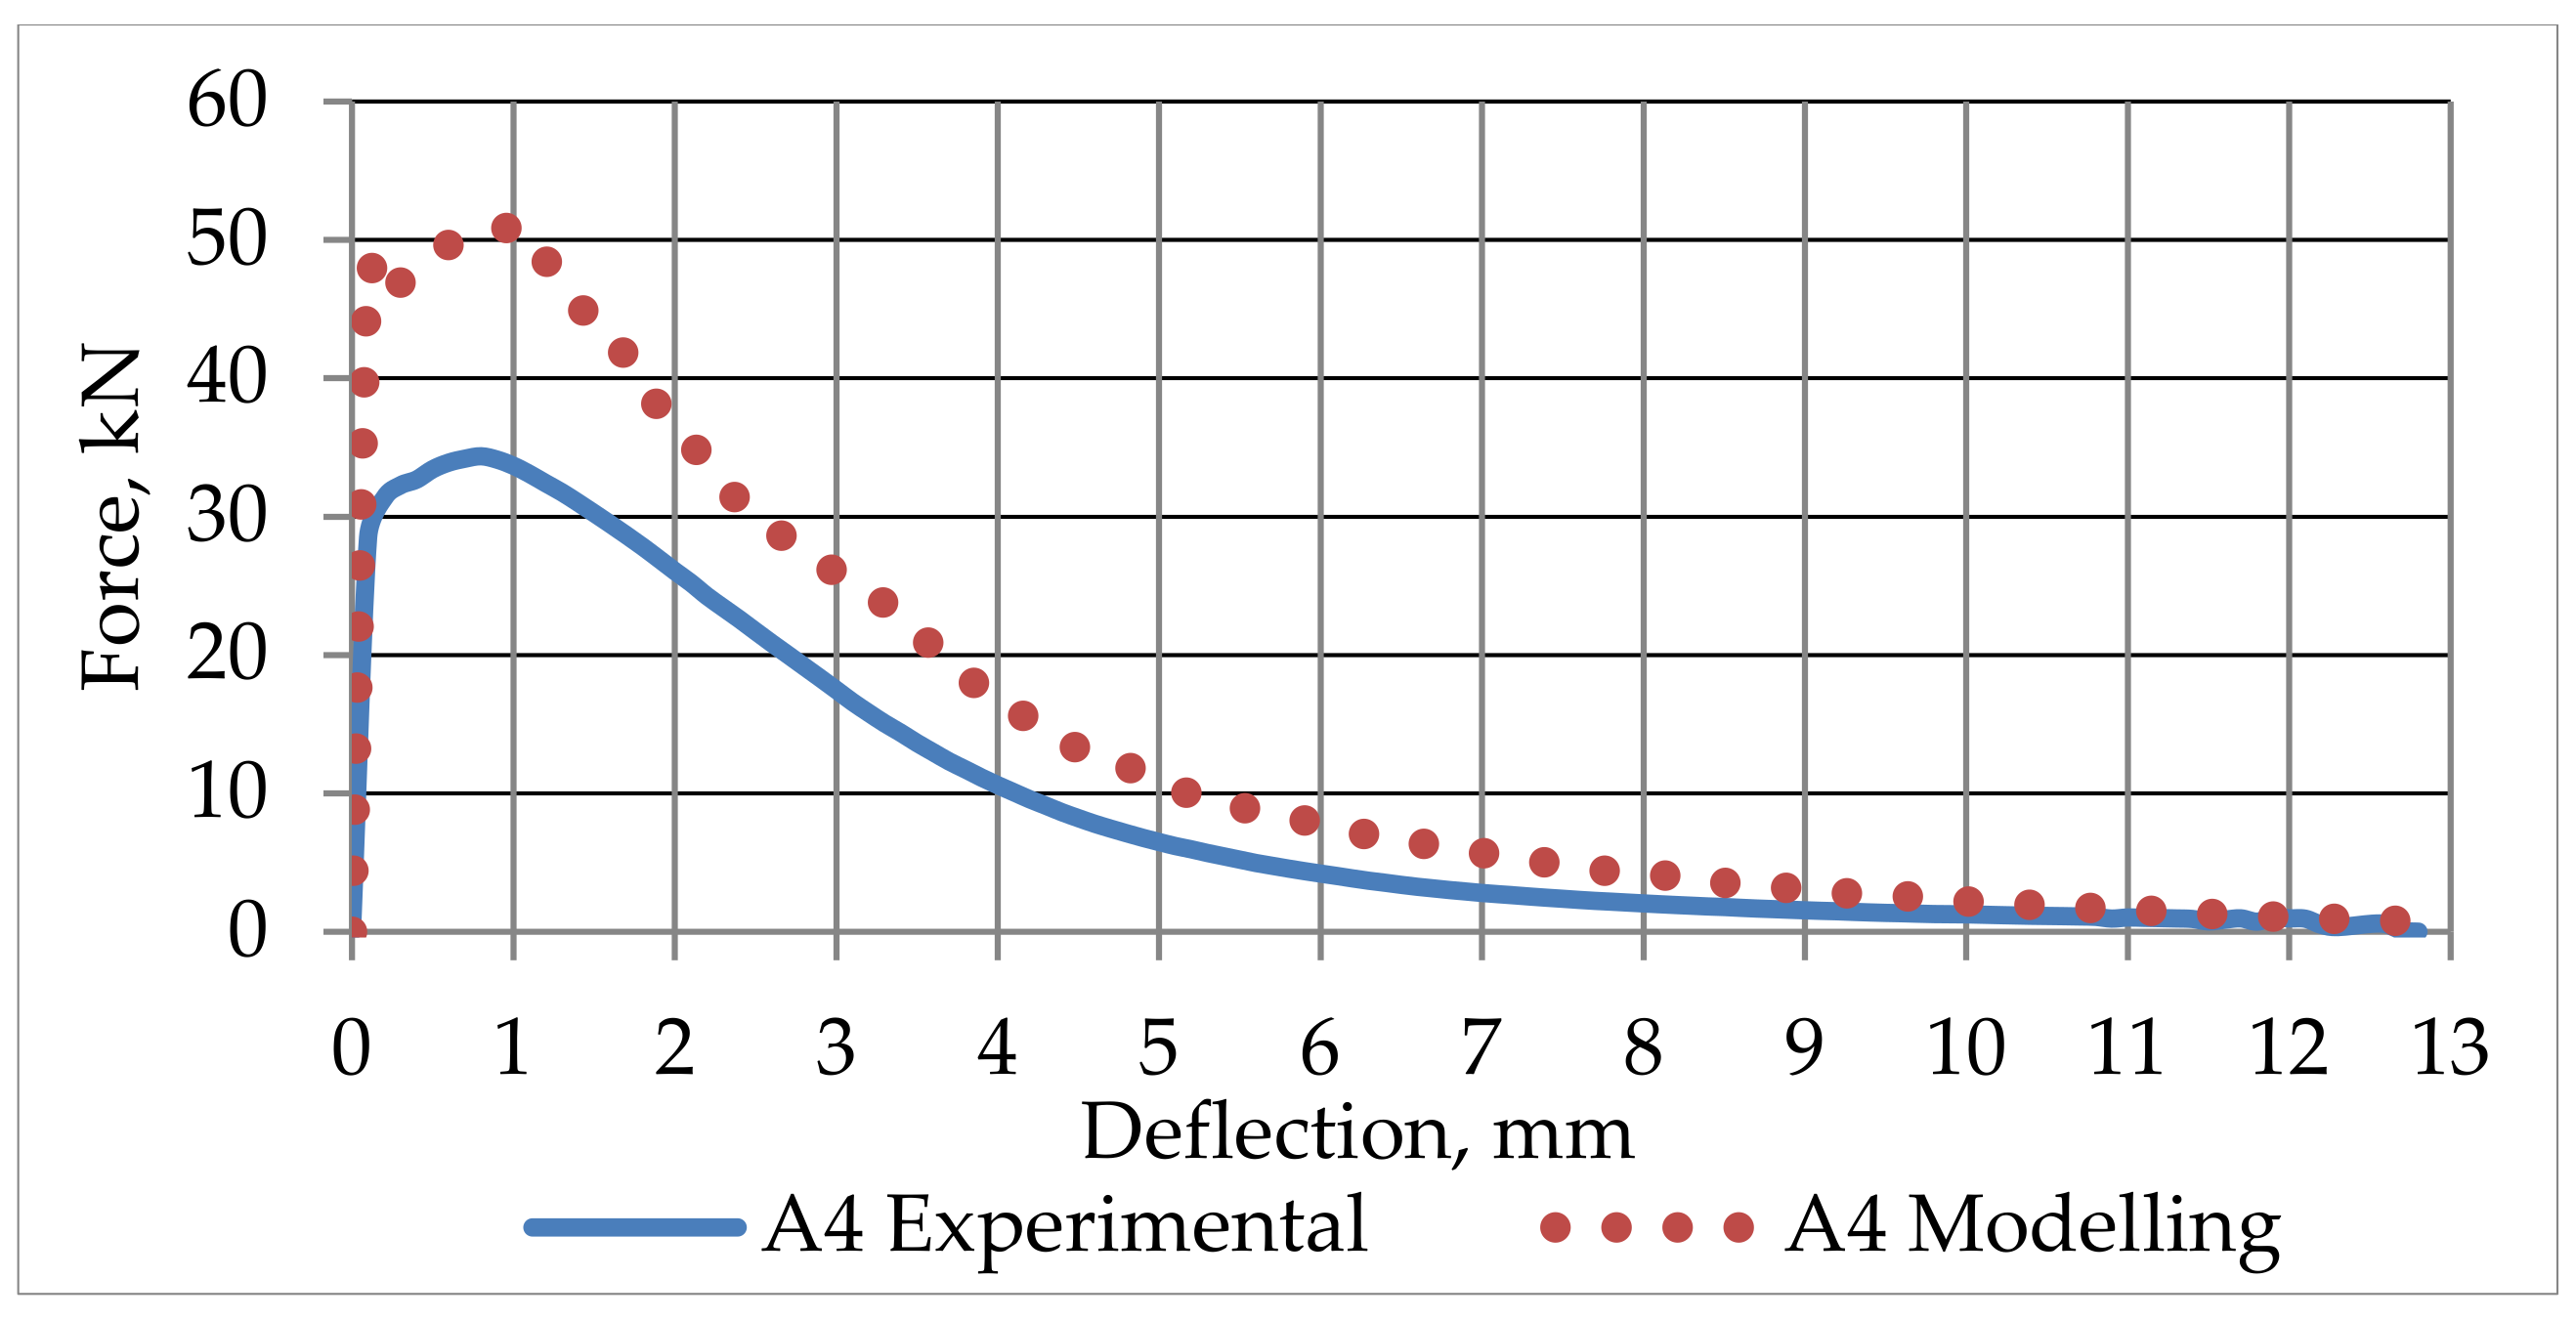
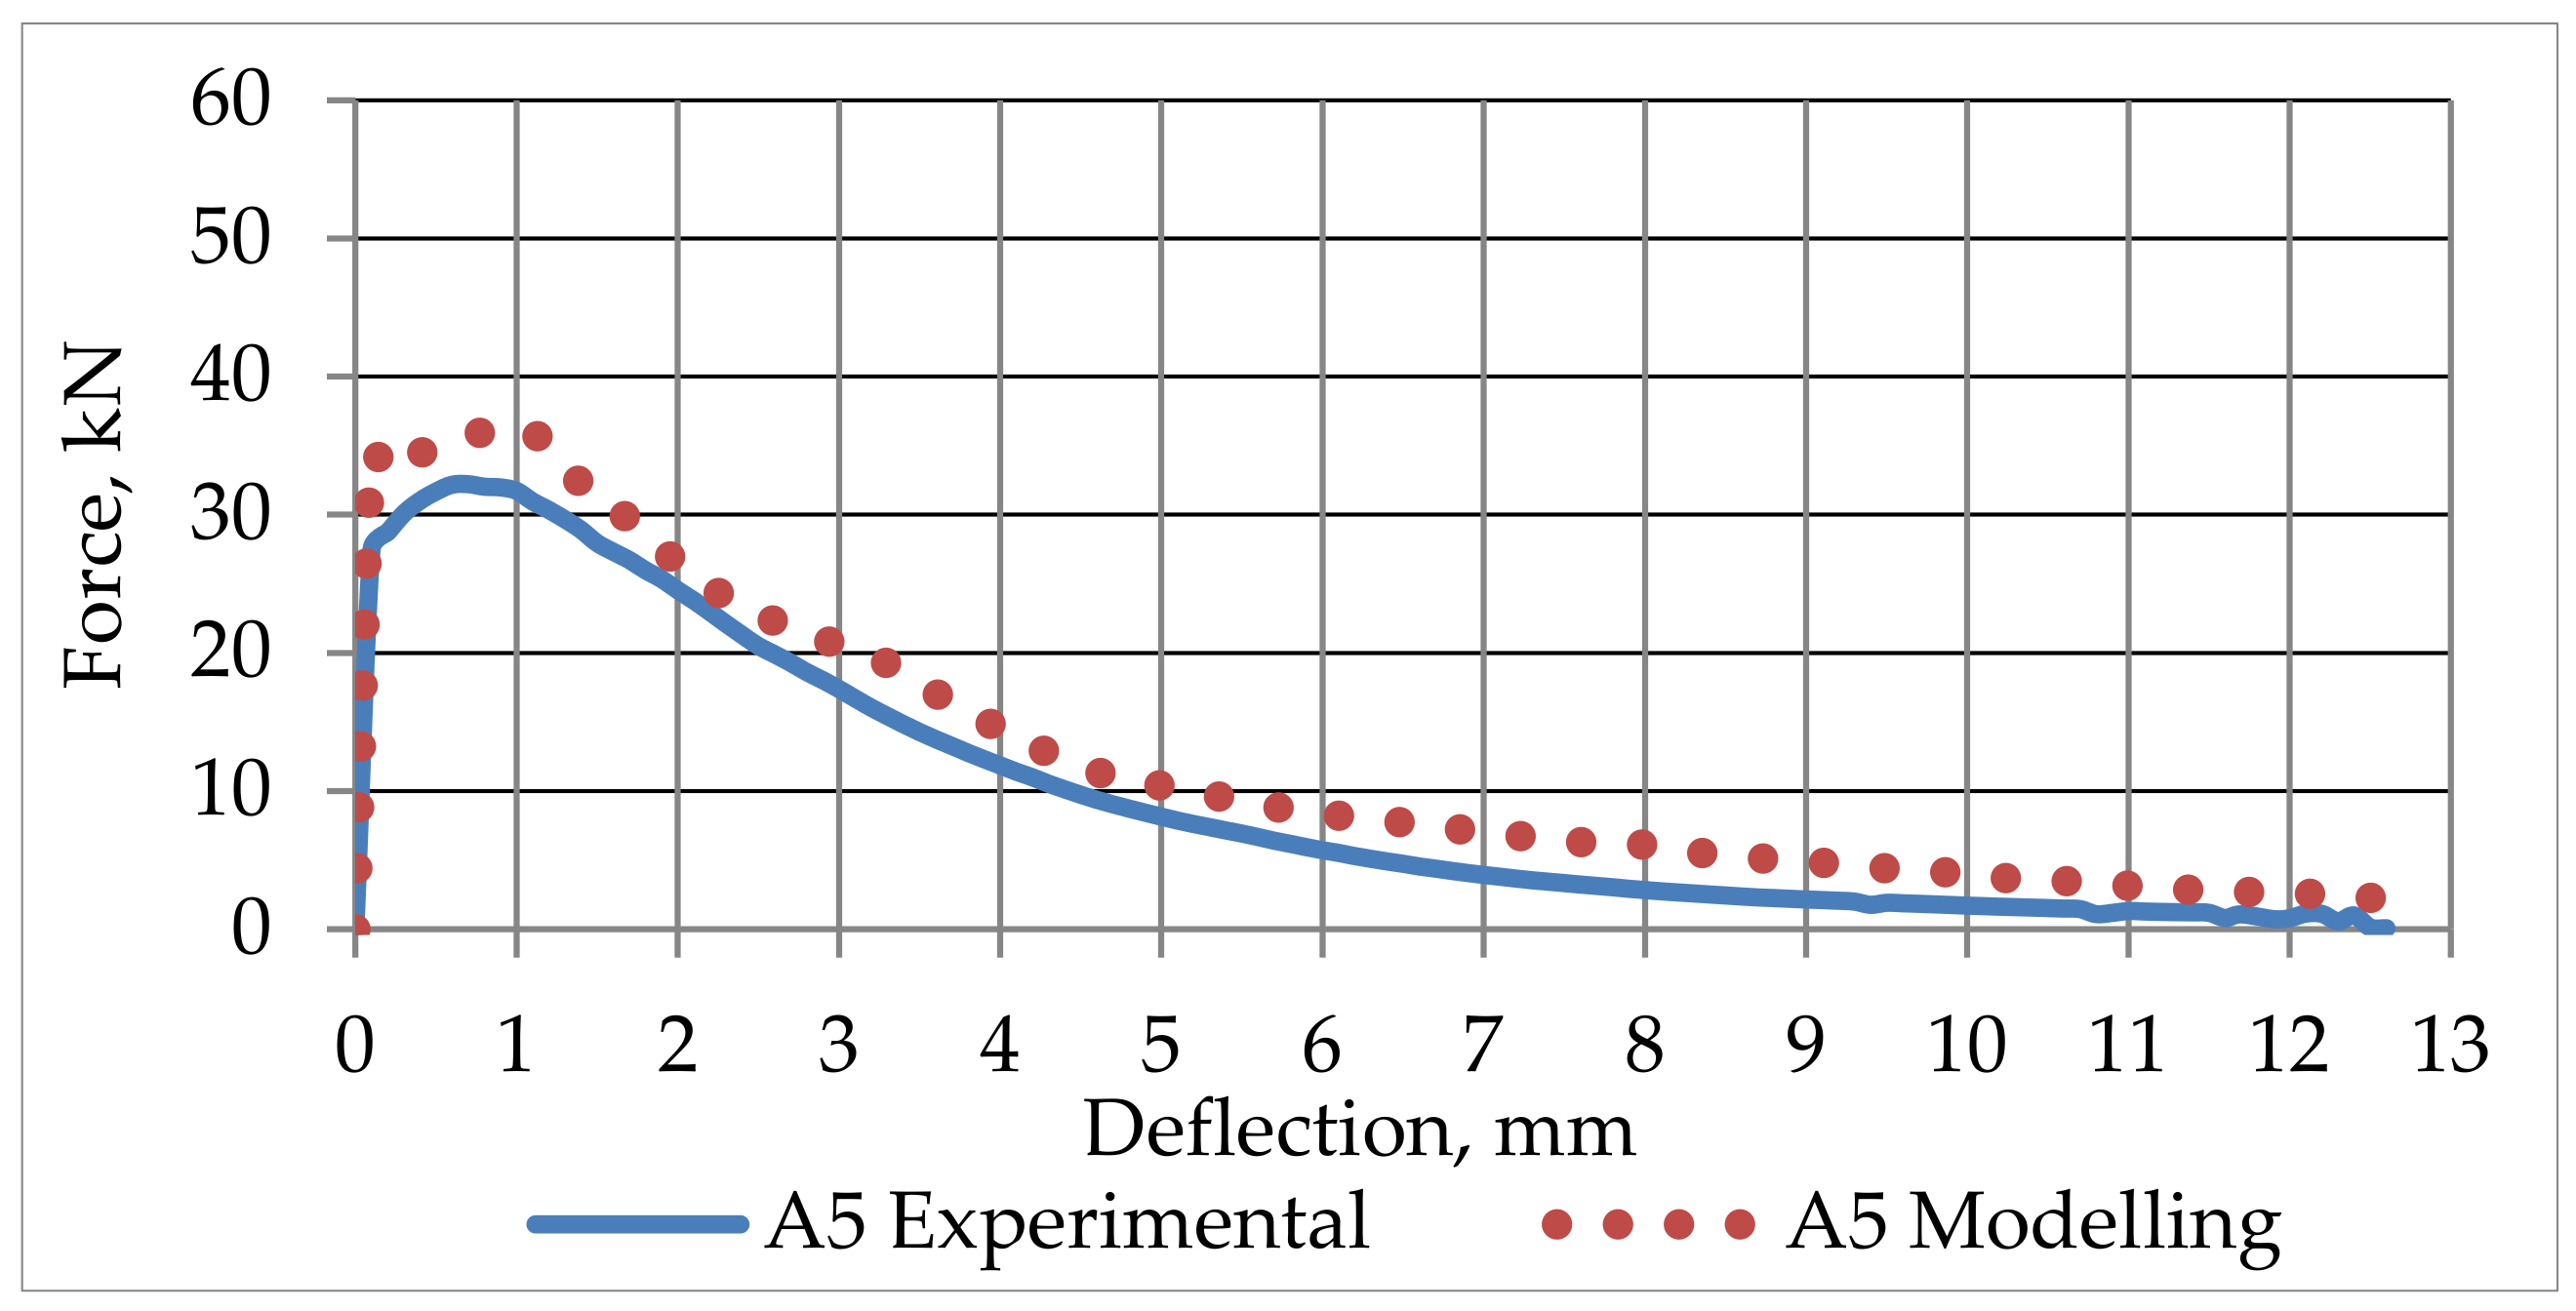
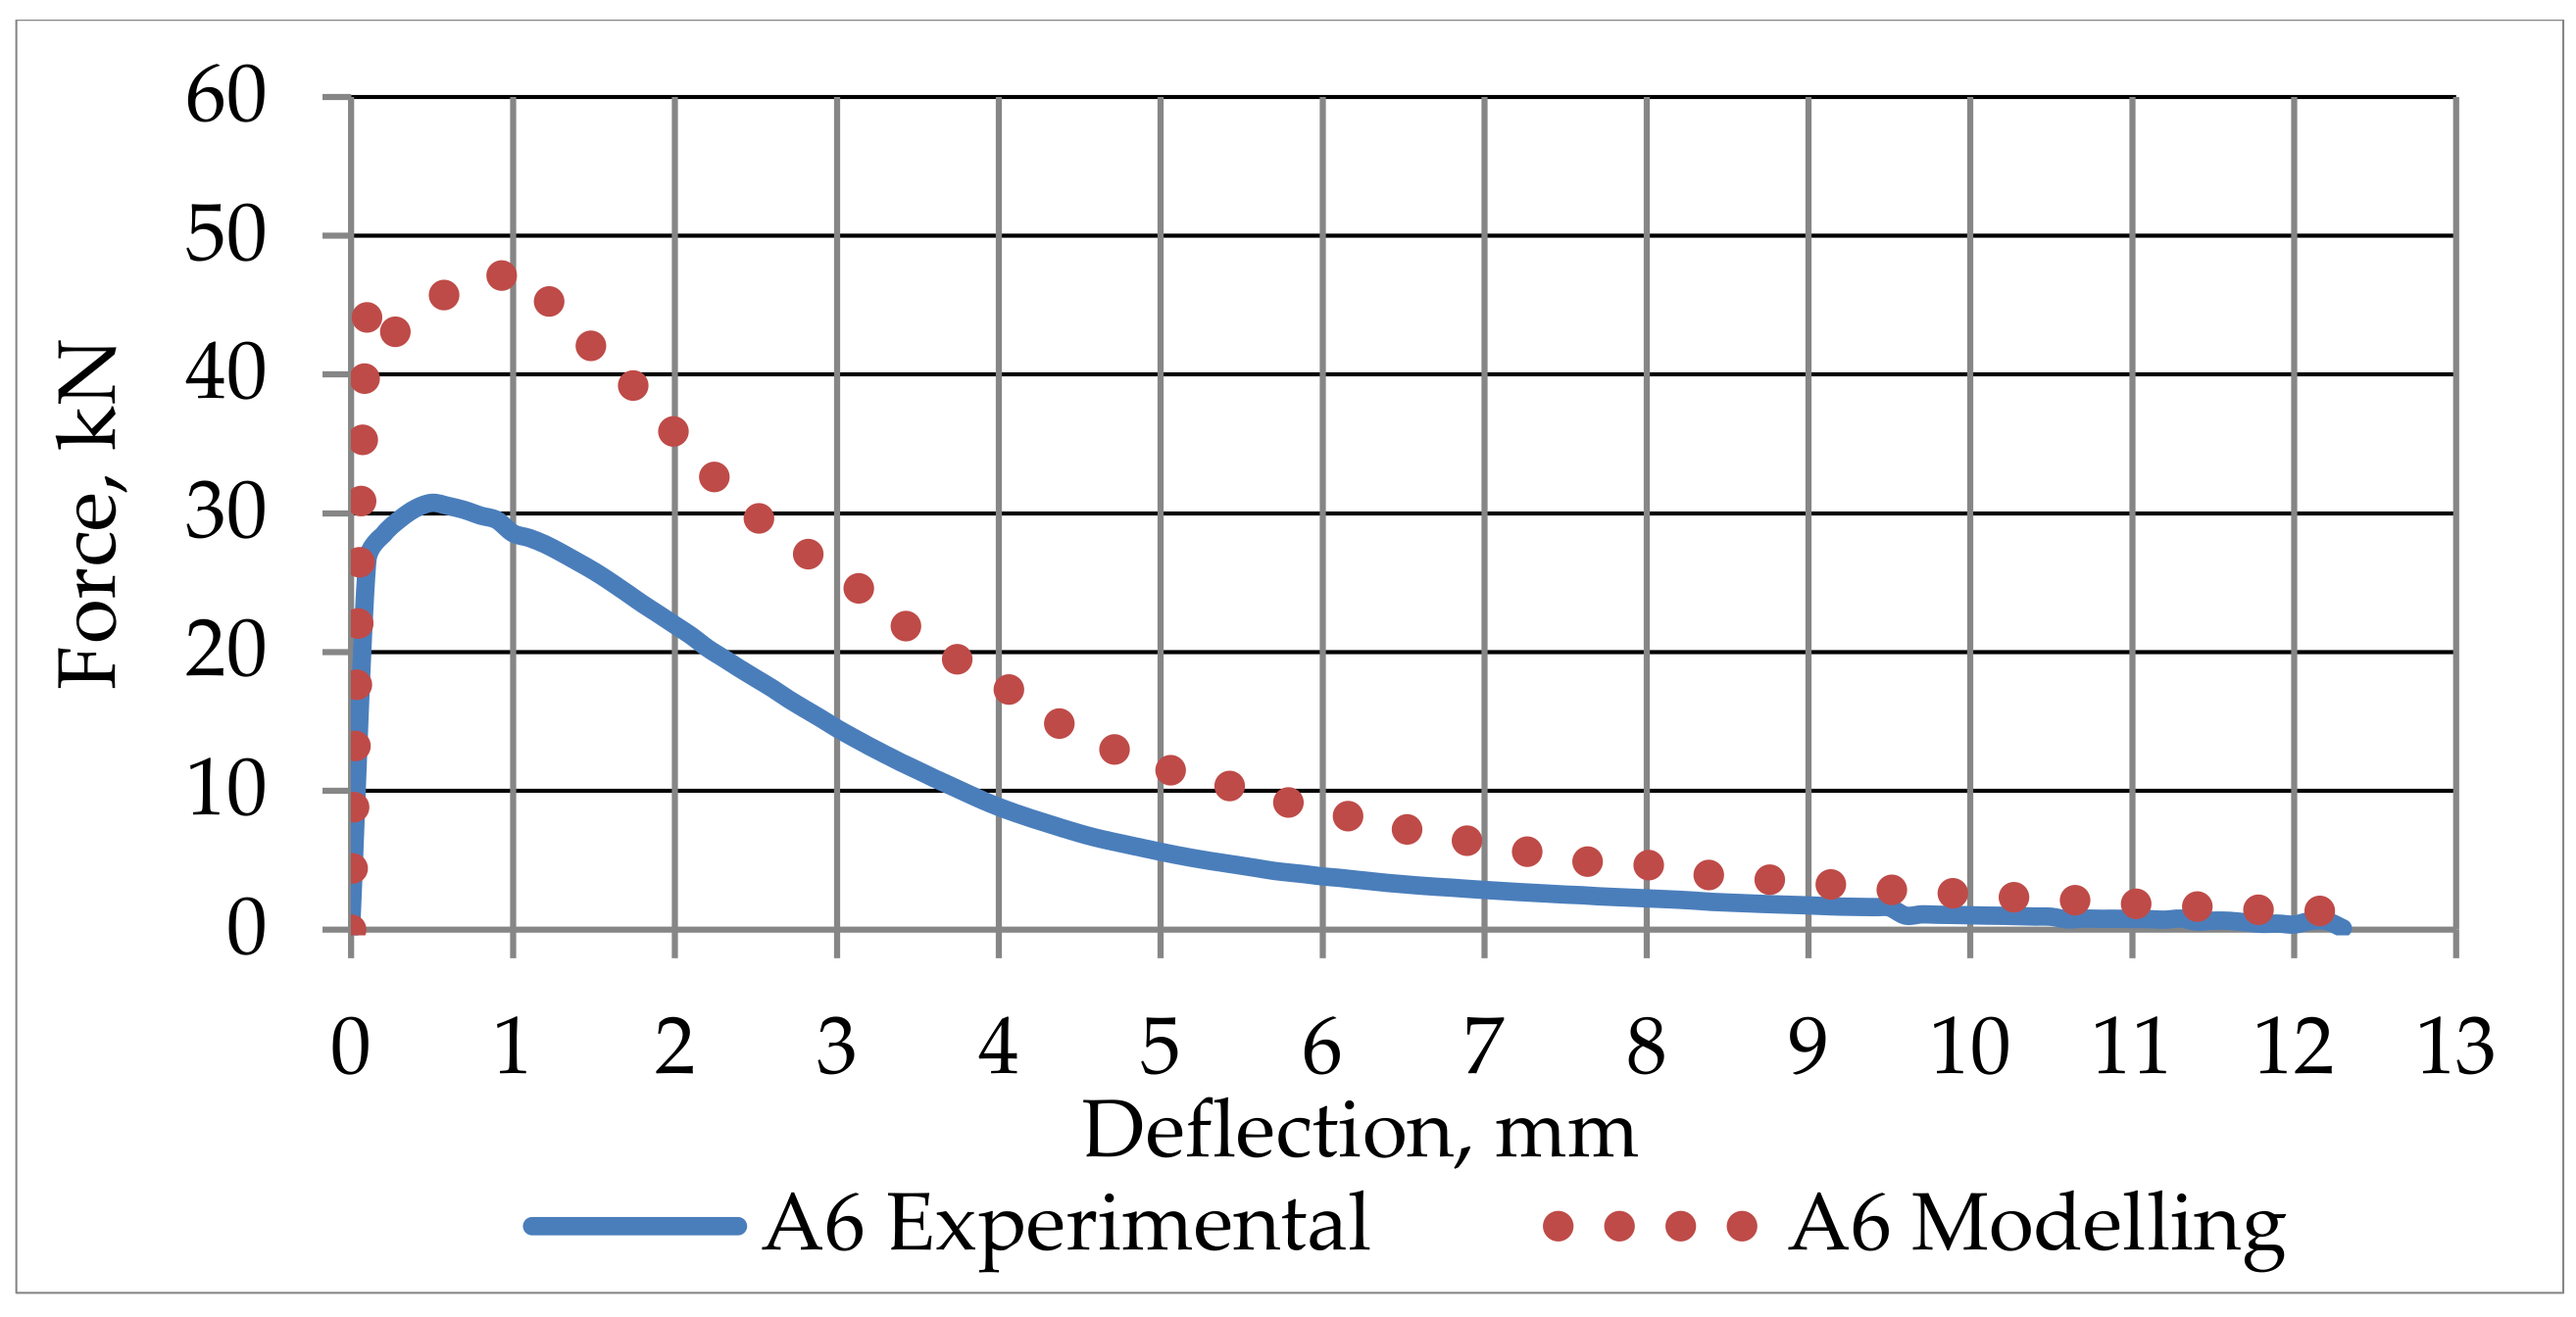
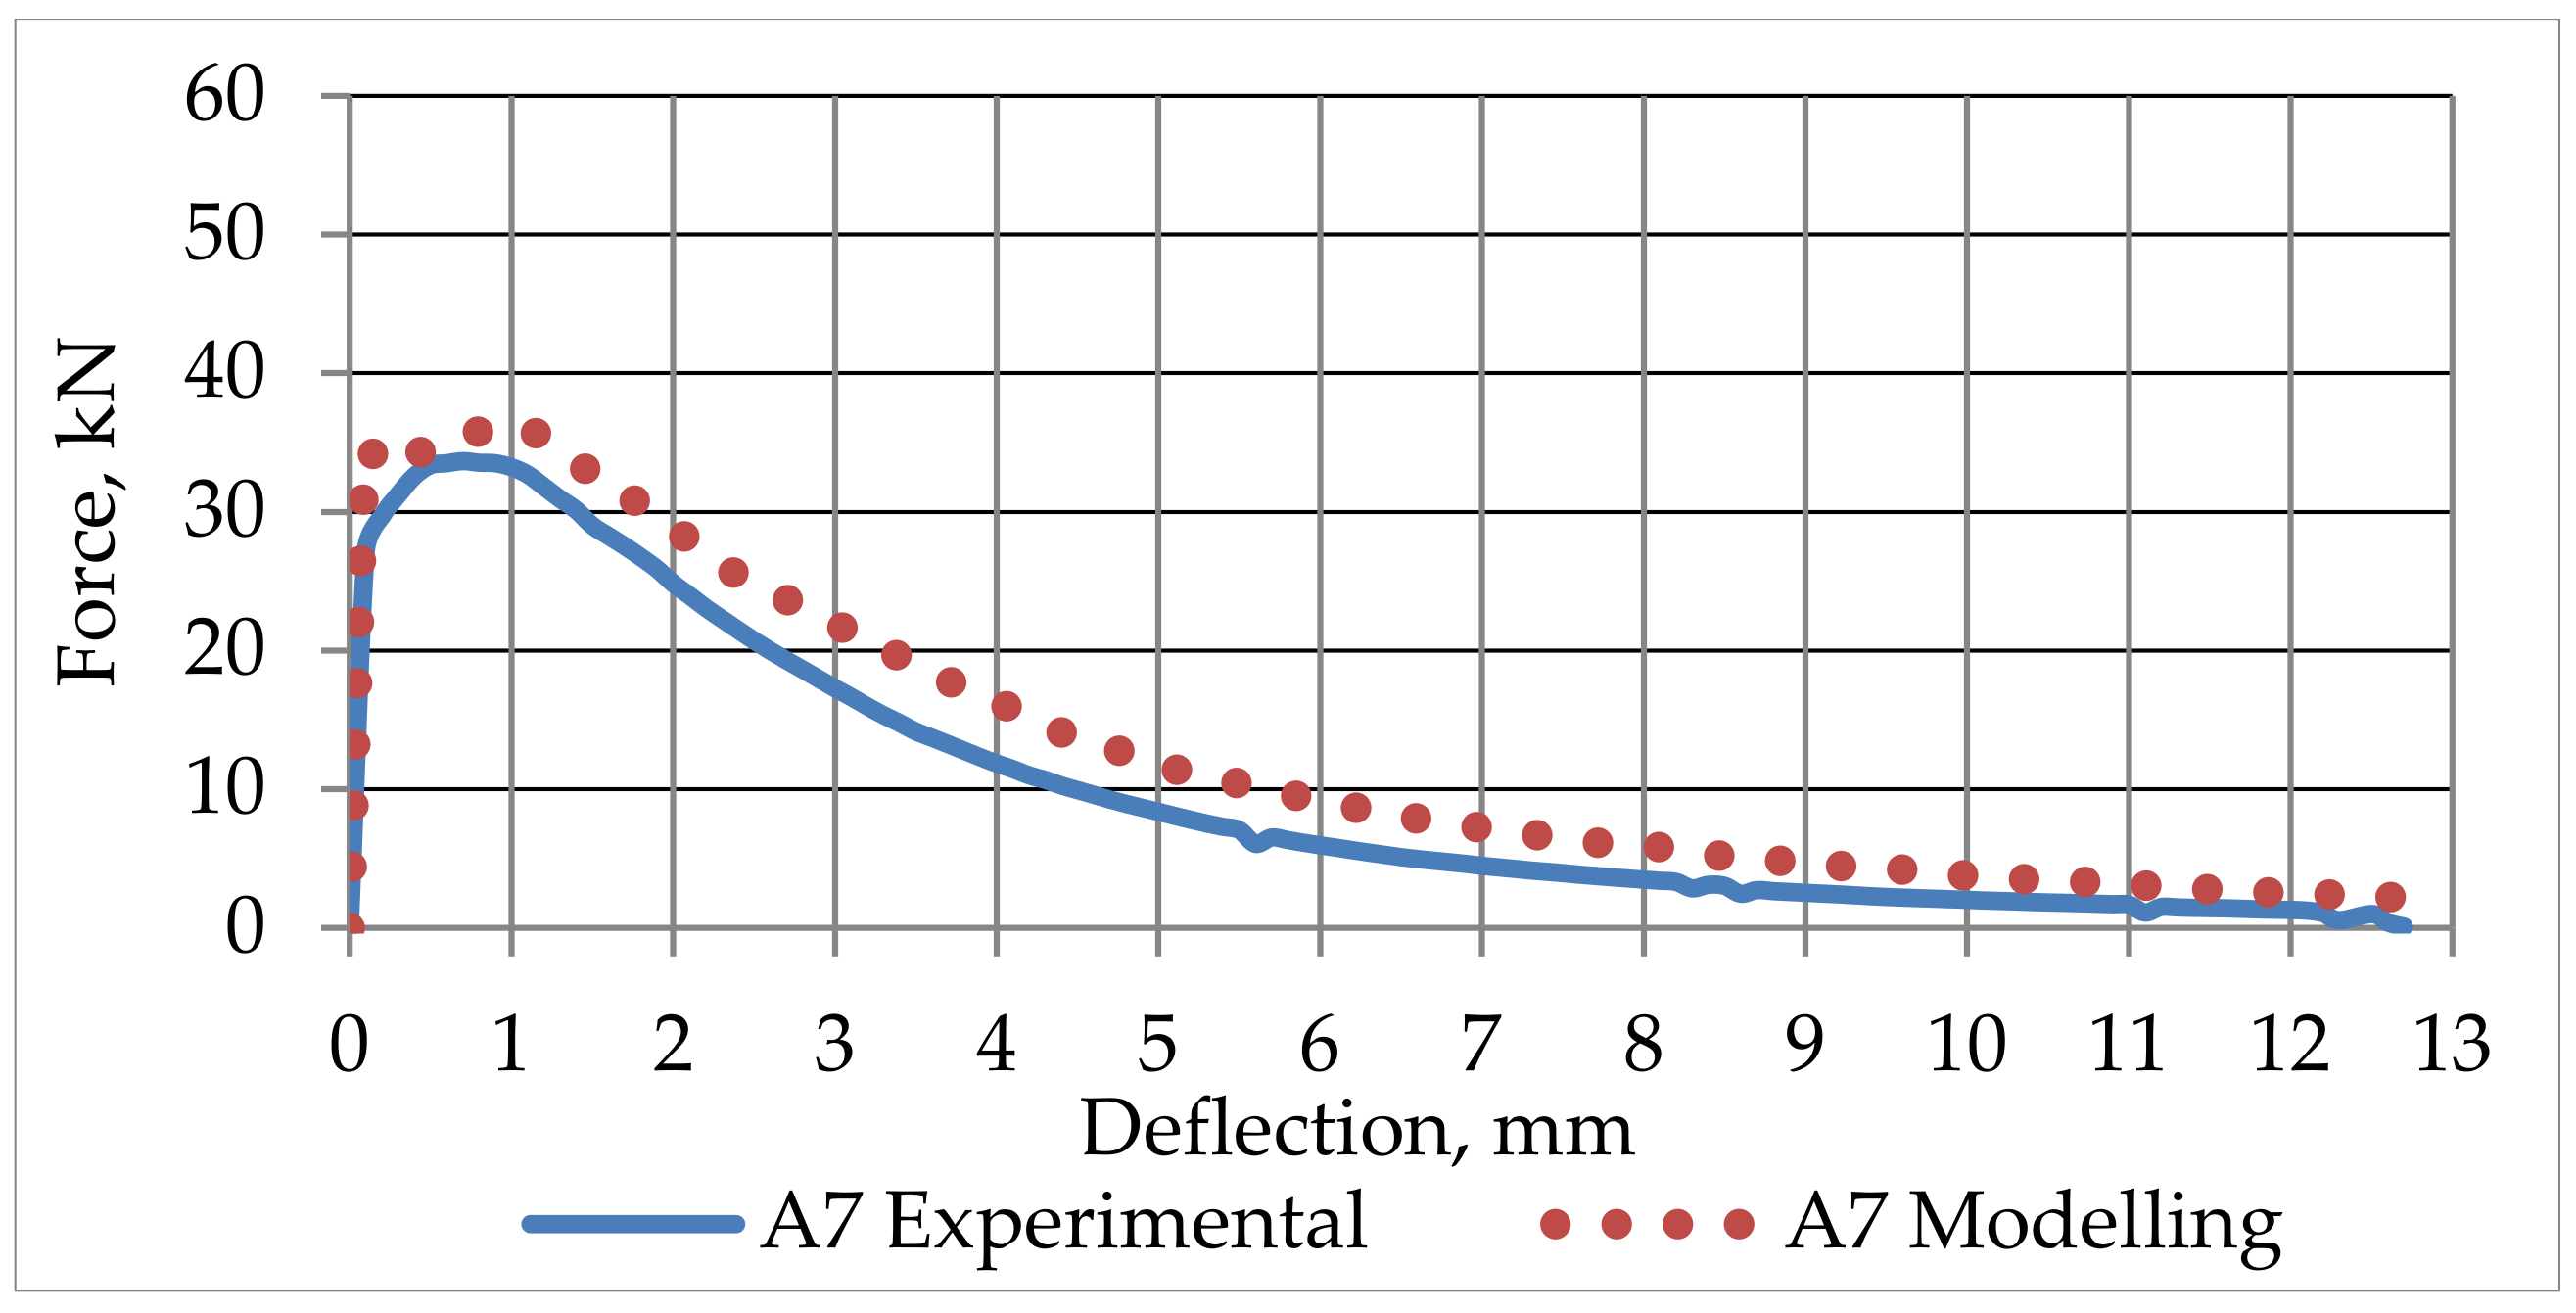
4.3. Mechanical 4PBT Results


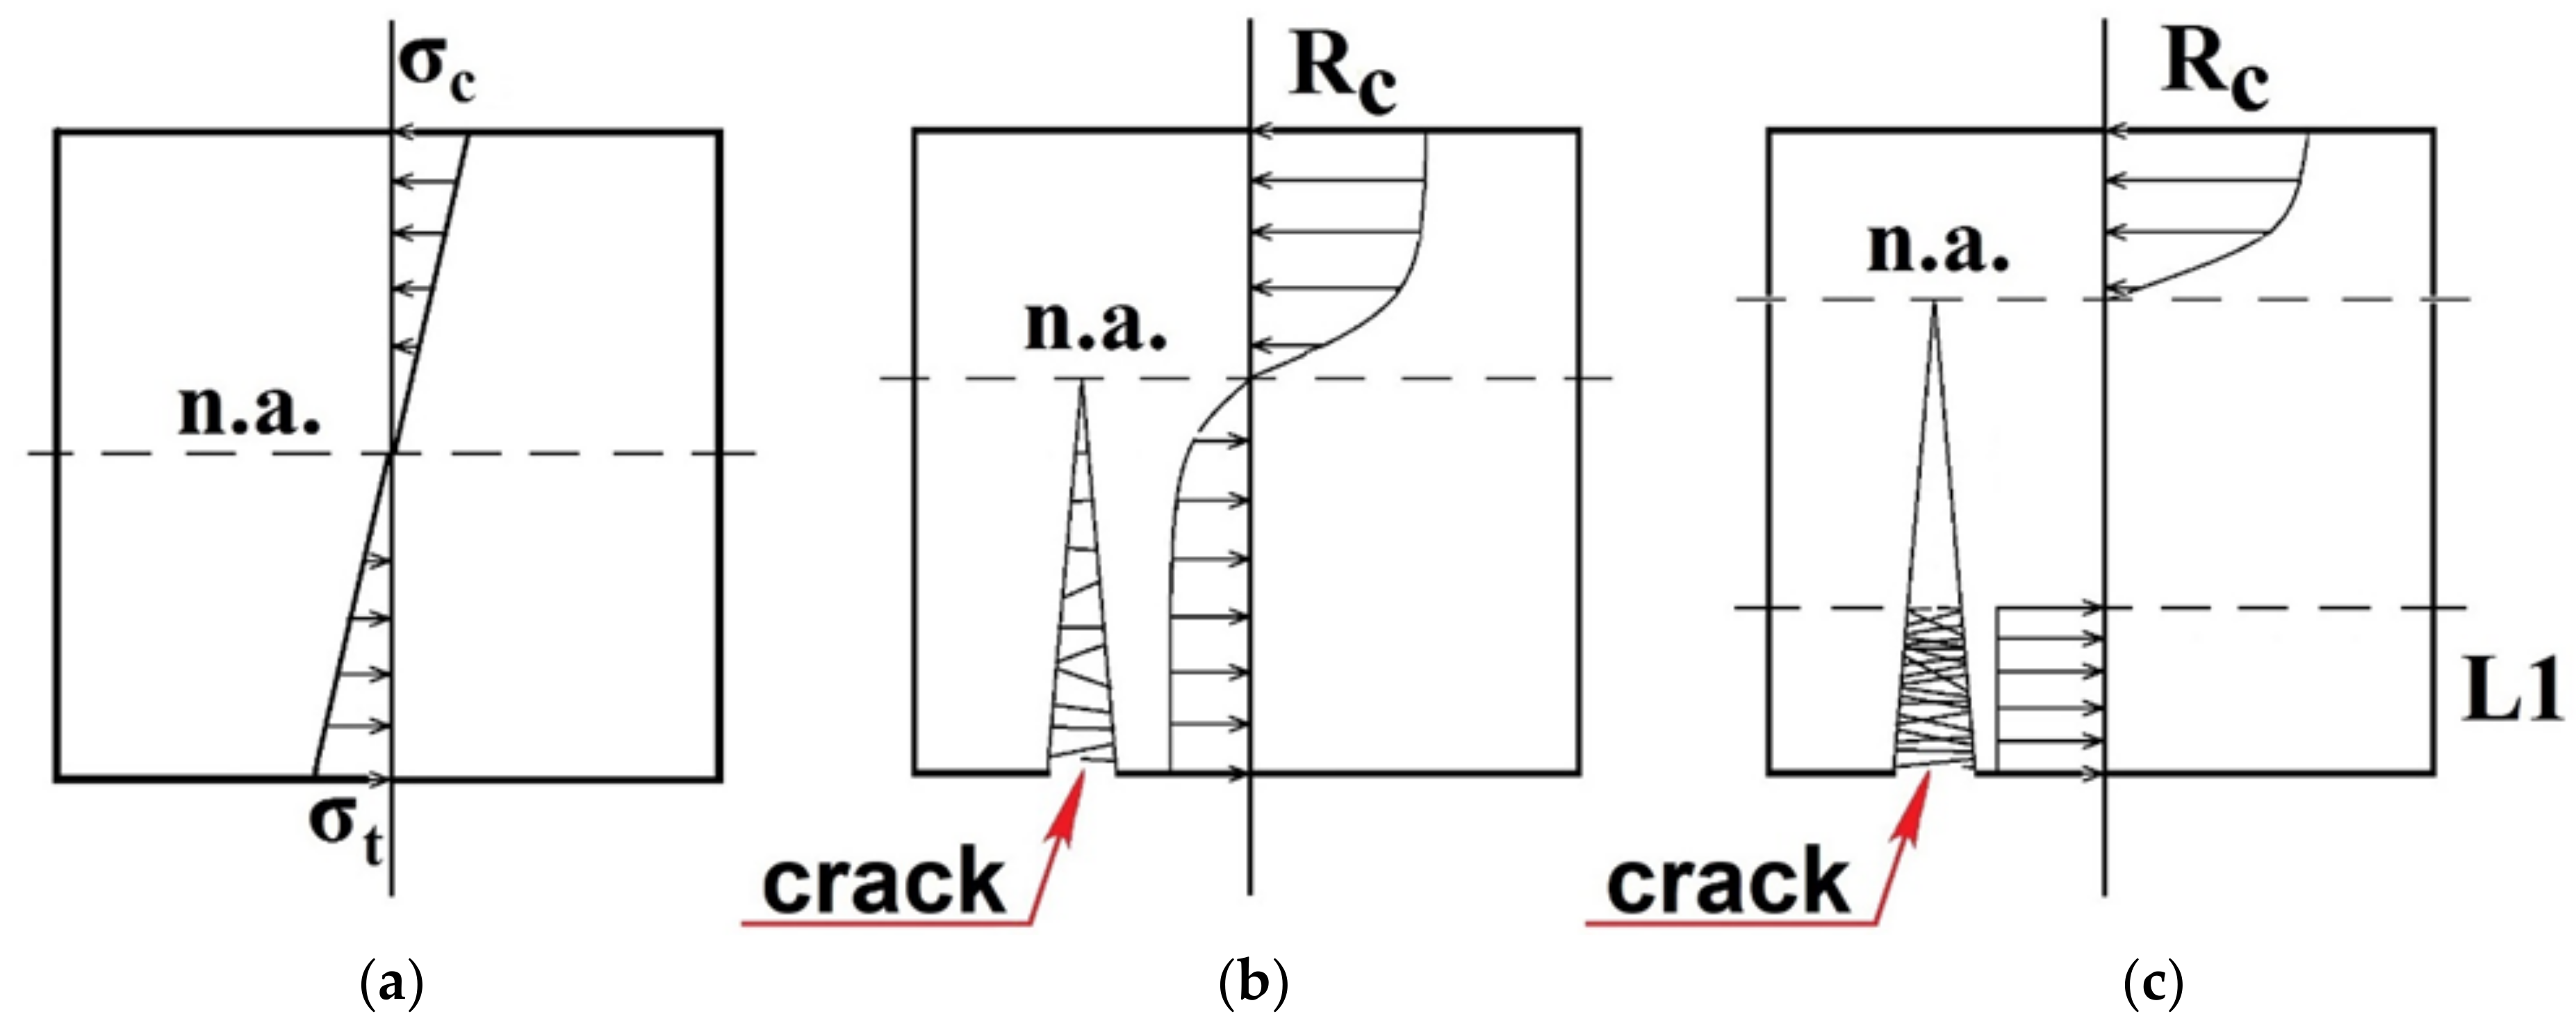
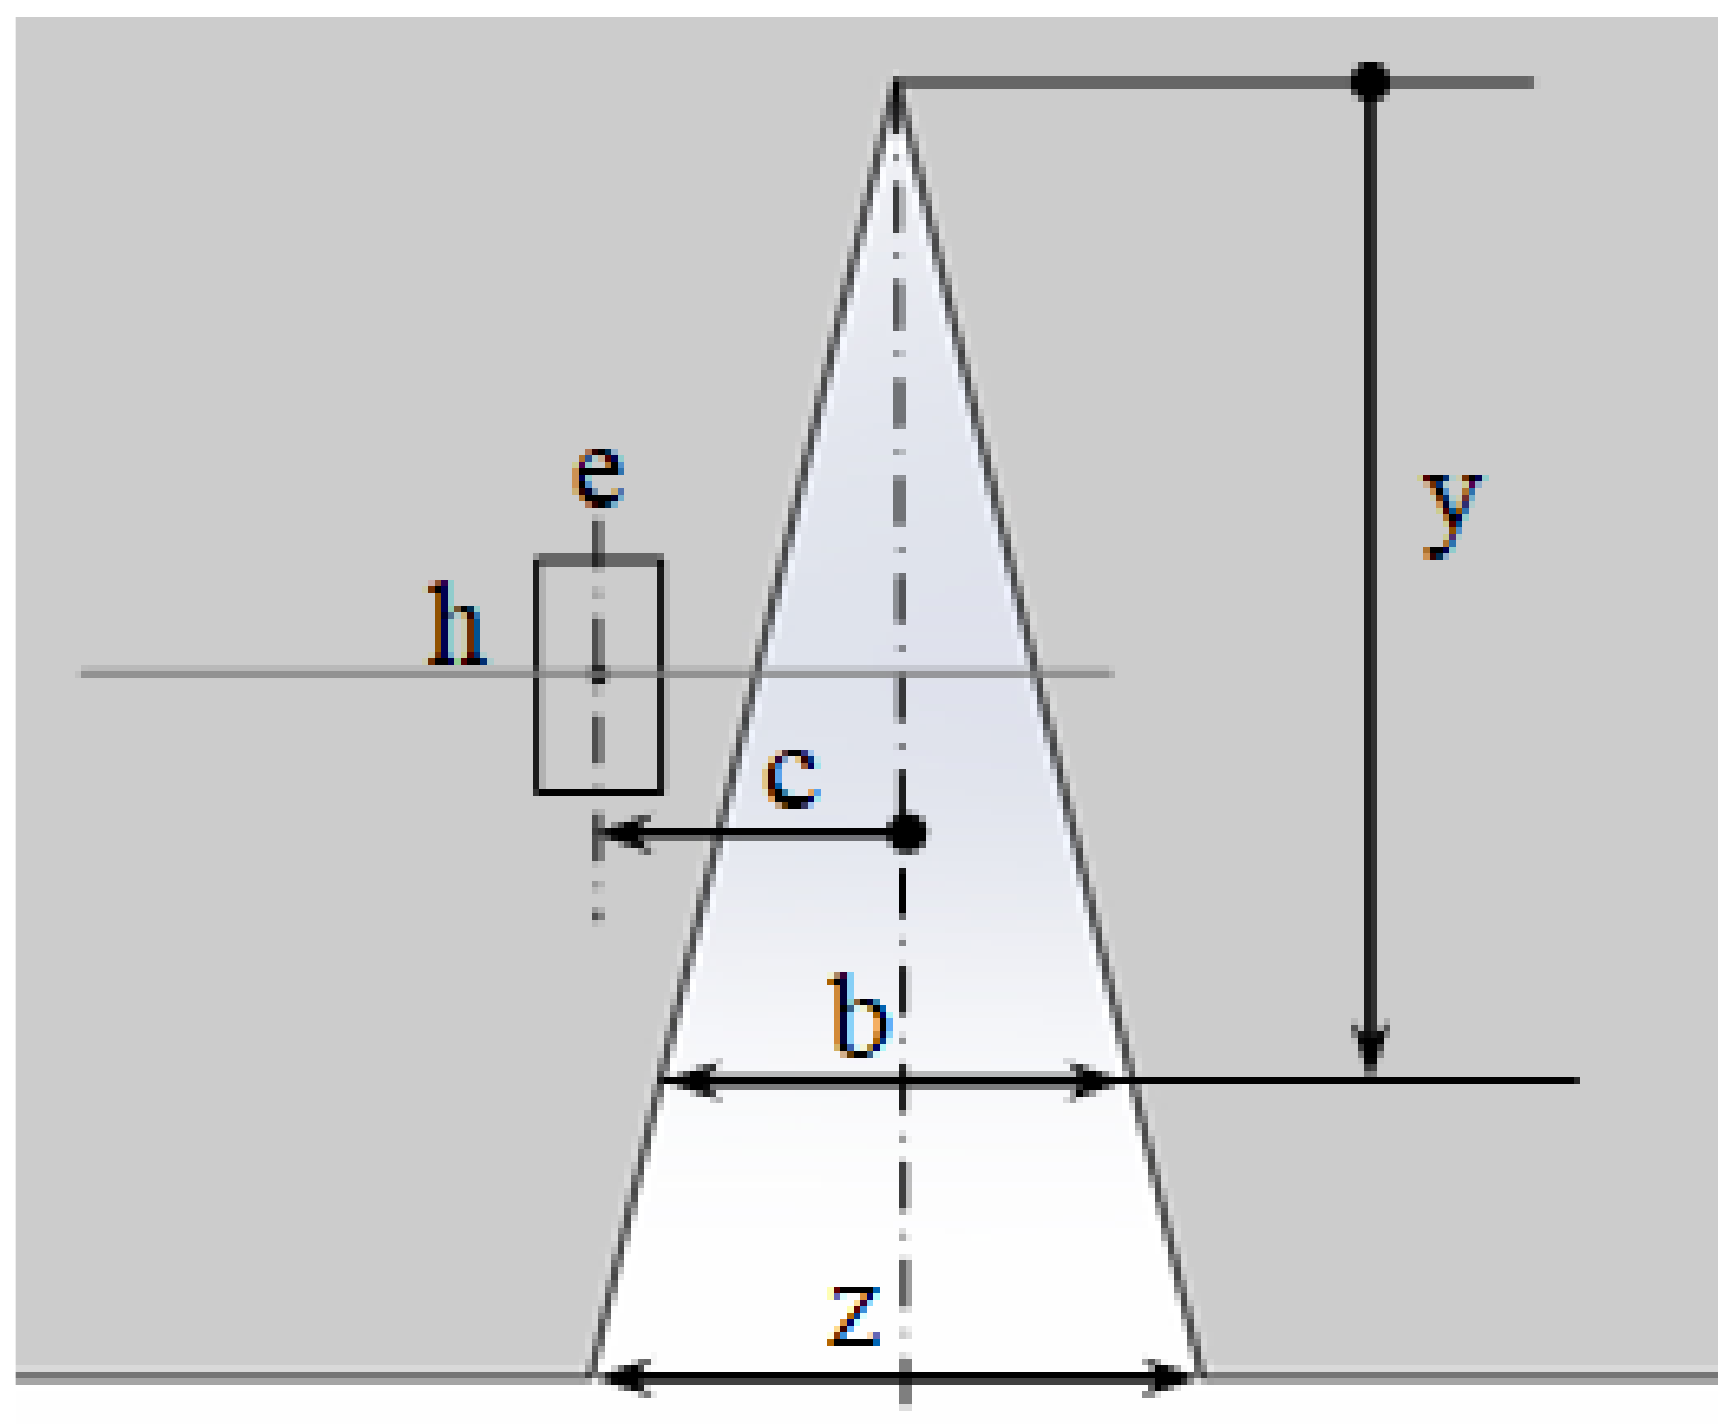
4.4. Numerical Modelling of SFRC Cracking Process


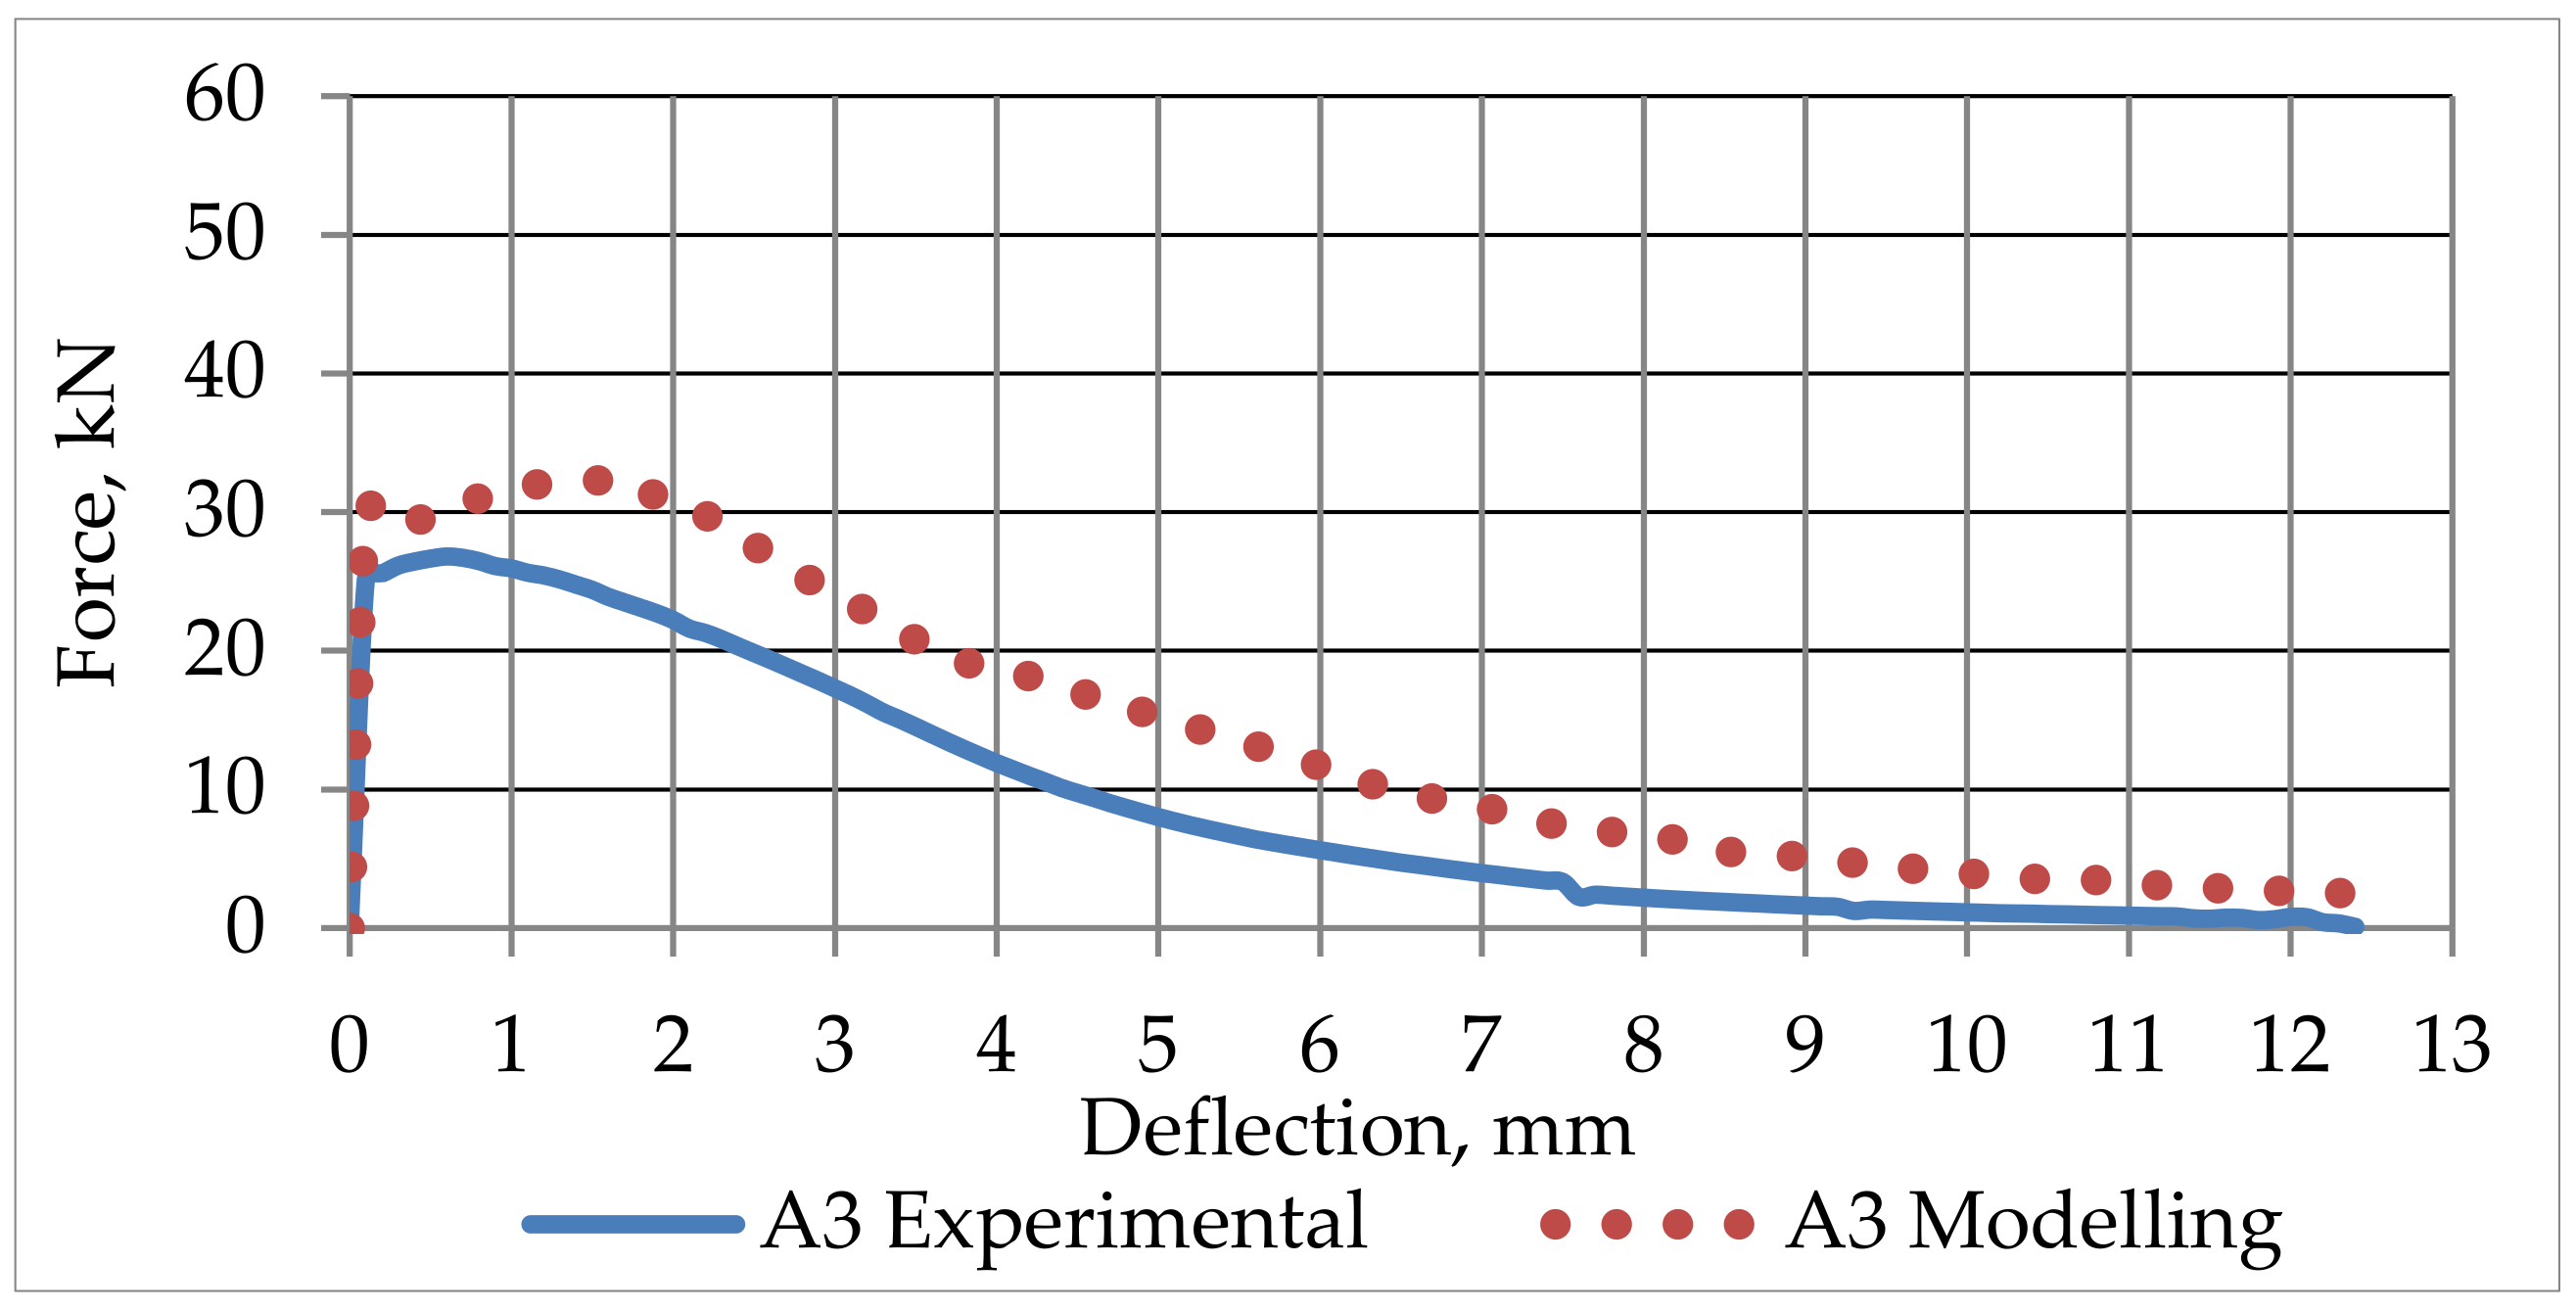
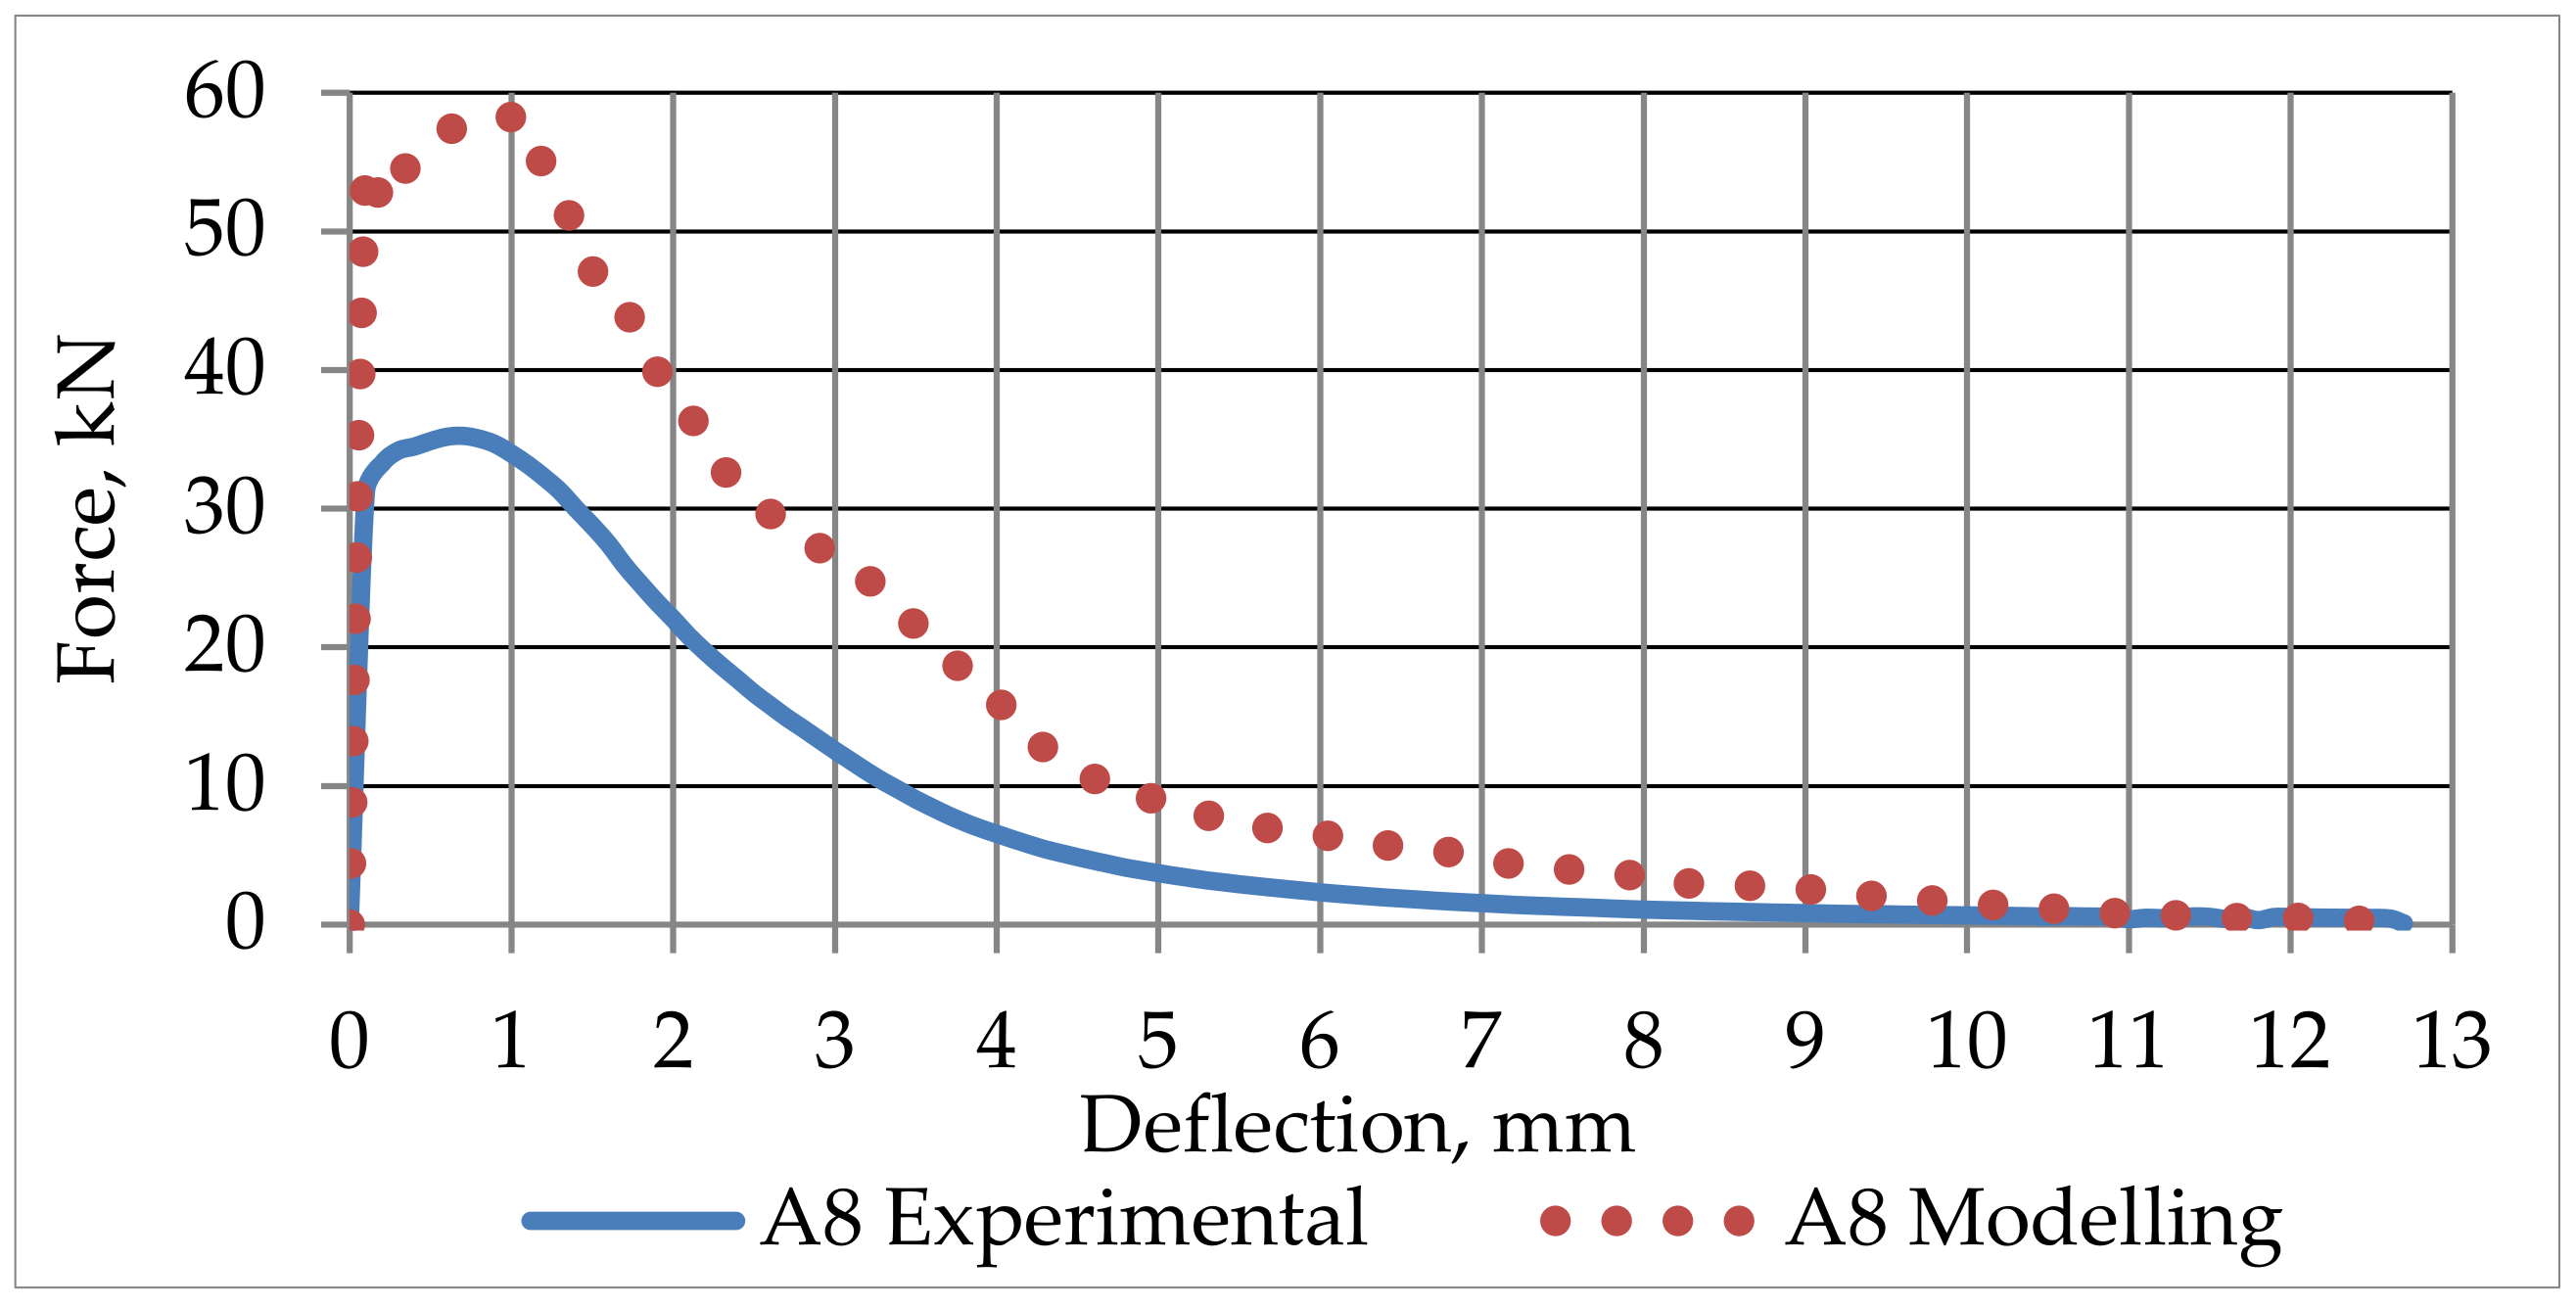
4.5. SFRC Prisms Numerical Modelling Results


5. Conclusions
Author Contributions
Funding
Institutional Review Board Statement
Informed Consent Statement
Data Availability Statement
Acknowledgments
Conflicts of Interest
References
- Sahmenko, G.; Rucevskis, S.; Lusis, V. The study of the combined effect of fly ash, silica fume, colloidal silica and superplasticizer on high performance cement composite applying mix optimization method. Mech. Compos. Mater. Unpublished manuscript.
- Adesina, A. Sustainable application of cenospheres in cementitious materials—Overview of performance. Dev. Built Environ. 2020, 4, 100029. [Google Scholar] [CrossRef]
- Shishkin, A.; Bumanis, G.; Irtiseva, K.; Ozolins, J.; Korjakins, A. Clay Ceramic Hollow Sphere—Cement Syntactic Foam Composite for Building Applications. Key Eng. Mater. 2019, 800, 228–234. [Google Scholar] [CrossRef]
- Shishkin, A.; Laksa, A.; Shidlovska, V.; Timermane, Z.; Aguedal, H.; Mironov, V.; Ozolins, J. Illite Clay Ceramic Hollow Sphere-Obtaining and Properties. Key Eng. Mater. 2016, 721, 316–321. [Google Scholar] [CrossRef]
- Khalil, N.; Assaad, J.J. Bond properties between smooth carbon fibre-reinforced polymer bars and ultra-high performance concrete modified with polymesric latexes and fibres. Eur. J. Environ. Civ. Eng. 2021, 1–18. [Google Scholar] [CrossRef]
- Kulakov, V.L.; Terrasi, G.P.; Arnautov, A.K.; Portnov, G.G.; Kovalovs, A. Fastening of a High-Strength Composite Rod with a Splitted and Wedged End in a Potted Anchor Finite-Element Analysis. Mech. Compos. Mater. 2014, 50, 39–50. [Google Scholar] [CrossRef]
- Signorini, C.; Volpini, V. Mechanical Performance of Fiber Reinforced Cement Composites Including Fully-Recycled Plastic Fibers. Fibers 2021, 9, 16. [Google Scholar] [CrossRef]
- Kovalovs, A.; Akishin, P.; Chate, A. Detection Prestress Loss in Prestressed Concrete Slab using Modal Analysis. IOP Conf. Ser. Mater. Sci. Eng. 2019, 471, 102015. [Google Scholar] [CrossRef]
- Ramanathan, S.; Benzecry, V.; Suraneni, P.; Nanni, A. Condition assessment of concrete and glass fiber reinforced polymer (GFRP) rebar after 18 years of service life. Case Stud. Constr. Mater. 2021, 14, e00494. [Google Scholar] [CrossRef]
- Kovalovs, A.; Rucevskis, S.; Akishin, P.; Kolupajevs, J. Numerical Investigation on Detection of Prestress Losses in a Prestressed Concrete Slab by Modal Analysis. IOP Conf. Ser. Mater. Sci. Eng. 2017, 251, 12090. [Google Scholar] [CrossRef]
- Šahmenko, G.; Krasnikovs, A.; Lukašenoks, A.; Eiduks, M. Ultra High Performance Concrete Reinforced with Short Steel and Carbon Fibers. Environ. Technol. Resour. Proc. Int. Sci. Pract. Conf. 2015, 1, 193–199. [Google Scholar] [CrossRef][Green Version]
- Ali, B.; Qureshi, L.A.; Kurda, R. Environmental and economic benefits of steel, glass, and polypropylene fiber reinforced cement composite application in jointed plain concrete pavement. Compos. Commun. 2020, 22, 100437. [Google Scholar] [CrossRef]
- Hussain, I.; Ali, B.; Akhtar, T.; Jameel, M.S.; Raza, S.S. Comparison of mechanical properties of concrete and design thickness of pavement with different types of fiber-reinforcements (steel, glass, and polypropylene). Case Stud. Constr. Mater. 2020, 13, e00429. [Google Scholar] [CrossRef]
- Kononova, O.; Krasnikovs, A.; Harjkova, G.; Lusis, V. Numerical simulation of mechanical properties for composite reinforced by knitted fabric. Ebook Congr. Mund. 2014, 5, 2925–2932. [Google Scholar]
- Elbehiry, A.; Elnawawy, O.; Kassem, M.; Zaher, A.; Mostafa, M. FEM evaluation of reinforced concrete beams by hybrid and banana fiber bars (BFB). Case Stud. Constr. Mater. 2021, 14, e00479. [Google Scholar] [CrossRef]
- Macanovskis, A.; Krasnikovs, A.; Kononova, O.; Lukasenoks, A. Mechanical Behavior of Polymeric Synthetic Fiber in the Concrete. Proc. Eng. 2017, 172, 673–680. [Google Scholar] [CrossRef]
- Lasenko, I.; Grauda, D.; Butkauskas, D.; Sanchaniya, J.V.; Viļuma-Gudmona, A.; Lusis, V. Testing of physical and me-chanical properties of polyacrylonitrile nanofibers reinforced with succinite and silicon oxide nano particles. Text. Nanofunct. Text. Unpublished manuscript.
- Krasnikovs, A.; Kononova, O.; Machanovskis, A.; Zaharevskis, V.; Akishins, P.; Ruchevskis, S. Characterization of mechanical properties by inverse technique for composite reinforced by knitted fabric. Part 2. Experimental evaluation of mechanical properties by frequency eigenvalues method. J. Vibroeng. 2012, 14, 691–698. [Google Scholar]
- Shen, J.; Zhang, Y. Fiber-reinforced Mechanism and Mechanical Performance of Composite Fibers Reinforced Concrete. J. Wuhan Univ. Technol. Sci. Ed. 2020, 35, 121–130. [Google Scholar] [CrossRef]
- Lusis, V.; Krasnikovs, A. Fiberconcrete with Non-Homogeneous Fibers Distribution. Environ. Technol. Resour. Proc. Int. Sci. Pract. Conf. 2013, 2, 67. [Google Scholar] [CrossRef][Green Version]
- Benaoum, F.; Khelil, F.; Benhamena, A. Numerical analysis of reinforced concrete beams pre cracked reinforced by composite materials. Frattura ed Integrità Strutturale 2020, 14, 282–296. [Google Scholar] [CrossRef]
- Plizzari, G.; Mindess, S. Fiber-reinforced concrete. In Developments in the Formulation and Reinforcement of Concrete; Elsevier: Amsterdam, The Netherlands, 2019; pp. 257–287. [Google Scholar]
- Ďubek, M.; Makýš, P.; Petro, M.; Ellingerová, H.; Antošová, N. The Development of Controlled Orientation of Fibres in SFRC. Materials 2021, 14, 4432. [Google Scholar] [CrossRef]
- Herrmann, H.; Goidyk, O.; Braunbrück, A. Influence of the Flow of Self-Compacting Steel Fiber Reinforced Concrete on the Fiber Orientations. In Short Fibre Reinforced Cementitious Composites and Ceramics; Advanced Structured Materials Book Series; Springer: Cham, Switzerland, 2019; Volume 95, pp. 97–110. [Google Scholar]
- Herrmann, H.; Goidyk, O.; Naar, H.; Tuisk, T.; Braunbrück, A. The influence of fibre orientation in self-compacting concrete on 4-point bending strength. Proc. Estonian Acad. Sci. 2019, 68, 337. [Google Scholar] [CrossRef]
- Krasnikovs, A.; Zaharevskis, V.; Kononova, O.; Lusis, V.; Galushchak, A.; Zaleskis, E. Fiber Concrete Properties Control by Fibers Motion Investigation in Fresh Concrete During Casting. In Proceedings of the 8th International DAAAM Baltic Conference, Industrial Engineering, Tallinn, Estonia, 19–21 April 2012; pp. 657–662. Available online: http://innomet.ttu.ee/daaam/proceedings/pdf/krasnikovs.pdf (accessed on 11 November 2021).
- Bao, C.; Bi, J.; Xu, D.; Guan, J.; Cheng, W.X. Numerical simulation of the distribution and orientation of steel fibres in SCC. Mag. Concr. Res. 2020, 72, 1102–1111. [Google Scholar] [CrossRef]
- Herrmann, H.; Braunbrück, A.; Tuisk, T.; Goidyk, O.; Naar, H. An Initial Report on the Effect of the Fiber Orientation on the Fracture Behavior of Steel Fiber Reinforced Self-Compacting Concrete. Adv. Struct. Mater. 2019, 95, 33–50. [Google Scholar] [CrossRef]
- Lapsa, V.; Krasnikovs, A.; Strauts, K. Process and Device for Manufacturing Fiberconcrete Non-Homogeneous Structural Elements. LV Patent LV14257, 20 April 2011. [Google Scholar]
- State-of-the-Art Report on Fiber Reinforced Concrete; ACI Committee: Farmington Hills, MI, USA, 2002; Volume 544.
- Khabaz, A. Analysis of sliding mechanism of straight steel fibers in concrete and determine the effect of friction. Arch. Civ. Mech. Eng. 2017, 17, 599–608. [Google Scholar] [CrossRef]
- Yoo, D.-Y.; Je, J.; Choi, H.-J.; Sukontasukkul, P. Influence of embedment length on the pullout behavior of steel fibers from ultra-high-performance concrete. Mater. Lett. 2020, 276, 128233. [Google Scholar] [CrossRef]
- Khabaz, A. Performance evaluation of corrugated steel fiber in cementitious matrix. Constr. Build. Mater. 2016, 128, 373–383. [Google Scholar] [CrossRef]
- Vu, D.-T.; Toutlemonde, F.; Terrade, B.; Marchand, P.; Bouteille, S. Numerical Modeling of the Steel Fiber Reinforced Concrete Behavior Under Combined Tensile and Shear Loading by a Micromechanical Model Taking into Account Fiber Orientation. In Fibre Reinforced Concrete: Improvements and Innovations II. BEFIB 2021; RILEM Bookseries; Springer: Cham, Switzerland, 2022; pp. 443–455. [Google Scholar]
- Dehghani, A.; Aslani, F. Effect of 3D, 4D, and 5D hooked-end type and loading rate on the pull-out performance of shape memory alloy fibres embedded in cementitious composites. Constr. Build. Mater. 2021, 273, 121742. [Google Scholar] [CrossRef]
- Abdallah, S.; Rees, D.W.A. Comparisons Between Pull-Out Behaviour of Various Hooked-End Fibres in Normal–High Strength Concretes. Int. J. Concr. Struct. Mater. 2019, 13, 27. [Google Scholar] [CrossRef]
- Sabuncuoglu, B.; Lomov, S.V. Micro-scale numerical study of fiber/matrix debonding in steel fiber composites. J. Eng. Fibers Fabr. 2020, 15, 1558925020910726. [Google Scholar] [CrossRef]
- Deng, F.; Ding, X.; Chi, Y.; Xu, L.; Wang, L. The pull-out behavior of straight and hooked-end steel fiber from hybrid fiber reinforced cementitious composite: Experimental study and analytical modelling. Compos. Struct. 2018, 206, 693–712. [Google Scholar] [CrossRef]
- Ogunbayo, B.; Aigbavboa, C. Experimental Investigation of Concrete Block Walls Compressive Strength Using a Non-Destructive Test; Springer Nature: Berlin/Heidelberg, Germany, 2021; pp. 393–397. [Google Scholar] [CrossRef]
- Tatarinov, A.; Shishkin, A.; Mironovs, V. Correlation between ultrasound velocity, density and strength in metal-ceramic composites with added hollow spheres. IOP Conf. Ser. Mater. Sci. Eng. 2019, 660, 12040. [Google Scholar] [CrossRef]
- Mironov, V.; Pundiene, I.; Tatarinov, A.; Baroninsh, J. A Study of Metal-Cement Composites with Additives. Constr. Sci. 2014, 16, 16–20. [Google Scholar] [CrossRef][Green Version]
- Khabaz, A. Experimental and Numerical Investigation of Single Fiber Pull-Out Tests of Steel Macro-Fiber and Glass Micro-Fiber in a Cementitious Matrix. J. Test. Evaluation 2022, 50, 20200658. [Google Scholar] [CrossRef]
- Macanovskis, A.; Lukasenoks, A.; Krasnikovs, A.; Stonys, R.; Lusis, V. Composite Fibers in Concretes with Various Strengths. ACI Mater. J. 2018, 115, 647–652. [Google Scholar] [CrossRef]
- Da Silva, C.N.; Ciambella, J.; Barros, J.; Valente, T.D.S.; Costa, I. A multiscale model for optimizing the flexural capacity of FRC structural elements. Compos. Part B Eng. 2020, 200, 108325. [Google Scholar] [CrossRef]
- Kononova, O.; Lusis, V.; Galushchak, A.; Krasnikovs, A.; Macanovskis, A. Numerical modeling of fiber pull-out mi-cromechanics in concrete matrix composites. J. Vibroeng. 2021, 14, 1852–1861. [Google Scholar]
- Lusis, V. Effect of short fibers orientation on mechanical properties of composite material—Fiber reinforced concrete. J. Civ. Eng. Manag. 2017, 23, 1091–1099. [Google Scholar] [CrossRef]
- Medina, N.F.A.; Lameiras, R.D.M.; Dos Santos, A.C.P.; Willrich, F.L. Effect of Distribution and Orientation of Fibers on the Post-cracking Behavior of Steel Fiber Reinforced Self-compacting Concrete in Small Thickness Elements. In Fibre Reinforced Concrete: Improvements and Innovations. BEFIB 2020; RILEM Bookseries; Springer: Cham, Switzerland, 2021; pp. 279–289. [Google Scholar] [CrossRef]
- Dvorkin, L.; Zhitkovsky, V.; Ribakov, Y.; Dvorkin, O. A method for optimal design of steel fiber reinforced concrete composition. Mater. Des. 2011, 32, 3254–3262. [Google Scholar] [CrossRef]
- Bleive, L.L.; Lusis, V. Experimental study and numerical modelling for flexural capacity of frc structural elements. Environ. Technol. Resour. Proc. Int. Sci. Pract. Conf. 2021, 3, 30–35. [Google Scholar] [CrossRef]
- Babych, E.; Andriichuk, O.; Ninichuk, M.; Kysliuk, D. Experimental Research of Strength Characteristics of Continuous Reinforced Concrete Beams with Combined Reinforcement, and Modelling Their Work by the Finite Element Method. In Proceedings of EcoComfort 2020; Lecture Notes in Civil Engineering; Springer: Cham, Switzerland, 2021; pp. 18–25. [Google Scholar]
- Raju, R.A.; Lim, S.; Akiyama, M.; Kageyama, T. Effects of concrete flow on the distribution and orientation of fibers and flexural behavior of steel fiber-reinforced self-compacting concrete beams. Constr. Build. Mater. 2020, 262, 119963. [Google Scholar] [CrossRef]
- Li, L.; Xia, J.; Chin, C.; Jones, S. Fibre Distribution Characterization of Ultra-High Performance Fibre-Reinforced Concrete (UHPFRC) Plates using Magnetic Probes. Materials 2020, 13, 5064. [Google Scholar] [CrossRef] [PubMed]


| Fibre Type | Length, Lf, mm | Diameter, df, mm | Aspect Ratio, Lf/df | Density, kg/m3 | Modulus of Elasticity, GPa |
|---|---|---|---|---|---|
| Dramix 3D RC 80/30BP (Bekaert, Belgium) | 30 | 0.38 | 79 | 7800 | 200 |
| Composition | Weight, kg/m3 |
|---|---|
| Broken stone 4/8 mm (Saulkalne, Latvia) | 900 |
| Quartz Sand 0.3/2.5 mm (Saulkalne, Latvia) | 620 |
| Quartz Sand 0–1 mm (Saulkalne, Latvia) | 120 |
| Dolomite flour (Saulkalne, Latvia) | 75 |
| Portland cement CEM I 42.5N (SCHWENK Latvia Ltd., Latvia) | 380 |
| Silica Fume, grade 971U (Elkem, Norway) | 25 |
| Tap water, H2O | 170 |
| Superplasticizer “Sikament 190” (Sika Baltic SIA, Latvia) | 4 |
| Fibers, steel 3D Dramix RC 80/30BP (Bekaert, Belgium) | 60 (for all specimens A1–A8) |
| Group No. | SF Concentration in Concrete Layers of the Specimen (From the Bottom up) |
|---|---|
| A1 | 100 mm × 100 mm—60 kg/m3 |
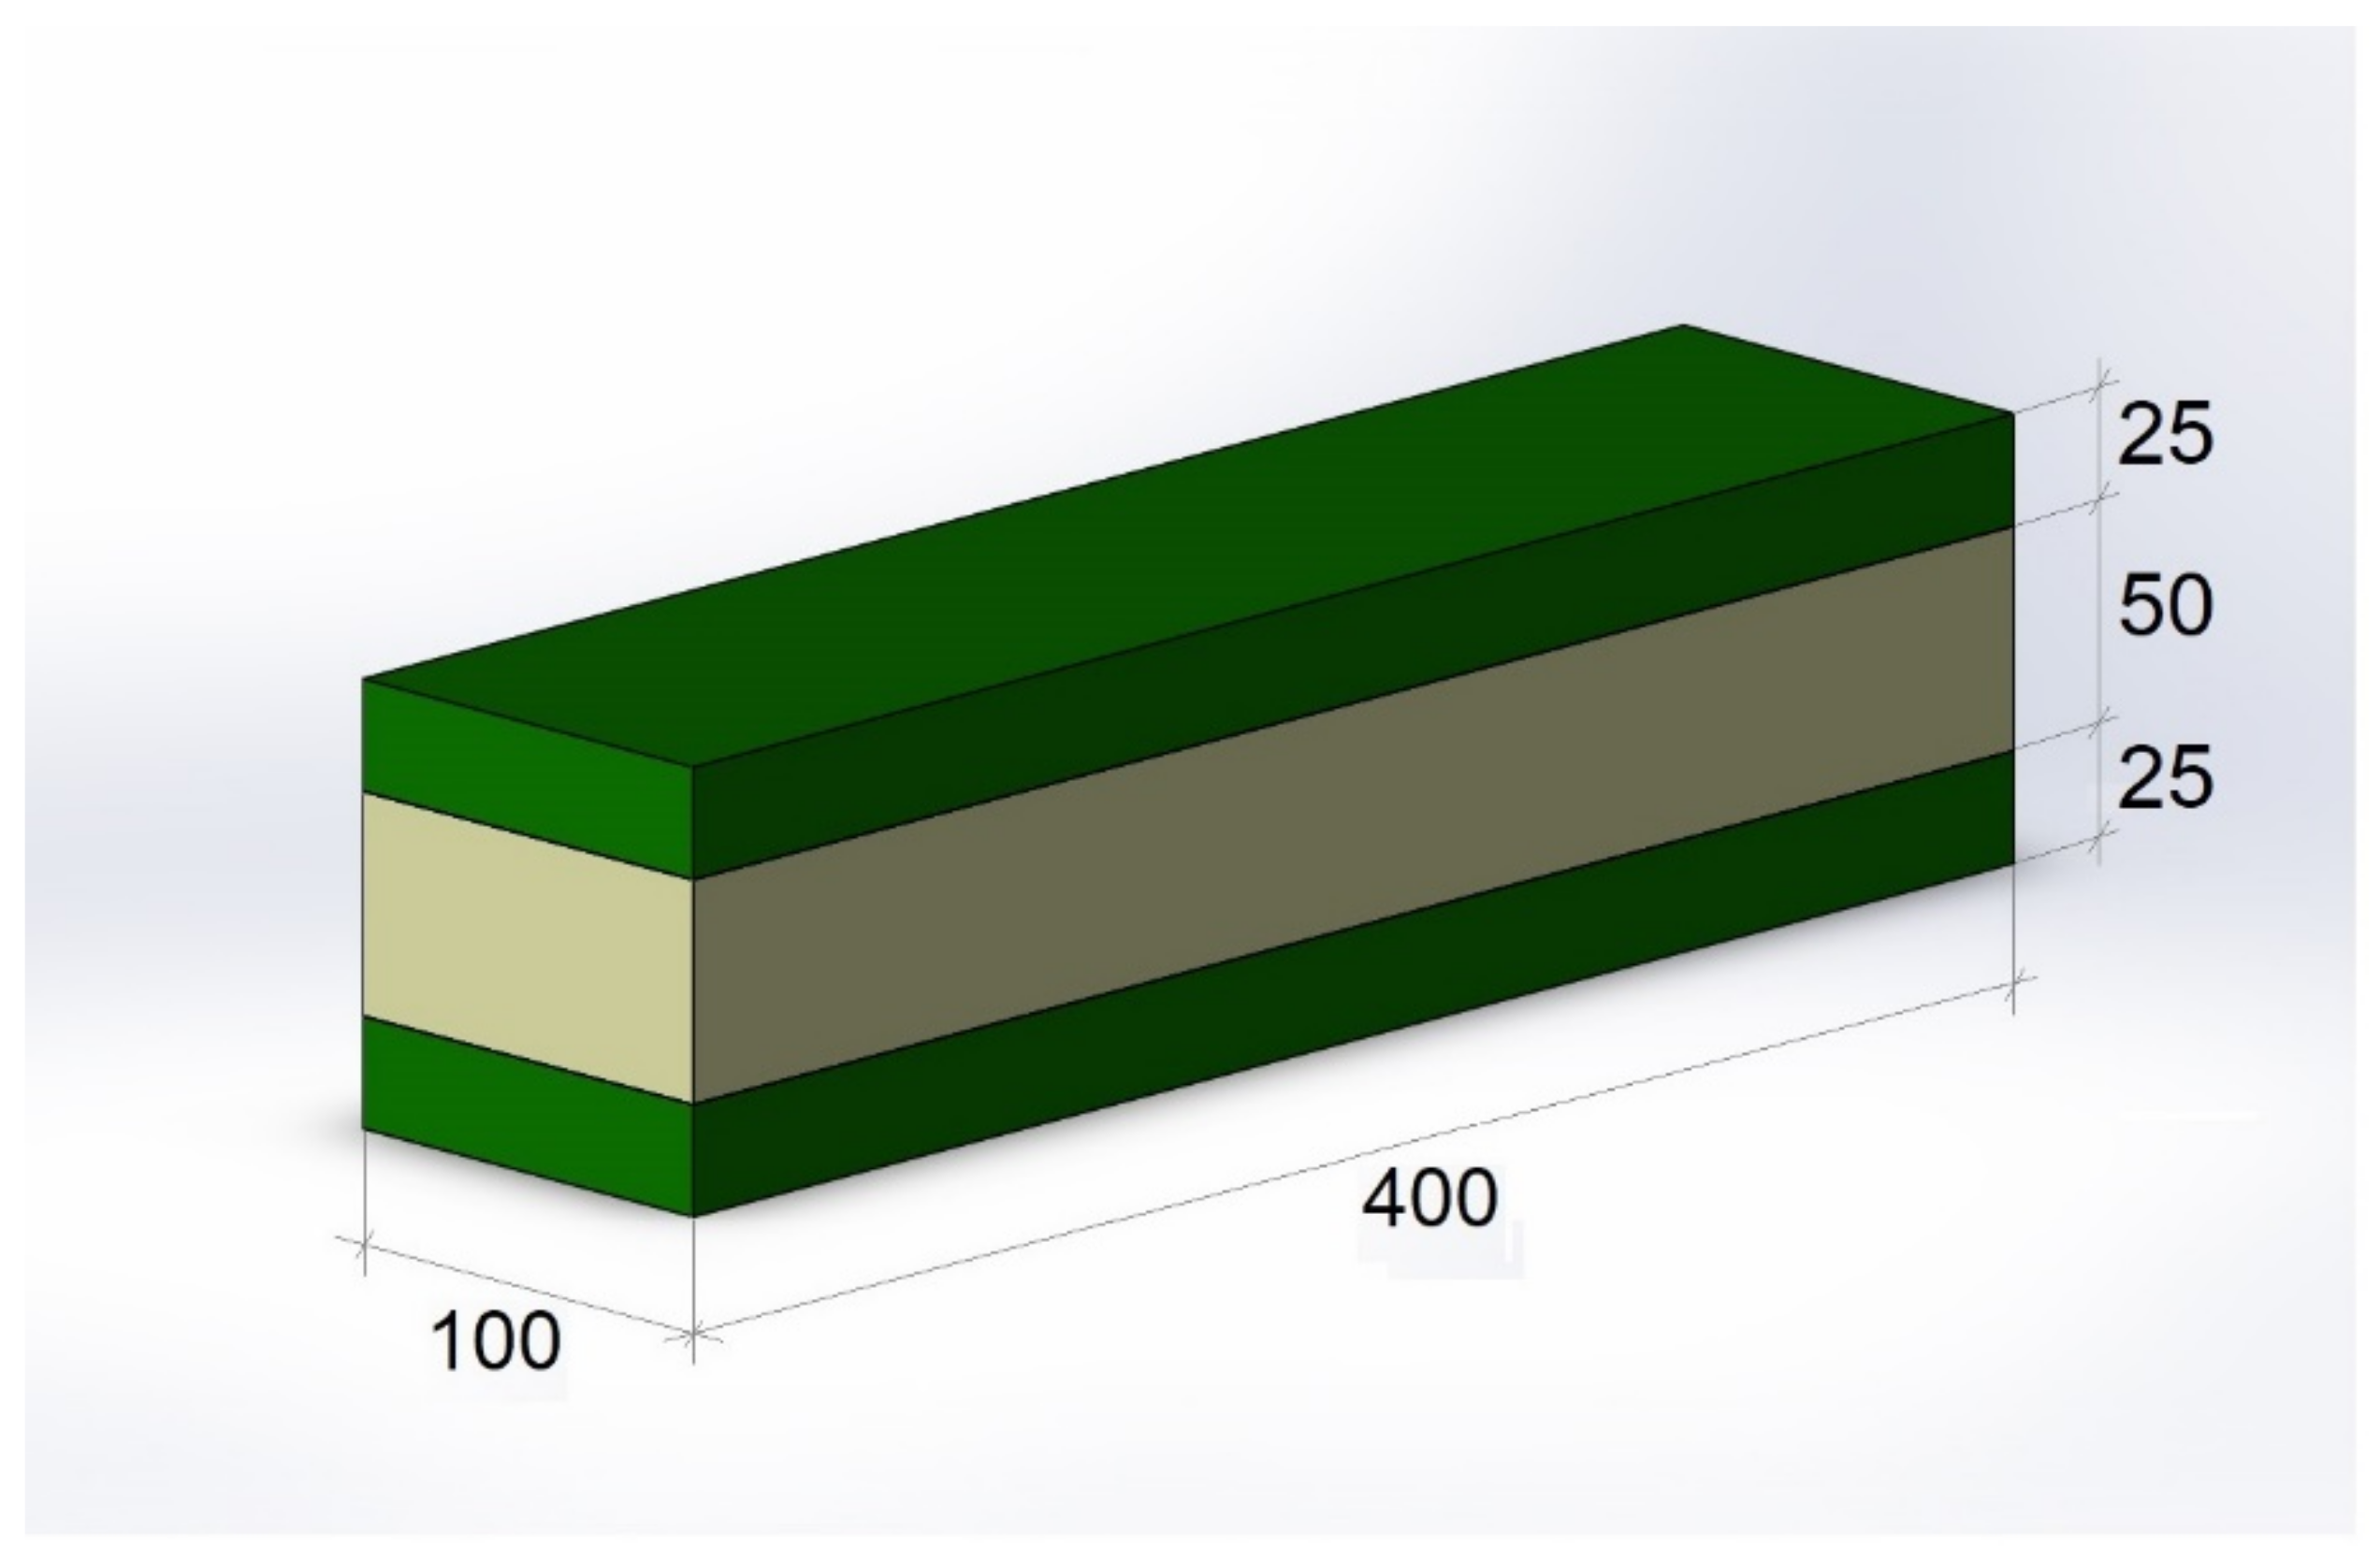
| A2 | 1 layer (from the bottom) 25 mm × 100 mm—120 kg/m3 2 layer (from the bottom) 50 mm × 100 mm—concrete without SF 3 layer (from the bottom) 25 mm × 100 mm—120 kg/m3 |
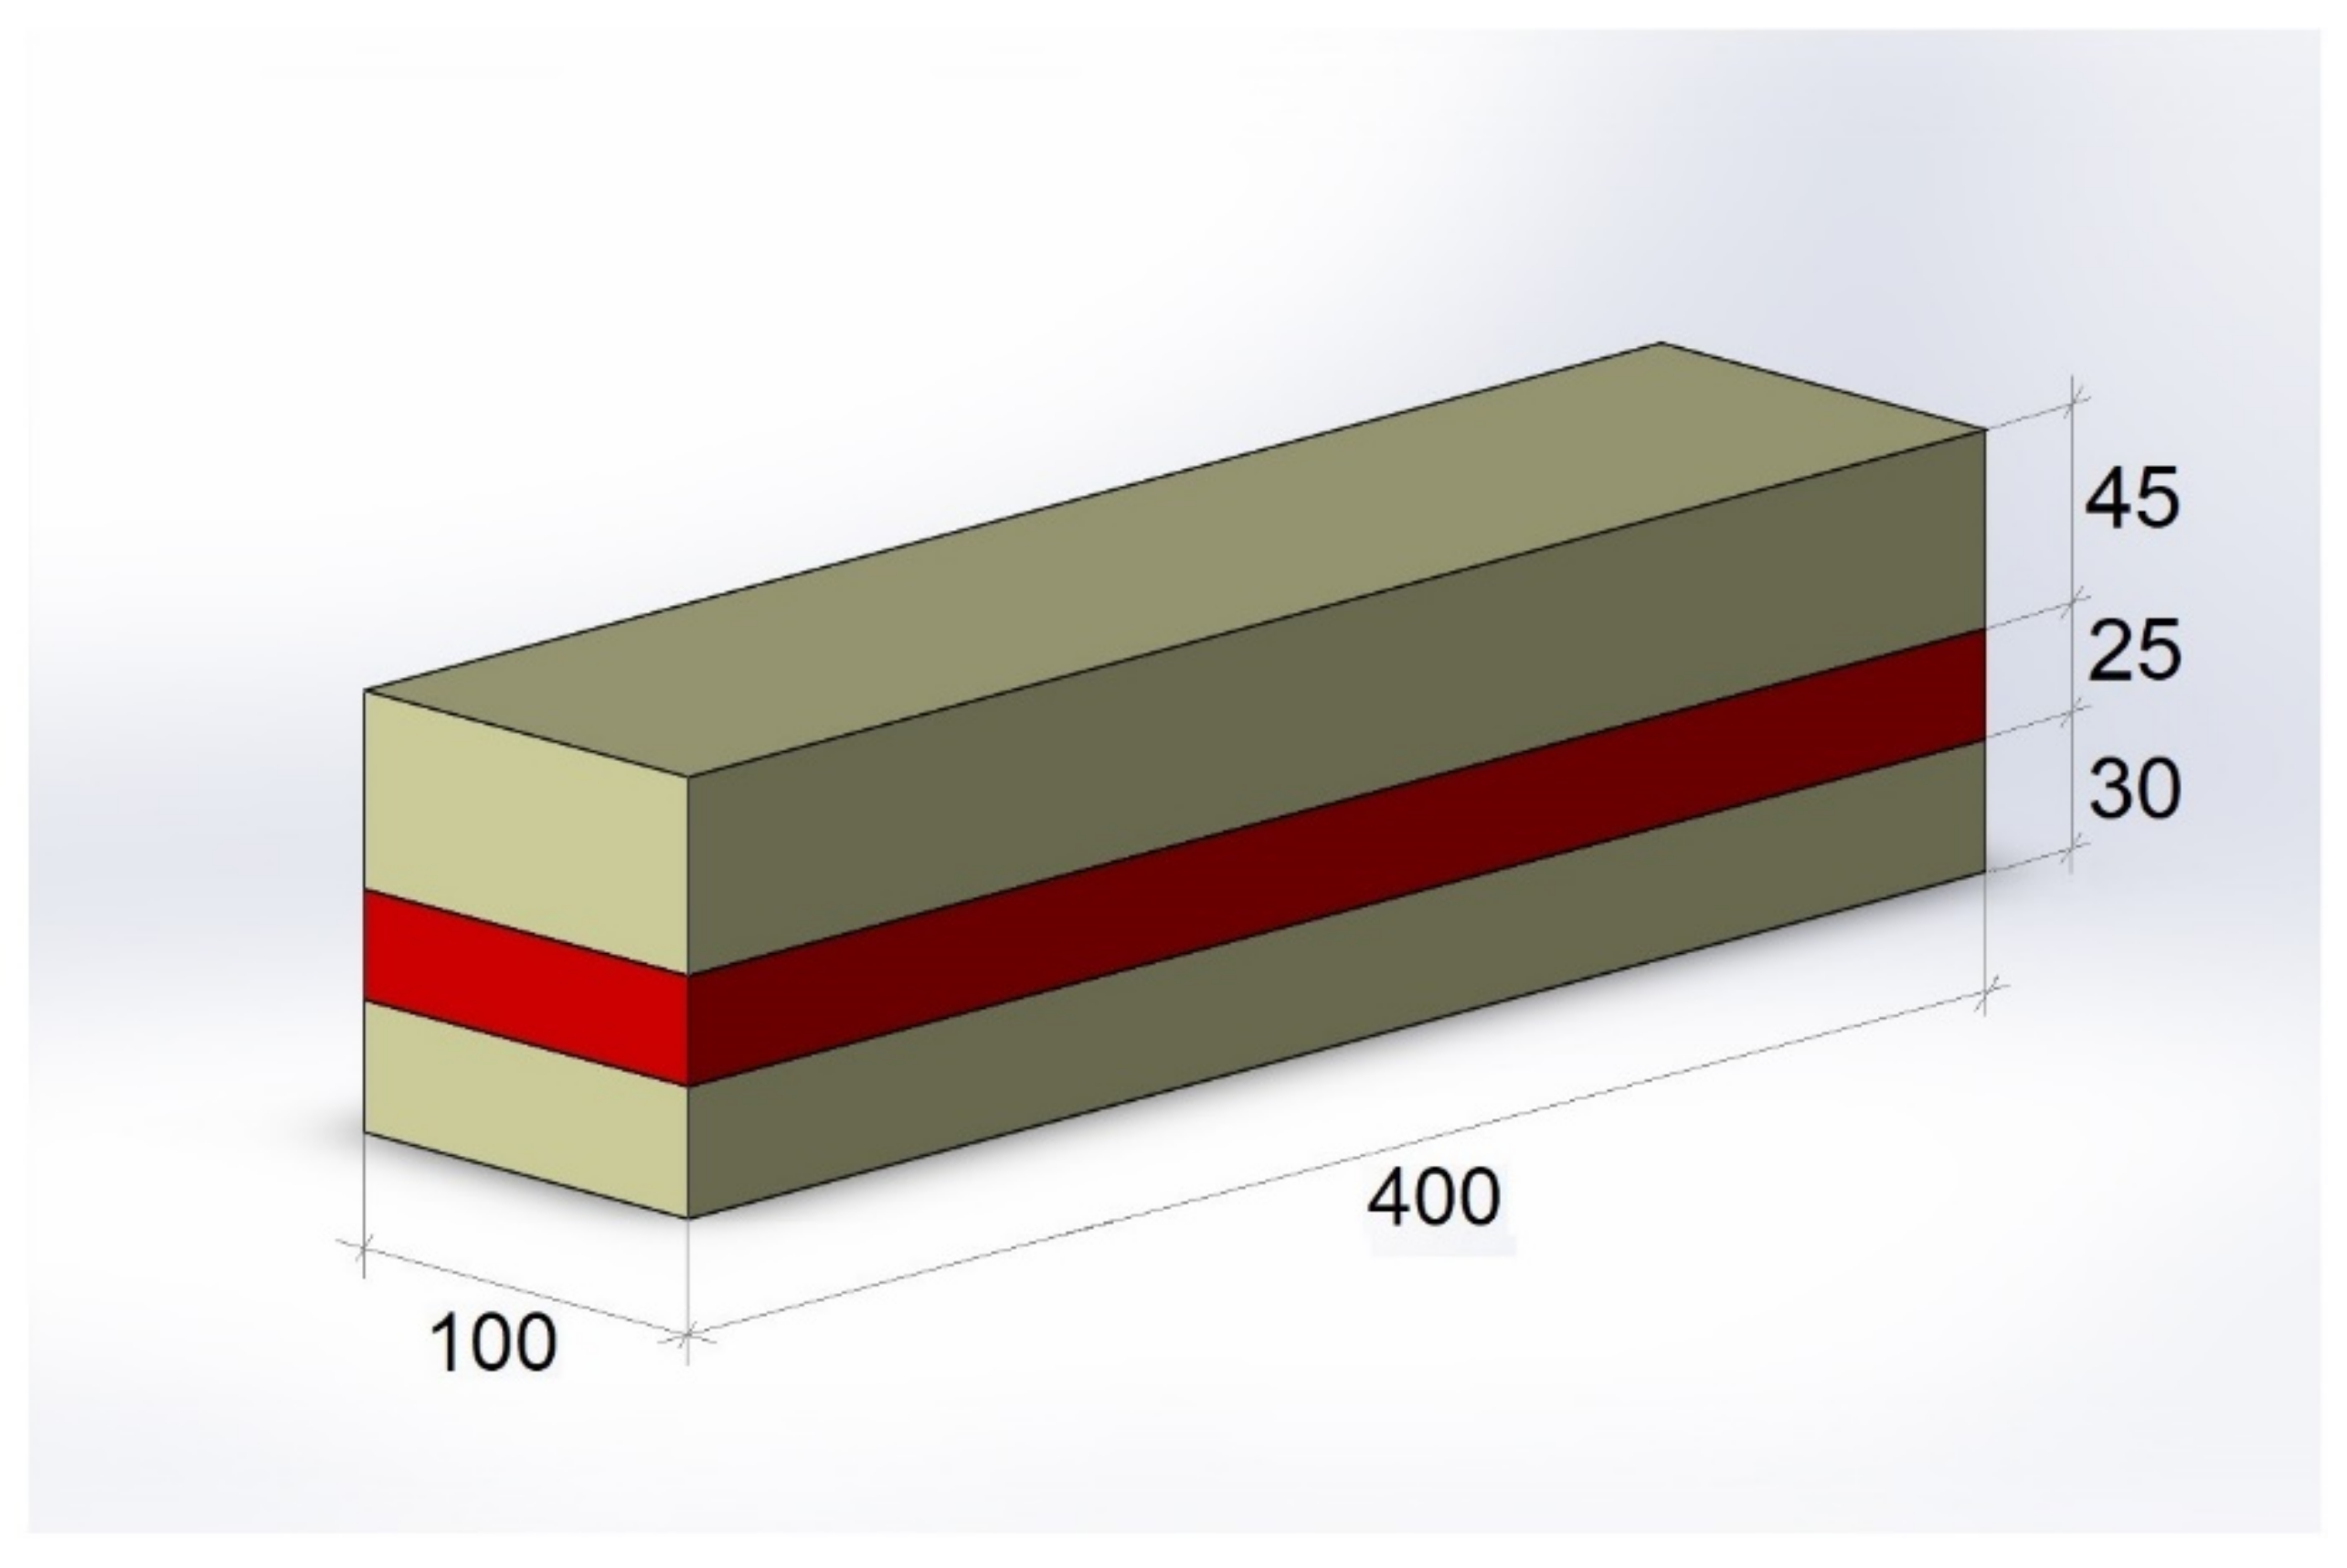
| A3 | 1 layer (from the bottom) 30 mm × 100 mm—concrete without SF 2 layer (from the bottom) 25 mm × 100 mm—240 kg/m3 3 layer (from the bottom) 45 mm × 100 mm—concrete without SF |
| A4 | 1 layer (from the bottom) 25 mm × 100 mm—160 kg/m3 2 layer (from the bottom) 25 mm × 100 mm—80 kg/m3 3 layer (from the bottom) 50 mm × 100 mm—concrete without SF |
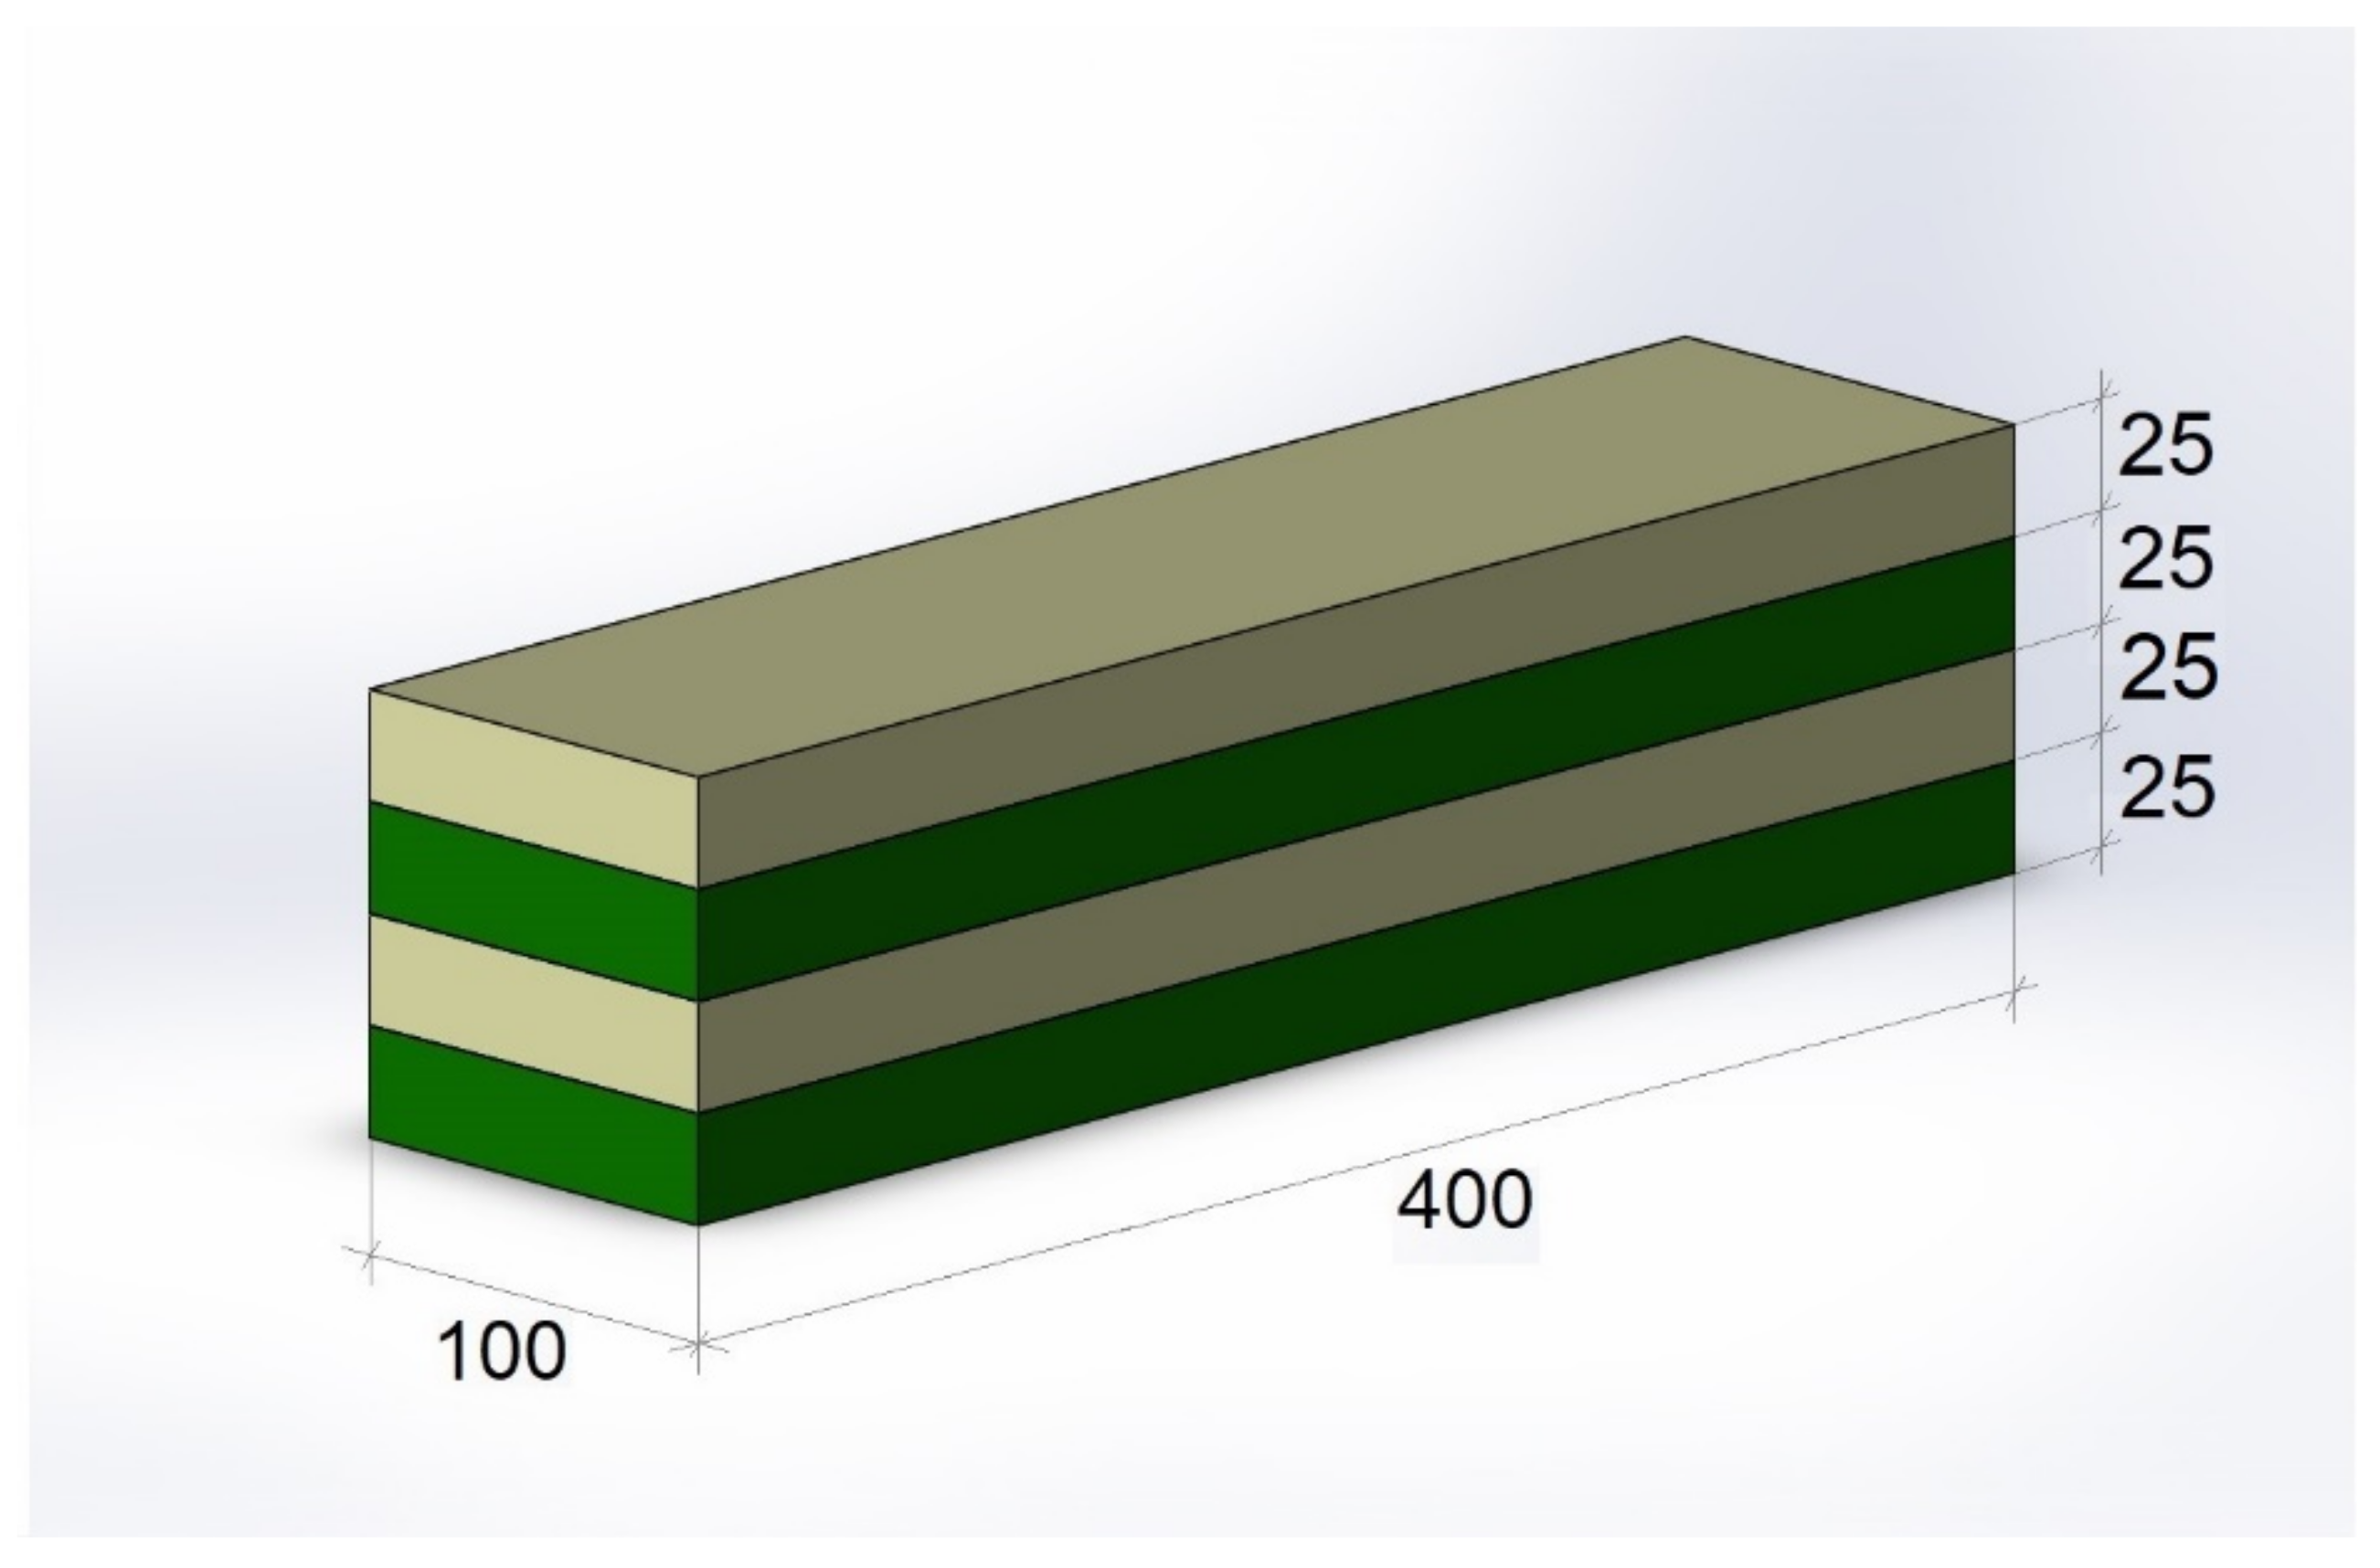
| A5 | 1 layer (from the bottom) 25 mm × 100 mm—120 kg/m3 2 layer (from the bottom) 25 mm × 100 mm—concrete without SF 3 layer (from the bottom) 25 mm × 100 mm—120 kg/m3 4 layer (from the bottom) 25 mm × 100 mm—concrete without SF |
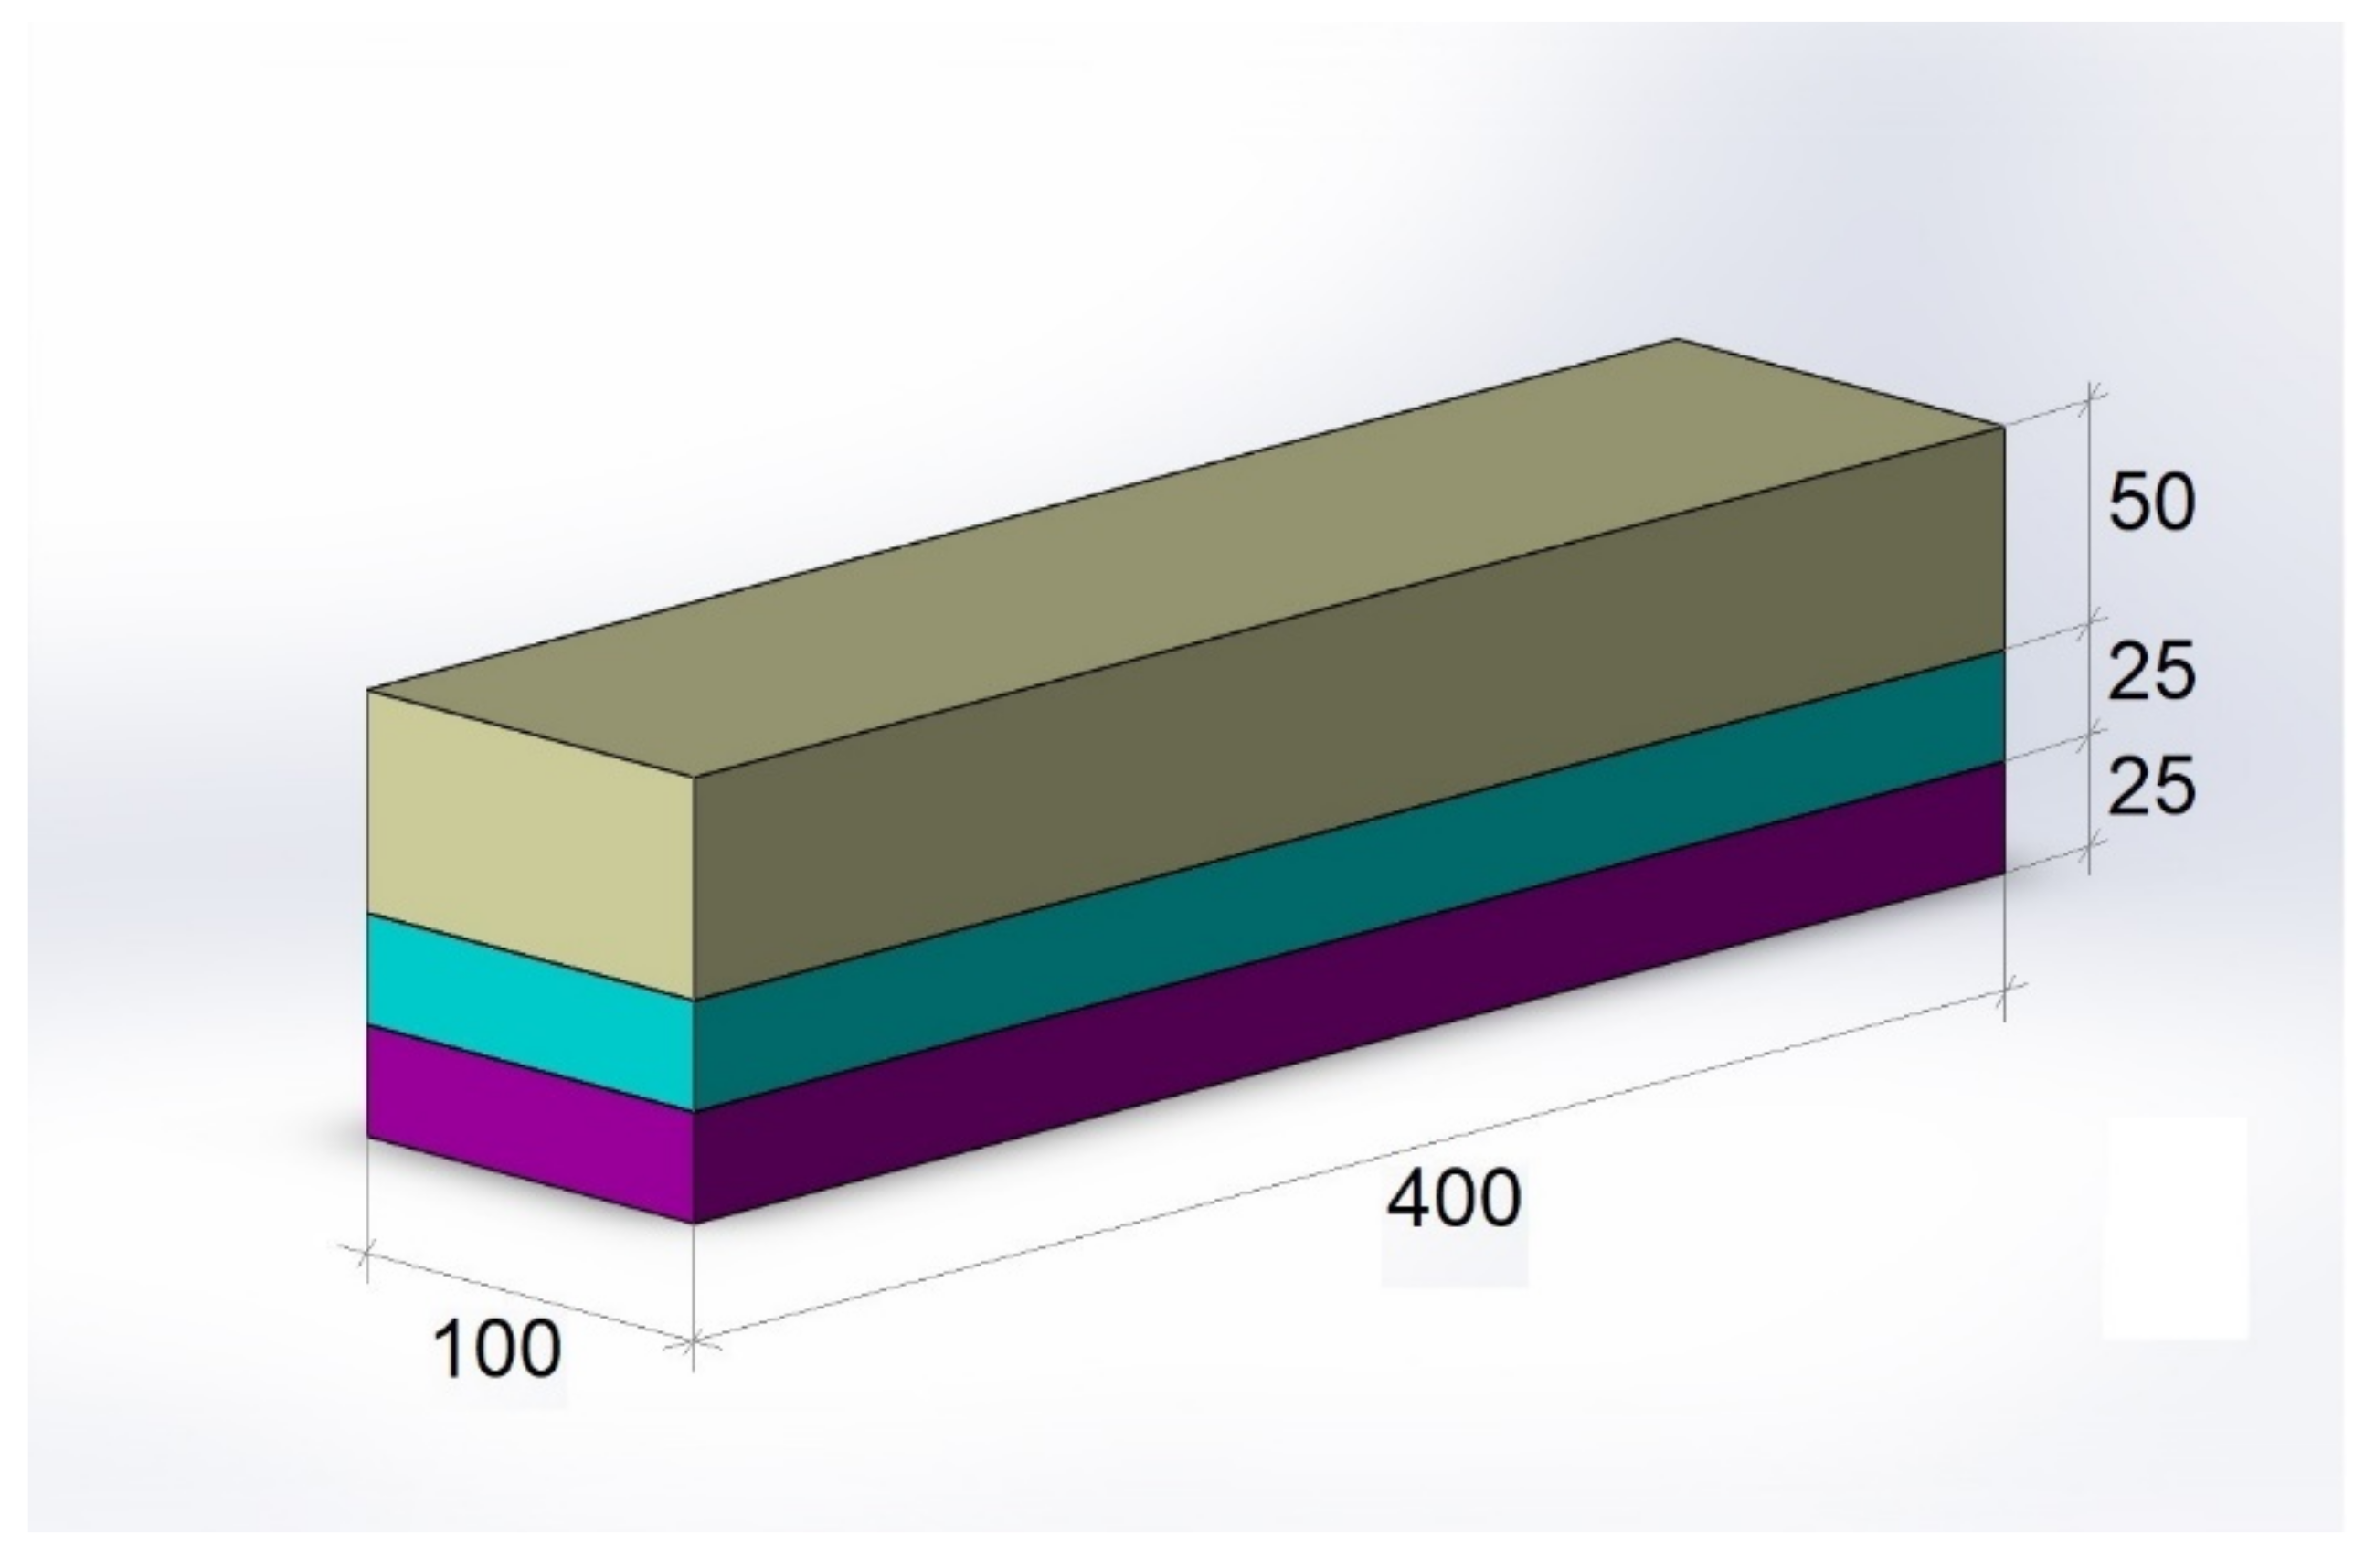
| A6 | 1 layer (from the bottom) 50 mm × 100 mm—120 kg/m3 2 layer (from the bottom) 50 mm × 100 mm—concrete without SF |
| A7 | 1 layer (from the bottom) 25 mm × 100 mm—80 kg/m3 2 layer (from the bottom) 25 mm × 100 mm—80 kg/m3 3 layer (from the bottom) 25 mm × 100 mm—80 kg/m3 4 layer (from the bottom) 25 mm × 100 mm—concrete without SF |
| A8 | 1 layer (from the bottom) 25 mm × 100 mm—240 kg/m3 2 layer (from the bottom) 75 mm × 100 mm—concrete without SF |
Publisher’s Note: MDPI stays neutral with regard to jurisdictional claims in published maps and institutional affiliations. |
© 2021 by the authors. Licensee MDPI, Basel, Switzerland. This article is an open access article distributed under the terms and conditions of the Creative Commons Attribution (CC BY) license (https://creativecommons.org/licenses/by/4.0/).
Share and Cite
Lusis, V.; Kononova, O.; Macanovskis, A.; Stonys, R.; Lasenko, I.; Krasnikovs, A. Experimental Investigation and Modelling of the Layered Concrete with Different Concentration of Short Fibers in the Layers. Fibers 2021, 9, 76. https://doi.org/10.3390/fib9120076
Lusis V, Kononova O, Macanovskis A, Stonys R, Lasenko I, Krasnikovs A. Experimental Investigation and Modelling of the Layered Concrete with Different Concentration of Short Fibers in the Layers. Fibers. 2021; 9(12):76. https://doi.org/10.3390/fib9120076
Chicago/Turabian StyleLusis, Vitalijs, Olga Kononova, Arturs Macanovskis, Rimvydas Stonys, Inga Lasenko, and Andrejs Krasnikovs. 2021. "Experimental Investigation and Modelling of the Layered Concrete with Different Concentration of Short Fibers in the Layers" Fibers 9, no. 12: 76. https://doi.org/10.3390/fib9120076
APA StyleLusis, V., Kononova, O., Macanovskis, A., Stonys, R., Lasenko, I., & Krasnikovs, A. (2021). Experimental Investigation and Modelling of the Layered Concrete with Different Concentration of Short Fibers in the Layers. Fibers, 9(12), 76. https://doi.org/10.3390/fib9120076