Article

Environmentally Benign Phytic Acid-Based Nanocoating for Multifunctional Flame-Retardant/Antibacterial Cotton

1
Department of Textile Chemistry and Ecology, University of Zagreb Faculty of Textile Technology, Prilaz baruna Filipovica 28a, 10000 Zagreb, Croatia
2
Laboratory for Chemistry and Environmental Protection, Faculty of Mechanical Engineering, University of Maribor, Smetanova 1, 2609 Maribor, Slovenia
3
Department for Typing and Monitoring the Causes of Nosocomial Infections, University Hospital Centre Zagreb, Kispaticeva 12, 10000 Zagreb, Croatia
4
Department of Textiles, Faculty of Technology and Metallurgy, University Ss. Cyril and Methodius, Ruger Boskovic 16, 1000 Skopje, North Macedonia
5
Department of Mechanical Engineering, Texas A&M University, 3123 TAMU, College Station, TX 77843, USA
*
Author to whom correspondence should be addressed.
Fibers 2021, 9(11), 69; https://doi.org/10.3390/fib9110069
Submission received: 12 October 2021 / Revised: 28 October 2021 / Accepted: 29 October 2021 / Published: 31 October 2021

Abstract

:
Environmentally benign layer-by-layer (LbL) deposition was used to obtain flame-retardant and antimicrobial cotton. Cotton was coated with 8, 10, and 12 phytic acid (PA) and chitosan (CH)-urea bilayers (BL) and then immersed into copper (II) sulfate (CuSO4) solution. Our findings were that 12 BL of PA/CH-urea + Cu2+ were able to stop flame on cotton during vertical flammability testing (VFT) with a limiting oxygen index (LOI) value of 26%. Microscale combustion calorimeter (MCC) data showed a reduction of peak heat release rates (pHRR) of more than 61%, while the reduction of total heat release (THR) was more than 54%, relative to untreated cotton. TG-IR analysis of 12 BL-treated cotton showed the release of water, methane, carbon dioxide, carbon monoxide, and aldehydes, while by adding Cu2+ ions, the treated cotton produces a lower amount of methane. Treated cotton also showed no levoglucosan. The intumescent behavior of the treatment was indicated by the bubbled structure of the post-burn char. Antibacterial testing showed a 100% reduction of Klebsiella pneumoniae and Staphylococcus aureus. In this study, cotton was successfully functionalized with a multifunctional ecologically benign flame-retardant and antibacterial nanocoating, by means of LbL deposition.

1. Introduction

Cotton is one of the most frequently used textile materials for a variety of products, such as medical textiles, underwear, sportswear, fashion garments, footwear, safety clothes, etc. [1]. The reason why cotton is such a favorite material is its softness and water uptake, enabled by highly hydrophilic and reactive hydroxyl groups in the molecule of cellulose. The reactivity of these groups, however, makes cotton fabric very flammable and prone to microbial growth [2]. These properties are undesirable, especially for textiles used for protective clothing. Commercially available compounds to reduce the flammability of cotton and cotton-based materials are halogen, organo-halogen, antimony organo-halogen, and organophosphorus [3]. Halogens, as well as antimony compounds, are known to be toxic to the environment as well as humans, and the inhalation of the volatile gases generated in a fire can be fatal. Organophosphorus flame retardants (FRs) have been considered safe for many years [4]. To stop or at least reduce bacterial growth, cotton is treated with different antibacterial compounds, such as chitosan, citric acid, metal particles and metal salts, phenyl derivates, quaternary ammonium compounds, triclocarban and triclosan. However, phenyl derivates, triclocarban and triclosan are toxic [5]. Durable FR, as well as antibacterial finishes for cotton, are commercially applied by a pad-dry-cure process. The process is not ecological due to the release of toxic formaldehyde derivatives during production and usage [6,7]. The greener, formaldehyde-free alternatives for curing FRs and antibacterial finishes on cellulosic fabrics are polycarboxylic acid-based curing agents [8,9]. Another environmentally friendly approach could be layer-by-layer (LbL) deposition, which uses deionized water as a solvent for various active compounds (polymers, nanoparticles, small molecules, etc.) and is applicable to nearly any charged surface, such as textiles [10,11]. In LbL deposition, the charged fabric is immersed into oppositely charged polyelectrolyte solutions to deposit a layered nanocoating in the form of layers [12]. The process can be repeated as many times as necessary to obtain textiles with desirable properties such as flame retardancy [13] and antimicrobial action [14], or even multifunctional properties such as flame retardancy and antimicrobial action [15], hydrophobicity–flame retardancy–conductivity [16], and hydrophobicity–flame retardancy, etc. [17]. In a previous study, cotton was successfully deposited with anionic PA solution and cationic CH-urea solution by means of the LbL technique, forming 8, 10, 12, and 15 BL with effective FR properties that are comparable to commercial FR finishes of cotton [18]. In the second study, cotton was successfully LbL-deposited with anionic PA and cationic CH (with the addition of CuSO4) to build an effective antibacterial 2- and 4-BL assembly that was able to eliminate 100% of Gram-negative Klebsiella pneumoniae and Gram-positive Staphylococcus aureus [19].
In the present study, 8, 10, and 12 BL of PA and CH-urea were deposited on cotton and the LbL-treated samples were then immersed in a 2% Cu2+ solution. The resulting cotton fabric was successfully functionalized with multifunctional ecologically benign flame-retardant and antibacterial nanocoating by means of LbL deposition. In the tests, 12 BL were sufficient for the self-extinguishing of cotton and to kill almost 100% of the bacteria.

2. Materials and Methods

USDA Southern Regional Research Center (New Orleans, LA, USA) supplied the chemically bleached cotton fabric (119 g/m2). Sigma Aldrich (Milwaukee, WI, USA) supplied the branched polyethyleneimine (BPEI, M = 25,000 g/mol, ≤ 1% water), urea, chitosan (CH) powder (M ~ 190,000–310,000 g/mol, 75–85% deacetylated), copper (II) sulfate pentahydrate (CuSO4 × 5H2O), hydrochloric acid (HCl) and sodium hydroxide (NaOH). Biosynth Carbosynth Ltd. (Compton, UK) supplied the phytic acid dodecasodium salt hydrate (PA, M ~ 923.82 g/mol, purity ≥ 75%). For the preparation of all polyelectrolyte solutions, as well as for the rinsing of fabrics, deionized (DI) water (18.2 mW) was used. A cationic BPEI solution (5 wt %) was prepared for prime layering of the cotton. An anionic PA solution (2 wt %) and a cationic CH solution (0.5 wt %) were magnetically stirred for 24 h. Urea (10 wt %) was added to the CH solution after 24 h. Cu2+ solution (2 wt %) was prepared by adding CuSO4 × 5H2O into DI. Prior to the LbL deposition, the pH of all solutions (except BPEI) was adjusted to 4, with 1 M NaOH or 1 M HCl. Six cotton samples were first immersed into the BPEI solution and then alternately immersed into the PA/CH-urea solutions, depositing 8, 10, and 12 BL. At the end of the process, the samples were immersed in 2% Cu2+ solution to achieve antibacterial properties. The whole process is shown in Figure 1.
The immersion time was 5 min for the first layer (BPEI/PA/CH) and 1 min for each additional layer (PA/CH). Between each immersion step into the polyelectrolyte solution, the fabric was rinsed in DI water. The samples were dried at 80 °C for 24 h at the end of the LbL deposition.
The weight gains (%) of samples were calculated according to the following equation:
weight gain (%) = [m (treated) − m (untreated)]/m (untreated) × 100
Limiting oxygen index (LOI) measurements were performed according to ISO 4589-2:2017 with a Concept Equipment Oxygen Index Module (Poling, UK) [20]. Vertical flame testing (VFT) was carried out according to ASTM D6413/D6413M-15 [21].
Measurements of heat release were performed by means of a Govmark MCC-2 (Heilbronn, Germany) according to ASTM D7309−21a, Method A [22]. The samples were heated from 75 °C to 650 °C with a heating rate of 1 C°/min (flow rate: 100 mL/min). Three replicate samples were measured for the calculation of standard deviations.
Thermogravimetric analysis (TGA) was carried out with a PerkinElmer Pyris 1 (Shelton, CT, USA). All samples were heated from 50 to 850 °C, with a heating rate of 30 C°/min in air (flow rate: 30 mL/min). The TG data were analyzed via Pyris 1 software.
Evolved gas analysis was performed via a PerkinElmer Spectrum 100 FT-IR spectrometer with TL 8000 TG-IR interface (Shelton, CT, USA) in absorbance, wavelength range 4000–450 cm−1, resolution 4.0 cm−1, and with a 27-min heating interval. The spectra were normalized and analyzed via the KnowItAll Informatics System 2020, IR spectroscopy edition (John Wiley & Sons, Ltd., Hoboken, NJ, USA) and available literature.
The morphology of the samples, before and after performing VFT, was analyzed with a Tescan MIRA LMU FE-SEM (SE detector, 5 kV, Brno, Czech Republic). All samples were coated with 5 nm of chromium (Q150T ES Sputter Coater, Quorum Technologies, Laughton, UK), with the exception of the char.
The chemical analysis of post-burn char was studied using a Tescan Mira LMU FE-SEM (backscattered electron BSE detector, 10 and 20 kV) equipped with an energy-dispersive X-ray spectroscopy (EDS) detector (Oxford Instruments, Oxford, UK).
Antimicrobial testing was performed according to AATCC Test Method 100-2019 against Gram-negative Klebsiella pneumoniae and Gram-positive Staphylococcus aureus [23]. The percentage of reduction of the bacteria was calculated according to the following equation:
R (%) = (C − A)/C × 100
where R (%) is reduction, C is the number of bacteria recovered from the inoculated untreated control specimen swatches in the jar at “zero” contact time, and A is the number of bacteria recovered from the inoculated treated test specimen swatches in the jar, incubated over the contact period of 24 h.

3. Results and Discussion

As presented in Table 1, cotton samples were coated with 8, 10, and 12 BL of PA/CH-urea. The weight gain increases linearly with the number of bilayers. Limiting oxygen index (LOI) values also follow linear growth. The resulting weight gains are consistent with the weight gains obtained in a previous study following linear growth from 12% (8 BL) to 18% (12 BL) [18]. The LOI value of untreated cotton is 18, whereas the values of treated cotton increase from 21.5% (8 BL) to 24.5% (12 BL). Compared with the findings of the previous study, the results of the LOI values are lower by approx. 4.3% [18]. The samples that were immersed in Cu2+ solution at the end of LbL deposition show a slight increase of LOI values (from 23.5% for 8 BL to 26.0% for 12 BL). The commercial requirements of LOI for durable FR cotton are 28% or above [24].
The results of the vertical flame test (VFT) show that only cotton treated with 12 BL passed the test, with a char length of 6.7 cm for cotton treated with PA/CH-urea and 6.5 cm for 12 BL cotton immersed in Cu2+ solution, as shown in Table 2. The results of VFT correlate with measured LOI values.
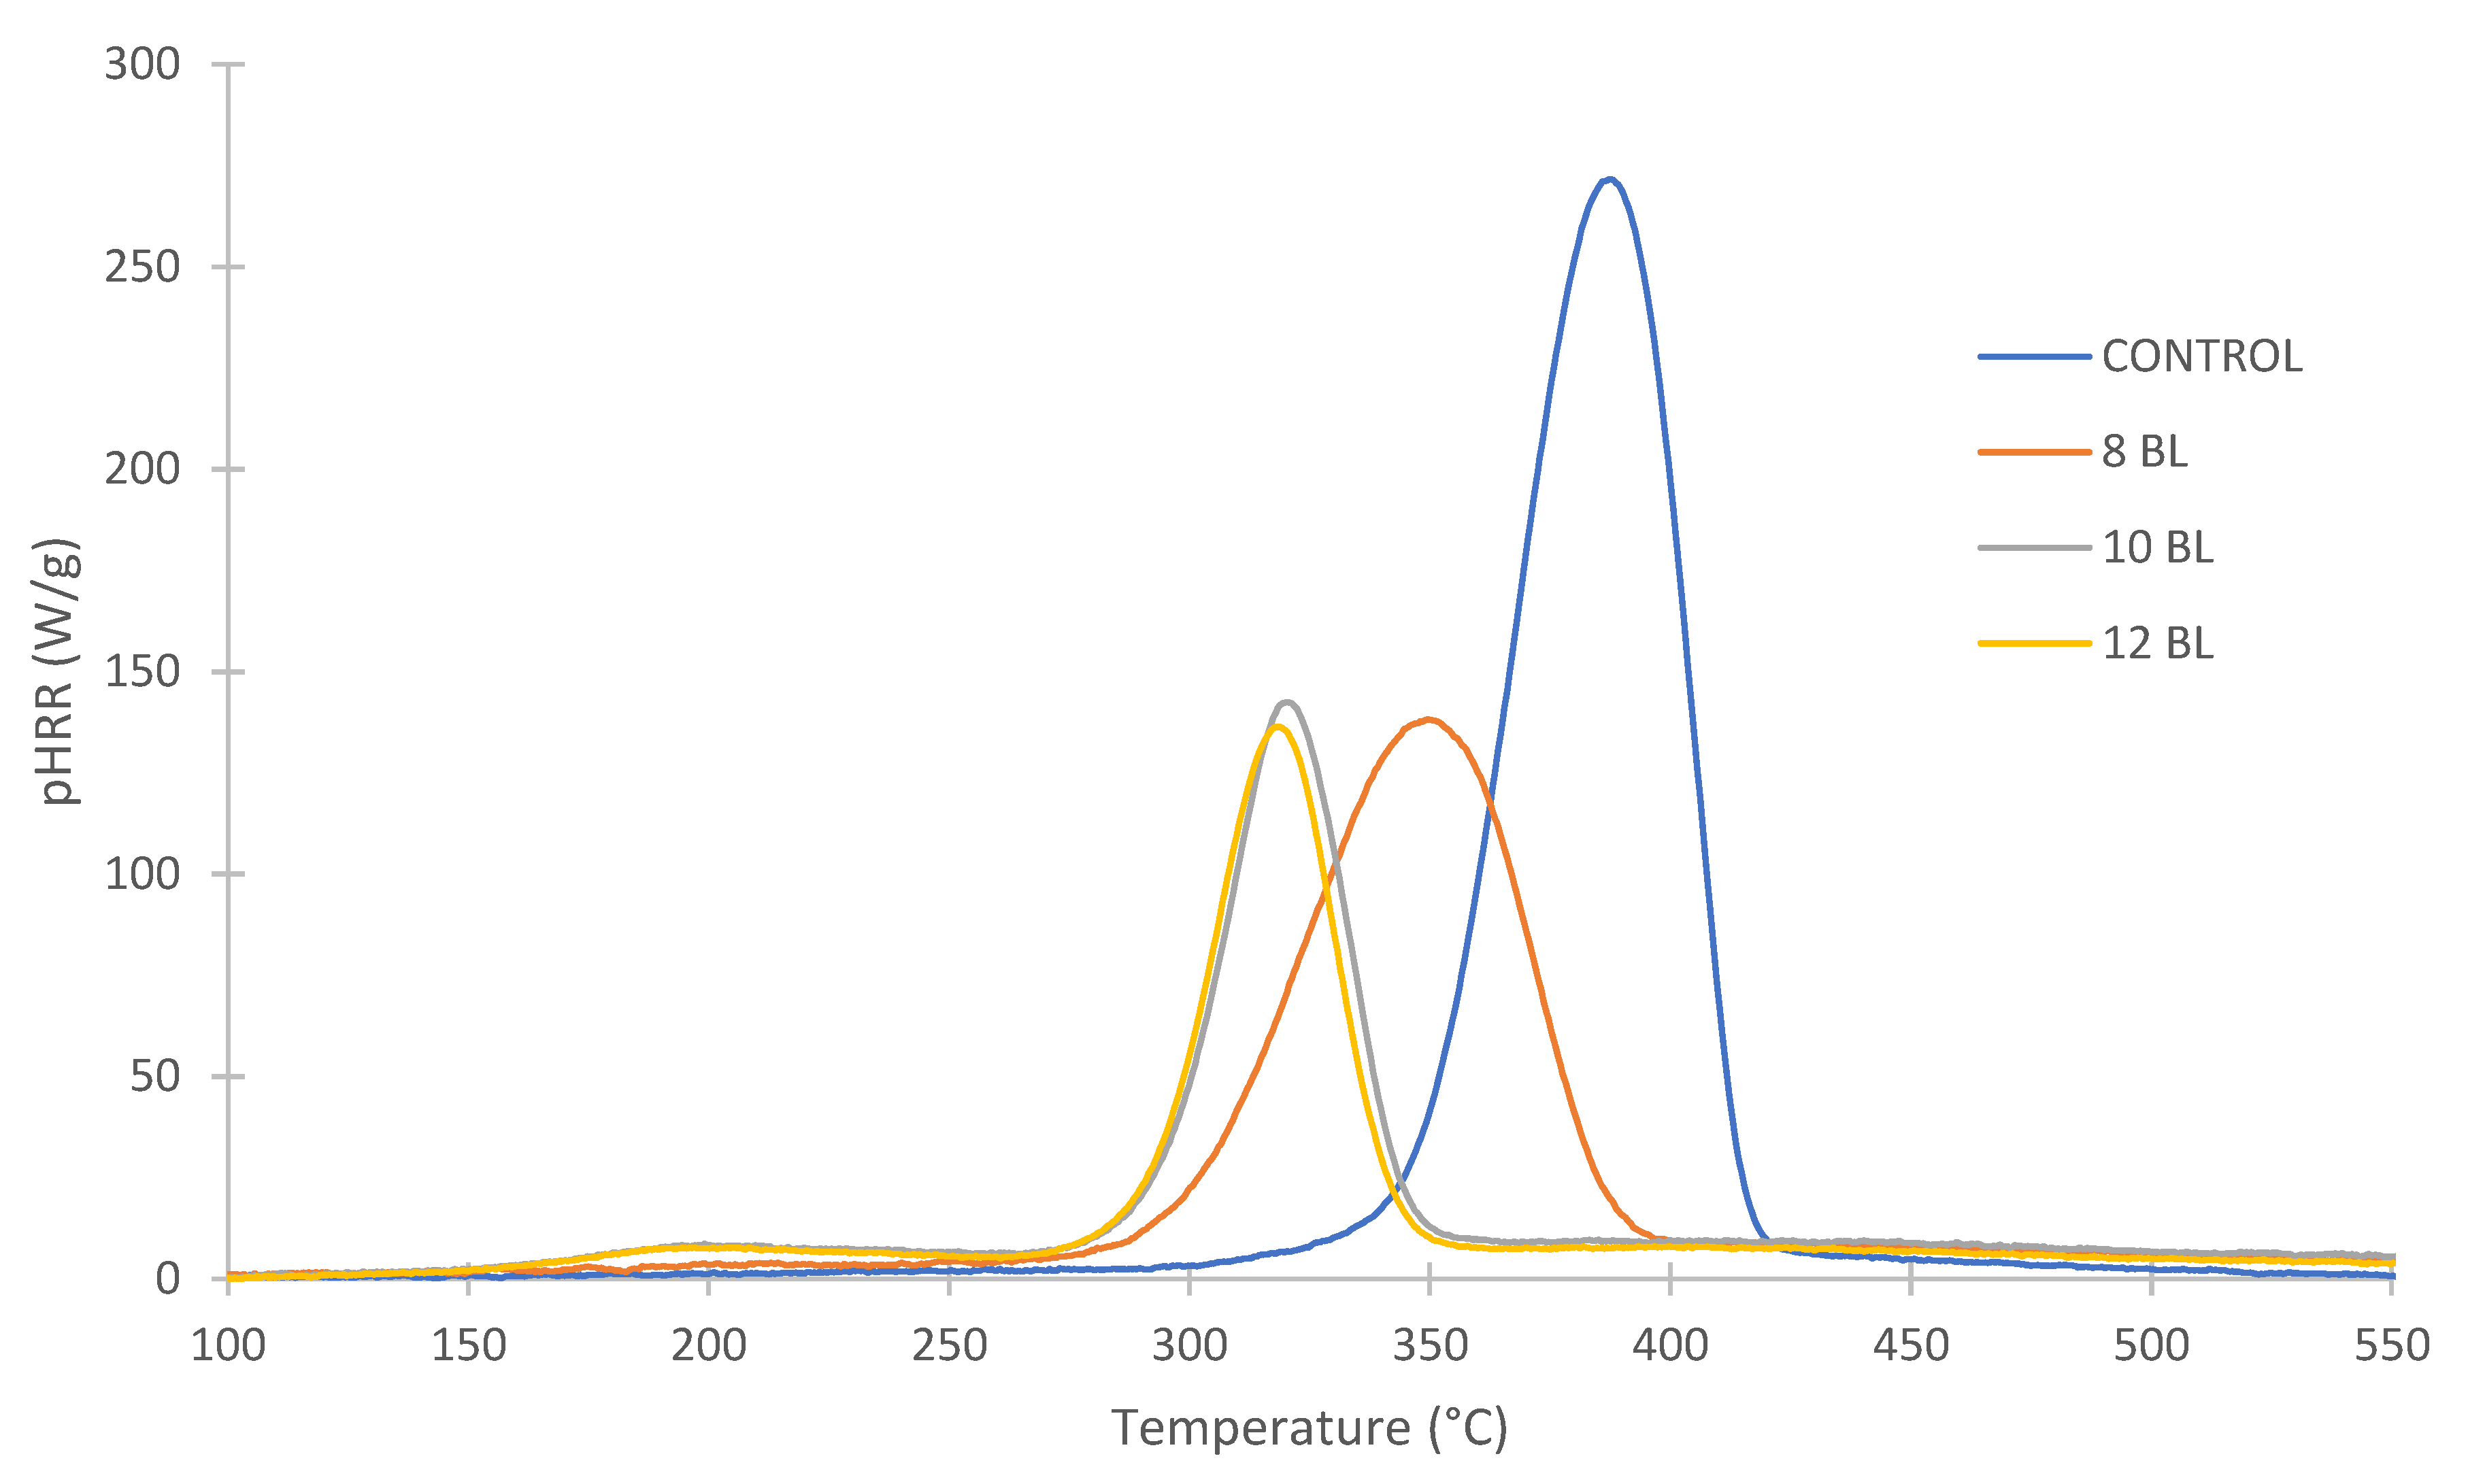
Figure 2 and Figure S1 show microscale combustion calorimeter (MCC) values, such as heat release rates (pHRR), as a function of temperature (TpHRR) for untreated and differently treated cotton. The results of MCC measurements are summarized in Table 3. Parameters responsible for the MCC data are heating rate, chamber atmosphere, inhomogeneity of the sample as well as sample preparation [25]. There are three major groups of curves for: untreated (control) cotton, cotton treated with 8 BL (PA/CH-urea, PA/CH-urea + Cu2+), and cotton treated with 10 and 12 BL (PA/CH-urea, PA/CH-urea + Cu2+). According to Figure 2 and Table 3, the pHRR of untreated cotton is 269.4 W/g, while the total heat release rate (THR) is 11.6 kJ/g at 395 °C. In the present study, 8 BL cotton shows a reduction of peak release rate (ΔHRR) of more than 49%, while a reduction of total heat release rates (ΔTHR) is more than 30%. In the previous study, the ΔHRR values for 8, 10 and 12 BL were reduced by more than 57%, whereas the ΔTHR values were reduced by more than 67% [18]. By immersing 8 BL samples into Cu2+ solution, the ΔHRR is reduced by more than 59% (Figure S1 and Table 3). By adding more bilayers of the PA/CH-urea + Cu2+ system, from 10 to 12, the pHRR slightly decreases from 110.1 to 103.0 W/g, but there is no actual difference in the pHRR and THR values between 10 and 12 BL, with and without added Cu2+ ions. By adding Cu2+ ions, the pHRR values, as well as TpHRR, decrease for all treated samples, as shown in Table 3. The resulting MCC values correspond to LOI values in Table 1 and the VFT results in Table 2.
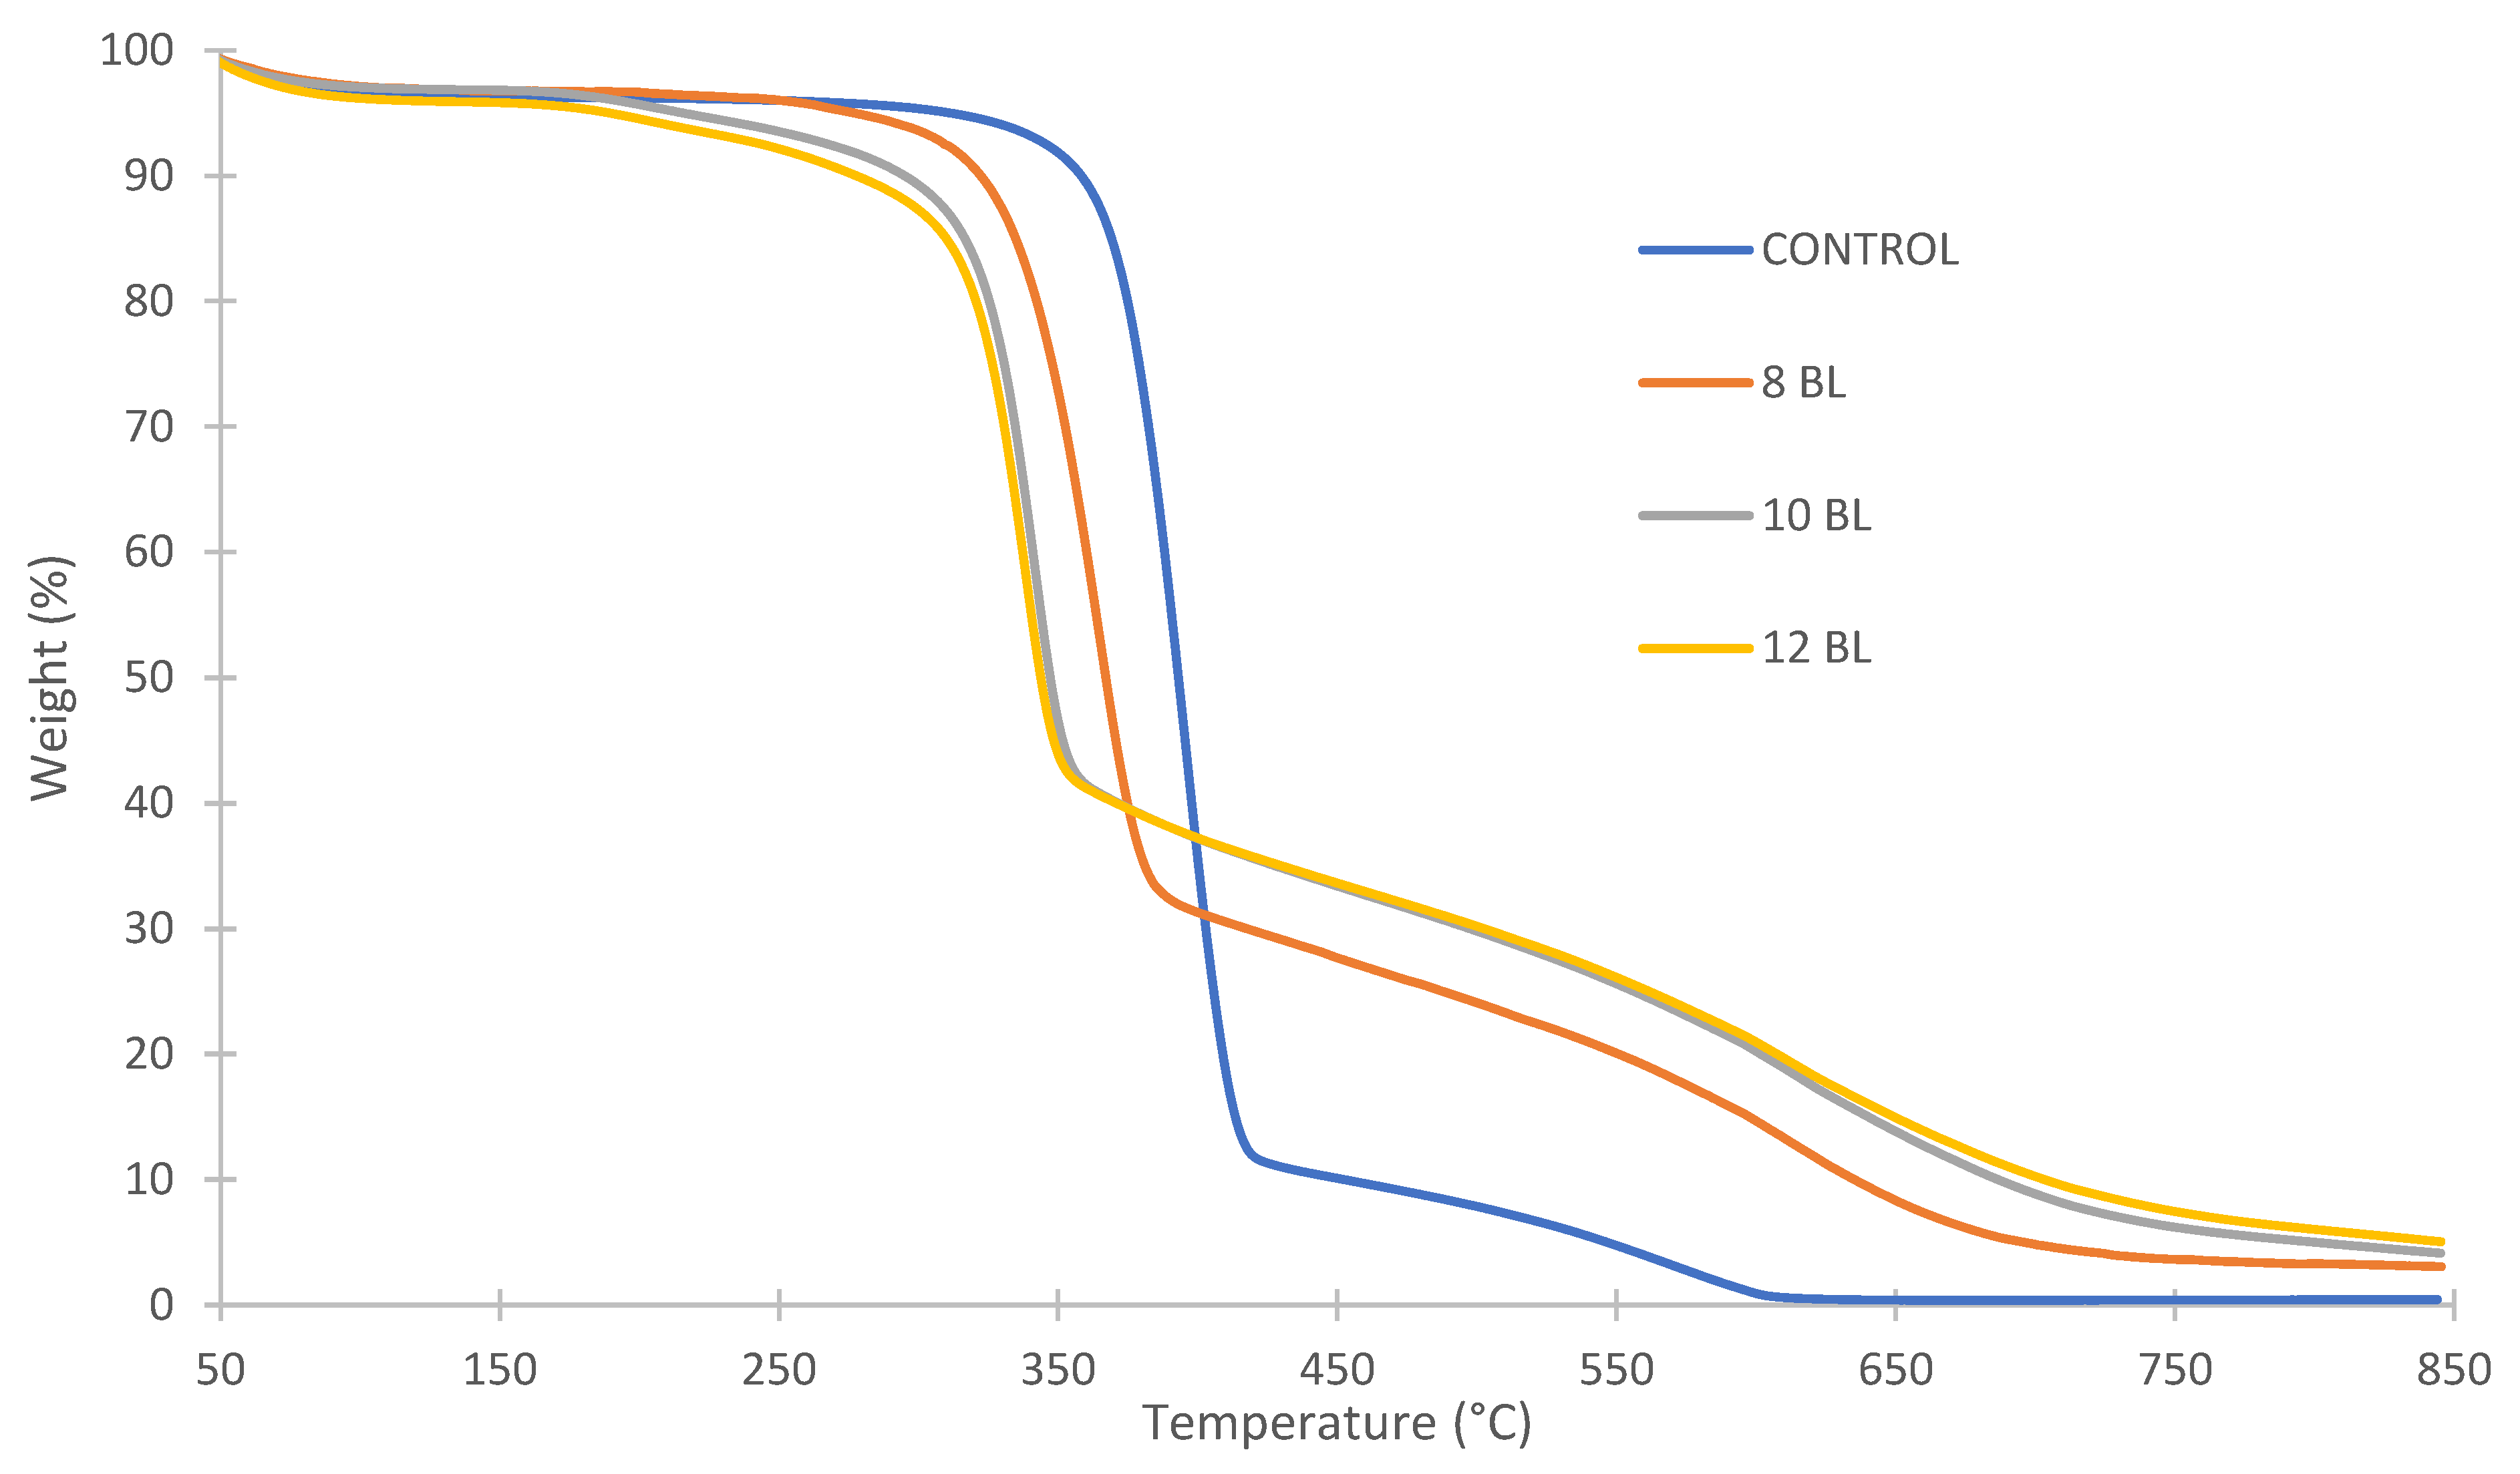
Figure 3 represents the weight loss of untreated and PA/CH-urea-treated cotton samples as a function of temperature, while Table 4 summarizes the weight (%) of samples at the first decomposition (T1) and the second decomposition temperature peak (T2). As seen in Figure 3, between 50 °C and 100 °C, the evaporation of moisture of all samples occurs. The dehydration and depolymerization of cellulose molecules occur between 250 °C and 400 °C. At the end of this stage (at 420 °C), cotton loses almost 95% of its weight by generating non-flammable gases, such as CO2 and CO, primary char residue, and the highly flammable levoglucosan [26]. The maximum peak temperature of the first stage of untreated cotton occurs at 396 °C, as shown in Table 4.
All treated cotton samples show a shift to lower T1 by more than 32 °C due to the addition of the FR agent. At the second decomposition stage (between 500 °C and 650 °C and with its maximum at T2), levoglucosan decomposes, generating highly flammable gases and secondary char [26]. As shown in Table 4, the highest rate of weight loss of untreated cotton (56%) appears at 396 °C, while at 650 °C it loses over 99% of its mass. The TG curves of 10 BL and 12 BL are almost identical, showing the first decomposition temperature peak (T1) at around 340 °C and weight loss of around 42%. At 650 °C, both samples lost around 86% of their mass. According to Figure 3, the 8 BL sample lost 46% of its weight at 364 °C, and around 92% at 650 °C. Compared with the previous study, the T1 and T2 values of 8, 10 and 12 BL samples are higher, and the char yield at T1 is lower, while the values of char yield at 650 °C differ slightly [18]. The TG curves of 10 and 12 BL samples correspond to the LOI values of 24.0% and 24.5%, whereas only the 12 BL samples passed VFT (Figure 3, Table 1 and Table 2). The differences in flammability (VFT, LOI) and thermal stability (MCC, TG) between the 8, 10 and 12 BL samples of PA/CH-urea in this study and the previous study [18] come from the slightly different chemicals used in the experiment, basically the MW of CH and the purity of PA.
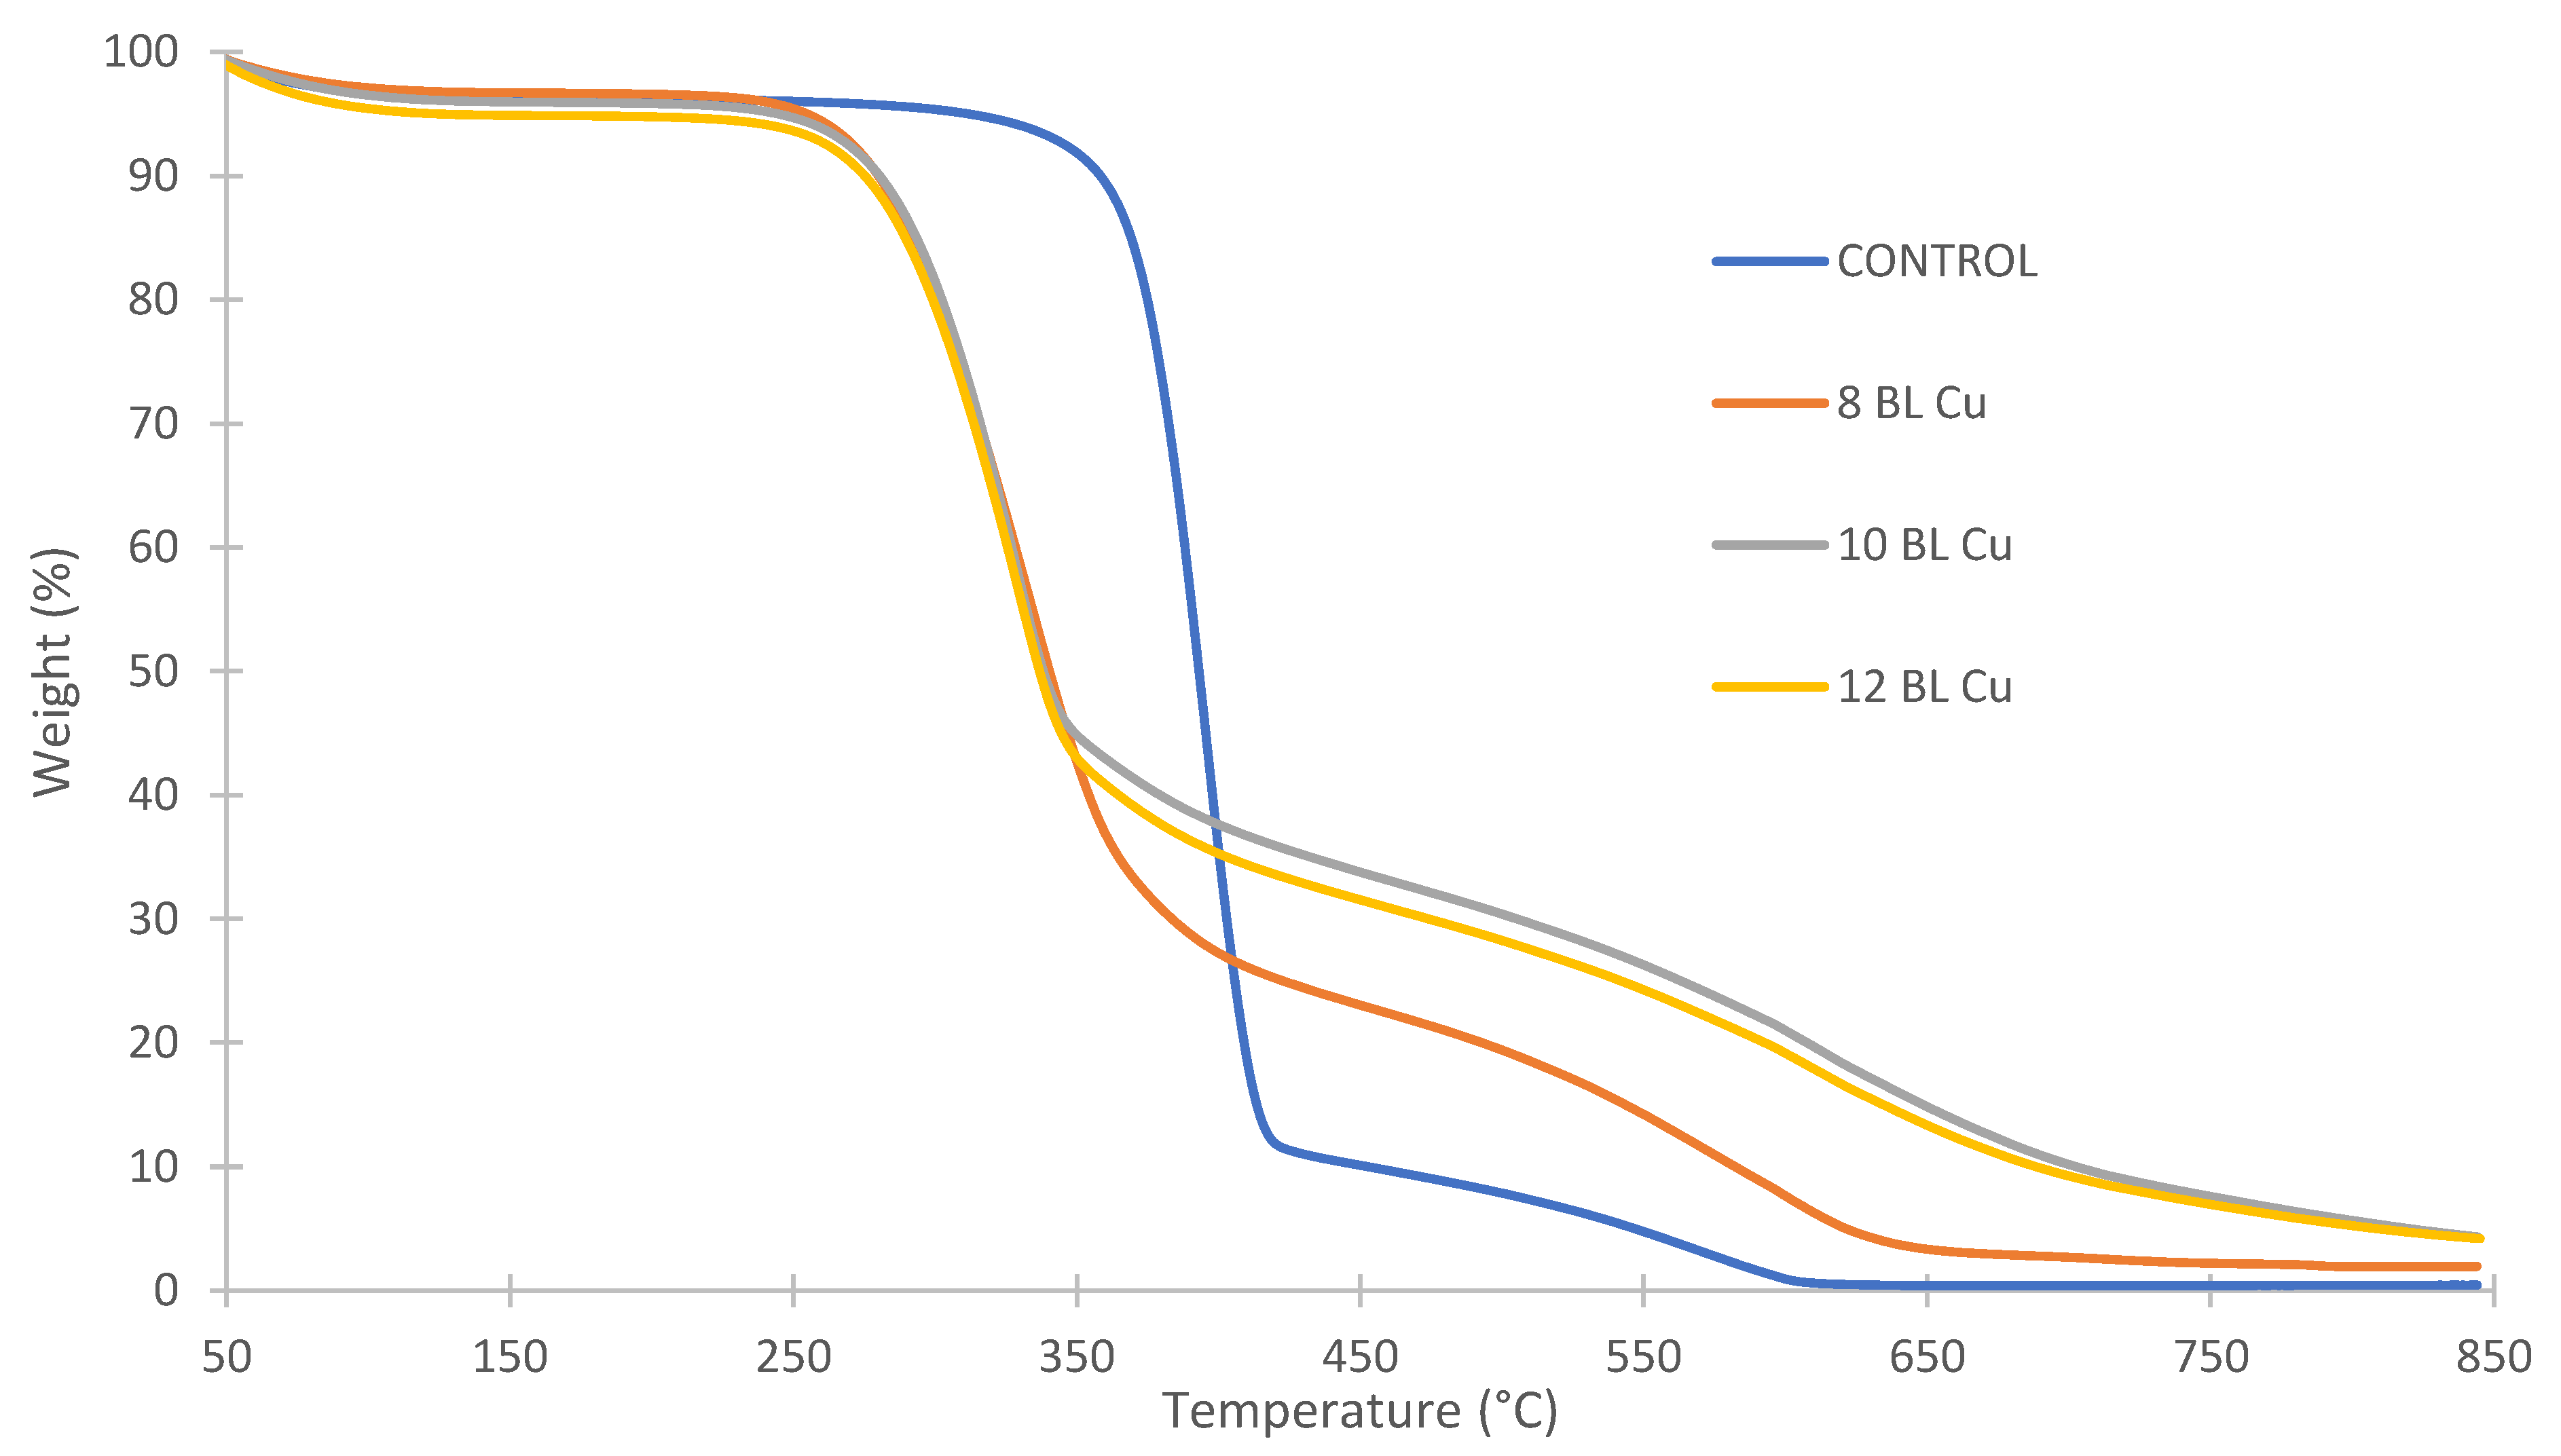
Figure 4 shows the weight loss of untreated and PA/CH-urea + Cu2+-treated cotton samples as a function of temperature, while Table 4 summarizes the weight (%) of samples at the characteristic first decomposition (T1), as well as at the second decomposition temperature peak (T2). Cotton samples treated with 8, 10, 12 BL of PA/CH-urea + Cu2+ exhibit a shift to lower first-stage decomposition temperatures by more than 62 °C, in comparison to untreated samples. The TG curves of 10 BL and 12 BL are almost identical, showing the first decomposition temperature peak (T1) at around 329 °C and a weight loss of around 43%. At 650 °C, both samples lost around 86% of their mass, as shown in Table 4. The TG curves of 10 and 12 BL correspond to the LOI values of 25.5% and 26.0%, where only 12 BL passed the VFT (Figure 5, Table 1 and Table 2). According to Table 4, the 8 BL samples lost 45% of weight at 334 °C and around 96.7% at 650 °C.
As shown in Table 4, by immersing treated cotton samples into 2% Cu2+ solution at the end of LbL deposition, the first decomposition stage exhibits a shift to lower temperatures for 30 °C for 8 BL, 14 °C for 10 BL, and 9 °C for 12 BL. The TG curves of 10 BL and 12 BL show almost identical behavior at the second decomposition stage, as shown in Figure 4. These curves correspond to the pHRR and TpHRR values obtained by MCC, which show a strong reduction of MCC values by adding Cu2+ ions into the LbL system of PA/CH-urea, as seen in Table 3.
Only gas IR spectra of untreated and treated cotton samples (12 BL with and without added Cu2+) were analyzed due to the strongest intensity profile of gaseous products generated during heating from 50 °C to 850 °C. The profile was taken at two measuring temperature/time points, where the derivative weight curves show the maximum temperature peaks at the first and second decomposition stages (T1 and T2), as presented in Table 4.
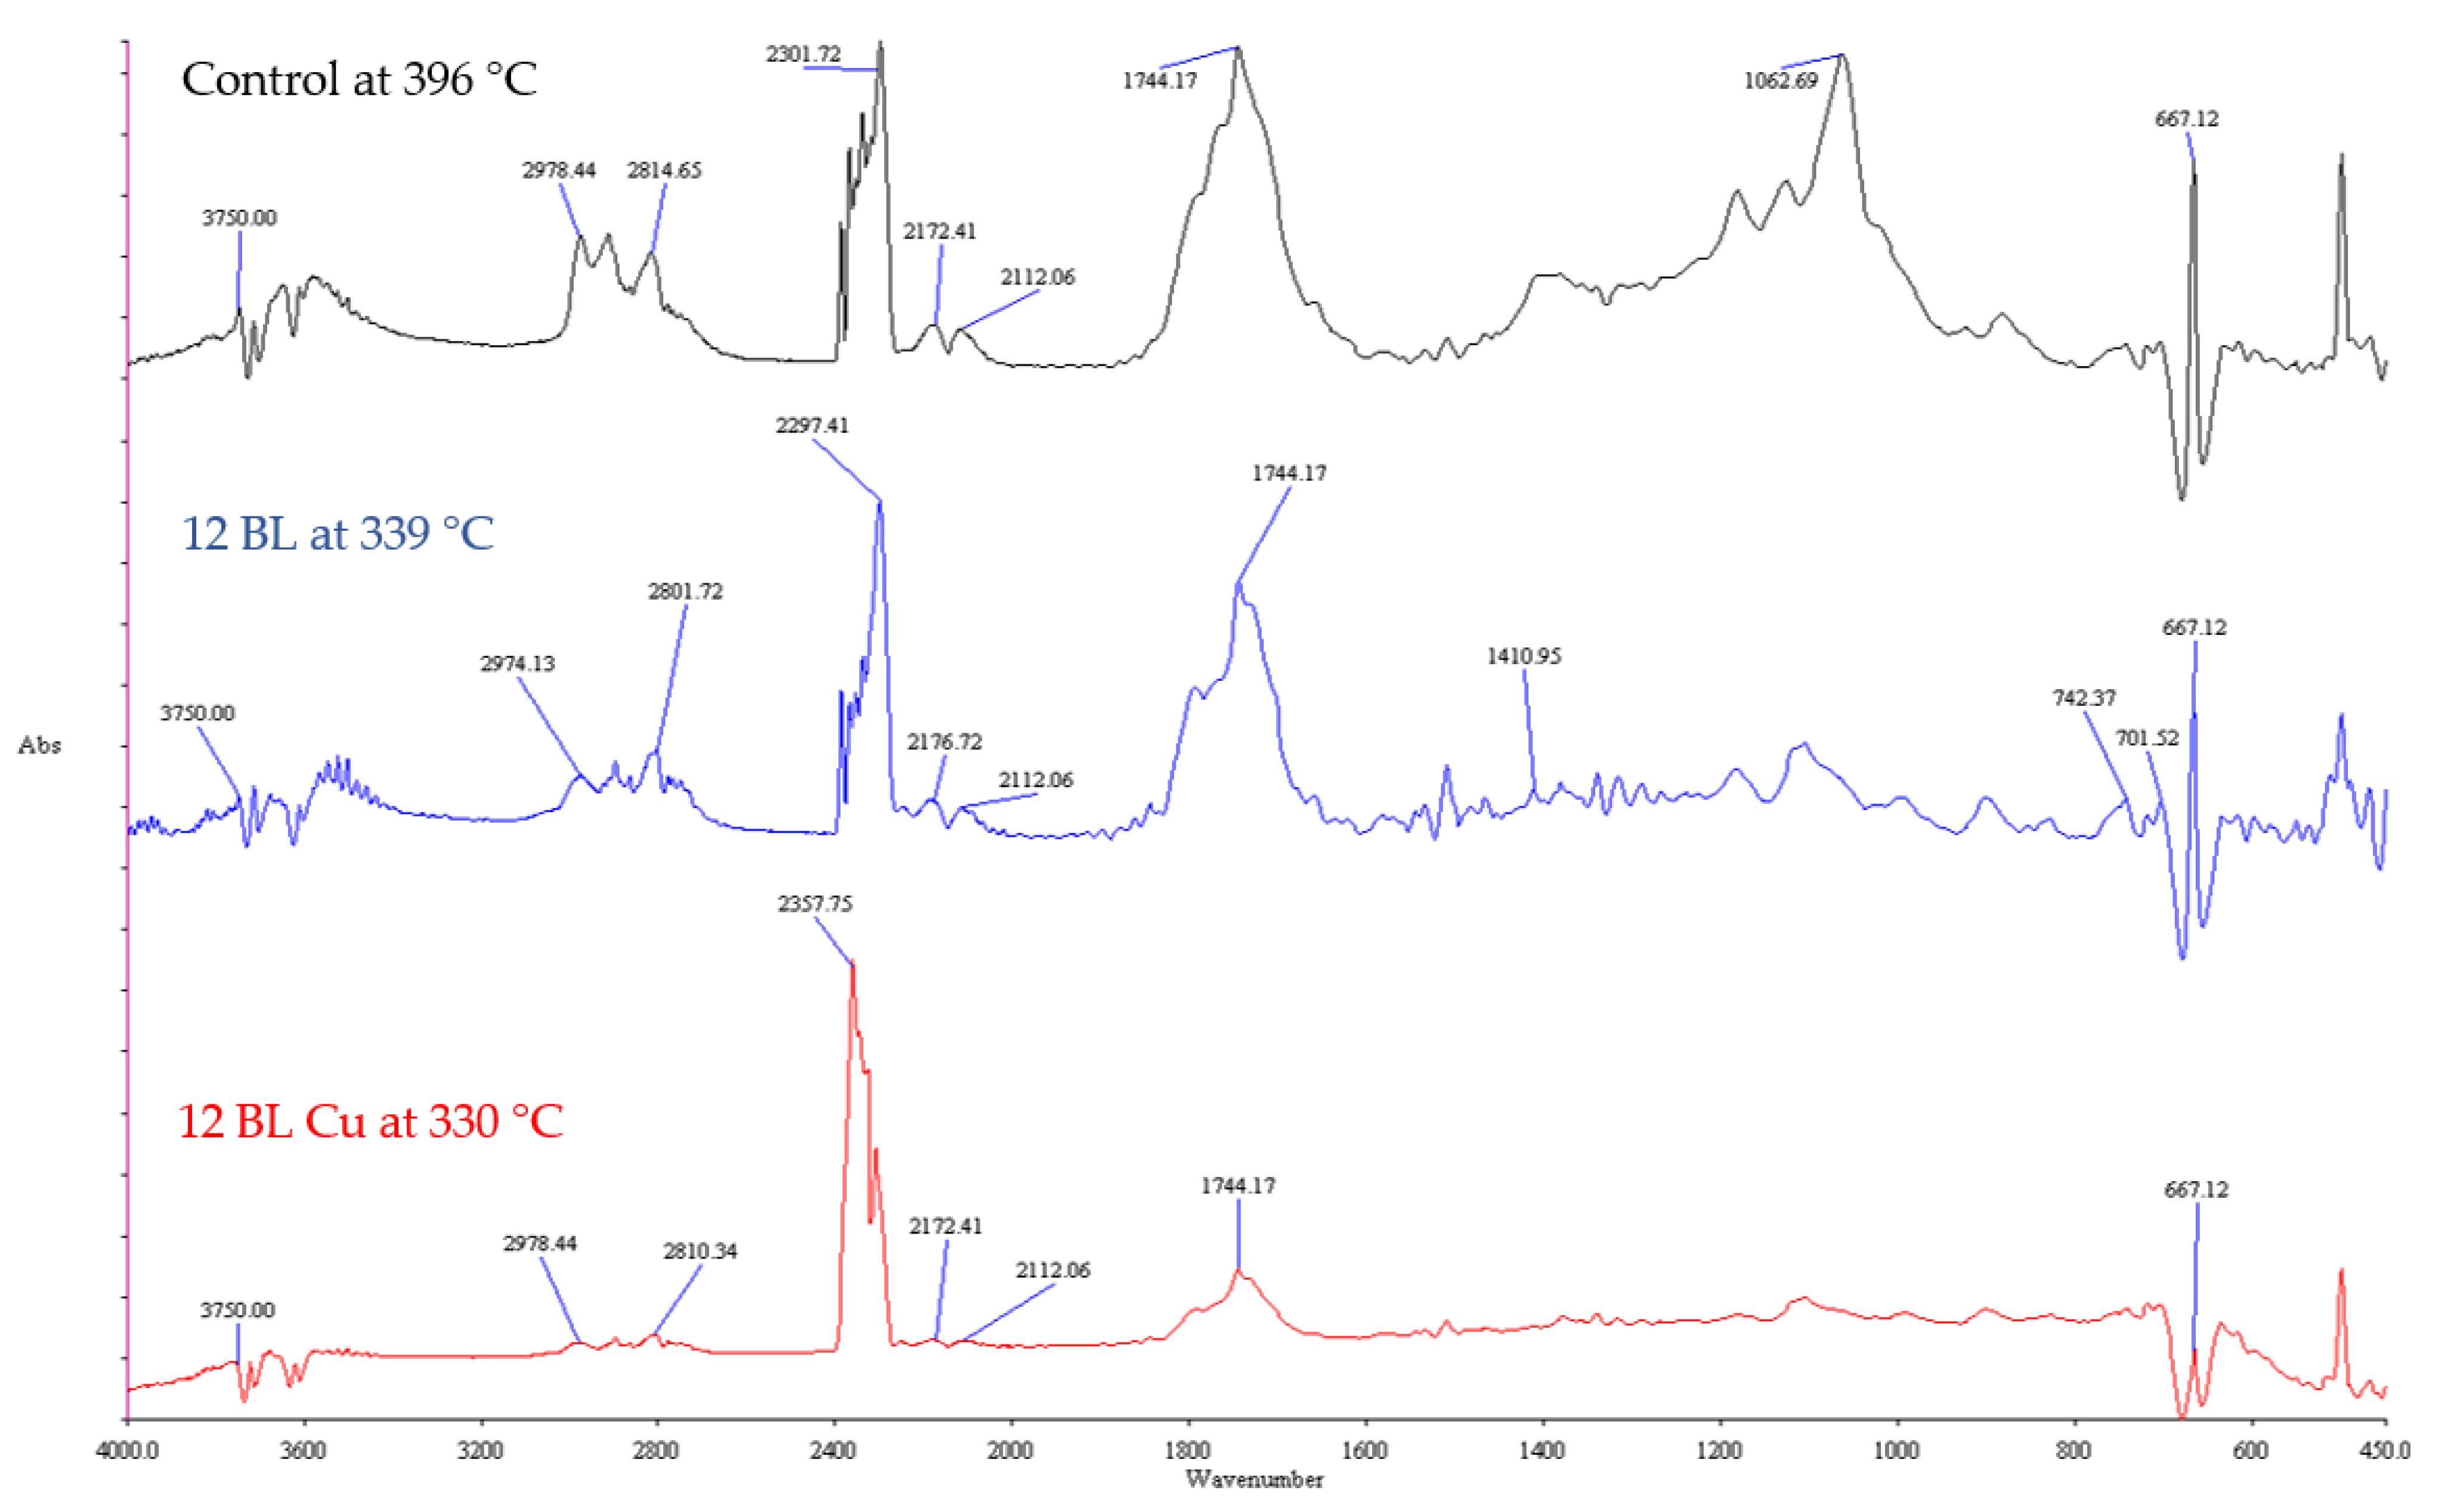
As seen from Figure 5, the first group of characteristic peaks of IR spectra of all untreated samples lies between 3800 cm−1 and 3500 cm−1, which matches the medium stretching vibrations of O-H bonds in a molecule of water [27]. The second group of characteristic peaks lies between 3000 cm−1 and 2750 cm−1, which is the C-H stretching of methane [28]. Untreated cotton produces more methane while heating relative to treated cotton. The third group of characteristic peaks lies between 2450 cm−1 and 2300 cm−1, which belongs to the strong antisymmetric stretching and rotational bands from the R branch of the C=O bonds in carbon dioxide [29]. Double peaks at 2172 cm−1 and 2112 cm−1 represent the stretching vibrations of C=O molecules of carbon monoxide [28]. A peak at 1744 cm−1 matches the C=O stretching vibration of aldehyde (formaldehyde, acetaldehyde, acrolein). Treated cotton immersed in Cu2+ solution produces less aldehyde during heating, relative to untreated cotton and cotton treated only with PA/CH-urea. Cotton treated only with PA/CH-urea also shows a peak at 1410 cm−1 that matches that of propylene. At 1062 cm−1, there is a very sharp peak of untreated cotton that can be assigned to levoglucosan, which is the compound responsible for the high flammability of cellulose. Cotton treated only with PA/CH-urea shows two peaks at 742 cm−1 and 702 cm−1, probably belonging to the wagging of NH bonds [30]. Untreated and treated cotton show a very sharp peak (668 cm−1) of weak bending vibrations from the Q branch of the C=O bonds from carbon dioxide [29]. Other phosphorus or nitrogen compounds may exist, but their spectra are overlapped by water and carbon dioxide [31].
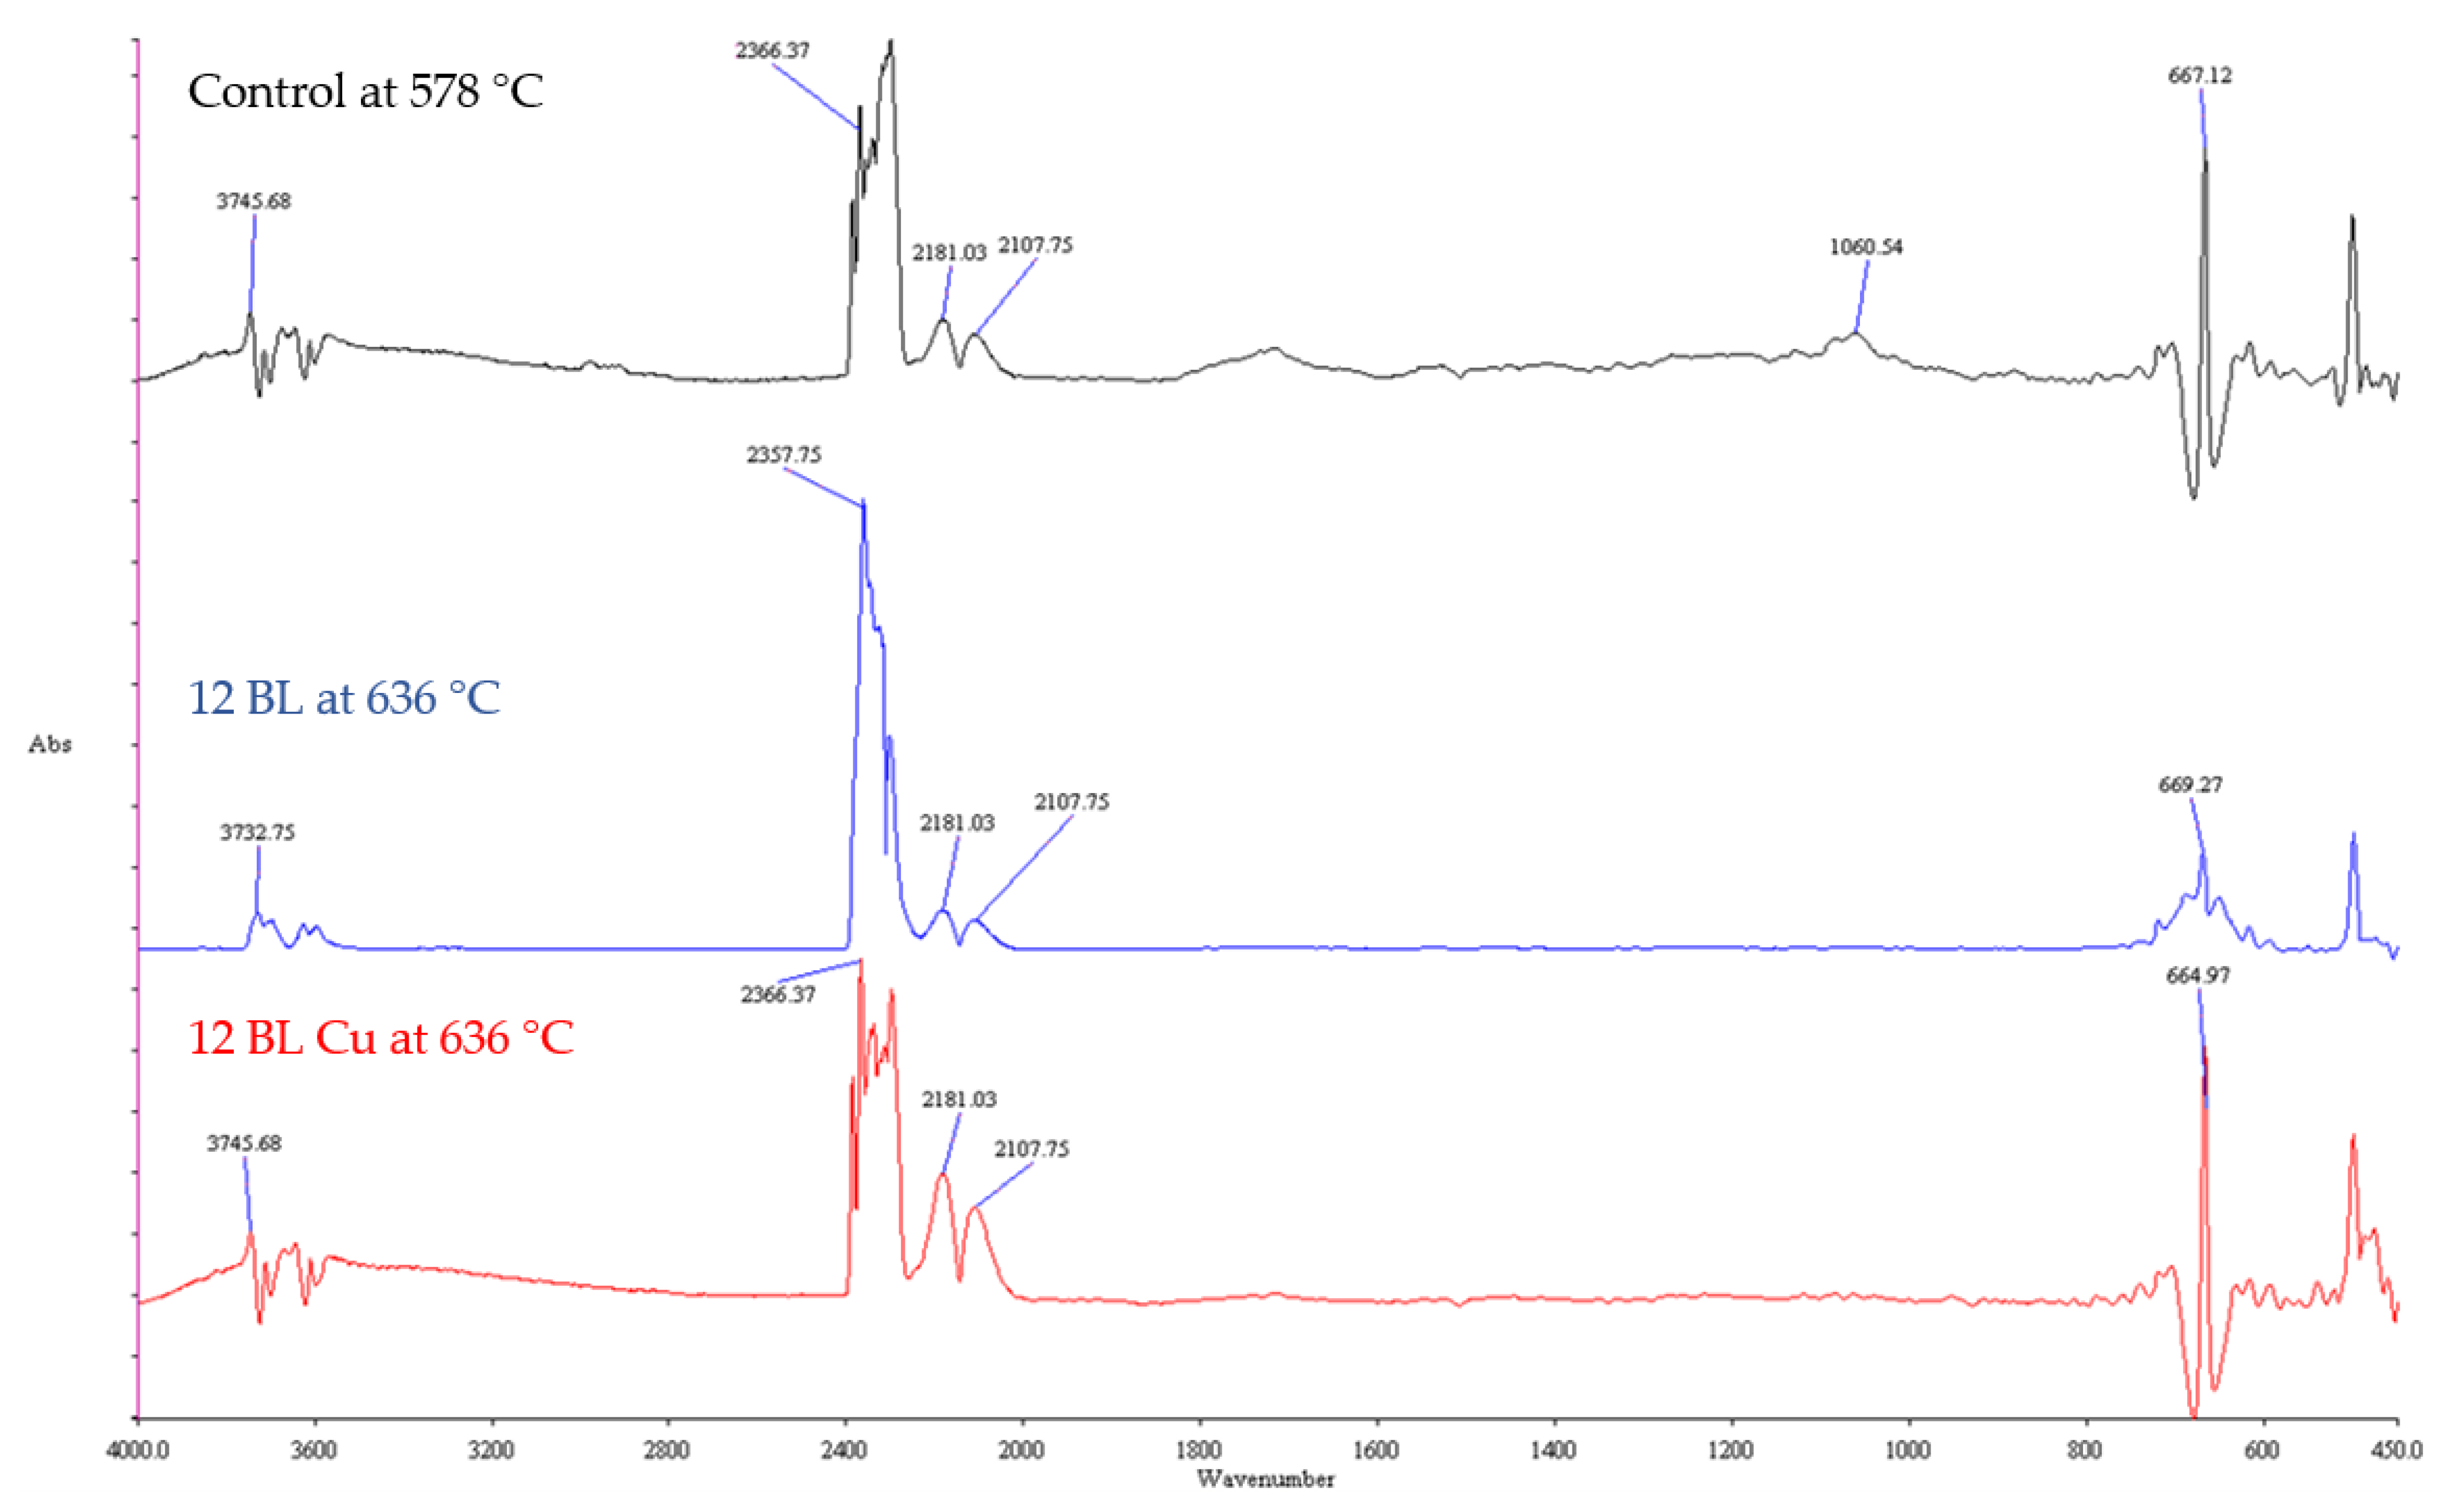
Figure 6 shows the IR spectra of gas products of untreated and treated at the second decomposition stage consisting of water (wavelength range from 3800 cm−1 to 3500 cm−1), carbon dioxide (wavelength range from 2450 cm−1 to 2300 cm−1, and a sharp peak at around 668 cm−1), carbon monoxide (peaks at 2181 cm−1 and 2107 cm−1), and levoglucosan for untreated cotton (1062 cm−1) [27,28,29]. At the second decomposition stage, treated cotton shows no levoglucosan, which means that even a small fraction of FR compounds decreases the amount of levoglucosan responsible for the high flammability of cellulose, thus producing more post-burn char. Although the T2 of the second decomposition stage of untreated cotton is lower by more than 58 °C than the treated ones, due to the small amount of levoglucosan more flammable gases are generated during its thermal decomposition, making the untreated cotton more flammable than the treated cotton. The FR compounds have little effect on the amount of water, carbon dioxide and carbon monoxide [32].
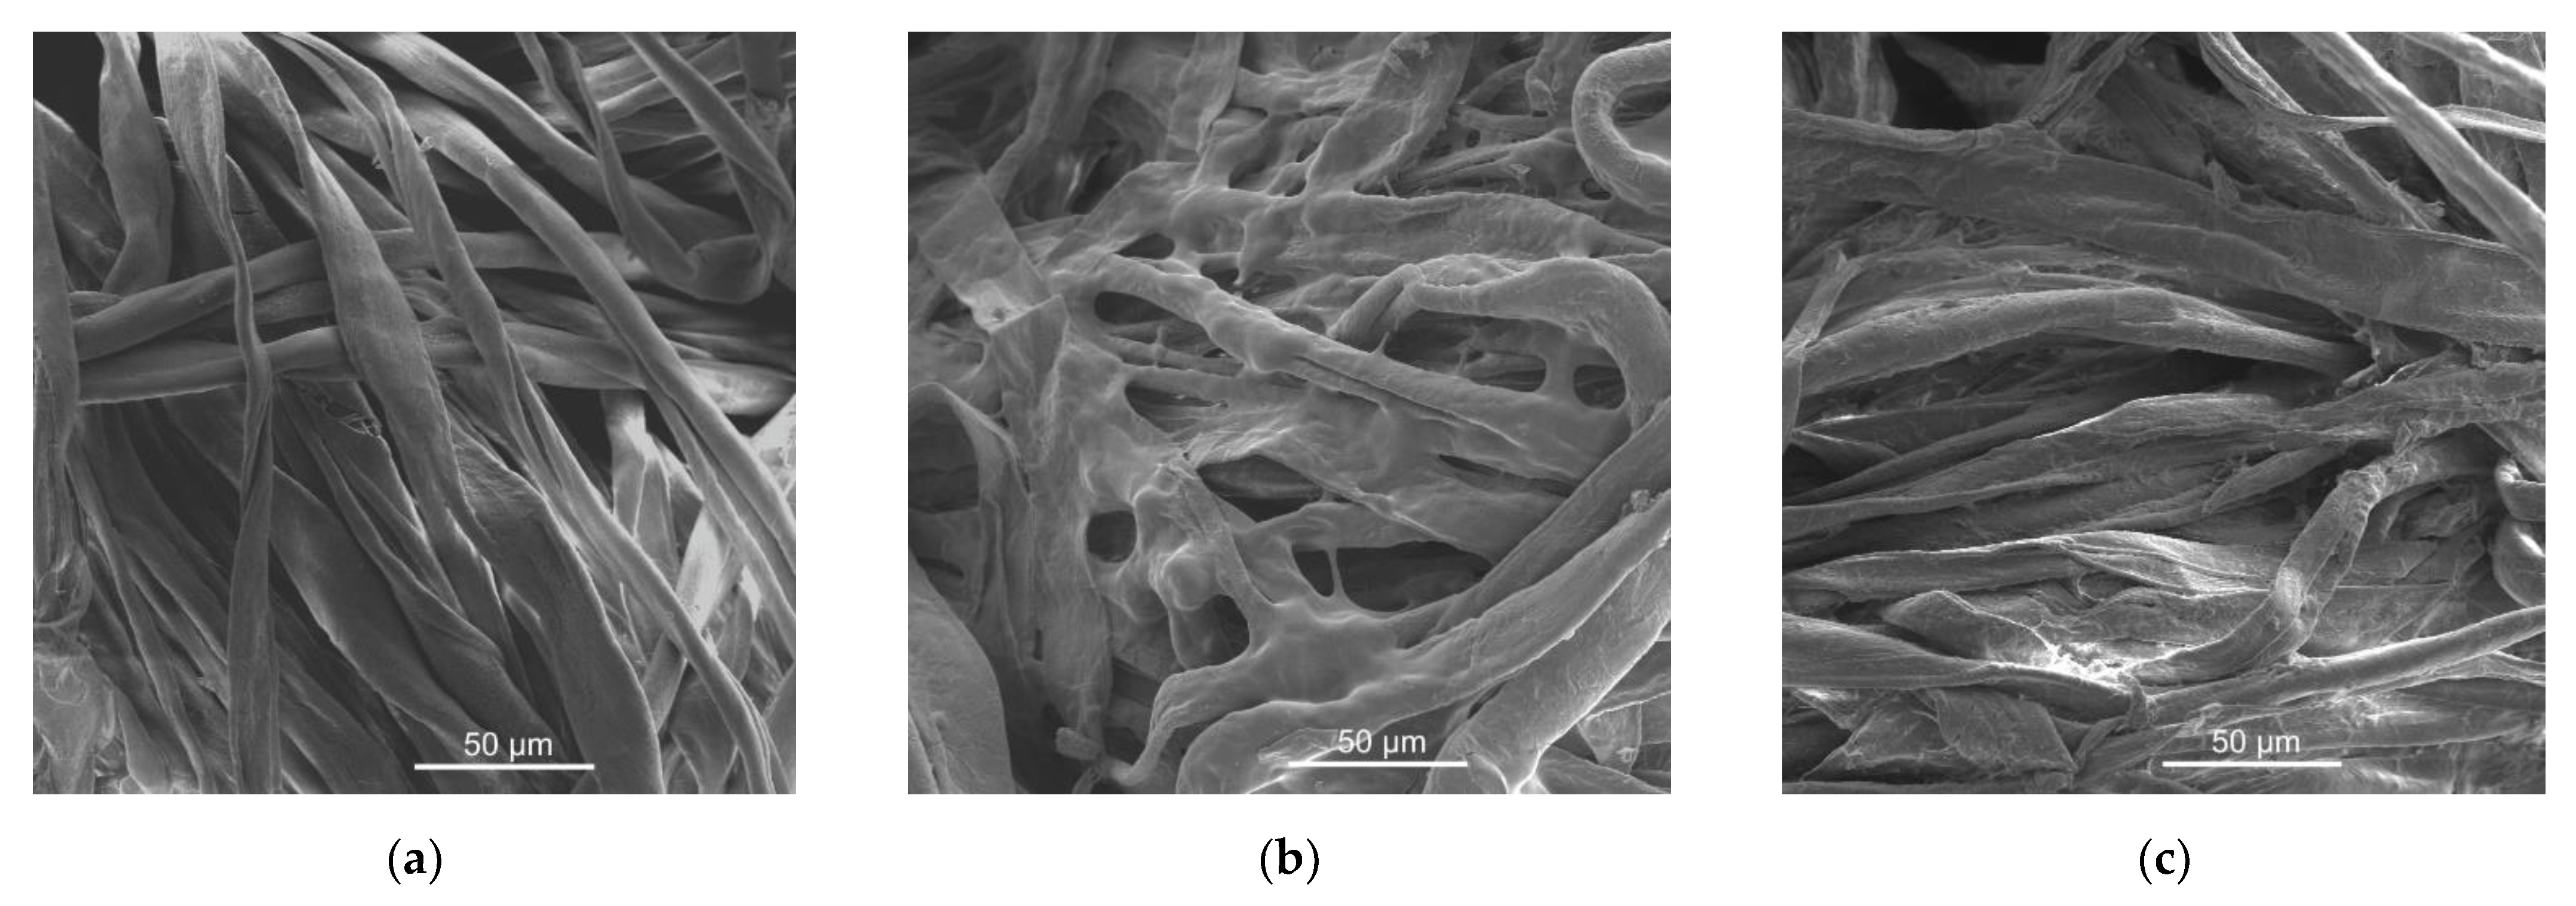
Figure 7 shows the SEM images of treated and untreated cotton. The surface of untreated cotton is smooth (Figure 7a), while treated samples have a rough, uneven, and paste-like structure (Figure 7b–c). There is also a very slight difference between PA/CH-urea- (Figure 7b) and PA/CH-urea + Cu2+ (Figure 7c)-treated samples. It seems that adding Cu2+ salts as a very top layer will peel off the upper PA/CH-urea layer, thus making the surface of the fibers more fibril-like. This structure corresponds to the thermal degradation of the FR properties of PA/CH-urea + Cu2+-treated cotton by decreasing the char length after VFT, as well as by increasing the LOI values accordingly (Table 1 and Table 2). This difference is more obvious when comparing the pHRR and TpHRR values obtained by MCC (Table 3) and the TG values of PA/CH-urea and PA/CH-urea + Cu2+ (Table 4).
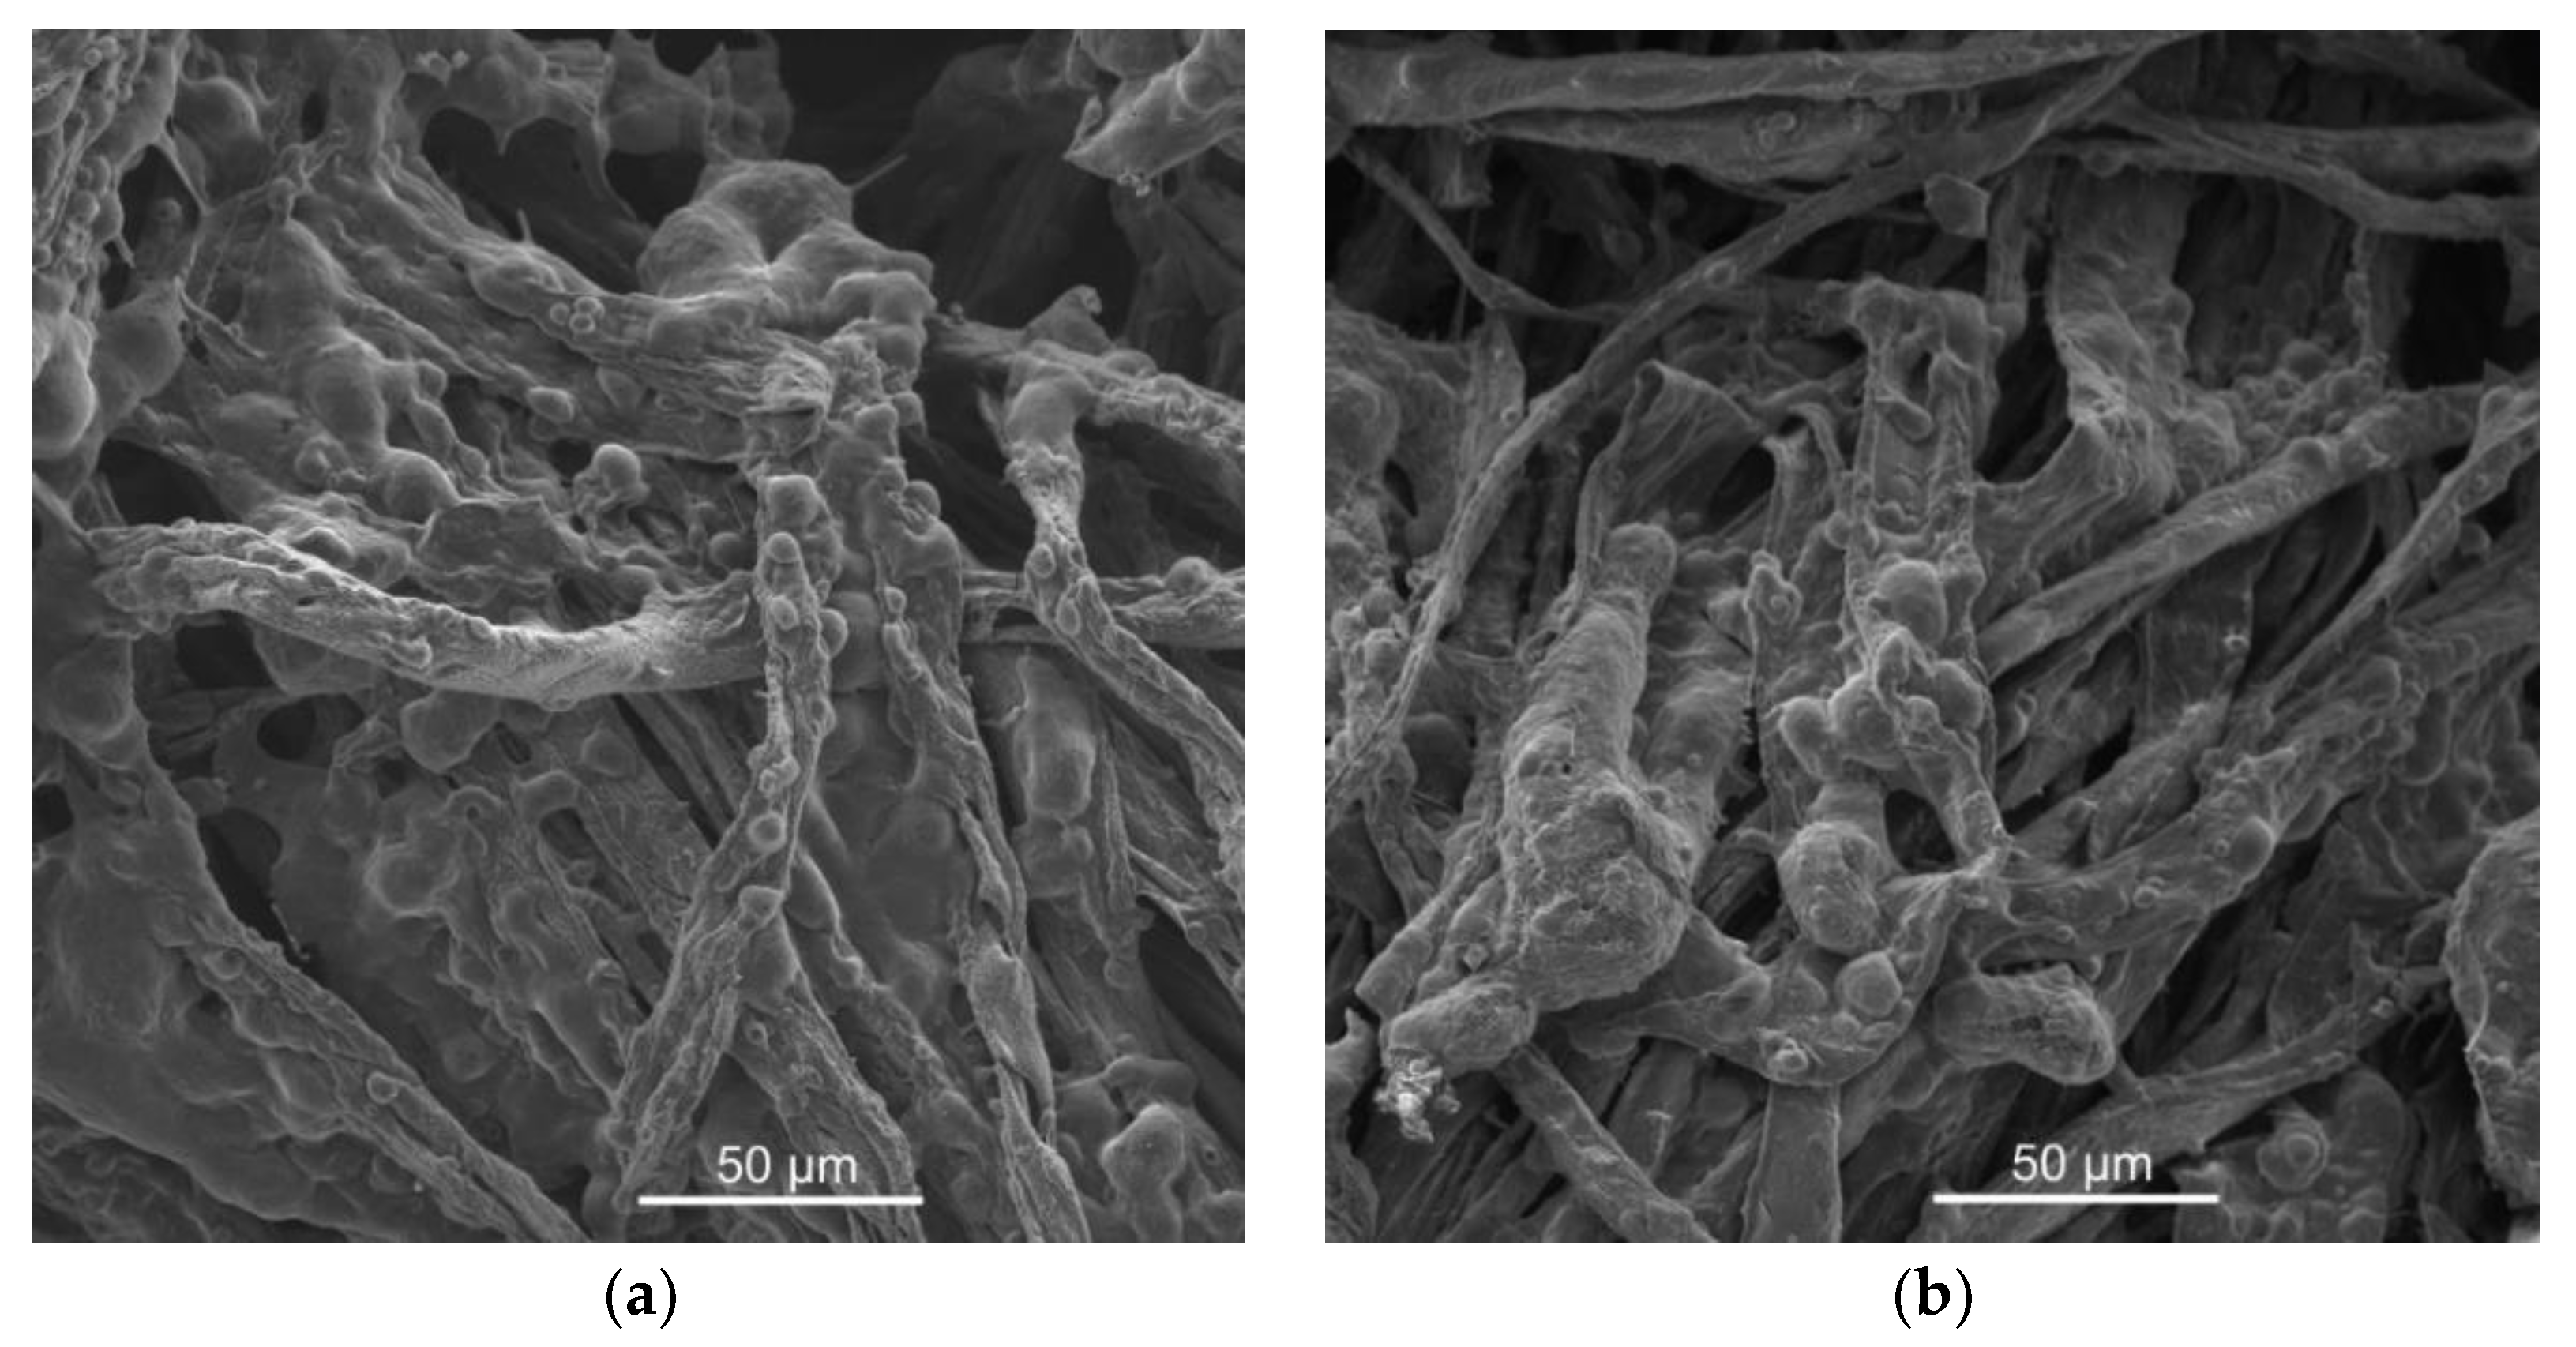
All the post-burn charred LbL samples shown in Figure 8 demonstrate a bubbled structure, one that is typical for intumescent flame-retardant systems with phytic acid acting as an acid donor, chitosan as a carbon donor, and urea as a blowing agent generating non-flammable gases. Cu2+ metal ions act as a shield that is capable of preventing heat from going into the fiber [33,34]. There is no difference between the post-burnt char of a sample treated with PA/CH-urea and PA/CH-urea + Cu2+ ions.
To semi-quantify the amounts of phosphorus, nitrogen and copper, EDS measurements at 4 different points for each post-burn char of the treated cotton samples were performed and the average values of wt % for phosphorus, nitrogen and copper for each sample were calculated; the results are summarized in Table 5. The post-burn char mainly contains carbon, oxygen, phosphorus, and copper (for PA/CH-urea + Cu 2+-treated samples), along with impurities such as aluminum, iron, magnesium, calcium, sulfur, and potassium (derived from the technical-grade sodium phytate). These results suggest that the deposition of PA/CH-urea and PA/CH-urea + Cu2+ was successful.
The results of the antibacterial activity of Gram-negative Klebsiella pneumoniae and Gram-positive Staphylococcus aureus after immersing LbL-treated fabric into Cu2+ solution are summarized in Table 6. Metal ions such as Cu2+ and Zn2+ damage the cell membrane acting as a biosynthesis inhibitor, thus killing the bacteria [35]. As expected, all PA/CH-urea + Cu2+ treated samples killed almost 100% of the bacteria. These results are consistent with the results obtained in a previous study, where only 2.3 wt % of copper is sufficient to kill almost 100% of the bacteria [19].

4. Conclusions

Cotton fabric was successfully treated with an environmentally benign flame-retardant coating consisting of PA/CH-urea, deposited via LbL deposition. The LOI value of cotton coated with 12 BL was 24.5% and the sample passed the VFT, with a char length of 6.7 cm. By immersing such treated cotton into Cu2+ solution, it is possible to achieve a higher FR effect, as well as to obtain antimicrobial properties. The result is in accordance with MCC values, where the pHRR for cotton, when treated with 12 BL of PA/CH-urea, is 132.2 W/g. The reduction of HRR is more than 50% and the reduction of TpHRR is more than 23 °C, relative to untreated cotton. At the same time, the TG analysis showed that the 12 BL treatment moved the T1 at the first decomposition stage to a lower temperature by 57 °C. By adding Cu2+ ions into the LbL system, the difference is even more visible. Antibacterial testing showed the reduction of Gram-negative Klebsiella pneumoniae and Gram-positive Staphylococcus aureus by almost 100%. By means of LbL treatment, it is possible to achieve an effective, environmentally friendly, multifunctional FR-antimicrobial nanocoating consisting of PA/CH-urea + Cu2+ on cotton as an alternative to commercial treatments.

Supplementary Materials

The following are available online at https://www.mdpi.com/article/10.3390/fib9110069/s1, Figure S1: Heat release rates as a function of temperature for untreated (control) and cotton treated with 8, 10 and 12 BL of PA/CH-urea + Cu2+.

Author Contributions

Conceptualization, E.M.; methodology, I.J. and A.B.; validation, I.J. and A.B.; formal analysis, E.M.; investigation, E.M.; resources, I.J.; data curation, E.M.; writing—original draft preparation, E.M.; writing—review and editing, I.J., B.V., A.B., J.C.G. and S.B.; visualization, E.M.; supervision, S.B. All authors have read and agreed to the published version of the manuscript.

Funding

This research received no external funding.

Institutional Review Board Statement

Not applicable.

Informed Consent Statement

Not applicable.

Acknowledgments

The research was performed on equipment purchased by KK.01.1.1.02.0024 project: Modernization of Textile Science Research Centre Infrastructure (MI-TSRC) and KK.01.1.1.04.0091 Design of Advanced Biocomposites from Energy-Sustainable Sources (BIOKOMPOZITI).

Conflicts of Interest

The authors declare no conflict of interest.

References

  1. Textile Exchange Organization. Preferred Fiber & Materials Market Report. 2020. Available online: https://textileexchange.org/about-us/#annualreports (accessed on 7 October 2021).
  2. Cellulose-Based Graft Copolymers; CRC Press: Boca Raton, FL, USA, 2015; pp. 235–270. [CrossRef]
  3. Magovac, E.; Bischof, S. Non-Halogen FR Treatment of Cellulosic Textiles. Tekstil 2015, 64, 298–309. [Google Scholar]
  4. Hull, T.; Law, R.; Bergman, Å. Environmental Drivers for Replacement of Halogenated Flame Retardants. In Polymer Green Flame Retardants; Elsevier BV: Amsterdam, The Netherlands, 2014; pp. 119–179. [Google Scholar] [CrossRef]
  5. Gao, Y.; Cranston, R. Recent Advances in Antimicrobial Treatments of Textiles. Text. Res. J. 2008, 78, 60–72. [Google Scholar] [CrossRef]
  6. Choudhury, A.K.R. Finishes for protection against microbial, insect and UV radiation. In Principles of Textile Finishing; Elsevier BV: Amsterdam, The Netherlands, 2017; pp. 319–382. [Google Scholar] [CrossRef]
  7. Choudhury, A.K.R. Flame- and fire-retardant finishes. In Principles of Textile Finishing; Elsevier BV: Amsterdam, The Netherlands, 2017; pp. 195–244. [Google Scholar] [CrossRef]
  8. Vukušić, S.B.; Grgac, S.F.; Budimir, A.; Kalenić, S. Cotton textiles modified with citric acid as efficient anti-bacterial agent for prevention of nosocomial infections. Croat. Med. J. 2011, 52, 68–75. [Google Scholar] [CrossRef] [Green Version]
  9. Schramm, C.; Vukusic, S.B.; Katovic, D. Non-formaldehyde durable press finishing of dyed fabrics: Evaluation of cotton-bound polycarboxylic acids. Color. Technol. 2002, 118, 244–249. [Google Scholar] [CrossRef]
  10. Jordanov, I.; Magovac, E.; Fahami, A.; Lazar, S.; Kolibaba, T.; Smith, R.J.; Bischof, S.; Grunlan, J.C. Flame retardant polyester fabric from nitrogen-rich low molecular weight additives within intumescent nanocoating. Polym. Degrad. Stab. 2019, 170, 108998. [Google Scholar] [CrossRef]
  11. Jordanov, I.; Kolibaba, T.J.; Lazar, S.; Magovac, E.; Bischof, S.; Grunlan, J.C. Flame suppression of polyamide through combined enzymatic modification and addition of urea to multilayer nanocoating. J. Mater. Sci. 2020, 55, 15056–15067. [Google Scholar] [CrossRef]
  12. Alongi, J.; Carosio, F.; Frache, A.; Malucelli, G. Layer by Layer coatings assembled through dipping, vertical or horizontal spray for cotton flame retardancy. Carbohydr. Polym. 2013, 92, 114–119. [Google Scholar] [CrossRef]
  13. Holder, K.M.; Smith, R.J.; Grunlan, J.C. A review of flame retardant nanocoatings prepared using layer-by-layer assembly of polyelectrolytes. J. Mater. Sci. 2017, 52, 12923–12959. [Google Scholar] [CrossRef]
  14. Shirvan, A.R.; Nejad, N.H.; Bashari, A. Antibacterial finishing of cotton fabric via the chitosan/TPP self-assembled nano layers. Fibers Polym. 2014, 15, 1908–1914. [Google Scholar] [CrossRef]
  15. Li, P.; Wang, B.; Liu, Y.-Y.; Xu, Y.-J.; Jiang, Z.-M.; Dong, C.-H.; Zhang, L.; Liu, Y.; Zhu, P. Fully bio-based coating from chitosan and phytate for fire-safety and antibacterial cotton fabrics. Carbohydr. Polym. 2020, 237, 116173. [Google Scholar] [CrossRef]
  16. Xue, C.-H.; Wu, Y.; Guo, X.-J.; Liu, B.-Y.; Wang, H.-D.; Jia, S.-T. Superhydrophobic, flame-retardant and conductive cotton fabrics via layer-by-layer assembly of carbon nanotubes for flexible sensing electronics. Cellulose 2020, 27, 3455–3468. [Google Scholar] [CrossRef]
  17. Lin, D.; Zeng, X.; Li, H.; Lai, X. Facile fabrication of superhydrophobic and flame-retardant coatings on cotton fabrics via layer-by-layer assembly. Cellulose 2018, 25, 3135–3149. [Google Scholar] [CrossRef]
  18. Magovac, E.; Jordanov, I.; Grunlan, J.C.; Bischof, S. Environmentally-Benign Phytic Acid-Based Multilayer Coating for Flame Retardant Cotton. Materials 2020, 13, 5492. [Google Scholar] [CrossRef] [PubMed]
  19. Magovac, E.; Budimir, A.; Jordanov, I.; Bischof, S.; Grunlan, J.C. Antibacterial cotton from novel phytic acid-based multilayer nanocoating. Green Mater. 2021, 0, 1–6. [Google Scholar] [CrossRef]
  20. ISO 4589-2:2017(En). Plastics—Determination of Burning Behaviour by Oxygen Index—Part 2: Ambient-Temperature Test. Available online: https://www.iso.org/obp/ui/#iso:std:iso:24444:ed-1:v1:en (accessed on 25 October 2021).
  21. ASTM D6413/D6413M-15. Standard Test Method for Flame Resistance of Textiles (Vertical Test). Available online: https://www.astm.org/Standards/D6413.htm (accessed on 25 October 2021).
  22. ASTM D7309-21a. Standard Test Method for Determining Flammability Characteristics of Plastics and Other Solid Materials Using Microscale Combustion Calorimetry. Available online: https://www.astm.org/Standards/D7309.htm (accessed on 25 October 2021).
  23. AATCC TM100-2019. Test Method for Antibacterial Finishes on Textile Materials: Assessment of Antibacterial Activity Fin-ishes on Textile Material. Available online: https://members.aatcc.org/store/tm100/513/ (accessed on 25 October 2021).
  24. Weil, E.D.; Levchik, S.V. Flame Retardants in Commercial Use or Development for Textiles. In Flame Retardants for Plastics and Textiles; Carl Hanser Verlag GmbH & Co. KG: München, Germany, 2009; pp. 197–225. [Google Scholar] [CrossRef]
  25. Flecknoe-Brown, K.W.; Van Hees, P. Sensitivity analysis on the microscale combustion calorimeter for polyurethane foam using a full factorial design methodology. J. Fire Sci. 2018, 36, 453–471. [Google Scholar] [CrossRef]
  26. Shafizadeh, F.; Fu, Y. Pyrolysis of cellulose. Carbohydr. Res. 1973, 29, 113–122. [Google Scholar] [CrossRef]
  27. Lengyel, J.; Ončák, M.; Herburger, A.; Van Der Linde, C.; Beyer, M.K. Infrared spectroscopy of O− and OH− in water clusters: Evidence for fast interconversion between O− and OH˙OH−. Phys. Chem. Chem. Phys. 2017, 19, 25346–25351. [Google Scholar] [CrossRef] [PubMed] [Green Version]
  28. Scarano, D.; Bertarione, S.; Spoto, G.; Zecchina, A.; Areán, C.O. FTIR spectroscopy of hydrogen, carbon monoxide, and methane adsorbed and co-adsorbed on zinc oxide. Thin Solid Film. 2001, 400, 50–55. [Google Scholar] [CrossRef]
  29. Falk, M.; Miller, A.G. Infrared spectrum of carbon dioxide in aqueous solution. Vib. Spectrosc. 1992, 4, 105–108. [Google Scholar] [CrossRef]
  30. Horrocks, A.; Price, D.; Akalin, M. FTIR analysis of gases evolved from cotton and flame retarded cotton fabrics pyrolysed in air. Polym. Degrad. Stab. 1996, 52, 205–213. [Google Scholar] [CrossRef]
  31. Gilbert, A.S. IR Spectral Group Frequencies of Organic Compounds. In Encyclopedia of Spectroscopy and Spectrometry; Elsevier BV: Amsterdam, The Netherlands, 2017; pp. 408–418. [Google Scholar] [CrossRef]
  32. Franklin, W.E.; Rowland, S.P. Mechanistic Aspects of Flame Retardancy in Cotton Cellulose. Text. Res. J. 1979, 49, 170–175. [Google Scholar] [CrossRef]
  33. Xue, Z.; Zhang, W.; Yan, M.; Liu, J.; Wang, B.; Xia, Y. Pyrolysis products and thermal degradation mechanism of intrinsically flame-retardant carrageenan fiber. RSC Adv. 2017, 7, 25253–25264. [Google Scholar] [CrossRef] [Green Version]
  34. Camino, G. Flame retardants: Intumescent systems. In Polymer Science and Technology Series; Springer Science and Business Media LLC: Berlin/Heidelberg, Germany, 1998; pp. 297–306. [Google Scholar] [CrossRef]
  35. Ishida, S.T. Bacteriolyses of Bacterial Cell Walls by Cu(II) and Zn(II) Ions Based on Antibacterial Results of Dilution Medium Method and Halo Antibacterial Test. J. Adv. Res. Biotechnol. 2017, 2, 1–12. [Google Scholar] [CrossRef] [Green Version]
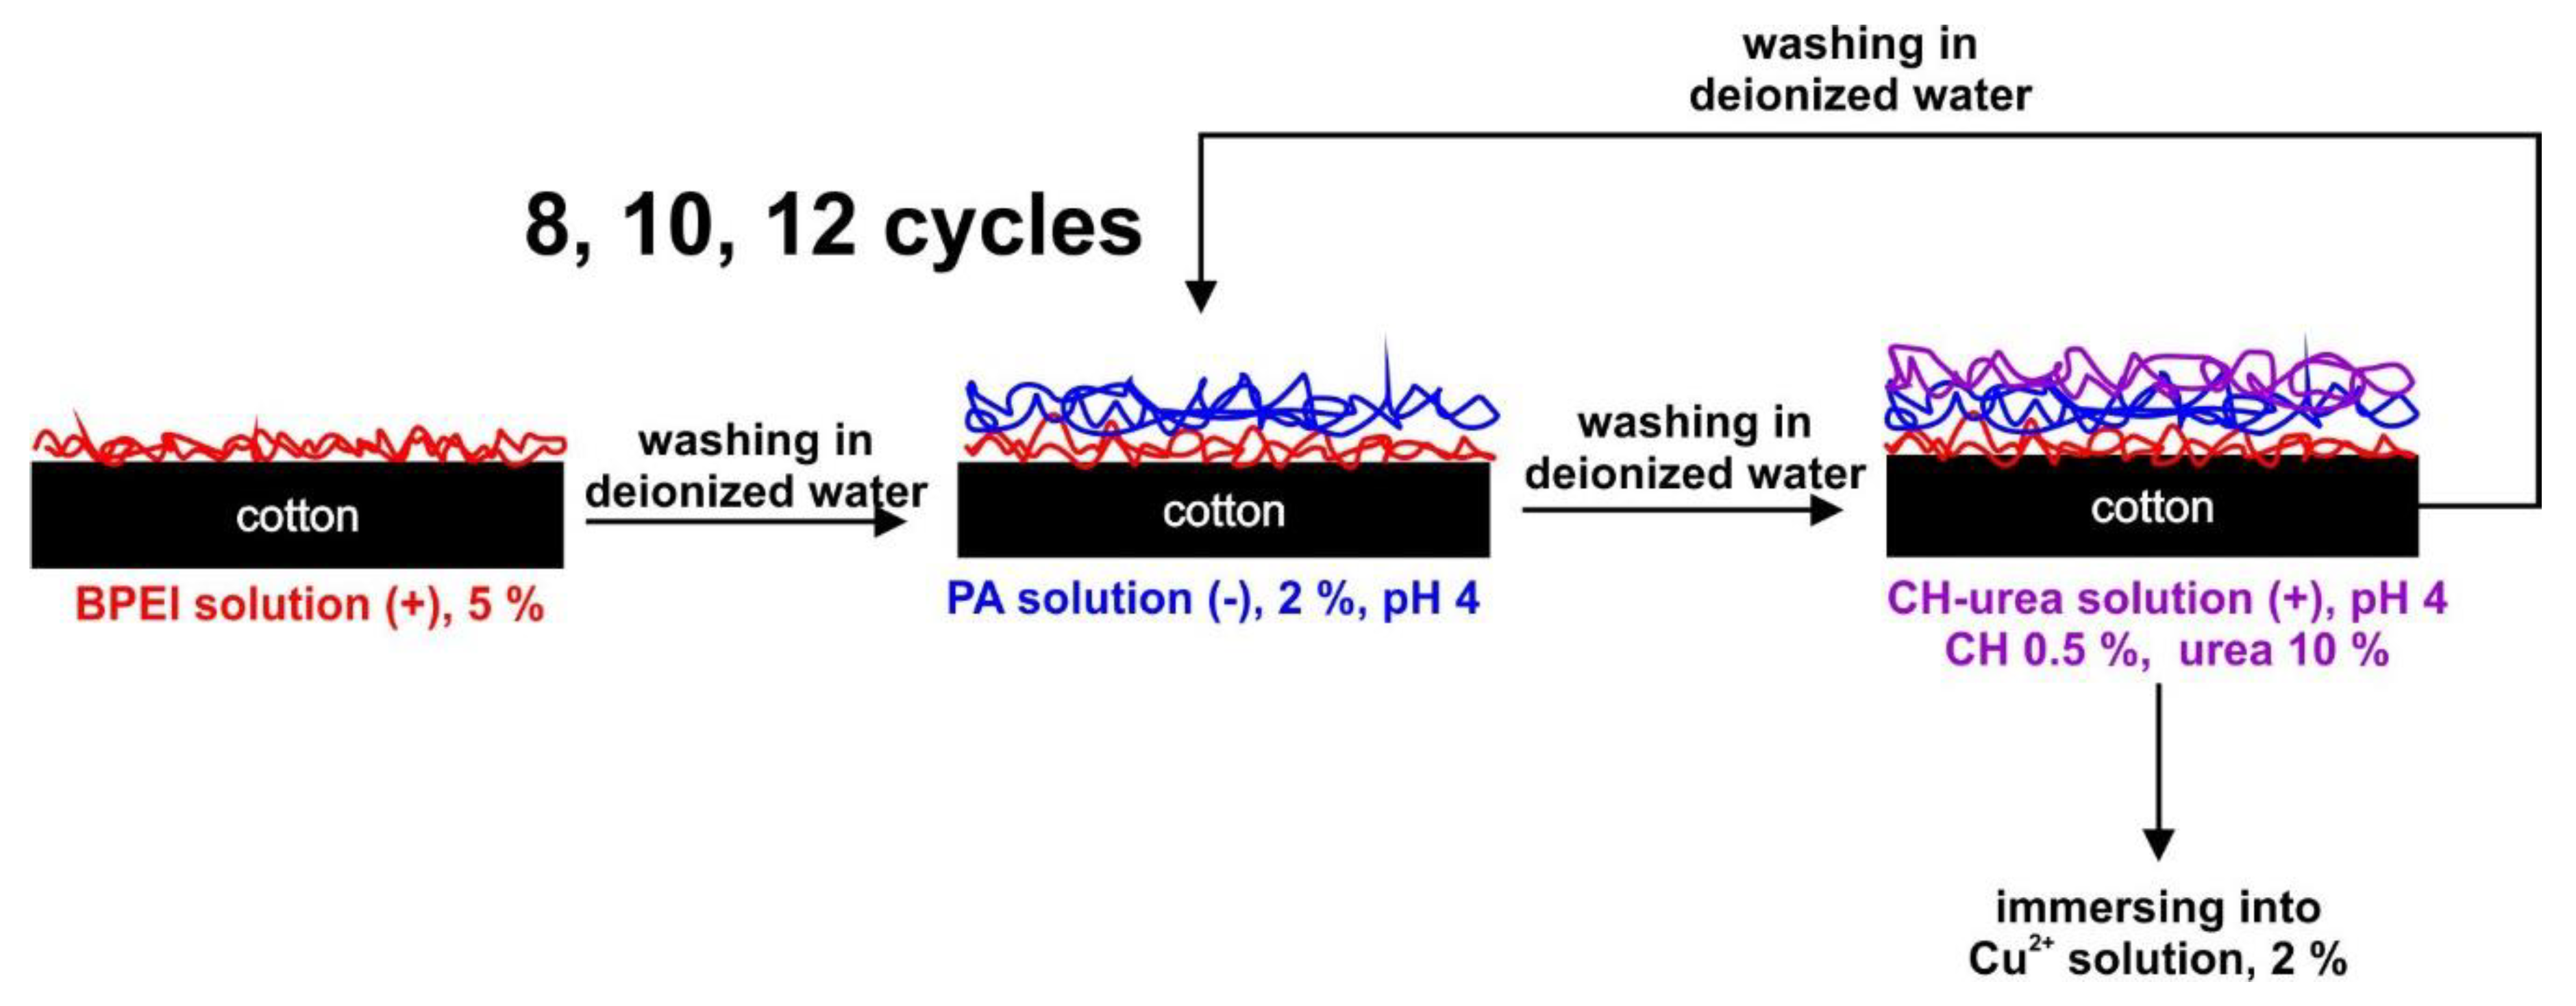
Figure 1. The LbL deposition process of FR/antimicrobial nanocoating on cotton.
Fibers 09 00069 g001
Figure 2. MCC curves for untreated cotton (control) and cotton coated with 8, 10 and 12 BL of PA/CH-urea.
Fibers 09 00069 g002
Figure 3. TGA curves for untreated (control) and 8, 10, 12 BL PA/CH-urea-treated samples.
Fibers 09 00069 g003
Figure 4. TGA curves for untreated (control) and 8, 10, 12 PA/CH-urea + Cu2+-treated samples.
Fibers 09 00069 g004
Figure 5. IR spectra of untreated and 12 BL-treated cotton at the first decomposition stage (T1).
Fibers 09 00069 g005
Figure 6. IR spectra of untreated and 12 BL-treated cotton at the second decomposition stage (T2).
Fibers 09 00069 g006
Figure 7. SEM images of cotton: (a) untreated; (b) 8 BL; (c) 8 BL + Cu.
Fibers 09 00069 g007
Figure 8. SEM images of post-burn char: (a) 8 BL; (b) 8 BL + Cu.
Fibers 09 00069 g008
Table 1. Weight gain and LOI values of cotton coated with CH-urea/PA, with and without CuSO4.
BatchNumber of BLsWeight Gain (%)LOI (%)
Controln/an/a18.0
PA/CH-urea812.3421.5
1017.5824.0
1218.5424.5
PA/CH-urea + Cu2+812.9623.5
1018.0525.5
1218.9726.0
Table 2. The results of the VFT of cotton coated with different recipes.
ControlPA/CH-UreaPA/CH-Urea + Cu2+
Number of BLn/a8101281012
Image Fibers 09 00069 i001 Fibers 09 00069 i002 Fibers 09 00069 i003 Fibers 09 00069 i004 Fibers 09 00069 i005 Fibers 09 00069 i006 Fibers 09 00069 i007
Char length (cm)n/an/an/a6.7n/an/a6.5
After flame time (s)n/an/an/a0n/an/a0
After glow time (s)n/an/an/a0n/an/a0
Table 3. MCC data of cotton coated with different recipes (with standard deviations).
SamplepHRR (W/g)ΔHRR (%)THR (kJ/g)ΔTHR (%)TpHRR (°C)
control269.4 ± 4.80.011.6 ± 0.90.0395 ± 1.4
8 BL133.2 ± 5.750.67.7 ± 0.833.6360 ± 2.4
10 BL136.7 ± 5.549.35.0 ± 0.656.9322 ± 2.7
12 BL132.2 ± 6.450.95.0 ± 1.156.9318 ± 3.0
8 BL Cu110.1 ± 6.159.17.9 ± 1.031.9320 ± 2.9
10 BL Cu108.8 ± 4.259.65.1 ± 0.756.0310 ± 1.8
12 BL Cu103.0 ± 4.161.85.3 ± 0.654.3311 ± 1.7
Table 4. Summary of thermogravimetric analysis of untreated and LbL-treated cotton.
SampleOnset 1 (°C)T1 (°C)Time (s)Weight at T1 (%)End 1 (°C)Onset 2 (°C)T2 (°C)Time (s)End 2 (°C)Weight at 650 °C (%)
control36039672743.642049657810276070.4
8 BL32436464654.438860462311588138.3
10 BL31634260258.7357527640114274513.8
12 BL31233960957.8354512636116171114.9
8 BL + Cu25833458854.937648857810666483.3
10 BL + Cu26732857658.5350502634118270514.8
12 BL + Cu26133059756.2354464636113070013.3
Table 5. Quantity of phosphorus, nitrogen, and copper in post-burn for PA/CH-urea and PA/CH-urea + Cu2+ coated cotton.
ElementPhosphorusNitrogenCopper
Atomic number15729
SeriesK-seriesK-seriesL-series
SampleAverage wt %
8 BL12.15.2n/a
10 BL1.73.3n/a
12 BL11.76.8n/a
8 BL Cu5.82.617.0
10 BL Cu8.32.36.6
12 BL Cu14.04.68.2
Table 6. Influence of treatments on the reduction of Klebsiella pneumoniae and Staphylococcus aureus bacteria after 24 h of incubation (%).
Bacterium Reduction (%)
SampleKlebsiella pneumoniaeStaphylococcus aureus
8 BL Cu99.9100
10 BL Cu99.799.9
12 BL Cu100.0100.0
Publisher’s Note: MDPI stays neutral with regard to jurisdictional claims in published maps and institutional affiliations.