Abstract
In this work, we propose analytical formulas for the estimation of dispersion properties and effective area of the fundamental mode of hollow-core inhibited coupling fibers with a microstructured cladding composed by a ring of dielectric tubes. The formulas are based on a model which has already been successfully applied to the estimation of confinement loss. The model takes into account the effects of the coupling of the fundamental core mode with the cladding modes in the context of the single-tube approximation. Effective index, group velocity dispersion, and effective area of the fundamental mode are estimated and compared with the results obtained from numerical simulations, by considering ten different fibers. The comparison shows a good accuracy of the proposed formulas, which do not require any tuning of fitting parameters. On the basis of the analysis carried out, a scaling law relating the effective area to the core radius is also given. Finally, the formulas give a good estimation of the same parameters of other Hollow-core inhibited coupling fibers, such as nested, ice-cream, and kagome fibers.
1. Introduction
Since their first demonstration [1], hollow-core fibers have been opening up plenty of opportunities in several photonic applications [2,3,4], such as high-power delivery [5,6], broadband, and super-continuum generation [7,8], and sensing [9,10,11]. Hollow-core (HC) wave-guiding can be obtained by exploiting either the absence of cladding modes, as in photonic-bandgap fibers (PBGFs), or the spatial frequency mismatch, combined with minimal spatial overlap between cladding modes and core mode, as in inhibited-coupling fibers (ICFs) [6,7,12,13], also known as anti-resonant fibers [14,15]. In the early stages of their development, ICFs suffered from higher confinement loss than PBGFs, compensated by a much wider transmission bandwidth and a much lower fraction of power inside the dielectric. A significant step forward in reducing the confinement loss was obtained with the introduction of the hypocycloid core contour (also known as negative curvature) by Benabid and co-workers [16], since it has effect both on spatial overlap and on frequency mismatch [6,17]. Other approaches based on light vortex have been proposed to explain the beneficial effects of the hypocycloidal core shap [18]. As of today, many hypocycloidal HC-ICF designs have been proposed and experimentally demonstrated, having loss not only lower than HC-PBGFs but also lower than solid-core silica fibers, both at short wavelengths [19,20], where losses are bound by Rayleigh scattering, and at long wavelengths [3,21,22], where they are bound by material absorption. In many applications, the knowledge of confinement loss, dispersion, and effective area of the fundamental mode (FM) is crucial for an effective use of such fibers. This can be accomplished thanks to the use of numerical simulators, which require high-performance computational resources. Driven by this motivation and the opportunity to better understand the confinement mechanisms, several analytical models, based both on approximated models and on empirical approaches, have been proposed [23,24,25,26,27,28,29,30,31]. Most of them focus on the effective index () and are only able to give a good estimation in a limited range of wavelengths (only one transmission band) and geometrical parameters [26,27,28,29,30]. In this work, we extend an empirical model, originally proposed for confinement loss (CL) estimation of the FM in tube lattice fibers (TLFs), [24] to also model TLF dispersion properties (, group velocity dispersion GVD) and effective area . These parameters play a fundamental role in designing fibers for non-linear applications [32], such as pulse compression [33,34], super-continuum generation [35,36], four-wave mixing [37], and Raman lasers [21]. Since the approach is based on the inhibited coupling model, and single-tube approximation [12,13,24], it takes into account the complexity of the cladding modes, allowing a good approximation over a wide range of wavelengths, fiber geometrical parameters, and dielectric refractive indices, without any need for tuning of fitting parameters. The approach also allows to obtain a scaling law relating the effective area to the TLF core radius. Finally, the results show that the analytical formulas here proposed are able to estimate with good accuracy the dispersion characteristics and effective area of other very common hypocycloidal HC-ICFs, such as kagome fibers [12,16] and nested fibers [15].
2. Model Description
In ICFs, the cladding does not exhibit any kind of bandgap. The cladding modes (CLMs) form a continuum of highly lossy solutions [12]. Despite that, ICFs have a transmission loss spectrum composed of an alternation of low- and high-loss regions, which correspond to phase-matching frequencies between core modes (CMs) and CLMs with fast and slow spatial oscillations, respectively [12,13]. Since the effective index of core modes is always very close to the core refractive index, the phase-matching frequencies can be approximated with the cut-off frequencies of the CLMs. Unfortunately, there are no analytical solutions for such CLMs and the cut-off frequencies can only be, in principle, numerically computed. However, since the field of CLMs is quite tightly confined in the dielectric, the tubes composing the cladding can be considered uncoupled from each other, and CLMs can be seen as a superposition of the modes of the single tubes. In this way, the cut-off frequencies and field distribution of CLMs can be estimated by considering a single tube. In addition, it has also been shown that the modes of tubes attached to the surrounding silica are very similar to the modes of a stand-alone tube surrounded by the material composing the fiber core [24]: this is called the single-tube approximation.
The model here proposed is based on the following observations. The high-loss regions are the result of the strong coupling of CMs with highly lossy CLMs, occurring at the cut-off frequencies of low azimuthal number modes of a single tube, and such regions can be seen as the superposition of single resonances. Each resonance affects the CM features in two ways: first, it causes a peak in the real part of the mode propagation constant, and, thus, in (dB/m); second, it causes an anti-crossing in the CM dispersion curves, which represent the imaginary part of the mode propagation constant. In the proposed model, the coupling between CMs and CLMs is described in terms of the Lorentz resonance, where the variation of the real part of the propagation constant is modeled by the function:
and the imaginary part by the function:
where F is the normalized frequency:
is the resonance frequency, and is the damping coefficient, established empirically [24].
In the context of the single-tube approximation [24], the effects of the FM-CLM resonances on and can be effectively taken into account with the formulas:
where is the empirical function giving the minimum of in each low-loss spectral region [23], and are the cut-off frequencies of the and single tube modes, is the amplitude fitting function [24], is the effective core radius that will be discussed later, and finally:
In the sum, only the strongest resonances with CLMs having have been considered. The sum is multiplied by the factor , which takes into account the FM electric field strength at the tube boundaries [23], and by the fitting factor where is the tube aspect ratio and t and are the tube thickness and external radius, respectively.
The effective radius is introduced in order to take into account the effects of the hypocycloidal core shape, and it is obtained by starting from the following same-area criterion. In the hole fiber (HF) analyzed by Marcatili and Schmeltzer in [38], the effective index of the FM is given by:
where is the first zero of equation , and is the core area. This formula is a nice approximation of the dispersion curve of the TLF FM far from the resonances, even though it tends to underestimate it, as shown in Figure 1a. By comparing the core shape and the FM electric field distribution of a HF and a TLF, as shown in Figure 1b, one can notice that the TLF FM field distribution extends over a larger area due to the hypocycloidal core shape and tube-to-tube gap. Here the TLF core shape is modeled as a disk of radius , plus a number of trapezoids equal to the tube number N. The geometrical parameters of the trapezoids are estimated as , , and , being the long base, short base, and height, respectively. The equivalent core area of a TLF is thus:
the same as an equivalent disk of radius:
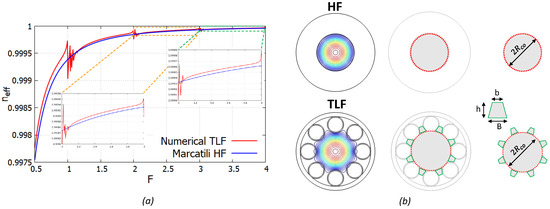
Figure 1.
Hole fiber (HF) and tube lattice fiber (TLF) comparison. (a) FM dispersion curves; (b) field profiles and core geometry.
By also taking into account the wavelength and core size dependence of the mode field distribution (with lower ratio, the field tends to penetrate further into the tube-to-tube gaps) a better estimation can be obtained by the following formula:
where the coefficients of the additional terms have been empirically obtained. Equations (5), (6) and (10) form the proposed analytical model of TLF FM effective index. By starting from the knowledge of the effective index, two important and useful parameters can be derived: the group velocity dispersion (GVD) and the effective area . The GVD is defined as:
where is the angular frequency. It can also be expressed as a function of the normalized frequency:
and directly calculated when effective index and fiber parameters are known. The effective area, in principle, depends on the spatial distribution of the mode electric field , since it is defined as:
However, by once again taking into account the HF, and by using Equation (7), Figure 2 shows that the effective area can be well approximated by:
where we have if the effective index in Equation (14) is estimated by using Marcatili’s formula given by Equation (7), while we have in case the effective index is numerically computed. Figure 2 highlights that the approximation is very good for and . For longer wavelengths up to , the use of Marcatili’s formula tends to underestimate the real , but with a relative error lower than . This is coherent with the approximations introduced in [38].
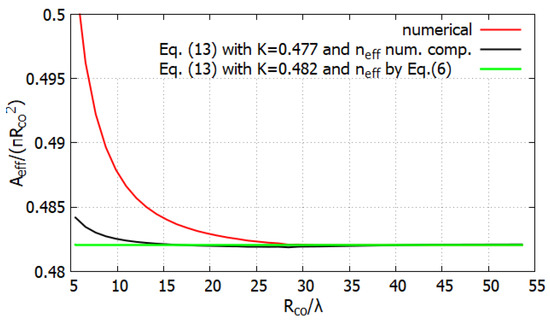
Figure 2.
Effective area normalized to core area () of a HF, plotted versus the core radius to wavelength ratio : numerical computation (solid red curve), calculation by Equation (14) with numerically computed (solid black curve), and calculation by Equation (14) with given by Equation (7) (solid green curve).
On the basis of this observation, we propose here to estimate the effective area of TLFs by using the same expression:
where the effective index is obtained from Equation (5).
3. Validation
In order to check the accuracy of the formulas here proposed, we compare the results obtained from the proposed formulas with the numerical results obtained from a modal solver based on the finite element method (FEM) with perfect matched layers (Comsol Multiphysics®). We define an error figure for each of the quantities estimated. For the effective index, the accuracy of Equations (5), (6) and (10), is quantified through the following error figure :
It takes into account that, by increasing the normalized frequency, the effective index tends asymptotically to 1, so that and must coincide over a higher and higher number of digits. Since the function has a zero in each transmission band, which results in a division by zero in the relative error definition, the error function considered in this case is different, and refers to the relative error in the estimation of the normalized frequency that gives the same value:
where and are such that . Finally, for the effective area the relative error is considered:
Figure 3 and Figure 4 compare the numerical results and the analytical estimation of , , and of an 8-tube TLF with the following parameters: , , , and this TLF from now on will be named F#1. The CL spectrum is also reported, since the accurate fiber parameter estimation is particularly important in the low-loss regions (LLRs). For this reason, the regions where CL is a decade higher than the minimum in the corresponding LLR are highlighted with a dark background. The agreement between numerical and analytical results is pretty good in all LLRs, with relative error bounds of . The empirical formulas here proposed do not require any additional fitting or tuning parameters dependent on the analyzed TLF. To demonstrate that, ten different TLFs for varying geometrical parameters and dielectric refractive index, and operating on different spectral regions, are analyzed and summarized in Table 1. They are the same fibers used to test the analytical formula in [24].
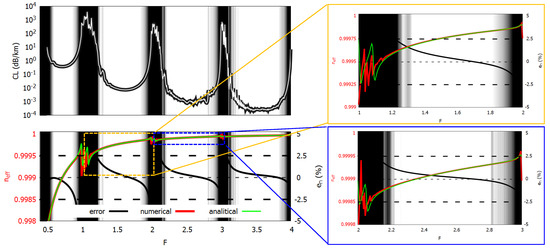
Figure 3.
Left side: Confinement loss (top) and effective index (bottom) of fiber F#1. Dark regions correspond to high-loss regions. For the effective index, solid green, red, and black curves show numerical and analytical result, and relative error, respectively. Right side: detail on the effective index in the normalized frequency ranges [1:2] (top), and [2:3] (bottom).
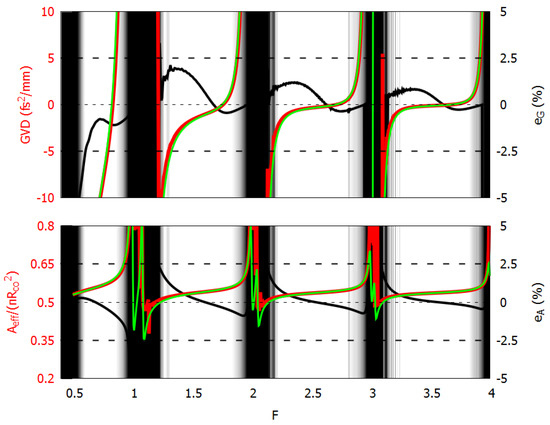
Figure 4.
Group velocity dispersion (top) and effective area (bottom) of fiber F#1. Dark regions correspond to high-loss regions. In both graphs, solid green, red, and black curves show numerical and analytical result, and relative error, respectively.

Table 1.
TLF design parameters for different spectral ranges. The fibers are the same ones considered for testing the CL formula in [24].
The geometrical parameters range spans over about three orders of magnitude, and the dielectric refractive index varies from to , corresponding to the refractive indices of silica in the near-infrared (NIR) and of chalcogenide glass such as AsS in the medium-infrared (MIR). The tube number varies between 6 and 10, covering the most common numbers usually used in real fibers. Significantly different tube aspect ratios have been compared, as that ratio, together the refractive index, strongly affects the normalized cut-off frequencies of the CLMs [13]. The results are summarized in Figure 5, Figure 6 and Figure 7 and confirm the accuracy of the model for a wide range of working frequencies and fibers’ parameters, with little bit higher errors in the fundamental LLR () with respect to the higher-order ones.
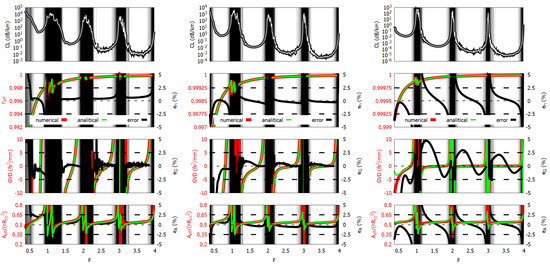
Figure 5.
Confinement loss (top row), effective index (top-central row), group velocity dispersion (bottom-central row), and effective area (bottom row) of fibers F#2 (left), F#3 (central), and F#4 (right). Dark areas correspond to high-loss regions. For effective index, group velocity dispersion, and effective area, solid green, red, and black curves show numerical and analytical result, and relative error, respectively.
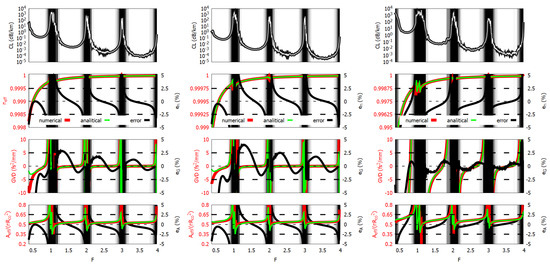
Figure 6.
Confinement loss (top row), effective index (top-central row), group velocity dispersion (bottom-central row), and effective area (bottom row) of fibers F#5 (left), F#6 (central), and F#7 (right). Dark areas correspond to high-loss regions. For effective index, group velocity dispersion, and effective area, solid green, red, and black curves show numerical and analytical result, and relative error, respectively.
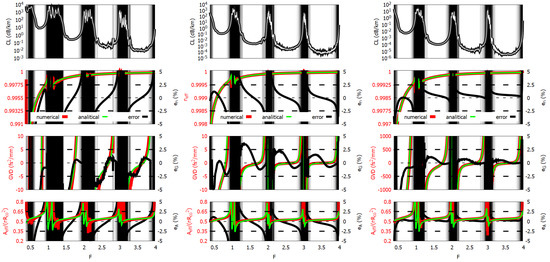
Figure 7.
Confinement loss (top row), effective index (top-central row), group velocity dispersion (bottom-central row), and effective area (bottom row) of fibers F#8 (left), F#9 (central), and F#10 (right). Dark areas correspond to high loss regions. For effective index, group velocity dispersion, and effective area, solid green, red, and black curves show numerical and analytical result, and relative error, respectively.
4. Scaling Law of Effective Area
The results shown in Figure 4, Figure 5, Figure 6 and Figure 7 highlight that in the LLRs the effective area is rather stable, even though not as much as in the HF. A good estimation of in each LLR is its value at the CL minimum, which for the fibers in Table 1 falls at a normalized frequency that has values between and in the fundamental LLR, and values around , , and in the three following LLRs, respectively. Figure 8a shows the value at those minima. The solid curves depict the function:
which gives a good estimation of the effective area at the CL minima. Figure 8b shows the relative error , that is the error between the effective area at the CL minima and the estimation given by the previous function. The relative error associated with Equation (19) is within in the fundamental LLR and within in the higher-order LLRs. By accepting a rougher approximation, we can state the simplified formula:
which gives a relative error within .
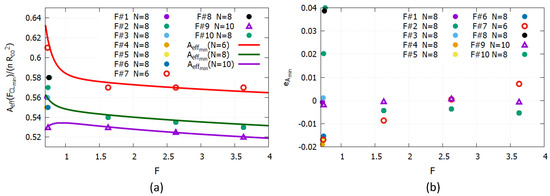
Figure 8.
(a): Effective area normalized to , calculated at the normalized frequencies of the CL minima. (b): Relative error of Equation (19) with respect to numerical results of . Filled dots refer to numerical results for fibers with , red empty circles to and violet triangles to . Solid curves refer to results from Equation (Figure 8) with (red), (green), and (violet).
5. Extension to Filled TLFs
Since most HC-ICFs applications require the fiber to be filled with gas or liquids to exploit their properties, we also investigate the effectiveness of the approach in computing the dispersion characteristics in case of TLFs filled with a material that has a refractive index . In this case, by taking into account Marcatili’s formula for [2], Equations (5) and (15) become:
and
with:
and, consequently:
Figure 9 shows the results for fiber F#2 in case of and , corresponding to the refractive indexes of Xenon and of water, respectively, in the visible spectral region.
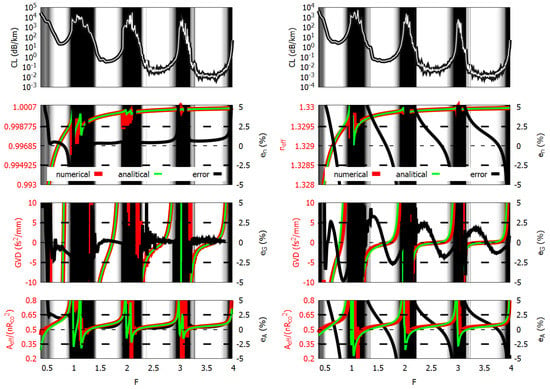
Figure 9.
Confinement loss (top row), effective index (top-central row), group velocity dispersion (bottom-central row), and effective area (bottom row) of fiber F#2 with (left) and (right). Dark areas correspond to high-loss regions. For effective index, group velocity dispersion, and effective area, solid green, red, and black curves show numerical and analytical result, and relative error, respectively.
Additionally, in these cases, all the error figures are in the range . Figure 10 shows the estimation of the wavelength corresponding to the zero of GVD in the second () and third () transmission bands for different values of . The relative error in this case is in the order of and , respectively.

Figure 10.
Zero GVD wavelength versus the filling material refractive index of fiber F#2 in the second (left) and third (right) transmission bands, obtained from numerical (red dots) and analytical (blue dots) results. The relative error is shown in black.
6. Other HC-ICFs
Finally, the effectiveness of the approach as been tested on other hypocycloidal HC-ICFs, in particular, nested fibers (NFs) [15], ice-cream fibers (IFs) [9,22], and kagome fibers (KFs) [12]. Panel (a) of Figure 11 shows the cross-sections of the three fibers, highlighting the circles composing the equivalent TLFs used for the parameter computation. Geometrical parameters and refractive index of the dielectric are shown in Table 2. The refractive index of the filling material is here assumed to be . In NFs, the nested tubes have an external radius and thickness t. In KFs, the equivalent TLF has six tubes with the same radius as the largest arcs of the KF, and the same core radius. The results of NF#1 and IF#1 are shown in panel (b) of Figure 11, and the ones of the KFs in Figure 12.
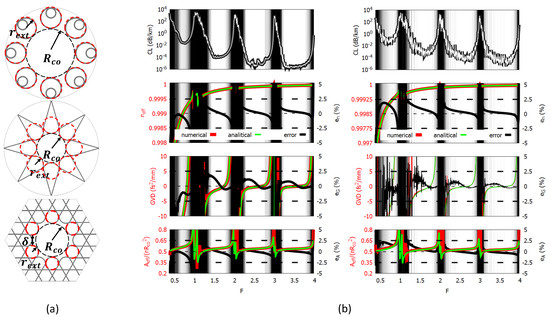
Figure 11.
(a) From top to bottom: cross-sections (grey) of nested, ice-cream, and KF, emphasizing in red the size and placement of the tubes of the equivalent TLF used for parameter computation. (b) Confinement loss (top row), effective index (top-central row), group velocity dispersion (bottom-central row), and effective area (bottom row) of nested tube (left) and ice-cream fibers (right).

Table 2.
Parameters of equivalent TLFs, used for the analysis of NF, IF, and KFs.
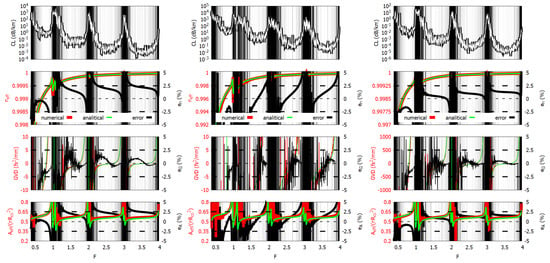
Figure 12.
Confinement loss (top row), effective index (top-central row), group velocity dispersion (bottom-central row), and effective area (bottom row) of KF#1 (left), KF#2 (center), and KF#3 (right).
As expected, the NF#1 results are not so different from F#1, since the mode dispersion and the spatial distribution of the electric field of the mode are mainly defined by the core boundary, which is the same.
In IC#1, the core boundary is very similar to a TLF with . For this kind of fiber as well, the analytical formulas show good agreement and small error values with respect to the numerical results. The rapid oscillations in the curve are due to the residual coupling with cladding modes, which is a feature of these fibers. The same effect is observed in KFs. Despite the different core shape, the agreement between numerical results and analytical ones (obtained considering the equivalent TLF) is just marginally worse than for other HC-ICFs, but nevertheless showing error figures that remain within a few percentage points.
In this case, the error figures are a little bit higher than for the previous fibers, but they are still inside the range of a few percents. The worsening was predictable, given the different geometry, however we think that the proposed approach can be an effective and fruitful tool for the dispersion analysis and design of KFs as well.
7. Conclusions
In this paper, empirical formulas for the estimation of the dispersion characteristics (effective index, group velocity dispersion) and effective area of the fundamental mode of hollow-core tube lattice fibers have been proposed. An analytical formula is also given for the estimation of the FM effective area at the center of the LLRs. They have been developed starting from the single-tube approximation, which allows an accurate representation of the cladding modes, whose characteristics and complexity cannot be overlooked if accurate models of TLFs are to be developed. The formulas do not require any additional tuning of fitting parameters depending on the particular TLF under analysis. This has been demonstrated by computing the accuracy of the formulas for a wide variety of TLFs operating from THz to UV spectral ranges, by changing geometrical parameters, number of tubes, and dielectric refractive index both of the material composing the tubes and of the one filling the fiber. Finally it has been shown the formulas also give a good approximation of other hypocycloidal HC-ICFs, such as nested, ice-cream, and kagome fibers.
Author Contributions
Conceptualization, L.V.; investigation, L.R., F.M. and L.V.; methodology, L.R. and L.V.; resources, L.V.; software, L.R. and F.M.; supervision, L.V.; validation, L.R., F.M. and L.V.; visualization, L.R., F.M. and L.V.; writing—original draft, L.R., F.M. and L.V.; writing—review and editing, L.R., F.M. and L.V. All authors have read and agreed to the published version of the manuscript.
Funding
This research received no external funding.
Conflicts of Interest
The authors declare no conflict of interest.
References
- Cregan, R.F.; Mangan, B.J.; Knight, J.C.; Birks, T.A.; Russell, P.S.J.; Roberts, P.J.; Allan, D.C. Single-Mode Photonic Band Gap Guidance of Light in Air. Science 1999, 285, 1537–1539. [Google Scholar] [CrossRef] [PubMed] [Green Version]
- Setti, V.; Vincetti, L.; Argyros, A. Flexible tube lattice fibers for terahertz applications. Opt. Express 2013, 21, 3388–3399. [Google Scholar] [CrossRef]
- Kolyadin, A.N.; Kosolapov, A.F.; Pryamikov, A.D.; Biriukov, A.S.; Plotnichenko, V.G.; Dianov, E.M. Light transmission in negative curvature hollow core fiber in extremely high material loss region. Opt. Express 2013, 21, 9514–9519. [Google Scholar] [CrossRef]
- Wei, C.; Young, J.T.; Menyuk, C.R.; Hu, J. Temperature Sensor Using Fluid-Filled Negative Curvature Fibers. In Proceedings of the Conference on Lasers and Electro-Optics, San Jose, CA, USA, 5–10 May 2018; Optical Society of America: Washington, DC, USA, 2018; p. JW2A.179. [Google Scholar] [CrossRef]
- Gattass, R.R.; Rhonehouse, D.; Gibson, D.; McClain, C.C.; Thapa, R.; Nguyen, V.Q.; Bayya, S.S.; Weiblen, R.J.; Menyuk, C.R.; Shaw, L.B.; et al. Infrared glass-based negative-curvature anti-resonant fibers fabricated through extrusion. Opt. Express 2016, 24, 25697–25703. [Google Scholar] [CrossRef] [PubMed] [Green Version]
- Debord, B.; Amsanpally, A.; Chafer, M.; Baz, A.; Maurel, M.; Blondy, J.M.; Hugonnot, E.; Scol, F.; Vincetti, L.; Gérôme, F.; et al. Ultralow transmission loss in inhibited-coupling guiding hollow fibers. Optica 2017, 4, 209–217. [Google Scholar] [CrossRef] [Green Version]
- Couny, F.; Benabid, F.; Roberts, P.J.; Light, P.S.; Raymer, M.G. Generation and Photonic Guidance of Multi-Octave Optical-Frequency Combs. Science 2007, 318, 1118–1121. [Google Scholar] [CrossRef]
- Cassataro, M.; Novoa, D.; Günendi, M.C.; Edavalath, N.N.; Frosz, M.H.; Travers, J.C.; Russell, P.S. Generation of broadband mid-IR and UV light in gas-filled single-ring hollow-core PCF. Opt. Express 2017, 25, 7637–7644. [Google Scholar] [CrossRef] [Green Version]
- Yu, F.; Knight, J.C. Negative Curvature Hollow-Core Optical Fiber. IEEE J. Sel. Top. Quantum Electron. 2016, 22, 146–155. [Google Scholar] [CrossRef] [Green Version]
- Liu, X.L.; Ding, W.; Wang, Y.Y.; Gao, S.F.; Cao, L.; Feng, X.; Wang, P. Characterization of a liquid-filled nodeless anti-resonant fiber for biochemical sensing. Opt. Lett. 2017, 42, 863–866. [Google Scholar] [CrossRef]
- Giovanardi, F.; Cucinotta, A.; Vincetti, L. Inhibited coupling guiding hollow fibers for label-free DNA detection. Opt. Express 2017, 25, 26215–26220. [Google Scholar] [CrossRef]
- Debord, B.; Amrani, F.; Vincetti, L.; Gérôme, F.; Benabid, F. Hollow-Core Fiber Technology: The Rising of “Gas Photonics”. Fibers 2019, 7, 16. [Google Scholar] [CrossRef] [Green Version]
- Vincetti, L.; Setti, V. Waveguiding mechanism in tube lattice fibers. Opt. Express 2010, 18, 23133–23146. [Google Scholar] [CrossRef] [PubMed]
- Litchinitser, N.M.; Abeeluck, A.K.; Headley, C.; Eggleton, B.J. Antiresonant reflecting photonic crystal optical waveguides. Opt. Lett. 2002, 27, 1592–1594. [Google Scholar] [CrossRef] [PubMed]
- Poletti, F. Nested antiresonant nodeless hollow core fiber. Opt. Express 2014, 22, 23807–23828. [Google Scholar] [CrossRef] [PubMed]
- Wang, Y.Y.; Wheeler, N.V.; Couny, F.; Roberts, P.J.; Benabid, F. Low loss broadband transmission in hypocycloid-core Kagome hollow-core photonic crystal fiber. Opt. Lett. 2011, 36, 669–671. [Google Scholar] [CrossRef]
- Debord, B.; Alharbi, M.; Bradley, T.; Fourcade-Dutin, C.; Wang, Y.; Vincetti, L.; Gérôme, F.; Benabid, F. Hypocycloid-shaped hollow-core photonic crystal fiber Part I: Arc curvature effect on confinement loss. Opt. Express 2013, 21, 28597–28608. [Google Scholar] [CrossRef] [PubMed]
- Pryamikov, A.; Alagashev, G.; Falkovich, G.; Turitsyn, S. Light transport and vortex-supported wave-guiding in micro-structured optical fibres. Sci. Rep. 2020, 10, 2045–2322. [Google Scholar] [CrossRef]
- Osório, J.; Foued, A.; Frederic, D.; Ali, D.; Kostiantyn, V.; Gilles, T.; Fabio, G.; Luca, V.; Benoit, D.; Frederic, G.; et al. Sub-thermodynamic equilibrium surface roughness in hollow-core fibers for the ultraviolet range. In Proceedings of the European Optical Society Annual Meeting, Rome, Italy, 13–17 September 2021. [Google Scholar]
- Gao, S.f.; Wang, Y.y.; Ding, W.; Hong, Y.f.; Wang, P. Conquering the Rayleigh Scattering Limit of Silica Glass Fiber at Visible Wavelengths with a Hollow-Core Fiber Approach. Laser Photonics Rev. 2020, 14, 1900241. [Google Scholar] [CrossRef] [Green Version]
- Gladyshev, A.V.; Kosolapov, A.F.; Khudyakov, M.M.; Yatsenko, Y.P.; Kolyadin, A.N.; Krylov, A.A.; Pryamikov, A.D.; Biriukov, A.S.; Likhachev, M.E.; Bufetov, I.A.; et al. 2.9, 3.3, and 3.5 μm Raman Lasers Based on Revolver Hollow-Core Silica Fiber Filled by 1H2/D2 Gas Mixture. IEEE J. Sel. Top. Quantum Electron. 2018, 24, 1–8. [Google Scholar] [CrossRef]
- Yu, F.; Knight, J.C. Spectral attenuation limits of silica hollow core negative curvature fiber. Opt. Express 2013, 21, 21466–21471. [Google Scholar] [CrossRef] [Green Version]
- Vincetti, L. Empirical formulas for calculating loss in hollow core tube lattice fibers. Opt. Express 2016, 24, 10313–10325. [Google Scholar] [CrossRef]
- Vincetti, L.; Rosa, L. A simple analytical model for confinement loss estimation in hollow-core Tube Lattice Fibers. Opt. Express 2019, 27, 5230–5237. [Google Scholar] [CrossRef] [PubMed]
- Bird, D. Attenuation of model hollow-core, anti-resonant fibres. Opt. Express 2017, 25, 23215–23237. [Google Scholar] [CrossRef]
- Zeisberger, M.; Schmidt, M.A. Analytic model for the complex effective index of the leaky modes of tube-type anti-resonant hollow core fibers. Sci. Rep. 2017, 7, 11761. [Google Scholar] [CrossRef] [Green Version]
- Hasan, M.I.; Akhmediev, N.; Chang, W. Empirical Formulae for Dispersion and Effective Mode Area in Hollow-Core Antiresonant Fibers. IEEE/OSA J. Light. Technol. 2018, 36, 4060–4065. [Google Scholar] [CrossRef]
- Provino, L. Effect of Nested Elements on Avoided Crossing between the Higher-Order Core Modes and the Air-Capillary Modes in Hollow-Core Antiresonant Optical Fibers. Fibers 2018, 6, 42. [Google Scholar] [CrossRef] [Green Version]
- Bache, M.; Habib, M.S.; Markos, C.; Lægsgaard, J. Poor-man’s model of hollow-core anti-resonant fibers. J. Opt. Soc. Am. B 2019, 36, 69–80. [Google Scholar] [CrossRef]
- Deng, A.; Hasan, I.; Wang, Y.; Chang, W. Analyzing mode index mismatch and field overlap for light guidance in negative-curvature fibers. Opt. Express 2020, 28, 27974–27988. [Google Scholar] [CrossRef] [PubMed]
- Song, P.; Phoong, K.Y.; Bird, D. Quantitative analysis of anti-resonance in single-ring, hollow-core fibres. Opt. Express 2019, 27, 27745–27760. [Google Scholar] [CrossRef]
- Agrawal, G.P. Nonlinear Fiber Optics, 6th ed.; Academic Press: Boston, MA, USA, 2019. [Google Scholar]
- Heckl, O.H.; Saraceno, C.J.; Baer, C.R.E.; Südmeyer, T.; Wang, Y.Y.; Cheng, Y.; Benabid, F.; Keller, U. Temporal pulse compression in a xenon-filled Kagome-type hollow-core photonic crystal fiber at high average power. Opt. Express 2011, 19, 19142–19149. [Google Scholar] [CrossRef] [PubMed]
- Debord, B.; Alharbi, M.; Vincetti, L.; Husakou, A.; Fourcade-Dutin, C.; Hoenninger, C.; Mottay, E.; Gérôme, F.; Benabid, F. Multi-meter fiber-delivery and pulse self-compression of milli-Joule femtosecond laser and fiber-aided laser-micromachining. Opt. Express 2014, 22, 10735–10746. [Google Scholar] [CrossRef] [PubMed]
- Belli, F.; Abdolvand, A.; Chang, W.; Travers, J.C.; Russell, P.S. Vacuum-ultraviolet to infrared supercontinuum in hydrogen-filled photonic crystal fiber. Optica 2015, 2, 292–300. [Google Scholar] [CrossRef]
- Debord, B.; Gérôme, F.; Honninger, C.; Mottay, E.; Husakou, A.; Benabid, F. Milli-Joule energy-level comb and supercontinuum generation in atmospheric air-filled inhibited coupling Kagome fiber. In Proceedings of the 2015 Conference on Lasers and Electro-Optics (CLEO), San Jose, CA, USA, 10–15 May 2015; pp. 1–2. [Google Scholar] [CrossRef]
- Belli, F.; Abdolvand, A.; Travers, J.C.; Russell, P.S.J. Highly efficient deep UV generation by four-wave mixing in gas-filled hollow-core photonic crystal fiber. Opt. Lett. 2019, 44, 5509–5512. [Google Scholar] [CrossRef] [PubMed] [Green Version]
- Marcatili, E.A.J.; Schmeltzer, R.A. Hollow metallic and dielectric waveguides for long distance optical transmission and lasers. Bell Syst. Tech. J. 1964, 43, 1783–1809. [Google Scholar] [CrossRef]
Publisher’s Note: MDPI stays neutral with regard to jurisdictional claims in published maps and institutional affiliations. |
© 2021 by the authors. Licensee MDPI, Basel, Switzerland. This article is an open access article distributed under the terms and conditions of the Creative Commons Attribution (CC BY) license (https://creativecommons.org/licenses/by/4.0/).