Abstract
Replacing greenhouse gas-intensive building materials with wood products from sustainable forestry contributes to the implementation of current climate conventions such as the Paris Agreement. Hardwood products, such as laminated veneer lumber made of beech (e.g., BauBuche), are an alternative to conventional building materials. For the application of wood products in the construction sector, a precise knowledge of the mechanical and physical properties is essential. Therefore, the aim of the present study was to investigate the sorption behavior and associated dimensional changes of the product BauBuche. This was done by applying a manual testing procedure (climatic chamber, balance and caliper) as well as a dynamic vapor sorption analyzer equipped with a camera. During initial moistening after production, due to the irreversible spring back (approximately 2 mm at 50 mm; i.e., 4%), Baubuche shows an extremely strong swelling in the radial direction. Once the maximum spring back is reached, Baubuche shows sorption behavior in the radial and tangential direction, which is comparable to that of solid beech wood in the radial direction. Consequently, the dimensional changes caused by moisture changes must be taken into account in the dimensioning of Baubuche components in order to avoid damage to building structures.
1. Introduction
The ratification of the Paris Agreement [1] entails an obligation for industrialized countries to reduce greenhouse gas emissions. One contribution to meeting this requirement could be the utilization of wood instead of greenhouse gas-intensive building materials. This would result in an increase in demand for wooden construction materials.
In Germany, however, the availability of spruce structural timber from own domestic forests is expected to decline in the long term due to current forest policy. In order to balance various forest interests, the Forest Strategy 2020 [2] proposes, among other things, the establishment of near-natural mixed forests from native tree species appropriate to the location. Consequently, it can be assumed that the timber industry and the construction industry will adapt to hardwood-based materials.
While the use of solid beech wood in particular poses challenges for the construction industry due to its growth form and high anisotropy, structural wood materials such as laminated veneer lumber (LVL), for which an attenuated anisotropic behavior is promised, could be a promising alternative. The Pollmeier Massivholz GmbH & Co. KG (Creuzburg, Germany) recognized this connection and has been producing LVL from beech (BauBuche). However, comprehensive knowledge of material properties is needed to use laminated beech veneer lumber and other such innovative wood products that present a new class of material in the building sector.
For construction planning, materials need to fulfill minimum requirements, e.g., in terms of structural-physical characteristic values, which are stated in standards. In addition to surpassing these thresholds, the variability of the construction materials plays a crucial part. In this respect, engineered wood products are superior compared to solid wood, due to the homogenization of natural raw material variability. This homogenization is achieved by generating specially designed wood cuttings that are systematically re-connected using synthetic resins [3]. This decrease in variability is especially beneficial for beech, due to its high anisotropy and large dimensional changes caused by typical moisture changes in buildings.
Technical strength properties for structural calculations are known and given for the commercial product called “BauBuche” (“ConstructionBeech”) within the declarations of product performance (e.g., “PM-005-2018”). Basic behavior in terms of humidity absorption and desorption are to be found in the product data sheets “Structural physics”. Here it is stated that the equilibrium moisture content of BauBuche does not differ significantly from that of other wood species.
Dimensional changes in terms of wood moisture content changes are denoted as the ratio between the rate of change in dimension and the rate of change in wood moisture content. In this context, it is pointed out that the wood moisture content of BauBuche is 6% (±2%) ex works and the material tends to swell and shrink as the wood moisture content changes below the fiber saturation level (approx. 35% wood moisture content). However, details of the moisture-induced dimensional changes are missing. It is unclear, for example, whether the material behaves like solid wood or whether the manufacturing process leads to specific swelling and shrinkage behavior when absorbing and releasing moisture, with effects on the strength properties in extreme cases.
Therefore, it was the intention of the present study to investigate the behavior of LVL made from beech in terms of humidity absorption and desorption. This was done by applying a manual testing procedure (climatic chamber, balance and caliper) as well as with a dynamic vapor sorption analyzer equipped with a camera. Finally, on the basis of the results, practical advice on the proper use of BauBuche in the building sector is given.
2. Materials and Methods
2.1. Material
For the experiments, kiln-dried solid wood of European beech (Fagus sylvatica) and LVL made from beech were used. The solid beech wood was bought at commercial timber trading company. The laminated beech veneer lumber used was produced in the form of the product “BauBuche Paneel” (45 mm in thickness) by Pollmeier Massivholz GmbH & Co. KG in the period from 2017 to 2019.
Based on the anatomical directions of solid wood, the direction in which the grain of the veneer is oriented in the test specimen is understood as the longitudinal direction. The tangential direction of solid wood corresponds to the direction of the adhesive joints in the cross section perpendicular to the longitudinal direction. The remaining third direction is called radial direction (Figure 1).
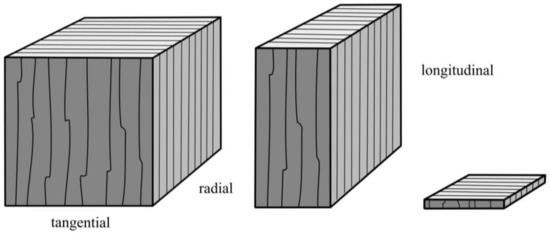
Figure 1.
Visualization of the test specimen sizes and clarification of the test specimen directions defined according to the anatomical directions of solid wood (longitudinal × radial × tangential). From left to right: 45 × 45 × 45 mm3, 50 × 50 × 20 mm3 (both examined with the manual test procedure) and 1.5 × 20 × 20 mm3 (gravimetric vapor sorption analyzer examination).
2.2. Wood Moisture Content and Dimensional Change Measurement at Different Climatic Conditions by Using Manual Test Procedure
2.2.1. Specimen Preparation
A total of 70 LVL test specimens were cut, with 26 test specimens of cubic dimensions (45 × 45 × 45 mm3) and 44 test specimens of flat dimensions (50 × 50 × 20 mm3). The dimensions of the flat test specimens were oriented as follows: 50 mm each in longitudinal and radial direction, 20 mm in tangential direction. Before the experiment started, all test specimens had been conditioned (the climatic chamber used is mentioned in the following chapter) at climate conditions of 20 °C and 65% relative humidity (r. h.) until mass constancy was reached.
2.2.2. Equipment Used for Experiment Execution
The exposure of the test specimens to various climate conditions was carried out in a climate chamber (Weiss Umwelttechnik GmbH, Reiskirchen, Germany). Specimens’ mass was recorded with a precision lab balance (Sartorius AG, Göttingen, Germany). The dimensions of the test specimens were recorded with a digital caliper (Mitutoyo Europe GmbH, Neuss, Germany). An oven (Heraeus Holding GmbH, Hanau, Germany) was used for drying the test specimens.
2.2.3. Test Procedure
The conditioned test specimens of different dimensions were each divided into two sample sets and their dimensions and mass were determined. Subsequently, one set each of the cubic and flat test specimens was exposed to a sequence of ambient climates with increasing air humidity and temperature (Absorption Sequence), and the other two sets of test specimens were exposed to a sequence of ambient climates with decreasing air humidity and temperature (Desorption Sequence). Starting from the initial conditioning at 20 °C and 65% r. h., the following climatic conditions were set:
Absorption Sequence
- 20 °C and 85% r. h.
- 20 °C and 95% r. h.
- 30 °C and 95% r. h.
Desorption Sequence
- 20 °C and 50% r. h.
- 20 °C and 35% r. h.
- 30 °C and 25% r. h.
Following their passage through the sequences of various climate conditions, the test specimens were again stored at 20 °C and 65% r.h. until mass constancy was reached. After this last conditioning, the specimens were dried at 103 °C.
The mass and dimensions of the test specimens were determined at irregular intervals. If mass constancy was present, the next climate level was set.
2.2.4. Determination of the Wood Moisture Content
The wood moisture content u was determined for each test specimen at each climatic condition based on DIN EN 13183-1 following Equation (1),
with mh = mass of the specimen at humid climate condition, and m0 = mass of the oven dried specimen.
u = (mh − m0)/m0 × 100%
2.2.5. Determination of the Dimensional Changes
The dimensional change dc (swelling) was determined for each test specimen at each climatic condition in radial, tangential and longitudinal direction based on DIN 52184 following Equation (2),
with lh = length of the specimen at humid climate condition in radial, tangential or longitudinal direction, and l0 = length of the oven dried specimen in the appropriate direction.
dc = (lh − l0)/l0 × 100%
Although shrinkage of the wood also occurs in the sequences of climatic conditions (reduction in length due to the reduction in wood moisture content), the calculations carried out speak only of swelling. Finally, the actual length of the test specimen is always related to the length of the dried test specimen. This choice of words is intended to clearly distinguish it from shrinkage, which is calculated by relating the current length of the test specimen to the length of the test specimen when wet. Deviating from the standard, the longitudinal swelling was determined on specimens with a length of 45 mm or 50 mm instead of 100 mm in the grain direction.
2.2.6. Calculation of the Differential Swelling Value
On the one hand, the differential swelling q (swelling percentage of the wood per 1% change in wood moisture) in each direction was calculated in principle according to the approach proposed in DIN 52184, whereby elements in the given formula (Equation (3)),
with
q = (lh − ld)/l0 (uh − ud) × 100%/%
- lh = length of the specimen at humid climate condition in radial, tangential or longitudinal direction,
- ld = length of the specimen at dry climate condition in the appropriate direction,
- l0 = length of the oven dried specimen in the appropriate direction,
- uh = wood moisture content of the specimen at humid climate condition, and
- ud = wood moisture content of the specimen at dry climate condition,
were transformed as follows. Instead of the difference between the length of the test specimen in a humid climate and a dry climate related to the length of the oven dry test specimen ([lh − ld]/l0 × 100%), the difference between the swelling in a humid climate and a dry climate (dch − dcd) was set in relation to the difference between the wood moisture content in a humid climate and a dry climate (uh − ud) (Equation (4)).
with dch = linear swelling of the specimen at humid climate condition, dcd = linear swelling of the specimen at dry climate condition, uh = wood moisture content of the specimen at humid climate condition, and ud = wood moisture content of the specimen at dry climate condition.
q = (dch − dcd)/(uh − ud) %/%
In addition to the humid climate proposed in the standard with a temperature of 20 °C and relative humidity of 85% and a dry climate of 20 °C and 35% relative humidity, the linear swelling and wood moisture content at two further humid climates (20 °C, 65% r. h. and 30 °C, 95% r. h.) and a dry climate (30 °C, 25% r. h.) were used to calculate differential swelling.
On the other hand, the differential swelling in each direction was determined as the slope of the trend line, which was calculated by means of regression calculation using the meaningful data points of wood moisture (x-value) and linear swelling (y-value). As evaluation criterion of the goodness-of-fit of the regression, coefficient of determination (R2) was calculated. The evaluation of the meaningfulness was based on the data evaluation in Section 3.
2.2.7. Data Preparation and Statistical Analysis
For data preparation (incl. outlier identification), statistical characteristics calculation (e.g., mean value, standard deviation, coefficient of variance, and percentiles), and graphics creation, Microsoft Excel (Microsoft Corporation, Redmond, WA, USA) was applied. Statistical analyses (mean value comparison as well as the preliminary tests to determine the appropriate methods for this) were conducted by applying the analysis tool JMP (SAS Institute, Cary, NC, USA).
Each dataset obtained from measurements was checked for extreme outliers by applying the interquartile range (IQR) method; IQR is the difference between the third quartile (Q3 or 75%-percentile) and the first quartile (Q1 or 25%-percentile). As the lower criterion for the definition as an extreme outlier the first quartile minus the triple IQR (Q1 − 3 IQR); as the upper criterion the third quartile plus the triple IQR (Q3 + 3 IQR) was defined. Extreme outliers were excluded from the evaluation.
For the selection of the suitable test methods for mean value comparison, the adjusted data of each set of test specimens (sample) was examined for normal distribution using the Shapiro–Wilk Test at a significance level of α = 0.01. Data from normally distributed samples to be compared were further examined for homogeneity of variance applying the Levene Test at a significance level of α = 0.05.
Normally distributed samples for which homogeneity of variance exists were tested for any statistically significant differences using the two-sample t-Test at a significance level of α = 0.05. Normally distributed samples for which there is no homogeneity of variance were investigated using the Welch Test at the same significance level. If normal distribution was not available for the two samples, the Mann–Whitney Test was applied at the significance level mentioned before. The procedure of test selection is illustrated in Benthien and Ohlmeyer [4], whereby in the present case all paths are irrelevant for more than two samples.
The mean value comparison was used to investigate whether there were differences between the flat and cubic test specimens for the moisture content and the differential dimensional change.
2.3. Wood Moisture Content and Dimensional Change Measurement by Using a Gravimetric Vapor Sorption Analyzer
2.3.1. Test Specimen Preparation
The two test specimens, one made of LVL (made from beech) and one of solid beech wood, were first roughly cut to dimensions of 1.5 × 30 × 30 mm3 (longitudinal, radial, tangential) using a circular table saw. The final dimensions of 1.5 × 20 × 20 mm3 were achieved with a wood shaper. Afterwards, a 2 mm hole was drilled into the middle of the test specimens. The definition of the directions of the LVL test specimens based on the anatomical directions of solid wood can be found in Section 2.1. The solid wood test specimen was cut within the adult wood region to obtain a test specimen with year rings parallel to one edge of the test specimen. Prior to the measurement, the solid wood test specimen was immersed into distilled water for 1 week. For the test specimen made of LVL, this procedure could not be performed because the test specimens disintegrated.
Mass and density at 0% relative humidity of the solid wood specimen were 0.46 g and 748 kg/m3, and 0.53 g and 805 kg/m3 in the case of the LVL specimen.
2.3.2. System Used for Experiment Execution
The automated measurement of mass and dimensional change under changing ambient conditions were performed using the gravimetric vapor sorption analyzer SPSx-1μ-High-Load from ProUmid GmbH & Co. KG (Ulm, Germany), which was equipped with a Large Objects Sample Tray. An attached CCD camera (acA2040-25gc, Basler AG, Ahrensburg, Germany) was used to collect individual images at every mass measurement time. The test specimen holder used was developed in an earlier project with the intention of exposing a maximum surface area of the test specimen to ambient air. Further information on the method can be found in Nopens et al. [5].
2.3.3. Test Procedure
The measurements were performed at 20 °C; the initial relative humidity was 85%. As indicated in the description of the test specimen preparation, the LVL test specimen was placed in the measuring instrument without pre-treatment. The solid wood test specimen was immersed into distilled water for 1 week. This means that the LVL test specimen was moistened, whereas the solid wood test specimen released moisture until mass constancy was reached. In the course of the test, the humidity was first stepwise reduced to a value of 0% and then stepwise increased to the initial value of 85%. The steps of the humidity change amounted 5% or 10%. The change to the next humidity stage was made when mass constancy was reached (see next chapter for definition). Images of the test specimen dimensions were taken via the connected camera at each measuring step of the sorption balance, which occur every quarter-hour (15 min).
2.3.4. Applied Definition of Mass Constancy
Mass constancy for each equilibrium setting was achieved if the mass change was lower than 0.01% within 60 min calculated by linear regression of the last five measurement points within the experiment. This is in agreement with actual recommendations [6]. Additionally, a minimum cycle time of 36 h was set.
2.3.5. Determination of the Wood Moisture Content
The wood moisture content of the test specimens was calculated after reaching constant mass for each climate level according to Equation (1) on the basis of the lowest specimen mass in the course of the test.
2.3.6. Image Analysis Based Determination of the Dimensional Changes
Three-thousand-three-hundred-and-ninety-three images were taken from each of the test specimens. Images had a size of 2046 × 2046 pixels. The edge length of the pixels was 18 µm. This results in a resolution of 1411 dpi (dots per inch). The images were binarized using the threshold L = 0/100, a = −50/50, b = −89/0, to subtract the background within the image. The tangential direction of the solid wood specimen as well as the adhesive joints of the LVL sample were aligned horizontally. For the solid wood specimen, the dimensions in radial and tangential direction were measured in the middle, top and bottom of the specimen. For the LVL specimen, dimensions parallel to the adhesive joints were measured in the middle of each veneer of the specimen using 81 pixel rows each (blue lines in Figure 2). The same positions were used in the direction perpendicular to the adhesive joints (red lines in Figure 2). To obtain the final dimension, the arithmetic mean of all lines was calculated in each direction. The analysis was carried out in MATLAB R2017b (MathWorks, Inc., Natick, MA, USA) and the inbuilt image processing toolbox. For further details of the image analysis, see [5].
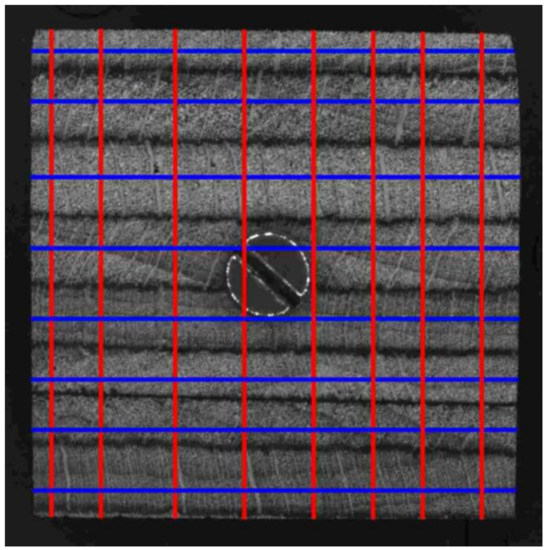
Figure 2.
Exemplified image of the LVL specimen with measurements parallel (blue or horizontal in the picture) and perpendicular (red or vertical in the picture) to the adhesive joints.
3. Results
According to the set rules (IQR method), extreme outliers in moisture content and dimensional change were found for the data of the manual test method: eight for test specimens of cubic dimensions within the Adsorption Sequence, one for test specimens of flat dimensions within the adsorption sequence. More detailed information is to be found in the attached files (Supplementary Information).
Table 1 lists the mean value and the coefficient of variation for moisture content and dimensional change of the flat and cubic test specimens after application of the manual test method for each climatic condition of the Absorption Sequence and the Desorption Sequence. Although no differences were found between the flat and cubic test specimens when simply viewing the data in Table 1; the statistical mean value comparison shows that a large number (6 of 20 Ad. Sq, 8 of 20 De. Sq.) of significant differences were found. This means that the two types of specimens cannot be combined into one data set. Therefore, only the flat test specimens are considered in the following, since a more reliable conditioning can be assumed due to the smaller dimensions, and thus, shorter distances for moisture to enter the test specimen. This assumption is supported by the fact that the initial moisture content (at 20 °C and 65% r. h.) in the Desorption Sequence of the cubic test specimens (9.7%) is (significantly) lower than that of the flat test specimens (10.7%). Irrespective of the results of the statistical investigation, all data points in the plot would have matched well, except for the initial moisture content of the desorption sequence.

Table 1.
Mean value and coefficient of variation (in brackets) for moisture content u and dimensional change dc in the respective directions (rad = radial, tan = tangential, lon = longitudinal) of the flat (above) and cubic (below) test specimens for the equilibrium state under each climatic condition (temperature, relative humidity) of the Absorption Sequence and the Desorption Sequence.
The data of the gravimetric vapor sorption analyzer are displayed in Table 2. Due to the test setup, only single measured values are given here, i.e., without indication of the variance, since only one test specimen per material was finally examined. The results are in good agreement with the study of Nopens et al. [5].
Table 2.
Moisture content u and dimensional change dc in the respective direction (rad = radial, tan = tangential) of the LVL and solid wood test specimen each for the equilibrium state under each relative humidity (r. h.) at a temperature of 20 °C determined by using a gravimetric vapor sorption analyzer.
Figure 3 shows the course of wood moisture development over the relative humidity at constant temperature (20 °C) when passing through the absorption and desorption sequences. In partial figure a, the course of wood moisture development of the flat test specimens in manual test procedure is graphically evaluated by plotting against the relative humidity separately for the Absorption Sequence and the Desorption Sequence. Figure 3b shows the course of the wood moisture development of the LVL and solid wood test specimens in the gravimetric vapor sorption analyzer with at first decreasing, and then increasing, humidity. For both the manual test procedure and the gravimetric vapor sorption analyzer examination, roughly seen the typical sigmoidal form of the isotherms can be recognized and a hysteresis is to be observed between moisture absorption and desorption. In particular, it can be seen from Figure 3a that in the case of the LVL test specimens, these are scanning isotherms, as will be explained later in the discussion. At the beginning of both, the Absorption Sequence and the Desorption Sequence is located at 65% r. h. and thus lies undefined within the absorption or desorption process. This can be seen from the fact that the starting point is below the end point of the Absorption Sequence and above the end point of the Desorption Sequence. The lack of water saturation in the case of the LVL test specimen at gravimetric vapor sorption analyzer test procedure can be seen from the lower wood moisture content compared to the solid wood test specimen measured at the first climate stage (20 °C and 85% r. h.). Apart from this, the course of the wood moisture corresponds largely to that of the solid wood test specimen.
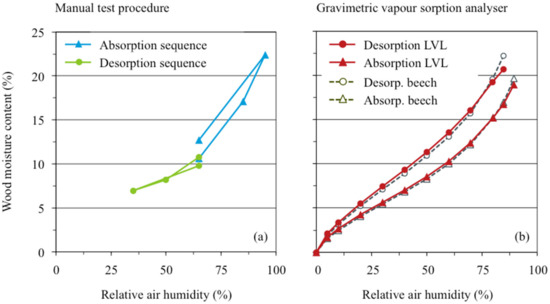
Figure 3.
Plot of the wood moisture content against the relative air humidity at 20 °C (sorption isotherm): (a) flat test specimens of LVL at manual test procedure separately for absorption and desorption sequence, (b) LVL and solid wood test specimen in the gravimetric vapor sorption analyzer with at first decreasing and subsequently increasing humidity.
Figure 4 shows the course of dimensional change development over the relative humidity at constant temperature (20 °C) when passing through the absorption and desorption sequences. In partial figures a and c, the course of dimensional change development is shown for the flat test specimens at manual test procedure by plotting against the relative humidity separately for the Absorption Sequence and the Desorption Sequence. Figure 4a shows the course of development in radial direction, Figure 4c shows the tangential direction. Figure 4b,c show the same topics for the test specimens at gravimetric vapor sortion analyzer test procedure. For both the manual test procedure and the gravimetric vapor sorption analyzer examination, roughly seen the typical sigmoidal form of the isotherms can be recognized and a hysteresis is to be observed between moisture absorption and desorption.
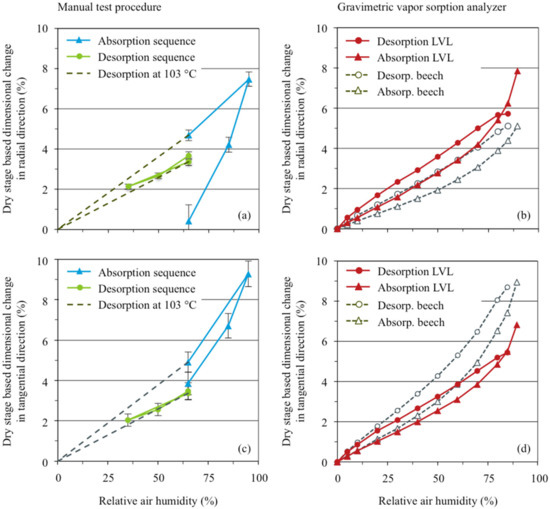
Figure 4.
Plot of dry stage-based dimensional change in radial (top, a,b) or tangential (bottom, c,d) direction against the relative air humidity (swelling isotherm): (a,c) flat test specimens of LVL at manual test procedure separately for absorption and desorption sequence, (b,d) LVL and solid wood test specimen in the gravimetric vapor sorption analyzer with at first decreasing and subsequently increasing humidity.
While the swelling isotherms are similar in principal, the results from dimensional change in radial direction of manual test procedure show in detail a clear difference to all others. The first moisture increase over the state at the end of production (started recording after initial conditioning at 20 °C and 65% r. h.) causes a strong increase of the radial dimension. It is noticeable in this context that the dimension after re-drying in the initial climate (20 °C and 65% r. h.) is considerably higher than the initial dimension, even taking into account the expected hysteresis. On the one hand, this can be seen from the clearly lower starting point (and the following one) of the Absorption Sequence in Figure 4a compared to that of the dimensional change in tangential direction in Figure 4c. In numbers, this can be traced in Table 1 for both, flat and cubic test specimens, comparing the initial value dcrad (0.4% or 1.8%) with the final (4.7%) respectively. In actual dimensions of the flat test pieces, this means a difference of nominal 2.5 mm (50.5 mm [±0%], initial vs. 52.7 mm [±1%], final), while in the tangential direction the initial dimension (20.2 mm [±1%]) barely deviates from the final dimension (20.4 mm [±1%]). In conclusion, this means that during first moisture increase over the state at the end of production, an irreversible dimensional increase occurs in radial direction.
Due to the different test setup of the gravimetric vapor sortion analyzer test procedure, it can be seen in Figure 4b,d that the LVL test specimen behaves similarly to natural solid wood (or LVL in tangential direction, Figure 4c) after the irreversible dimensional increase has taken place also in radial direction. The untypical appearance of the desorption isotherm at the beginning of its course (crossing with the absorption isotherm) is due to incomplete water saturation before the start of the experiment.
Figure 4b,d also shows that the swelling anisotropy typical of solid wood is almost non-existent for LVL. Although the swelling of LVL in the radial direction is slightly above that of solid wood, the swelling in tangential direction is considerably below that of solid wood. Both, the swelling of LVL in radial direction and that in tangential direction are approximately equal. This means that the material has been improved compared to solid wood.
Figure 5 shows the course of dimensional change development over the wood moisture content when passing through the absorption and desorption sequences. In partial figures a and c, the course of dimensional change development is shown for the flat test specimens in manual test procedure by plotting against the wood moisture content separately for the Absorption Sequence and the Desorption Sequence. Figure 5a shows the course of development in radial direction, Figure 5c shows the course of development in tangential direction. Figure 5b,c shows the same topics for the test specimens at gravimetric vapor sortion analyzer test procedure (LVL and solid wood both).
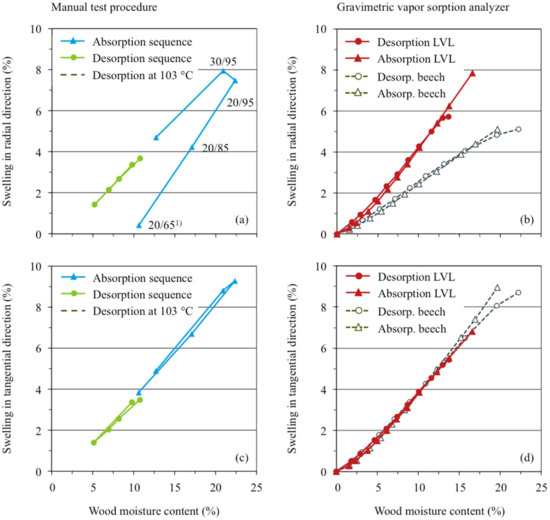
Figure 5.
Dimensional change in relation to moisture content, left (a,c): manual test procedure (LVL), right (b,d): gravimetric sorption analyzer (LVL and solid wood), top (a,b): radial direction, bottom (c,d): tangential direction.
Except for the Absorption Sequence in Figure 5a, absorption and desorption is linear (lines are close together), independent of method (manual test procedure, gravimetric vapor sorption analyzer) and material (LVL, solid wood). The different behavior of the LVL in the absorption sequence clearly reflects the irreversible swelling during first moisture increase over the state of that at the end of production as described above. Furthermore, Figure 5 clearly shows that, regardless of the direction, LVL remains the same as solid wood in the radial direction.
Table 3 lists the initial data and the results of the calculation of differential swelling determined by the manual test procedure according to the approach proposed in DIN 52184. In radial direction, the differential swelling accounts for 0.41%/%, in tangential direction for a range of 0.38 to 0.47%/% (mean 0.44%/%) and in longitudinal direction for 0.01%/%. In the course of calculating the differential swelling in the form of the slope of the regression line, the following values were obtained: 0.42%/% (radial), 0.47%/% (tangential), and 0.01%/% (longitudinal). The corresponding measures of determination were 1.00 (radial and tangential) and 0.95 (longitudinal).
Table 3.
Differential swelling and the initial data for its calculation with flat test specimens (50 × 50 × 20 mm3) as data source.
Table 4 lists the results of the calculation of differential swelling at the first moisture increase over the state at the end of production according to the approach proposed in DIN 52184. In radial direction, the differential swelling accounts to a value range of 0.59 to 0.60%/% (mean 0.59%/%).
Table 4.
Differential swelling at the first moisture increase over the state at the end of production and the initial data for its calculation with flat test specimens (50 × 50 × 20 mm3) as data source.
4. Discussion
When plotting the test specimen wood moisture content or dimensional change against the relative air humidity at constant temperature, a sorption or swelling isotherm is obtained. However, since only the solid wood test specimen had been immersed in distilled water before the experiment was started (fully saturated with water), so that a real isotherm was obtained, the other graphs were scanning isotherms according to Fredriksson and Thybring [7]. This can be seen prominently by crossing desorption and absorption isotherms in Figure 5b,d for LVL samples. The beginning of the experiment was made within the hysteresis, and the real course of the isotherm is only described in the course of the re-moistening after passing through the dry stage. The begin of the isotherms within the hysteresis becomes obvious in Figure 3a where both the Adsorption Sequence and the Desorption Sequence start for 65% relative air humidity, and thus, the starting point is located between re-desorption and re-adsorption scanning isotherms. Apart from the described limitations due to the use of test specimens without prior water storage, the sorption isotherms follow in principal the typical sigmoidal shape with hysteresis between sorption and desorption. With the gravimetric sorption analyzer, only one sample was measured for beech and LVL respectively. The general deviation of the measuring principle is low [5]. Values for beech are in close agreement with the first presented data [5]. However, every natural material, as well as compound materials like LVL exhibit deviations within the structure. Therefore the presented values are a strong indication for the general swelling and shrinking behavior related to relative humidity and moisture content. Especially as they agree well with the manual test procedure. However, further investigations with more samples cut at different positions within the raw material (beech and Baubuche) could improve and strengthen the significance of the presented research in the future.
The sorption isotherm of the solid wood test specimen examined in the gravimetric vapor sorption analyzer follows that reported in literature [8] and found within previous investigations [5]. Although the desorption of the LVL test specimen in the gravimetric vapor sorption analyzer was started in an unsaturated state, both the desorption and adsorption curves correspond to those of solid beech wood. Results of the manual test procedure are within the hysteresis region of the gravimetric vapor sorption analyzer data. Therefore, both methods support each other in the presented results and prove the results for both materials in general.
The swelling isotherms of the solid wood test specimen examined in the gravimetric vapor sorption analyzer follow that reported in literature [8] and found within previous investigations [5]. In general, the swelling isotherms from manual test procedure are similar to that of gravimetric vapor sorption analyzer examination, though in detail they show differences. The reason for this is presumably the different pre-states of climate between both methods. At manual test procedure, the test specimens were investigated within an absorption and desorption sequence, both started at 65% relative humidity and dried or remoistened respectively after running through the sequence. In contrast, in the case of the gravimetric vapor sorption analyzer examination, the tests were started at 85% relative air humidity and water saturated samples were used in the case of solid wood samples. Absorption was performed after reaching zero percent relative humidity. A direct comparison of the results of both methods is therefore not possible. Comparing the swelling isotherms of LVL and solid wood determined using the gravimetric vapor sorption analyzer, it is noticeable that the radial swelling of LVL exceeds that of solid wood. For the tangential direction, the behavior is reversed. A material-related peculiarity for the examined LVL can be observed when considering the swelling isotherm in radial direction for the manual test procedure. The swelling state at the beginning of the absorption sequence is significantly below that which can be expected on the basis of the data of the desorption sequence. The reason for this could be a densification of the wood substance in the radial material direction during the manufacturing process. During the production of the material, the veneer layers are coated with phenolic adhesive, which is then cured under pressure in a hot press. The wood compaction that takes place during this process is released in the course of subsequent swelling and can be observed as a spring back effect, i.e., irreversible swelling. While calculation methods lead to nominally low swelling in the radial direction at the beginning of the absorption sequence, it becomes clear that an unusually strong swelling of the material occurs here due to the irreversible spring back of the material (nominally approx. 2 mm per 50 mm, i.e., 4%) and the method of swelling calculation (dividing the measured data by the respective dimension after final oven drying). This could be illustrated if the curve of the absorption sequence were shifted in parallel in such a way that the starting point of the absorption sequence coincides with the end point of the desorption sequence. This approach makes clear why unusually high swelling of the material is observed during the absorption sequence. After release of the production-related compaction stored in the material, a normal swelling and shrinkage behavior of the material can be assumed. Furthermore, the swelling in the radial direction after release of the production-related compression equals the swelling in the tangential direction. Regardless of spring back, LVL shows a lower swelling anisotropy than solid wood. The radial and tangential swelling of LVL are in a similar range and are more similar to the radial swelling of solid wood.
From the results of the present study, the following recommendations can be made for the practical application of LVL in the construction sector. If BauBuche is installed in the factory condition (moisture content of 6% ± 2%), strong radial swelling must be expected during initial moisture absorption due to the spring back effect. In order to avoid this strong initial swelling in the installed state, it would be advisable to carry out initial moistening and subsequent conditioning during the production process. Ideally, after primary swelling, the LVL should be conditioned to the equilibrium moisture content expected in the area of application. In this state, LVL shows a lower swelling anisotropy than solid wood and is therefore more suitable for use in the construction sector. However, initial moistening and subsequent conditioning in the LVL production process would be very time-consuming and require large storage capacities. Consequently, it might be more realistic to take into account the strong initial radial swelling in component planning and dimensioning in order to avoid damage to building structures.
5. Conclusions
In the present study, the behavior of BauBuche in terms of humidity absorption and desorption was investigated applying a manual test procedure (climate chamber, balance and calliper) as well as a gravimetric vapor sorption analyzer. Due to the assumed high densification within the production process, the initial swelling of BauBuche in the radial direction exceeds that of solid wood. If the maximum spring back (irreversible swelling) within the initial swelling is reached, the sorption and swelling behavior of BauBuche in radial and tangential direction is comparable to that of solid wood in radial direction. Therefore, to avoid damage to building structures when using BauBuche in factory condition, the spring back and high initial swelling values have to be included in calculations of building parts. Another option would be to include initial moistening and subsequent conditioning in the production process of BauBuche. If conditioning is adapted to the equilibrium moisture content expected in the application area, significantly smaller dimensional changes would be expected. In this condition, the swelling anisotropy of BauBuche would also be lower than that of solid wood. Both applied methods support each other in the presented results and prove the results for both materials in general. In detail, the direct comparison of the applied methods proves to be difficult because the climatic starting point and the sample size of the methods was different. To enable a direct comparison of both methods within further investigations, it would be interesting to choose in both cases the same sample size, climatic starting point and ad- respectively desorption sequences. Furthermore, it would be interesting to investigate the sorption dynamics using differently scaled Baubuche test specimens.
Supplementary Materials
The following are available online at https://www.mdpi.com/2079-6439/8/7/47/s1, Figure S1: title, Table S1: title, Video S1: title.
Author Contributions
Conceptualization, J.T.B. (manual test procedure, combination of the test results) and M.N. (gravimetric vapor sorption analyzer); investigation, formal analysis, methodology, visualization, J.T.B., M.R. and M.N.; software, M.R.; writing, all authors (J.T.B., M.R., N.E., M.N.); project administration, J.T.B. and M.N. All authors have read and agreed to the published version of the manuscript.
Funding
This research received no external funding.
Acknowledgments
The authors would like to thank all those persons who were engaged the experiment realization, namely Dörte Bielenberg (conducting the manual test procedure), Dina Führmann (English editing), Bettina Steffen (statistical data analysis), and Stefanie Warsow (test specimen cutting) (all Thünen Institute of Wood Research).
Conflicts of Interest
The authors declare no conflict of interest.
References
- United Nations (UN). Framework Convention on Climate Change (FCCC). In Conference of the Parties (COP) 21; Report of the Conference of the Parties on Its Twenty-First Session, Held in Paris from 30 November to 13 December 2015; Addendum 1; UN: New York, NY, USA, January 2016. [Google Scholar]
- Federal Ministry of Food, Agriculture and Consumer Protection (BMELV). Forest Strategy 2020; BMELV: Berlin, Germany, 2011.
- Kollmann, F. Technology of Wood and Wood-Based Materials—Volume 2: Wood Preservation, Surface Treatment, Drying and Steaming, Finishing, Wood-Based Materials, Machining and Non-Cutting Wood Processing, Wood Joints; Springer: Berlin, Germany, 1951; pp. 427–604. ISBN 978-3-642-52948-1. [Google Scholar]
- Benthien, J.T.; Ohlmeyer, M. Effects of flat-shaped face layer particles and core layer particles of intentionally greater thickness on the properties of wood-reduced particleboard. MDPI Fibers 2020, 8, 46. [Google Scholar] [CrossRef]
- Nopens, M.; Riegler, M.; Hansmann, C.; Krause, A. Simultaneous change of wood mass and dimension caused by moisture dynamics. Sci. Rep. 2019, 9, 10309. [Google Scholar] [CrossRef] [PubMed]
- Glass, S.V.; Boardman, C.R.; Thybring, E.E.; Zelinka, S.L. Quantifying and reducing errors in equilibrium moisture content measurements with dynamic vapor sorption (DVS) experiments. Wood Sci. Technol. 2018, 52, 909–927. [Google Scholar] [CrossRef]
- Fredriksson, M.; Thybring, E.E. Scanning or desorption isotherms? Characterising sorption hysteresis of wood. Cellulose 2018, 25, 4477–4485. [Google Scholar] [CrossRef]
- Weichert, L. Investigations on sorption and swelling of spruce, beech and compressed beech wood at temperatures between 20 °C and 100 °C. Holz als Roh und Werkstoff 1963, 21, 290–300. [Google Scholar] [CrossRef]


© 2020 by the authors. Licensee MDPI, Basel, Switzerland. This article is an open access article distributed under the terms and conditions of the Creative Commons Attribution (CC BY) license (http://creativecommons.org/licenses/by/4.0/).