Abstract
The present work is focused on improving mode I and mode II delamination resistance of glass/epoxy composite laminates (50 wt.% of glass fibers) with milled glass fibers, added in various amounts (2.5, 5, 7.5 and 10% of the epoxy weight). Including fillers in the interlayer enhances the delamination resistance by providing a bridging effect, therefore demanding additional energy to initiate the crack in the interlaminar domain, which results in turn in enhanced fracture toughness. The maximal increase of mode I and mode II fracture toughness and of flexural strength was obtained by the addition of 5% milled glass fiber. The mechanism observed suggests that crack propagation is stabilized even leading to its arrest/deflection, as a considerable amount of milled glass fiber filler was oriented transverse to the crack path. In contrast, at higher filler loading, tendency towards stress concentration grows due to local agglomeration and improper dispersion of excess fillers in inter/intralaminar resin channel, causing poor adhesion to the matrix, which leads to reduction in fracture toughness, strength and strain to failure. Fractured surfaces analyzed using scanning electron microscopy (SEM) revealed a number of mechanisms, such as crack deflection, individual debonding and filler/matrix interlocking, all contributing in various ways to improve fracture toughness.
1. Introduction
Fiber reinforced plastic (FRP) composites are extensively used in aerospace, automobile, marine, civil construction and wind turbine industries, where they are competitive for some properties, such as in-plane strength-to-weight ratio and fatigue resistance, with conventional metals. However, mechanical properties in FRP are controlled by their fiber direction [1]. As a consequence, composite laminates are usually weak when subjected to out-of-plane loading, due to the lack of fiber reinforcement in the through-thickness direction [2]. Hence, interlaminar failure, usually referred to as delamination, occurs as key failure mechanism within the interplay–resin domain, which is activated by out-of-plane stresses [3,4]. Several techniques, such as through-thickness stitching (TTS), Z-pinning, 3D weaving, were employed to enhance the strength of the interlaminar region. However, these techniques may on the other side cause a reduction in in-plane mechanical properties, fiber volume loss, and also cause increased production cost [5,6,7].
An alternative approach to improve the out-of-plane properties of FRP composites is to modify the resin interlayer domain [8]. The fracture toughness of epoxy resin employed in FRP composites can be enhanced by adding microsized fillers [9,10,11,12]. Similarly, the use of carbon nanofibers (CNFs) and carbon nanotubes (CNTs) has attracted a considerable attention as a possible strategy for improving the interlaminar fracture toughness of FRP composites, because of their high stiffness, strength, specific surface area and aspect ratio [13,14,15,16,17]. The presence of CNTs promotes percolation at low volume fraction, enhances the contact area and adhesion with the epoxy, introducing energy dissipation mechanisms, such as fiber debonding, pullout, crack bifurcation, crack arresting and/or nanocrack toughening [12]. However, in practice, the modulus and fracture toughness of FRP composites is not always increased by adding these nanofillers, since it is difficult to control their uniform dispersion in FRP composites [18,19,20,21]. For this reason, the controlled introduction of defects in the interface has been proposed, together with methods, such as ion implantation, able to modify the characteristics of the filler [22]. However, it is an expensive and challenging process to implement the introduction of these nanofillers in FRP composites for large-scale structural applications.
On the other side, the waste materials generated by the FRP industries usually end up in landfill due to the difficulties in recycling thermosetting polymer matrices [23]. In the particular case of fiberglass, as reported by Pickering et al. [24], mechanical recycling of glass fibers offers significant environmental and economic advantages and the recovered fibrous/powdered products can be reincorporated either as reinforcement or filler in new composite materials. This represents an opportunity, provided that the structural modifications involved for practical use of these fillers do not entail excessive costs, an aspect very critical for the recycle of fiberglass, as it is discussed in [25]. If this is the case, therefore they are employed as close as possible to the as-received state after grinding, recycled milled glass fibers can be employed to reinforce the polymeric materials, as an alternative to commercial particles/fillers, therefore enhancing their mechanical properties.
This paper focuses on improvement of mode I and mode II delamination resistance by employing milled glass fiber fillers as filler particles in glass/epoxy composite laminates, discussing the effect of interface modification by appropriate microscopic observation and linking it to the flexural behavior of laminates. This is a challenging task, especially when it comes to determining empirically toughness, since it requires an accurate control over the experimental dimensions and the measurements, which brought also to innovative ways to measure toughness on nanocomposites [26]. This has been reached after fine-tuning the experiment over a number of previous investigations. In this work, Mode I (DCB) and Mode II (ENF) tests have been performed to evaluate the fracture toughness of glass/epoxy composites. The specific objective of this work lies in the idea of giving insight on the possibility to improve these properties of glass/epoxy composites by using definite amounts of the filler, suggesting that the potential of this introduction is strictly linked with the fracture mechanism, as it is demonstrated also by scanning electron microscope (SEM) micrographs.
2. Materials and Methods
2.1. Material and Fabrication
The glass fiber reinforced plastic (GFRP) composite laminates of dimension 300 × 300 mm2 were fabricated with a stacking sequence of [0°]16 by hand lay-up technique. The glass fibers UD 200 with mass density of 220 g/m2 and Araldite LY556 epoxy resin with Aradur HY951 hardener were used for fabrication. The cured epoxy had a final density equal to approximately 1.25. A non-adhesive insert (Teflon) with 13 (±0.5) microns thickness was introduced as a pre-crack in the mid-plane of the laminate. The mass proportion of glass fiber and epoxy was taken as 50:50. The curing process was initiated by adding the hardener to the epoxy in a ratio of 1:10 by weight, and then accurately stirring the mixture for at least 5 min. The epoxy resin was allowed to impregnate the fibers with the aid of rollers. Further, to maintain a uniform thickness a spacer plate of ±4.5 mm was placed between the flat molds. For some testing (end notch flexure) also neat epoxy samples of the same dimensions have been fabricated.
Other than the control GFRP laminate with no milled glass fiber filler, the other laminates were fabricated with different mass proportions (2.5, 5, 7.5 and 10 wt. %, taking 100 as the epoxy weight) of filler, which consisted of end-of-life milled glass fibers from disposal, very likely to have preserved also traces of their sizing agent (silane), so that the bulk density of the milled glass fibers was measured as being around 2.4. In Table 1, the percentages in weight and volume are presented for comparison. Milled glass fibers had an average length and diameter of 150 micron and 10 microns, respectively. These milled fibers were employed as fillers in the interfacial resin domain between the four layers at the mid-plane to evaluate the mode I and mode II interlaminar fracture toughness. In the case of laminates containing milled glass fiber filler, the epoxy resin mixture added with fillers was mechanically stirred and sonicated until the latter were uniformly dispersed; following this, the hardener was added during fabrication to ease proper mixing and distribution [27,28,29]. The resin-filler mixtures were degassed before being used for fabrication. All the laminates were cured at room temperature for 24 h.

Table 1.
Weight (wt.) and volume (vol.) % of milled glass fibers, taking epoxy resin as equal to 100.
2.2. Experimental
2.2.1. End Notch Flexural Test
End Notch Flexure (ENF) specimens with dimension of 140 × 25 mm were removed using water-jet cutting. ENF specimens were loaded in three-point flexure under displacement control regime, as illustrated in Figure 1a, with the indication of the displacement being taken directly from the universal testing machine (UTM). Care was taken to ensure that the pre-crack (Teflon) insert was present at the edge of the specimen, so that it would act as an external crack, as indicated in Figure 1b. The initial crack length (a) in the sample was approximately 25 mm, which is marked at the sides. The pre-crack was located midway between one support and the loading point. The specimen was tested with a span length of 100 mm. The tests were conducted in 100 kN Tinius Olsen UTM at a cross-head speed of 1 mm/min. Six repetitions of test were performed for each category of samples.
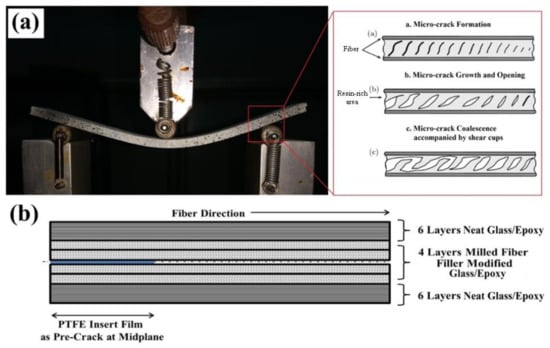
Figure 1.
(a) End notch flexure (ENF) sample in three-point bending fixture. (b) Schematic illustration of glass/epoxy sample layup.
The single-edge notched bending (SENB) tests were performed to determine the mode I fracture toughness or critical strain energy release (GIC) of the polymer composites. The strain energy release rate (GIC) value is measured by evaluating the area under the load–displacement curve obtained during SENB test. The area under the curve is calculated by using trapezoidal rule i.e., numerical integration method in MATLAB software. The (GIC) value is determined by the estimated fracture energy divided by the area of the fractured surface created.
The load–displacement curve was obtained for calculation of mode II critical strain energy release rate GIIC [30,31], where GIIC can be expressed as (1):
where P is the critical load at which the crack propagates, B is the width of the specimen, L is the span length, δ is the displacement and a is the initial crack length.
2.2.2. Mode I Testing Procedure
Mode I interlaminar fracture toughness tests were carried out on Double Cantilever Beam (DCB) samples of glass/epoxy laminates using a 100 kN Tinius Olsen universal testing machine (UTM). The dimensions of DCB samples are 200 mm in length and 25 mm in width: the initial crack length created (ao) is 50 mm. The samples were cut with diamond saw with edges finely polished so to locate the Teflon tape termination. The piano hinges were bonded to the surface of DCB samples using a commercial epoxy resin with a curing process completed in 24 h. The Mode I testing was performed under displacement controlled regime at a crosshead speed of 1 mm/min, thereby assisting steady crack propagation and data recording. The load (P), displacement (δ) and the delamination length (a) were simultaneously recorded in order to evaluate the Mode I fracture toughness of the composite laminates. The delamination crack length (a) was monitored using DSLR Canon D1300 and Celestron digital microscope. The mode I (DCB) samples have the same schematic layup configuration, which is represented in Figure 1b. The experimental test set-up for DCB testing is depicted in Figure 2. Mode I fracture toughness was evaluated based on the American Society for Testing and Materials (ASTM) D5528-94a [32], using the following expression (2):
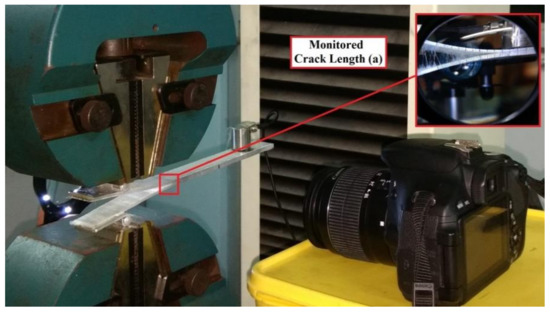
Figure 2.
Experimental test set-up for Double Cantilever Beam (DCB) testing.
In (2), the correction factor Δ accounts for crack tip rotation, to be empirically determined using a least square plot of cubic root of compliance (C1/3) versus delamination length (a). The compliance (C = δ/P) can be evaluated from the recorded load–displacement plot. The need for adding a correction factor may arise in case that the accuracy of the experimental measurement of the crack length proves limited [33].
2.2.3. Three-Point Flexural Testing
The glass/epoxy samples with different filler loading were tested in three-point bending fixture under displacement control regime. The tests were performed at a cross-head speed of 1 mm/min in a 100 kN Tinius Olsen universal testing machine. The specimens were cut in dimension of 150 × 25 × 4.5 mm, according to ASTM D790-17. The span length of flexural test was kept equal to 100 mm. Four repetitions were performed for each category of samples to determine the flexural properties. The flexural strength σf was calculated from Equation (3):
where P is the maximum load, l the span length, w the width and t the thickness of the sample.
2.2.4. Fourier Transform Infrared Spectroscopy (FTIR)
Fourier Transform Infrared spectroscopy (FTIR) was used to examine the interface condition between the milled glass fiber filler and the epoxy resin. FTIR spectra of the samples were therefore taken in Bruker RFS 27 FTIR spectrometer from Sophisticated Analytical Instrument Facility at IIT Madras. The mid-infrared region in the interval between 4000 and 400 cm−1 was investigated, because the absorption radiation of most organic compounds and inorganic ions are within this region.
2.2.5. Scanning Electron Microscopy (SEM) Morphological Study
The morphological study of fracture surfaces was carried out using a Carl Zeiss MA15/EVO 18 Scanning Electron Microscope (SEM). The samples were gold sputtered prior to observation.
3. Results and Discussion
3.1. Epoxy Resin With and Without Milled Glass Fibers
3.1.1. FTIR Characterization
Infrared spectroscopy is a technique to determine the structure of molecules based on the characteristic absorption of infrared radiation. The different functional groups and structural features in the molecule absorb radiation at characteristic frequencies. The spectrum at different wave numbers indicates the different type of bonds and the width of each peak signifies the intensity of interaction. In particular, the wave numbers of common bonds and their interpretation methodologies were reported by Coates [34]. In the specific case of this study, FTIR has been used with the purpose to evaluate the interaction of epoxy resin with milled glass filler. Due to the results obtained above, it was considered more crucial to evaluate the situation as far as 5 wt.% filler introduction is concerned. Figure 3 shows the FTIR spectra of the epoxy with and without milled glass fiber filler.
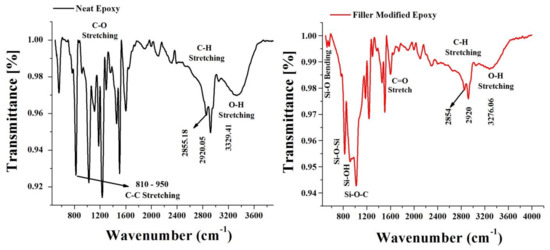
Figure 3.
FTIR Spectrum of neat epoxy and 5 wt. % filler modified samples.
The neat epoxy sample shows the absorption peaks at 2855 cm−1 and 2920 cm−1 corresponding to C–H stretching in epoxy. The symmetrical stretching (or) ring breathing frequency was also observed between 1000–1300 cm−1, which corresponds to the C–O stretches indicating the characteristic of the epoxy ring. The peaks observed between 810 cm−1–950 cm−1 indicate the asymmetric ring stretching in which C–C stretches during contraction of the C–O bond. The bands at 1358 cm−1 and 1456 cm−1 are characteristics of (–CH3) & (–CH2) symmetric stretching. Also, the absorption band with a broad peak at 3329.41 cm−1 corresponds to (–OH) stretching which indicates the hydrogen bonding [35].
The spectrum of the filler modified epoxy sample shows that the silica in the filler, especially due to silane coating, reacts with epoxy, reaction represented by the intense broad peak at 1000–1100 cm−1 which attribute to asymmetric stretching of Si–O–Si, Si–OH and Si–O–C bonds [36,37,38]. However, the neat epoxy samples showed narrow and less intense corresponding absorption peaks. The absorption band in the range between 1750 and 1625 cm−1 corresponds to aldehyde C=O stretch, which was absent in neat epoxy samples. Also, the intensity of the peak between (917 to 914 cm−1) was observed to be wide/broad (greater) in the filler modified epoxy sample which is attributed to effective bonding strength of intermolecular interactions between filler/epoxy. Consequently, the absorption peaks around 1130–1360 cm−1 and 1590–1650 cm−1 correspond to C–N and N-H bonds, which are related to the cross-links in the epoxy group. Also, the peak at 2920 cm−1 is the C–H stretching while the broad spectrum at 3276 cm−1 is the characteristic O–H stretching for hydroxyl group, which becomes broader and less intense.
From the spectra, the peaks are reduced by the same amount in intensity, which signifies the reduction in cross-links/bonding interactions of the epoxy content in the samples. Also, repetition of the same functional groups leads to a larger and intense peak. The filler modified epoxy showed absorption shifts in the frequency of C–H bonds compared to neat epoxy samples. This denotes the change in the interaction of C–H chain present in the polymer. However, no severe changes were observed in the intermolecular interactions due to the presence of filler in the epoxy matrix, which suggests no change in the sample composition as far as the chemical bonds are concerned. Therefore, the FTIR spectra showed that the presence of silane-treated fillers in the epoxy matrix has constrained the polymer chain mobility (restricting the motion), resulting in less intense absorption bands compared to the neat epoxy samples. Conversely, the milled glass fiber fillers facilitate good chemical bonding at the filler/matrix interfacial region. Therefore, such bonding attributes to the effective load transfer between matrix and filler, and improvement in mechanical properties.
3.1.2. GIC Fracture Toughness
The study of GIC fracture toughness, as indicated in Figure 4, was initially performed on pure epoxy, to see which effect the addition of milled fibers has on it. Toughness was found to increase steadily with higher amount of filler up to 5 wt. %, whereas, when filler content exceeds this amount, some decrease is reported, though toughness is still maintained at a level considerably higher than the epoxy matrix with no filler. This decrease above 5 wt. % was tentatively attributed to more limited inter-particle spacing and interference of milled glass particles with matrix cross-links, resulting in stress concentration spots, with premature crack initiation and/or easier crack propagation. It is expected therefore that the use of optimal filler content would allow higher strain energy absorption through toughening mechanisms, particularly crack pinning mechanisms and in the long run, filler debonding/pullout offering some contribution towards increasing fracture toughness [39].
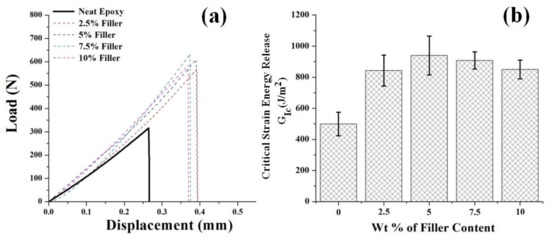
Figure 4.
(a) Load–displacement curve from single-edge notched bending (SENB) tests on pure epoxy filled with milled fibers; (b) Critical strain energy release (GIC) for pure epoxy loaded with different amounts of filler.
To try to clarify the effect of milled fibers filler on toughness of neat epoxy, SEM image of neat epoxy in Figure 5 is compared with the ones with the optimal amount of filler, which is, as suggested above, 5 wt. %, depicted in Figure 6a,b. The pure matrix exhibits higher resistance to plastic deformation and low fracture toughness due to highly cross-linked molecular network resulting though in the brittleness of the matrix: in practice, the resistance to fracture is offered by cohesive strength. Moreover, in an epoxy matrix the limitation to plastic deformation and local stress concentration may initiate crack, causing spontaneous failure, especially if the dimensions of the fibrous reinforcement is considerable, such as it is in the present case [40]. The single edge notch bending (SENB) test introduces slow crack propagation ahead of the crack tip with inelastic deformation, while fast crack growth may occur away from the crack tip. There is no significant difference in slow and fast propagation region in neat epoxy, so that their fracture characteristics are a relatively smooth surface with oriented fracture lines at the crack growth sites. In practice, Figure 4 indicates that the fractured samples exhibit featureless smooth/glossy surface with occasional river/scarp lines possibly attributed to low fracture toughness.
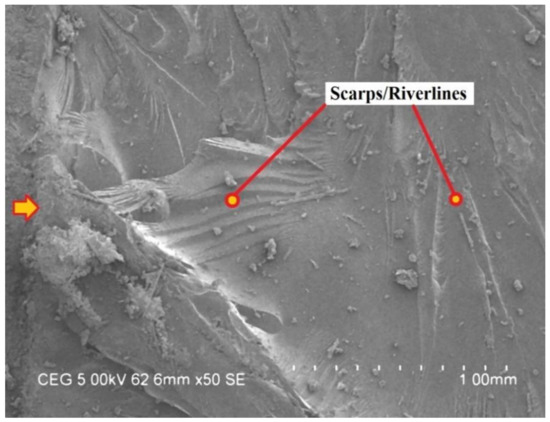
Figure 5.
Scanning electron microscope (SEM) image of the fractured surface of neat epoxy samples.
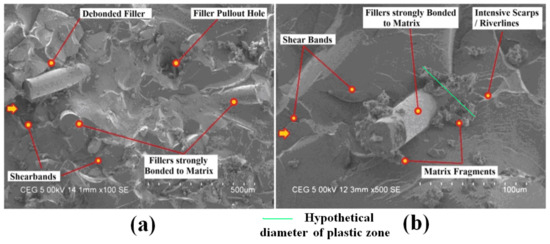
Figure 6.
SEM images of fracture surface under SENB tests of 5 wt.% filler-loaded samples: (a) Details of cohesive failure (b) Appearance of shear bands and relevant features.
In contrast, SEM micrographs in Figure 6 reveal that crack propagation was hampered by the rigid milled glass fiber fillers present on the crack path direction. Incorporation of fillers into the epoxy matrix has appreciably improved the modulus/rigidity of the polymer composite, an effect that can be attributed to the constrained/limited polymer chain mobility. Filler appears uniformly dispersed in the epoxy matrix, being therefore able to effectively deflect the crack. This is demonstrated by the fact that the fracture surface of filler-loaded epoxy appears unevenly rough and coarse with a distorted and perturbed/tortuous crack path. As the consequence, the crack deflection mechanism changes the stress state from mode I to mixed mode, diverting the crack out of the initial propagation plane either by tilting/twisting, thus consuming a higher amount of energy [41]. Moreover, the presence of filler bridges the crack front and the strong interfacial interaction between filler and matrix requires additional energy to propagate the crack further, causing the filler to break through, therefore possibly increasing the material toughness [28,42]. The ensuing cohesive failure with matrix fragments attached to the filler particles indicates strong adhesion at the filler/matrix interfaces, as suggested in Figure 6a, which indicates the possibility of additional energy dissipation before fracture through toughening mechanism, such as filler debonding/pullout. Also, fractured surfaces of the filler-loaded samples shows dilation/shear bands formation and intensive scarps/river lines (Figure 6b), directly related to the plastic zones attributing to matrix shear yielding followed by a debonding process. Although precise measurement of plastic zone was not always possible, preliminary indications can be supplied by the extent of the heavily deformed matrix connected to intensive scarps/river lines, which resulted in matrix fragmentation. It is obviously possible that fragments are dispersed on a wider area than the one correlated to fracture, but as a cautionary indication, their disposition does represent the maximum diameter of plastic zone: in the case of Figure 6b, this is around 45 microns. More accurate measurements, along the lines of what suggested in [43], and correlating energy release rate with it, will be performed in further studies.
3.1.3. Mode II Fracture Toughness
Mode II interlaminar fracture resistance curves for pure glass/epoxy and modified glass/epoxy composite laminates with different loadings of milled glass fiber fillers, expressed by weight percent of epoxy, are summarized in Figure 7, where the highest result for each type of laminates is plotted, whereas relevant standard deviations are reported in Figure 8. The incorporation of filler offered generally better results, significantly improving the mode II fracture toughness by sustaining higher crack initiation load, than it was the case with baseline glass/epoxy samples. The failure in the end notch flexural (ENF) tests occurs by interlaminar shear in the mid-plane of the laminate, due to the presence of the Teflon pre-crack, so that crack propagates parallel to the fiber direction.
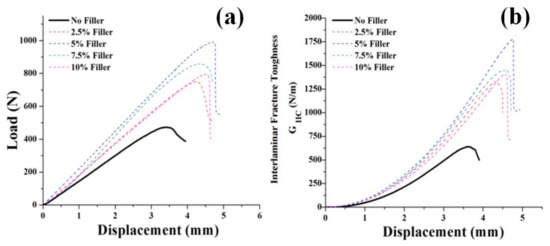
Figure 7.
Fracture resistance curves for end notch flexure (ENF) test (a) Load vs. displacement curve and (b) Mode II interlaminar fracture toughness (GIIC) plot.
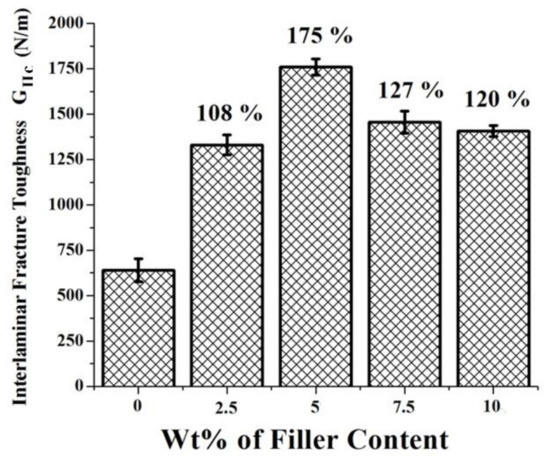
Figure 8.
Influence of filler wt. % on Mode II fracture toughness (improvement on neat epoxy).
Whenever the amount of milled glass fiber fillers introduced is not excessive, the fracture toughness is considerably improved by effective crack pinning, bridging, and crack deviation mechanism [28]. In practice, the failure initiates within the matrix resin as microcrack and propagated towards the interface. Thus, the matrix possessing relatively high fracture toughness can withstand nucleation of microcracks, not allowing their progression. The subsequent stronger adhesion between fiber and matrix results in high interlaminar fracture toughness during mode II testing by resisting the nucleation of microcracks by additional energy dissipation mechanisms, such as debonding, crack hindrance or deflection and filler/matrix interlocking. In other words, crack propagation between the interlayer domains is interrupted by the presence of milled glass fiber fillers, assisting in generation of plastic zone near the crack tip, which in turn results in an improvement in fracture toughness [44].
3.2. Glass/Epoxy Laminates with and without Milled Glass Fibers
3.2.1. Mode I Double Cantilever Beam (DCB) Tests
Figure 9a shows the typical load–displacement curve exhibited during Mode I testing on DCB samples. It was observed that incorporation of milled glass fiber fillers at different wt.% showed an increase in peak load compared to the samples without filler. Correspondingly, the presence of fillers in the interlaminar resin rich domain requires an additional load to drive the crack along the mid-plane. Initially, the load–displacement behavior of Mode I loading was linear until the point of crack initiation. Later, nonlinearity occurred due to the stick-slip cracks growth mechanism, which was predominant in the samples without filler. In contrast, steady crack growth mechanism was observed in the filler-loaded samples. The damage process of the delamination event can be assessed through the critical strain energy release rate (GIC). GIC was determined based on the modified beam theory which is frequently used as per ASTM D5528-94a, as in [7,9,32]. Figure 9b shows the R-curve behavior of baseline (no filler) and filler-added composite samples. The Mode I interlaminar fracture toughness as a function of crack growth is termed as R-curve (Resistance curve). Typically, the GIC Initiation fracture toughness was measured from the point where the crack was observed to develop/propagate from the pre-crack & GIC propagation fracture toughness was measured from the plateau region of the R-curve associated to the steady-state crack growth. It was observed that Mode I critical strain energy release rate increases with the extending crack.
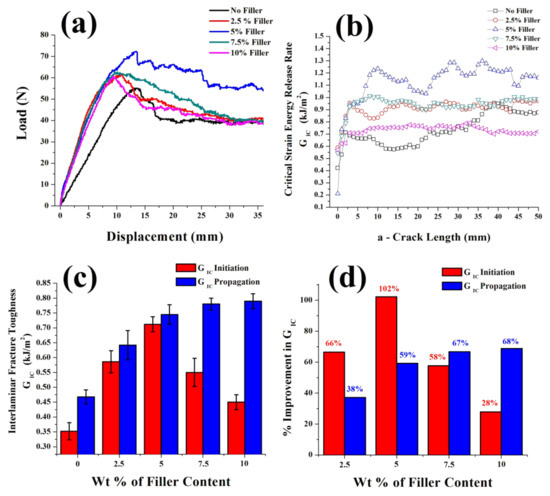
Figure 9.
Experimental results for Mode I test of glass/epoxy composite Double Cantilever Beam (DCB) samples: (a) load–displacement response (b) R- curve (c) GIC Initiation & GIC Propagation fracture toughness (d) % Improvement in GIC.
From Figure 9c, the interlaminar fracture toughness was found to increase consistently with increasing filler content. The presence of filler in the interlaminar resin rich zone ahead of the crack tip requires additional energy to initiate and propagate the crack farther. Thus reduces the stress intensity at the crack tip, which results in an enhanced fracture toughness. The GIC initiation fracture toughness was observed to decrease with increasing filler content beyond 5 wt.%. This phenomenon was attributed to the settling of milled glass fiber fillers at the crack tip region resulting in premature failure due to stress concentration [28]. However, the presence of excess fillers in the interlaminar domain causes additional energy dissipation through filler debonding/pullout resulting in greater GIC Propagation fracture toughness. As additional information, Figure 9d shows the percentage improvement in GIC initiation and GIC propagation fracture toughness, which are both enhanced significantly due to the presence of fillers.
Usually, any deviation from the linear response of the curve indicates the critical load and displacement, which shows the delamination crack propagation from the tip of the Teflon film. Also, the onset of fracture was smoother and undulated near the resin-rich zone ahead of the crack tip. However, the crack propagation occurs through the interface by a sudden drop in load. Subsequently, fiber bridging was observed away from the crack tip which occurs through fiber debonding and pull-out from the adjacent plies, as shown in Figure 10. This fiber bridging causes an increase in fracture toughness since pullout fibers from the matrix will arrest the crack propagation.
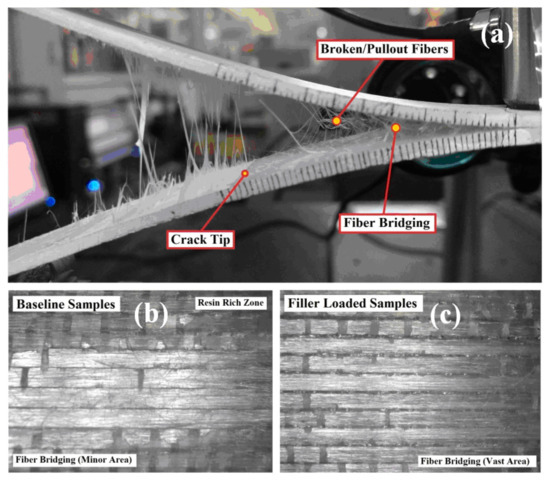
Figure 10.
Fracture surfaces of Double Cantilever Beam (DBC) samples (a) Delaminated view of 5 wt.% filler samples; Closer view of: (b) No-filler sample; (c) 5 wt.% filler sample.
The interply fiber orientation in the mid-plane was observed to guide the crack propagation at the interfaces. The baseline samples exhibited smooth crack propagation without any deviation, which contributed to low fracture toughness [7]. This is due to the inherent brittleness of epoxy matrix. However, inclusion of different percentages of filler promotes better interfacial adhesion, intensive fiber bridging, and energy dissipation mechanisms like filler/matrix debonding, and filler pullout which resulted in improved GIC initiation and GIC propagation fracture toughness. This can be seen from the Figure 10, where the filler-loaded samples (5 wt.%) show rough fracture surface with a vast area of fiber bridging. In contrast, the baseline samples without filler exhibit smooth fracture surface with more resin rich zone indicating brittle fracture and minor fiber bridging.
3.2.2. Morphological Observation of the Effect of Filler into Glass/Epoxy Composite
As discussed above, fillers present in the interlaminar domain act as crack arrestors/inhibitors hindering the crazing cracks by dissipating more energy through toughening mechanism such as crack deflection, filler debonding and filler interlocking, such as shown in Figure 11 and Figure 12. The term “crazing” mentioned here denotes “Developing network of microcracks” during mode II shear failure and not the toughening phenomenon which enhances the fracture toughness in thermoplastics like PS, PMMA, and polycarbonates. However, literature showed thermosetting epoxies reinforced with amido-amine-functionalized multi-walled carbon nanotubes (A-MWNTs) exhibited crazing, which improved fatigue resistance [45]. It is suggested that milled fibers, depending on their amount, could produce a similar effect, in practice this implies that the fracture toughness and ductility of epoxy, which is inherently brittle, would be significantly enhanced by crazing. Importantly, these enhancements in fatigue resistance and toughness are achieved with no material softening, so that Young’s modulus of the nanocomposite was 30% higher, while its average hardness was 45% higher than the baseline (pristine) epoxy. This effect was related to heterogeneous curing of the epoxy, which results in localized pockets of non-cross-linked epoxy that are trapped (or frozen) at the nanotube–matrix interfaces [46]. These localized regions of high molecular mobility can evolve (or coalesce) when the material is mechanically loaded to generate conditions that are favorable for crazing.
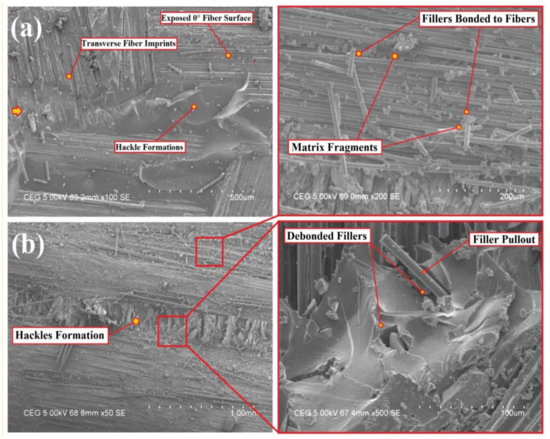
Figure 11.
Fractured surfaces of (a) baseline glass/epoxy samples (b) 5% wt. filler modified glass/epoxy samples. To the right, two insets of (b) showing close-up of the marked regions.
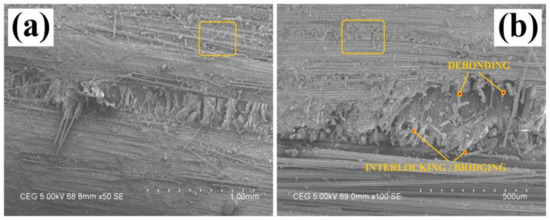
Figure 12.
Effect of filler distribution in 5 wt.% composite at different magnifications: (a) 50x, (b) 100x.
The void content in this case appeared generally very low, as observable from SEM micrographs in Figure 11, Figure 12 and Figure 13, slightly higher in the case of 10 wt.% (Figure 13) than in 5 wt.% filler laminates (Figure 11b and Figure 12), possibly due to air trapped around milled glass fiber fillers. As concerns the baseline sample with no filler, Figure 11a illustrates a smooth fracture surface exhibiting brittle fracture. Hackle patterns are also visible due to shear deformation experienced in mode II loading, which results in coalescence of microcracks in the matrix interface [47]. The exposed fiber surfaces show the occurrence of adhesive failure, which evidences the poor bonding between the fiber/matrix interfaces (crack propagated easily between the interfaces, resulting in low fracture toughness) [48]. On the other side, Figure 11b shows the fracture surface of the 5% wt. filler modified samples with rough fracture surface indicating ductile failure. The presence of the filler arrests/deflects the crack propagation preventing the expansion of microcracking in the matrix via the formation of large hackles, therefore improving the interlaminar fracture toughness. In general terms, toughening mechanisms, such as crack deflection, debonding and interlocking of filler/matrix interface, require additional energy to initiate/propagate the crack which contributes to enhanced fracture toughness, as suggested in [49]. This was proved in the case of the introduction of low amounts of fillers, such as 5 wt.%, and has been also related to uniform dispersion of the filler in the composite.
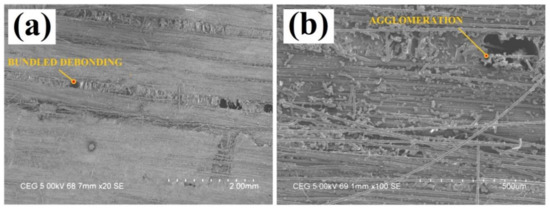
Figure 13.
Agglomeration effects in 10 wt.% composite at different magnifications: (a) 20x, (b)100x.
Here too, the uniformity of dispersion of filler in the composite, achieved by mechanical mixing and sonication, is apparent in Figure 11b and Figure 12: here, fracture is indicated in the resin domain by individual debonding and crack diversion, hence resulting in enhanced fracture toughness. The incorporation of filler apparently leads to newly created surface area by debonding, while before fracture they were providing effective interlocking and bridging. Filler in the fracture surface was observed to be aligned perpendicular to the crack, hence typically absorbing more energy and exhibiting higher fracture toughness [50].
However, minor local agglomeration was observed as filler concentration increases, such as in Figure 13. In particular, it is observed that a kind of “bundled fibers” debonding occurred due to the local agglomeration of fillers in the resin-rich domain [51], which subsequently resulted in difficulty in processing, due to increased resin viscosity. Also, at higher filler loading, these excess fillers get aligned parallel to the crack growth and agglomerates locally in the intralaminar resin channel, which is likely to result in more difficult adhesion. Thus, a decrease in interlaminar fracture toughness was observed due to scarcity of resin in the domain where filler accumulation would act as a stress raiser, hence leading to early failure.
3.2.3. Flexural Tests Results
Figure 14a shows the load–displacement behavior of glass/epoxy samples with various filler loading. The neat glass/epoxy (baseline) samples without fillers show lower flexural strength due to the presence of a large resin rich interlayer domain, making the laminate more brittle. However, inclusion of filler into the glass/epoxy laminates provided a good improvement to the bending stiffness of the composites.
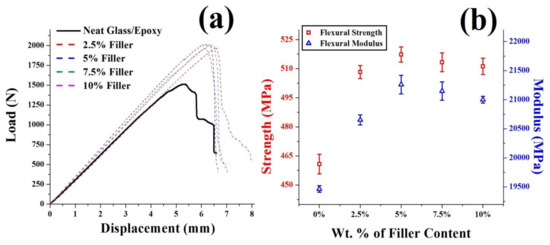
Figure 14.
(a) Typical load–displacement plot; (b) Influence of different filler loading on flexural strength and flexural modulus.
Moreover, the crack propagation becomes stable due to the presence of filler; therefore they act as a crack deflector/arrestor. From Figure 14b, it can be seen that the incorporation of filler has improved the flexural performance significantly. Here again, the highest properties were measured on the 5 wt.% filler added composite, while further increase in filler loading beyond 5 wt.% resulted in reduction of flexural properties. This is likely to be due to agglomeration and settling of fillers in the intralaminar channel subsequently increasing the viscosity of the matrix exhibiting improper fiber impregnation and difficulty in processing [10]. It is also likely that addition of filler above 5% decreases the degree of cross linking of resin system, as observed whenever a high degree of stress concentration is reported [28]. The filler distribution was uniform for samples loaded with content of filler limited to 5 wt. %. In other words, increasing the filler concentration would result in delamination and microbuckling on compressive side due to poor interlaminar adhesion [52]. The consequence outcome would be a significant scale effect on the toughness curves, due to the difficult control of filler disposition and size [53].
4. Conclusions
Experimental investigation of Mode I and Mode II interlaminar fracture toughness test on glass/epoxy samples were performed with various loading of recycled milled glass fiber filler (2.5, 5, 7.5 and 10% by weight of epoxy matrix). This work was accomplished with insight of implementing low cost, economic, and recycled filler to have a sustainable substitute over the commercially available expensive fillers.
The main conclusions can be drawn as follows:
- The addition of 5 wt.% milled glass fibers have improved the mode I (GIC) and mode II fracture toughness (GIIC) significantly by 102% and 175%, respectively. This observation is attributed to the good filler/matrix interfacial strength and high energy dissipation mechanism through crack deflection, filler/matrix debonding and interlocking.
- The inclusion of milled glass fibers in the interlaminar domain has significantly improved the flexural strength which was attributed to enhanced load transfer at lower filler loading. In contrast, higher filler loading leads to local agglomeration of excess fillers in the inter/intralaminar resin channel and poor adhesion (insufficient resin), which result in reduction of strength and fracture toughness.
Therefore, inclusion of milled glass fibers has substantially improved the interlaminar fracture toughness of the glass/epoxy laminates without affecting the flexural properties. The conclusion is that milled fibers, despite their simplicity of recovery from end-of-life composites, can represent alternative fillers for composites laminates to be efficiently used in limited amounts—not exceeding a few percentage points—before agglomeration issues arise.
Author Contributions
Methodology, V.A., R.S.; investigation, R.S., K.S.; writing—original draft preparation, V.A., R.S., K.S.; writing—review and editing, C.S.; supervision, V.A., C.S. All authors have read and agreed to the published version of the manuscript.
Funding
This research received no external funding.
Conflicts of Interest
The authors declare no conflicts of interest.
References
- Wicks, S.S.; de Villoria, R.G.; Wardle, B.L. Interlaminar and intralaminar reinforcement of composite laminates with aligned carbon nanotubes. Compos. Sci. Technol. 2010, 70, 20–28. [Google Scholar] [CrossRef]
- Cantwell, W.J.; Morton, J. The impact resistance of composite-materials—A review. Composites 1991, 22, 347–362. [Google Scholar] [CrossRef]
- Lubineau, G.; Rahaman, A. A review of strategies for improving the degradation properties of laminated continuous fiber/epoxy composites with carbon-based nanoreinforcements. Carbon 2012, 50, 2377–2395. [Google Scholar] [CrossRef]
- Storck, S.; Malecki, H.; Shah, T.; Zupan, M. Improvements in interlaminar strength: A carbon nanotube approach. Compos. Part B Eng. 2011, 42, 1508–1516. [Google Scholar] [CrossRef]
- Mouritz, A. Review of z-pinned composite laminates. Compos. Part A Appl. Sci. Manuf. 2007, 38, 2383–2397. [Google Scholar] [CrossRef]
- Mouritz, A.; Leong, K.; Herszberg, I. A review of the effect of stitching on the in-plane mechanical properties of fibre-reinforced polymer composites. Compos. Part A Appl. Sci. Manuf. 1997, 28, 979–991. [Google Scholar] [CrossRef]
- Solaimurugan, S.; Velmurugan, R. Influence of in-plane fiber orientation on the mode I inter-laminar fracture toughness of stitched glass/polyester composites. Compos. Sci. Technol. 2008, 68, 1742–1752. [Google Scholar] [CrossRef]
- Zhu, Y.; Bakis, C.B.; Adair, J.H. Effects of carbon nanofiller functionalization and distribution on interlaminar fracture toughness of multi-scale reinforced polymer composites. Carbon 2012, 50, 1316–1331. [Google Scholar] [CrossRef]
- Almuhammadi, K.; Alfano, M.; Yang, Y.; Lubineau, G. Analysis of interlaminar fracture toughness and damage mechanisms in composite laminates reinforced with sprayed multi-walled carbon nanotubes. Mater. Des. 2014, 53, 921–927. [Google Scholar] [CrossRef]
- Kawaguchi, T.; Pearson, R.A. The effect of particle-matrix adhesion on the mechanical behavior of glass filled epoxies. Part 2. A study on fracture toughness. Polymer 2003, 44, 4239–4347. [Google Scholar] [CrossRef]
- Singh, R.P.; Zhang, M.; Chan, D. Toughening of a brittle thermosetting polymer: Effects of reinforcement particle size and volume fraction. J. Mater. Sci. 2002, 37, 781–788. [Google Scholar] [CrossRef]
- Sun, L.; Gibson, R.F.; Gordaninejad, F.; Suhr, J. Energy absorption capability of nanocomposites: A review. Compos. Sci. Technol. 2009, 69, 2392–2409. [Google Scholar] [CrossRef]
- Li, C.Y.; Chou, T.W. Elastic moduli of multi-walled carbon nanotubes and the effect of van der Waals forces. Compos. Sci. Technol. 2003, 63, 1517–1524. [Google Scholar] [CrossRef]
- Thostenson, E.T.; Chou, T.-W. On the elastic properties of carbon nanotube-based composites: Modelling and characterization. J. Phys. D Appl. Phys. 2003, 36, 573–582. [Google Scholar] [CrossRef]
- Garcia, E.J.; Wardle, B.L.; Hart, A.J. Joining prepreg composite interfaces with aligned carbon nanotubes. Compos. Part A Appl. Sci. Manuf. 2008, 39, 1065–1070. [Google Scholar] [CrossRef]
- Aldajah, S.; Haik, Y. Transverse strength enhancement of carbon fiber reinforced polymer composites by means of magnetically aligned carbon nanotubes. Mater. Des. 2012, 34, 379–383. [Google Scholar] [CrossRef]
- Davis, D.C.; Whelan, B.D. An experimental study of interlaminar shear fracture toughness of a nanotube reinforced composite. Compos. Part B Eng. 2011, 42, 105–116. [Google Scholar] [CrossRef]
- Matthews, F.L.; Rawlings, R.D. Composite Materials: Engineering and Science; Woodhead Publishing Limited: Cambridge, UK, 1999. [Google Scholar]
- Fan, Z.; Santare, M.H.; Advani, S.G. Interlaminar shear strength of glass fiber reinforced epoxy composites enhanced with multi-walled carbon nanotubes. Compos. Part A Appl. Sci. Manuf. 2008, 39, 540–554. [Google Scholar] [CrossRef]
- Seyhan, A.T.; Tanoğlu, M.; Schulte, K. Mode I and mode II fracture toughness of E-glass non-crimp fabric/carbon nanotube (CNT) modified polymer-based composites. Eng. Fract. Mech. 2008, 75, 5151–5162. [Google Scholar] [CrossRef]
- Zhou, Y.; Pervin, F.; Lewis, L.; Jeelani, S. Fabrication and characterization of carbon/epoxy composites mixed with multi-walled carbon nanotubes. Mater. Sci. Eng. A 2008, 475, 157–165. [Google Scholar] [CrossRef]
- Athanasiou, C.E.; Zhang, H.; Ramirez, C.; Xi, J.; Baba, T.; Wang, X.; Zhang, W.; Padture, N.P.; Szlufarska, I.; Sheldon, B.W. High toughness carbon-nanotube-reinforced ceramics via ion-beam engineering of interfaces. Carbon 2020, 163, 169–177. [Google Scholar] [CrossRef]
- Pimenta, S.; Pinho, S. Recycling carbon fibre reinforced polymers for structural applications: Technology review and market outlook. Waste Manag. 2011, 31, 378–392. [Google Scholar] [CrossRef]
- Pickering, S. Recycling technologies for thermoset composite materials—Current status. Compos. Part A Appl. Sci. Manuf. 2006, 37, 1206–1215. [Google Scholar] [CrossRef]
- Thomason, J.; Jenkins, P.; Yang, L. Glass Fibre Strength—A Review with Relation to Composite Recycling. Fibers 2016, 4, 18. [Google Scholar] [CrossRef]
- Liu, X.; Athanasiou, C.E.; Padture, N.P.; Sheldon, B.W.; Gao, H. A machine learning approach to fracture mechanics problems. Acta Mater. 2020, 190, 105–112. [Google Scholar] [CrossRef]
- Seyhan, A.T.; Gojny, F.H.; Tanoğlu, M.; Schulte, K. Critical aspects related to processing of carbon nanotube/unsaturated thermoset polyester nanocomposites. Eur. Polym. J. 2007, 43, 374–379. [Google Scholar] [CrossRef]
- Yesgat, A.; Kitey, R.; Admassu, L.Y. Effect of filler geometry on fracture mechanisms in glass particle filled epoxy composites. Eng. Fract. Mech. 2016, 160, 22–41. [Google Scholar] [CrossRef]
- Pegorin, F.; Pingkarawat, K.; Daynes, S.; Mouritz, A. Mode II interlaminar fatigue properties of z-pinned carbon fibre reinforced epoxy composites. Compos. Part A Appl. Sci. Manuf. 2014, 67, 8–15. [Google Scholar] [CrossRef]
- Lee, J.J.; Lim, J.O.; Huh, J.-S. Mode II interlaminar fracture behavior of carbon bead-filled epoxy/glass fiber hybrid composite. Polym. Compos. 2000, 21, 343–352. [Google Scholar] [CrossRef]
- Srivastana, V.K.; Hogg, P.J. Moisture effects on the toughness, mode I and mode II of particles filled quasi isotropic glass fiber reinforced polyester resin composites. J. Mater. Sci. 1998, 33, 1129–1136. [Google Scholar] [CrossRef]
- American Society of Mechanical Engineers. ASTM D5528-94a, Standard Test Method for Mode I Inter-Laminar Fracture Toughness of Unidirectional; ASTM International: West Conshohocken, PA, USA, 2013; pp. 1–12. [Google Scholar] [CrossRef]
- Schön, J.; Nyman, T.; Blom, A.; Ansell, H. A numerical and experimental investigation of delamination behavior in the DCB specimen. Compos. Sci. Technol. 2000, 60, 173–184. [Google Scholar] [CrossRef]
- Coates, J. Interpretation of Infrared Spectra, A Practical Approach; Wiley: Hoboken, NJ, USA, 2006. [Google Scholar]
- Silverstein, R.M.; Bassler, G.C. Spectrometric identification of organic compounds. J. Chem. Educ. 1962, 39, 546. [Google Scholar] [CrossRef]
- Chan, M.-L.; Lau, K.T.; Wong, T.-T.; Cardona, F. Interfacial bonding characteristic of nanoclay/polymer composites. Appl. Surf. Sci. 2011, 258, 860–864. [Google Scholar] [CrossRef]
- Rajagopalan, N.; Khanna, A.S. Effect of Methyltrimethoxy Silane Modification on Yellowing of Epoxy Coating on UV (B) Exposure. J. Coatings 2014, 2014, 1–7. [Google Scholar] [CrossRef]
- Ahmadi, A.; Ramezanzadeh, B.; Mahdavian, M. Hybrid silane coating reinforced with silanized graphene oxide nanosheets with improved corrosion protective performance. RSC Adv. 2016, 6, 54102–54112. [Google Scholar] [CrossRef]
- Kinloch, A.J.; Maxwell, D.L.; Young, R.J. The fracture of hybrid-particulate composites. J. Mater. Sci. 1985, 20, 4169–4184. [Google Scholar] [CrossRef]
- Wetzel, B.; Rosso, P.; Haupert, F.; Friedrich, K. Epoxy nanocomposites—Fracture and toughening mechanisms. Eng. Fract. Mech. 2006, 73, 2375–2398. [Google Scholar] [CrossRef]
- Chen, Q.; Wu, W.; Zhao, Y.; Xi, M.; Xu, T.; Fong, H. Nano-epoxy resins containing electrospun carbon nanofibers and the resulting hybrid multi-scale composites. Compos. Part B Eng. 2014, 58, 43–53. [Google Scholar] [CrossRef]
- Chen, Y.; Wang, S.; Liu, B.; Zhang, J. Effects of geometrical and mechanical properties of fiber and matrix on composite fracture toughness. Compos. Struct. 2015, 122, 496–506. [Google Scholar] [CrossRef]
- Klingler, A.; Bajpai, A.; Wetzel, B. The effect of block copolymer and core-shell rubber hybrid toughening on morphology and fracture of epoxy-based fibre reinforced composites. Eng. Fract. Mech. 2018, 203, 81–101. [Google Scholar] [CrossRef]
- Zhang, W.; Srivastava, I.; Zhu, Y.-F.; Picu, C.; Koratkar, N.A. Heterogeneity in Epoxy Nanocomposites Initiates Crazing: Significant Improvements in Fatigue Resistance and Toughening. Small 2009, 5, 1403–1407. [Google Scholar] [CrossRef]
- Kamar, N.T.; Hossain, M.M.; Khomenko, A.; Haq, M.; Drzal, L.T.; Loos, A. Interlaminar reinforcement of glass fiber/epoxy composites with graphene nanoplatelets. Compos. Part A Appl. Sci. Manuf. 2015, 70, 82–92. [Google Scholar] [CrossRef]
- Saber-Samandari, S.; Khatibi, A.A.; Basic, D. An experimental study on clay/epoxy nanocomposites produced in a centrifuge. Compos. Part B Eng. 2007, 38, 102–107. [Google Scholar] [CrossRef]
- Chen, Y.; Liu, B.; He, X.; Huang, Y.; Hwang, K. Failure analysis and the optimal toughness design of carbon nanotube-reinforced composites. Compos. Sci. Technol. 2010, 70, 1360–1367. [Google Scholar] [CrossRef]
- Lyashenko, T.; Lerman, N.; Wolf, A.; Harel, H.; Marom, G. Improved Mode II delamination fracture toughness of composite materials by selective placement of protein-surface treated CNT. Compos. Sci. Technol. 2013, 85, 29–35. [Google Scholar] [CrossRef]
- Miwa, M.; Yokoi, T.; Takeno, A. Relation between shear yield strength at the fiber-matrix interphase and Young’s modulus of epoxy resin. Compos. Interfaces 2000, 7, 487–495. [Google Scholar] [CrossRef]
- Bandyopadhyay, S.; Gellert, E.; Silva, V.; Underwood, J. Microscopic Aspects of Failure and Fracture in Cross-Ply Fibre Reinforced Composite Laminates. J. Compos. Mater. 1989, 23, 1216–1231. [Google Scholar] [CrossRef]
- Shokrieh, M.M.; Salamat-Talab, M.; Heidari-Rarani, M. Effect of interface fiber angle on the R-curve behavior of E-glass/epoxy DCB specimens. Theor. Appl. Fract. Mech. 2016, 86, 153–160. [Google Scholar] [CrossRef]
- Mackin, T.J.; Halverson, T.L.; Sottos, N.R. The effect of interfacial properties on damage evolution in model composites. Polym. Compos. 2005, 26, 241–246. [Google Scholar] [CrossRef]
- Heidari-Rarani, M.; Shokrieh, M.M.; Camanho, P. Finite element modeling of mode I delamination growth in laminated DCB specimens with R-curve effects. Compos. Part B Eng. 2013, 45, 897–903. [Google Scholar] [CrossRef]


© 2020 by the authors. Licensee MDPI, Basel, Switzerland. This article is an open access article distributed under the terms and conditions of the Creative Commons Attribution (CC BY) license (http://creativecommons.org/licenses/by/4.0/).