1. Introduction
In the modern design of reinforced concrete (RC) buildings, architects often prefer using RC columns with small size, i.e., columns with a small width. Certainly, this process provides more free space and a good aesthetic internal look to the buildings. Reducing the column size results in slender (long) columns and consequently, the stability problem may be faced. Furthermore, reducing the column cross-sectional area does not eliminate rectangular/square columns edges that emerged out of their partitions, as shown in
Figure 1a. The emergence of columns edges can directly affect the living space, the furniture arrangement, or cause accidents when the children are playing or moving around at home. Besides, they caused difficulty communicating because of the bulging part of the column [
1,
2].
To overcome these limitations, new types of RC columns called specially shaped reinforced concrete (SSRC) columns are used as hidden columns between partitioning of the building. Using SSRC columns as shown in
Figure 1b results in many architectural and structural advantages such as avoiding prominent columns edges, easy in fashioning, reducing dead load, increasing flexural stiffness, as well as saving in cost when compared with RC frames with square or rectangular columns [
3,
4]. It should be noted that buildings with SSRC columns are widely used in many cities of China, especially with residential constructions because they have good ductility and strong deformation capacity as compared with those constructed with traditional columns [
2,
5].
The use of RC columns with special cross-sectional configuration is not a new idea. The idea began to appear in the 1970s. There are many researchers who studied the bearing capacity of specially shaped columns by numerical and experimental methods such as [
6,
7,
8,
9]. All of these studies focused on the behavior of short columns. In contrast, the behavior of slender columns was not well-considered, except Tsao in 1991. Tsao developed a computer program to evaluate the strength and load-deformation behavior of non-rectangular columns [
10]. However, there is a lack of knowledge about the structural behavior of slender SSRC columns, since there is limited obtainable data about it, as well as, no design aids or guidelines are found in most standard codes.
In the present research, the structural performance of slender T and ±shaped columns was studied experimentally and numerically via nonlinear finite element (FE) analysis employing Abaqus program as a simulation tool. Besides, a comparison in structural behavior between these types of columns and the equivalent square-shaped columns was executed. The equivalent square column has the same cross-sectional area, percentage of reinforcement, and slenderness ratio (SR) as compared with T and ±shaped columns. Finally, it should be noted that the column SR was calculated based on the equations of ACI 318-19 [
11].
2. Experimental Program
Nine prototype RC columns were tested, these specimens were divided into three groups according to their cross-sectional shape: square-shaped (sq.), ± shaped, and T-shaped columns. Each group has three columns with SR equal to 34, 40, and 50 for each one. The dimensions of test specimens are shown in
Figure 2. The cross-sectional area of each column was 180 cm
2 with 12Φ6 mm diameter deformed bars as longitudinal bars, corresponding to steel ratio equal to 1.8%. 3-mm diameter mild smooth bars were used as lateral reinforcing spaced every 75 mm to hold the longitudinal bars in their position and prevent their buckling. However, the reinforcing area is enough to resist the shear force; i.e., avoiding shear failure. The yield and ultimate strength of longitudinal reinforcing bars were 400 MPa and 600 MPa, respectively. Two heavily reinforced brackets were provided at each end of column to prevent any ends failure.
The specimens were cast in the horizontal position. The concrete mix was designed according to British Standard (BS) and checked by a computer application development by Makenya A. R. [
12,
13]. The average cylinder compressive strength was 48 MPa after 28 days of water curing. The concrete mix proportions used for the present work is: cement = 450 kg/m
3; river sand = 763 kg/m
3; gravel = 1012 kg/m
3; water = 160 L/m
3 and high-performance concrete superplasticizer (commercially known as Structuro 520) = 1.1 L/100 kg cement.
Figure 3 shows the loading frame used for testing of column specimens in which both ends were arranged as pinned ends. Monotonic concentric loading was applied at the bottom end of each specimen using a 1500 kN maximum capacity of hydraulic cylinder jack with an internal diameter equal to 240 mm. Manual (HAWE/Germany) pump model radial piston with a maximum pressure of 45 MPa (450 bar) was used to push the arm. The load was gradually applied from zero up to the failure of the specimen. The upper support of the frame is easily moving up and down, mechanically. The lateral deflections were measured at mid-height of specimens by a linear variable deflection transformer (LVDT) of 100 mm travel capacity. All sensors (LVDT) were connected to a laptop computer by an automatic data acquisition system established to collect the digital measurements during the test.
3. Finite Element Simulation
3.1. Analysis Procedure
Abaqus offers two methods of analysis: linear and nonlinear analysis. In the present study, the nonlinear analysis was not enough to express the real behavior of slender columns under concentric load, for both static general and dynamic analysis available in Abaqus program because the buckling behavior cannot be obtained [
14,
15]. This phenomenon happened due to two reasons. First, all equations of finite element method are based on the equilibrium of stresses and compatibility of strain, i.e., these equations cannot be solved because of discontinuous response at the buckling point. Second, the FE model is represented as a perfect (ideal) column up to complete collapse.
Abaqus solves the discontinuous problem by turning it into a problem with a continuous response instead of bifurcation, which can be accomplished by presenting a geometric imperfection pattern in the perfect (ideal) geometry of the model. There are three methods to define an imperfection available in Abaqus. One of these methods is executed by implementing the imperfection in the input file by using the * IMPERFECTION keyword directly. This requires data, such as eigenvalue and buckling mode and these data were provided by linear elastic buckling analysis [
15].
Briefly, the FE simulation of the presented specimens required two models for the same mesh: Initial model for elastic buckling analysis to establish the probability of collapse. This model was analyzed with linear elastic buckling. Then, the plastic model imports imperfection data from the previous analysis to complete the nonlinear behavior of slender RC columns, the buckling mode, and the Eigenvalue were imported in this model. The input file of the first and second models are modified as shown in
Figure 4.
3.2. Materials Properties
The nonlinear response of plain concrete in both compression and tension were modeled via concrete damage plasticity model (CDPM) taking into consideration the damage parameters. CDPM uses two types of parameters to describe the behavior of plain concrete under uniaxial and compound of stresses. The parameters of compound stresses were defined using Abaqus default values, whereas the uniaxial behavior of concrete was modeled based on the relationships proposed by Euro-code and Belrbi for both compression and tension behavior, respectively [
16,
17]. Also, the reinforcing steel bars were modeled using the plasticity model provided in Abaqus, in which the bilinear model was used to describe the stress–stress relation of reinforcement. The bilinear model is elastic up to the yielding point and perfect plastic between the yielding point and beginning of strain hardening. True stress and plastic strain were used for simulation of the steel reinforcing bars.
3.3. Boundary Conditions, Interaction, and Meshing
In the nonlinear analysis, both ends of specimens were modeled as pinned ends similar to the test condition. Both pinned ends were simulated using two deformations control reference points (RP) with boundary conditions as a coupling constraint between RPs and the end surfaces of specimen for each other. At both ends, the displacements were constrained in all directions, except the axial displacement at the top surface was allowed. Besides all rotations in all axes were allowed. The interactions between the reinforcing bars and concrete were modeled as an embedded region to provide a full bond between each other. The meshing type of concrete and steel reinforced are shown in
Table 1. Mesh converge study was executed to determine the accepted mesh size. A mesh size of 30 mm was selected for plain concrete and reinforcement in the linear and nonlinear analysis except the lateral reinforcement was discretized with a 15-mm mesh size. Concrete was modeled using C3D4 element, i.e., a four-node linear tetrahedron. D3T2 a two-node linear three dimensions truss was used to model the steel reinforcement.
Table 1 shows the characteristics of FE models for linear and nonlinear analyses.
4. Verification of Numerical Analysis Results
Failure modes of FE analyses were compared with the observed failures of tested columns as shown in
Figure 5. The failure modes predicted by FE analyses appeared as compression damage in concrete elements, where the red color refers to maximum compression damage in concrete elements. However, almost similar modes can be seen in tested columns.
Besides, the bearing capacities reached by numerical column models analyzed by FE method (P
FEA) were compared with experimental results (P
Exp.) as shown in
Table 2. A good agreement can be seen between numerically predicted values and those recorded experimentally as the ratio (P
FEA/P
Exp.) is mostly close to one. On the other hand, the FE load-deflection curves were compared with those constructed from test results as shown in
Figure 6. The curves show an acceptable convergence between test and numerical results for the ascending part of the load-deflection curves.
5. Parametric Study and Investigation Study of Results
From the FE model validated in the previous section, an additional detailed parametric study was conducted to enrich determination of the influence of SR on the behavior of the studied columns. Therefore, three models with SR equal to 25, 65 m and 80 were analyzed for each cross-sectional shape. These models can enhance the understanding of the structural behavior of these types of columns.
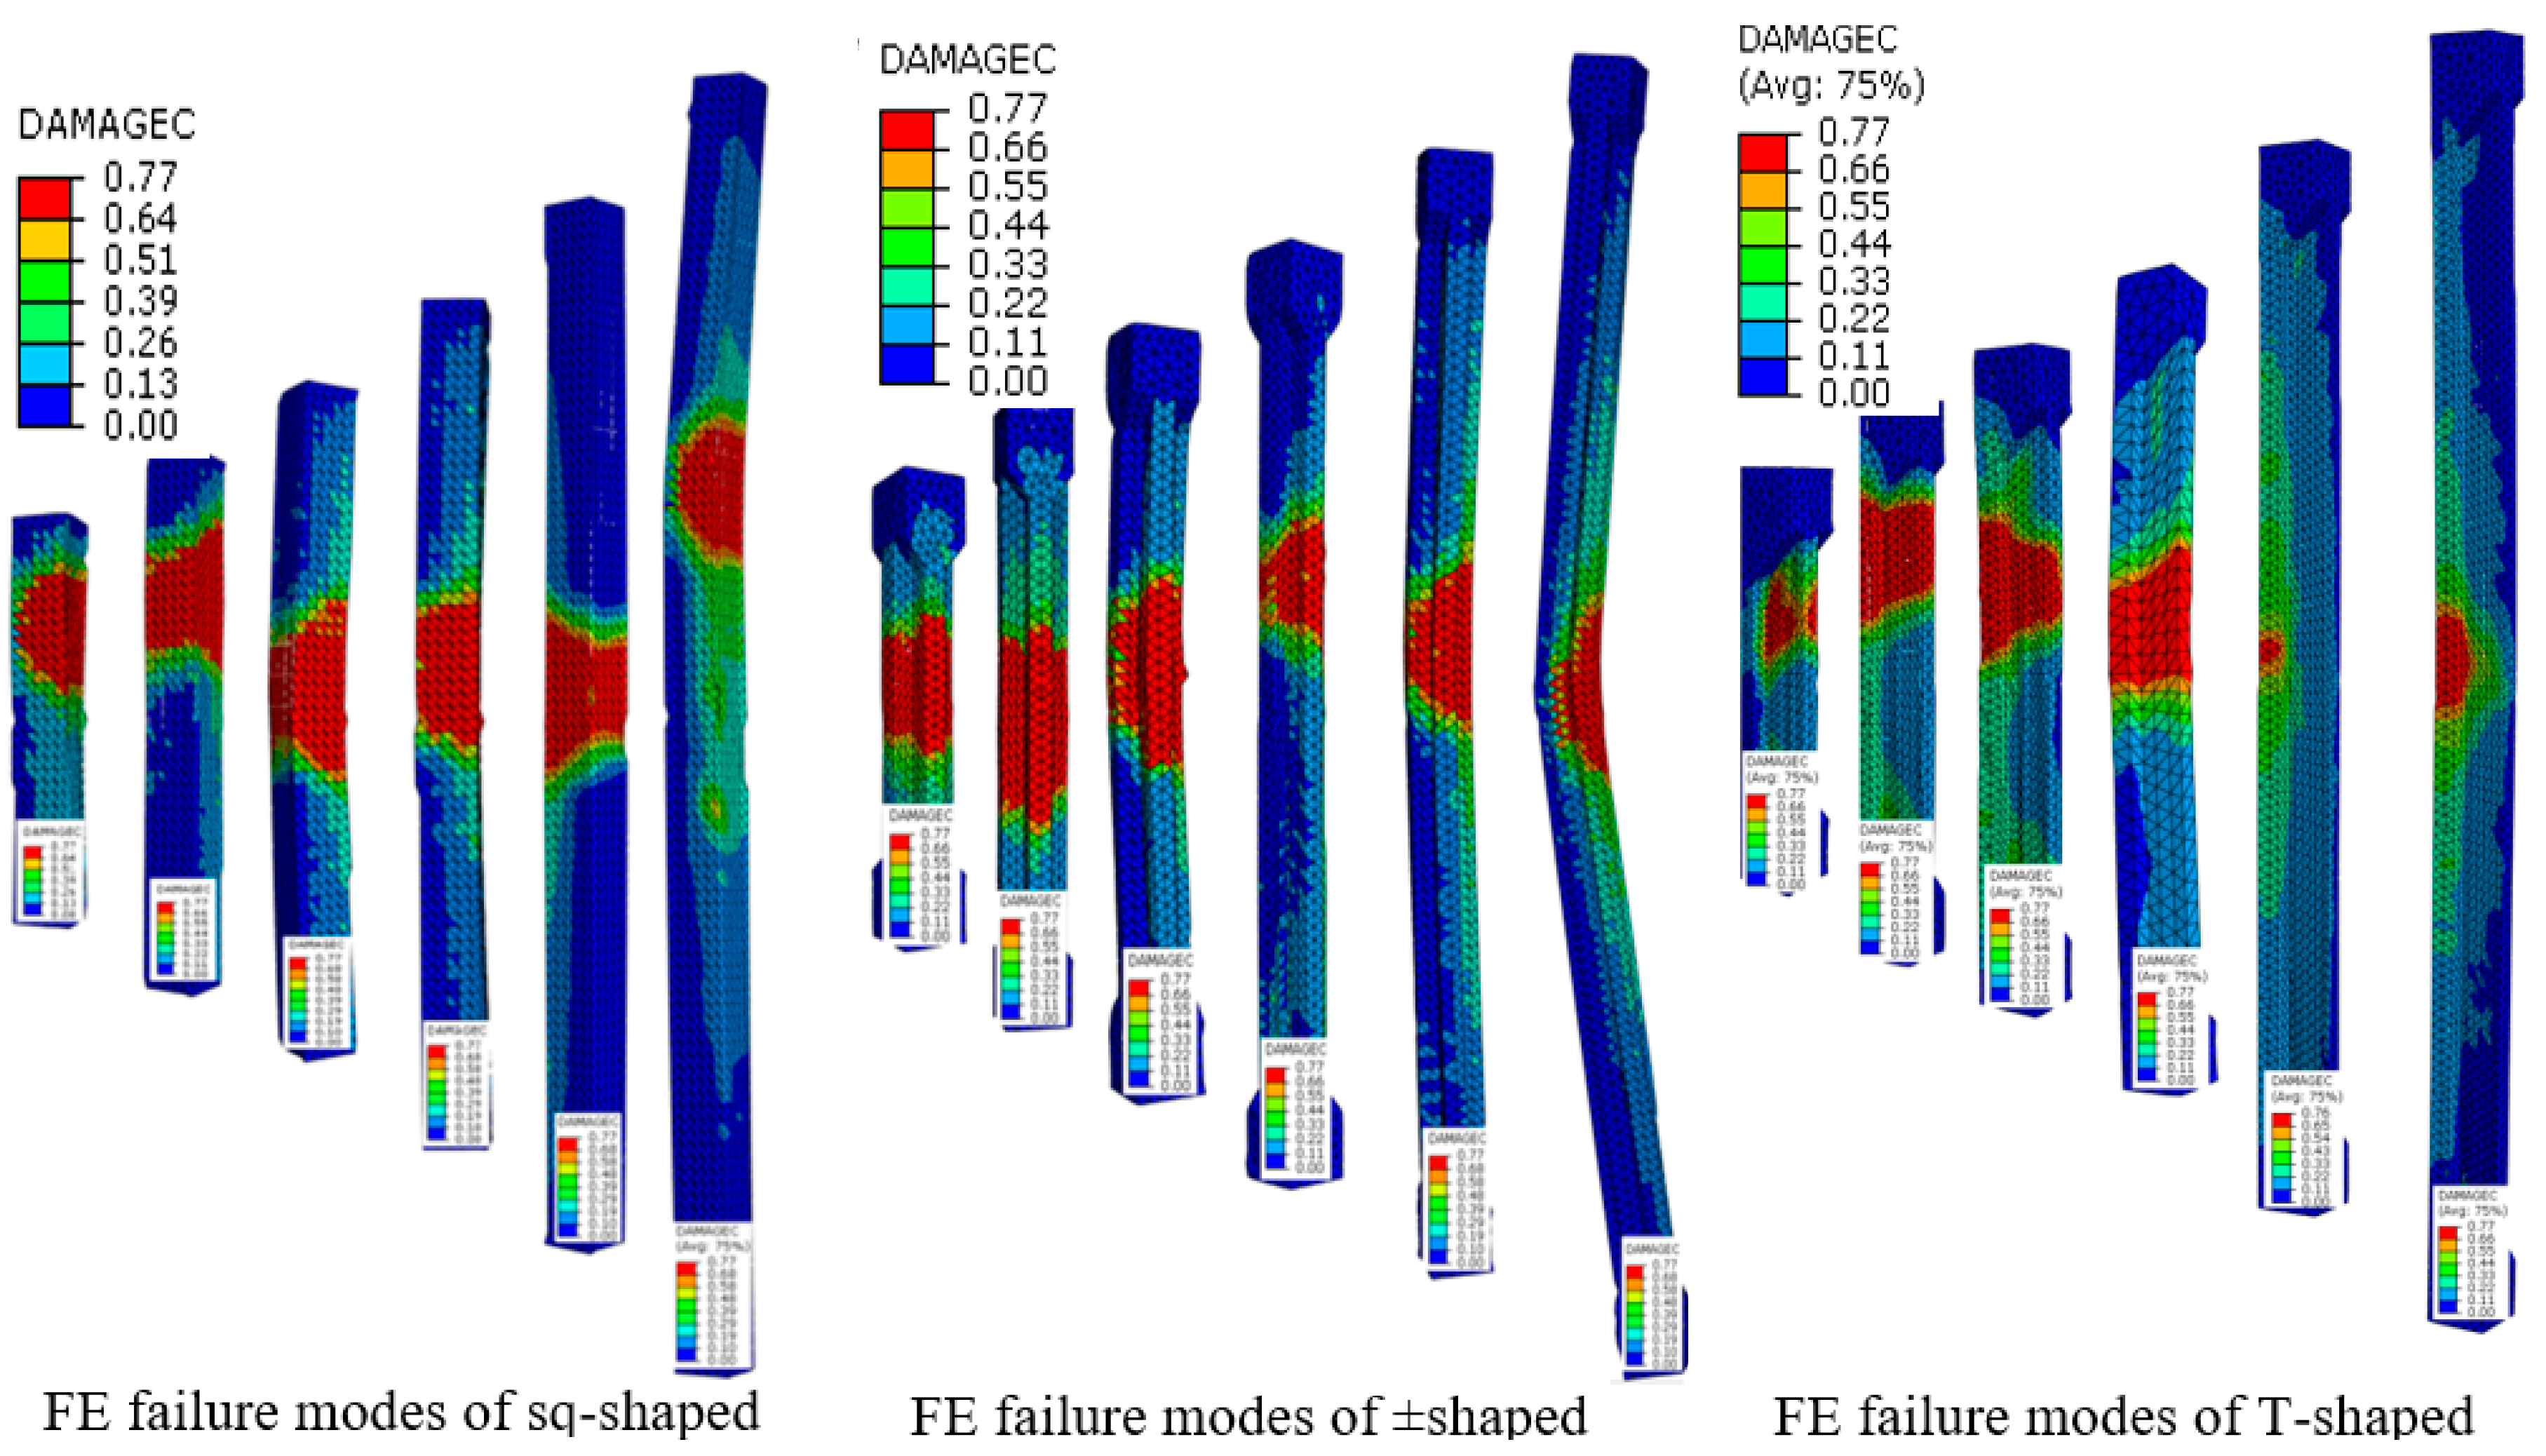
The results of FE analyses and failure modes were presented in
Table 3. Three types of final collapse were observed: compression, compression-Buckling, and buckling as shown in
Figure 7. Compression failure, also called crushing failure occurred with column SR less than 40 (short columns). This type of failure occurred because of material failure, where the applied load is high compared with the cross-sectional area of the specimen. The stresses in concrete and steel bars reach the yield stress and a specimen fails with small lateral deformation (not more than 2 mm). In addition, the combined compression-buckling failure happened in specimens with SR ranged between 40 and 50 because of the effect of bending moment caused by second-order effect (P-Δ effect) or by unintentional eccentricity during the test. Consequently, the failure occurred because of the combined effect of axial load and bending moment. On the other hand, buckling failure (instability) happened in slender columns. When the load increases, the column specimen suddenly bows out on the weak side. This bending increases the lateral deflection to reach about 20 mm which in turn causes the specimen to collapse.
Figure 7 refers to final failure states that were predicted by the FE analyzed. The concrete elements were crushed actually in the zone with red color, while the undamaged concrete elements in the region with blue color. However, the compressive damage variables smoothly ranged from 0 to 0.77 as shown in
Figure 7.
The effects of cross-section shape and column SR values on the strength and deformations are summarized and discussed below:
An increase in the column’s SR value from 25 to 80 resulted in:
Reduction in the ultimate load.
Increase in the lateral deflection, due to an increase of P-Δ effect with increasing of column SR.
A decrease in compressive strength was recorded for all cross-sectional shapes with an increase of SR. The decrease percentages of about 35%, 34%, and 20% were obtained for sq., + and T-shaped respectively when SR of these columns increase from 25 to 80. Besides, at all stages of loading, the deformations were increased with increasing SR, as shown in
Figure 8.
The use of T and ±shaped columns improved the strength and reduced the deformations at all stages of loading as compared with sq-shaped columns. This may be attributed to the stiffness increase of the SSRC columns when compared with the square column of the same cross-sectional area.
It was observed that the ultimate strength was slightly affected when SR is less than 40, while this effect becomes larger with SR more than 40. Therefore, the concept of equivalent-column can be used to evaluate the strength of the ± and T-shaped columns with SR not exceeding 40. The strength of T.65 and +.65 was increased by about 12% and 8% as compared with Sq.65. On the other hand, the deflection of the T and ±shaped column is less than the deflection of the sq-shaped column, as shown in
Figure 9.
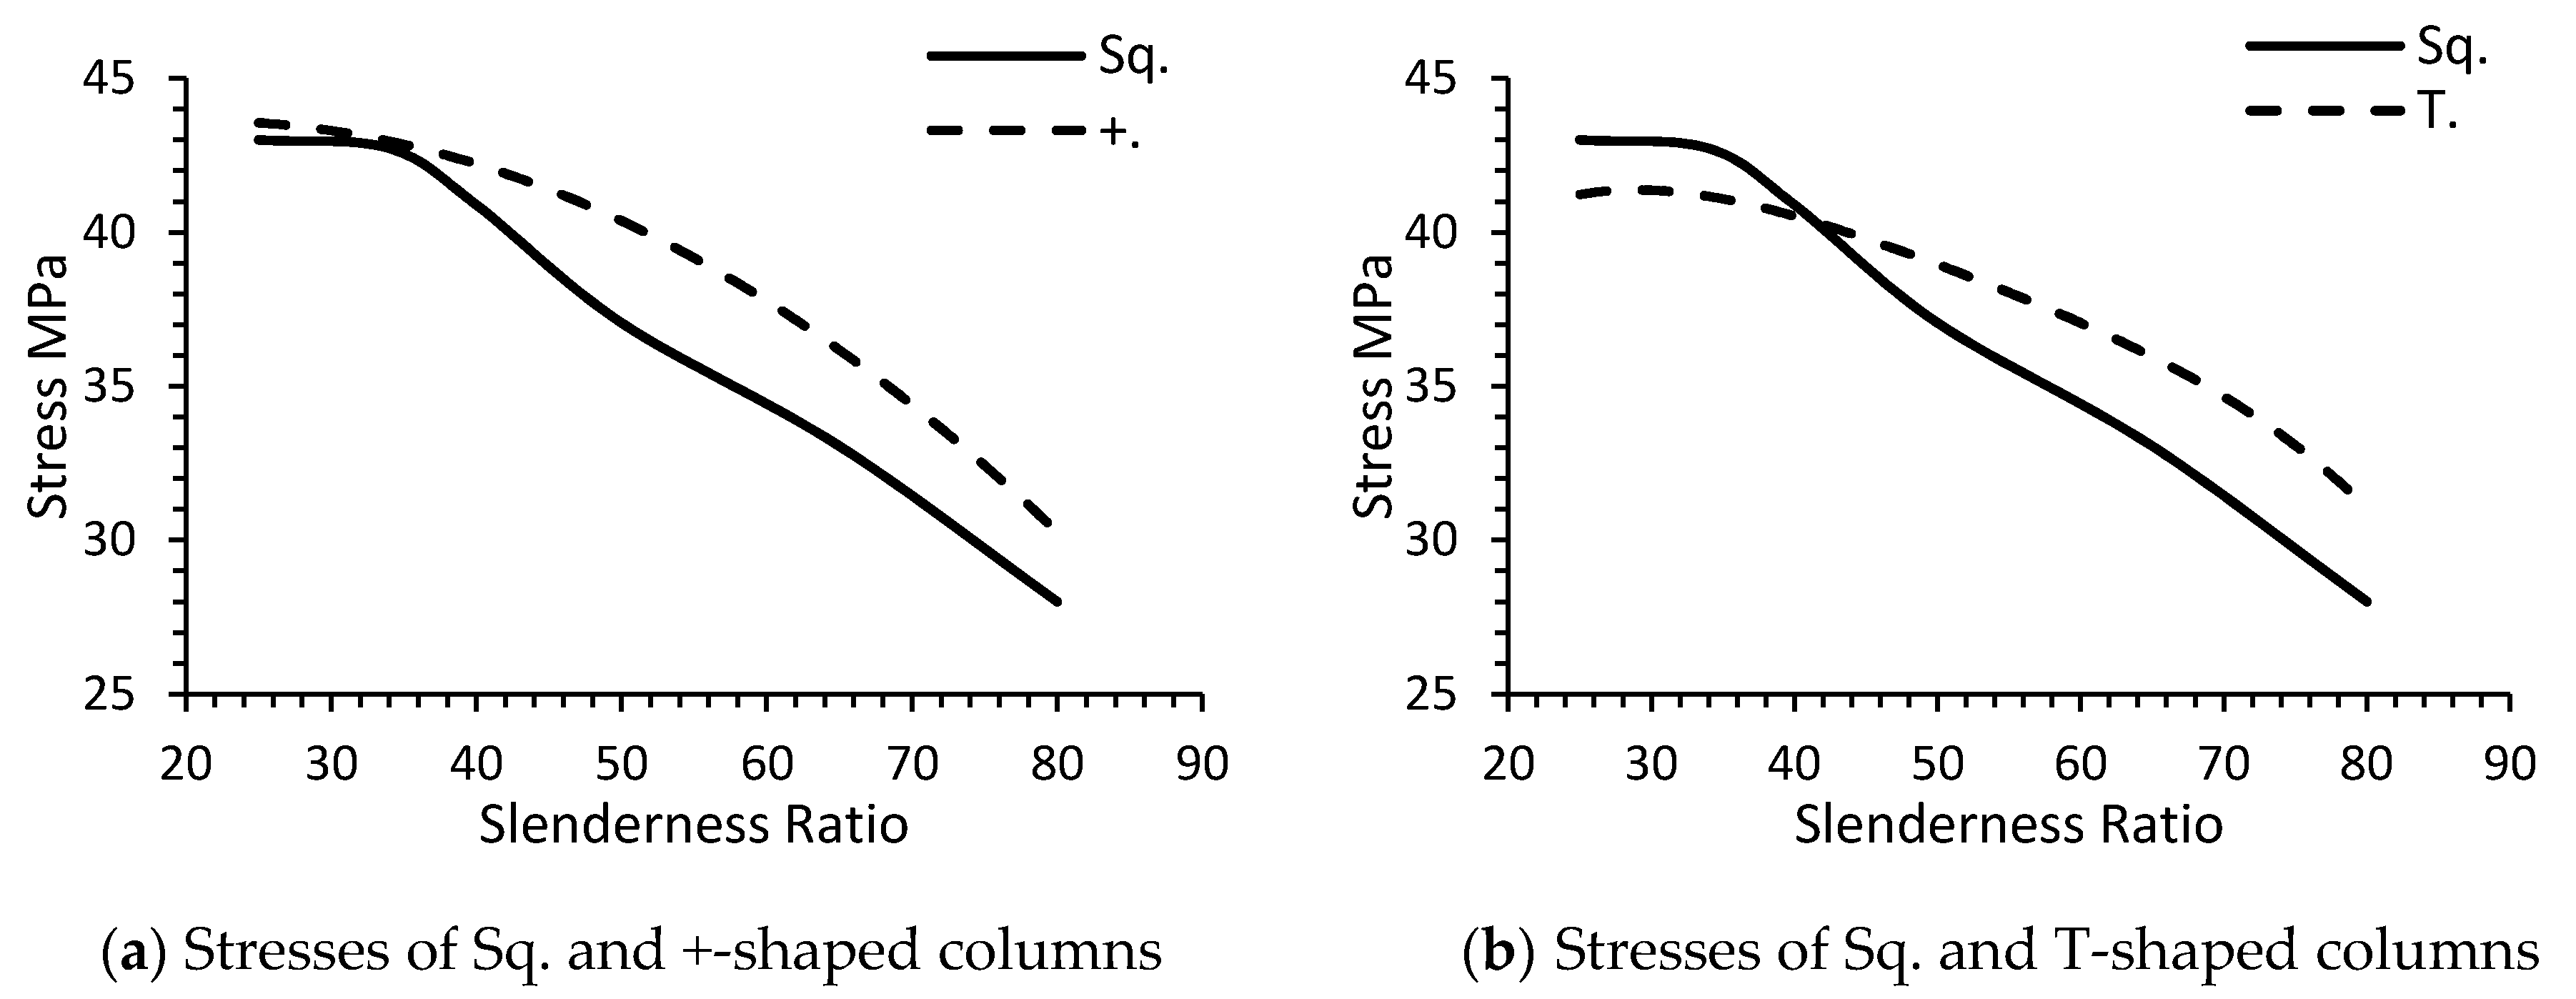
To obtain a better understanding of the behavior of these columns, the compressive stresses (σ
c) in each SSRC column were plotted as a function of SR and compared with those calculated in square columns, as shown in
Figure 10. It can be seen that the T and ±shaped columns resist little more stresses than the square-shaped especially when SR is more than 40.
The secondary moment (M) at mid-height of the specimen due to P-Δ effect was calculated by multiplying P
FEA by lateral deflection (U) corresponding to the maximum load. The values of M increased with increase of SR values, as shown in
Table 3.
6. Modified Design Formulas
Based on the results of the present study, two design approaches were suggested to evaluate the strength of ± and T-shaped columns (N
s) under concentric loading with different SR based on the equation of ACI 318-19 [
11]. As follow:
where A
g is the gross area of the column section, A
S is the cross-sectional area of main reinforcing steel bars, f
y is the yield stress of the reinforcing steel bars, Υ is a reduction factor calculated as the ratio between P
FEA and the strength which calculated by ACI 318-19 (Normalized with ACI).
Ψ and λ are the coefficients of slenderness ratio and section-shape, respectively. The suggested values of these coefficients are shown in
Table 4. It is hoped for this initiative to facilitate the design or evaluation of the strength of such types of columns. However, Equation (1) is more conservative as compared with Equation (2), where the strength determined by Equation (2) is greater approximately by 9%, 13%, and 19% as maximum limits for sq −, ±, and T-shaped columns, respectively.
7. Conclusions
The main objective of the present paper is to study the structural behavior of slender RC columns with + and T-shaped and compare their response with the behavior of the equivalent square-shaped columns. According to the experimental testing and FE results, the following conclusions were drawn:
Using SSRC such as + and T-shaped columns led to a good performance especially when the slenderness ratio is more than 40 as compared with equivalent square-shaped columns. With the increase of strength, deflections were reduced at all stages of loading.
When the slenderness ratio is less than 40, the SSRC column exhibited less increase in strength, thus, the concept of the equivalent-square column can be adopted to estimate the strength of the ± and T-shaped columns with SR not exceeding 40.
The increasing of SR (with the same cross-section shaped) led to a reduction in the strength and increase in deformations. The maximum loss in strength was 35%, 34%, and 20% in sq.80, +.80, and T.80 as compared with sq.25, +.25, and T.25, respectively.
Finally, SSRC columns show a good structural response as compared with equivalent square-shaped columns, but further studies are required to evaluate the structural performance of these types of columns, particularly with varying states of loading.
Author Contributions
Conceptualization, S.Q.A. and A.H.A.-Z.; methodology, S.Q.A. and A.H.A.-Z.; validation, S.Q.A. and A.H.A.-Z., resources, S.Q.A. and A.H.A.-Z.; data curation, S.Q.A. and A.H.A.-Z.; supervision, A.H.A.-Z. All authors have read and agreed to the published version of the manuscript.
Funding
This research received no external funding.
Acknowledgments
The authors wish to express the real thanks to the Consulting Engineering Bureau Laboratories (CEBL) at University of Baghdad for their help and encouragement. Thanks are also presented to the staff of the Civil Engineering Department/College of Engineering /University of Baghdad for their facilities and assistance throughout this study.
Conflicts of Interest
The authors declare no conflict of interest.
References
- Rahaman, A.; Anik, A.M.; Serker, N.H.M.K. Effect of Special Shaped Column on Lateral Load Resistance Capacity of Reinforced Concrete (RC) Building. Am. J. Civ. Eng. 2018, 6, 147. [Google Scholar] [CrossRef]
- Chen, Z.; Xu, J.; Xue, J. Hysteretic Behavior of Special Shaped Columns Composed of Steel and Reinforced Concrete (SRC). Earthq. Eng. Eng. Vib. 2015, 14, 329–345. [Google Scholar] [CrossRef]
- Wang, T.; Liu, X.; Zhao, H. Experimental Study of the Seismic Performance of L-Shaped Columns with 500 MPa Steel Bars. Sci. World J. 2014. [Google Scholar] [CrossRef] [PubMed]
- Gumble, A.N.; Prakash, S.P. Comparison between Specially Shaped Columns and Rectangular Columns in RC Structure. Int. J. Adv. Eng. Res. Dev. 2015, 2, 679–684. [Google Scholar]
- An, J. Study on Optimization Design of Reinforced Concrete Special-Shaped Column Frame Structure. Chem. Eng. Trans. 2017, 62, 1075–1080. [Google Scholar]
- Marin, J. Design Aids for L-Shaped Reinforced Concrete Columns. ACI J. Proc. 1979, 76, 11. [Google Scholar]
- Ramamurthy, L.N.; Khan, T.A.H. L-Shaped Column Design for Biaxial Eccentricity. J. Struct. Eng. 1983, 109, 1903–1917. [Google Scholar] [CrossRef]
- Hsu, C.T.T. T-Shaped Reinforced Concrete Members under Biaxial Bending and Axial Compression. J. Struct. Eng. 1989, 86, 460–468. [Google Scholar]
- Mallikarjuna; Mahadevappa, P. Computer Aided Analysis of Reinforced Concrete Columns Subjected to Axial Compression and Bending—I L-Shaped Sections. Comput. Struct. 1992, 44, 1121–1138. [Google Scholar] [CrossRef]
- Tsao, W.; Hsu, C.T.T. A Nonlinear Computer Analysis of Biaxially Loaded L-Shaped Slender Reinforced Concrete Columns. Comput. Struct. 1993, 49, 579–588. [Google Scholar] [CrossRef]
- Farmington, H. Building Code Requirements for Structural Concrete and Commentary; American Concrete Institute: Michigan, MI, USA, 2019. [Google Scholar]
- Neville, A.M. Selection of Concrete Mix Proportions. In Properties of Concrete, 5th ed.; Pearson: London, UK, 2011; pp. 2468–2482. [Google Scholar]
- Mankenya, A.R.; John, P.M. Potentiality of Using a Developed Matlab Program for the Design of High Strength Concrete Mixes. J. Civ. Eng. Res. 2017, 7, 81–98. [Google Scholar]
- Tjorvi, B. Structural Analysis of Columns with Initial Imperfections. Master’s Thesis, University of Iceland, Reykjavik, Iceland, 2017. [Google Scholar]
- Dassault Systèmes. Geometric Imperfection. In Abaqus Analysis User’s Guide; ABAQUS 6.14; Simulia Corp.: Johnston, RI, USA, 2014; Part IV, Chapter 11. [Google Scholar]
- EN 1991-1-1. Eurocode 2: Design of Concrete Structures-Part 1-1: General Rules and Rules for Buildings; CEN European Committee for Standardization: Brussels, Belgium, 2005. [Google Scholar]
- Belarbi, A.; Hsu, C.T.T. Constitutive Laws of Concrete in Tension and Reinforcing Bars Stiffened by Concrete. J. Struct. Eng. 1994, 91, 465–474. [Google Scholar]
© 2020 by the authors. Licensee MDPI, Basel, Switzerland. This article is an open access article distributed under the terms and conditions of the Creative Commons Attribution (CC BY) license (http://creativecommons.org/licenses/by/4.0/).


