1. Introduction
Carbon nanotubes (CNTs) are materials that, depending on the structural order and degree of functionalization, may combine a number of exceptional properties including low material density, high chemical inertness, high electrical and thermal conductivity as well as very high tensile strength. These properties, some of them superior even to that of steel, have initiated a broad spectrum of fundamental materials research as well as application development activities. CNTs are produced by arc-discharge or catalytical chemical vapor deposition (cCVD) syntheses using none, fluidized or substrate-bound catalysts particles to form powders of (more or less densely) agglomerated fibers or so-called vertically aligned fiber arrays (“forests”), respectively. Catalytic CVD is the most-frequently applied method for large-scale manufacturing of CNTs [
1,
2].
Recently, for some CNT powder products, very high dust and individual fiber release propensities have been identified [
3,
4]. During CNT synthesis and handling, initial processes like product collection and reactor cleaning, as well as secondary processes like CNT powder milling and mixing, product compounding and machining may release airborne CNT or CNT-containing dust particles. During the subsequent use, recycle or disposal phase of CNT-containing products, processes like abrasion and wear, weathering and matrix degradation may release CNTs from the product surface and result in airborne and liquid-carried fibers. All these processes open pathways for CNTs to reach the environment, the food chain or to enter the body of humans or animals in individual fiber or in agglomerated form [
5,
6,
7,
8].
The fiber toxicology paradigm addresses fiber inhalation-related hazards. It was first proposed by Pott and Friedrichs and Stanton and Wrench [
9,
10] on the basis of toxicological findings on asbestos, mineral and vitreous fibers and can be formulated as
According to this paradigm, nanomaterials that are fiber-shaped (aspect ratio > 3), respirable (diameter < 3 µm), long (length > 5 µm) and biopersistent may pose harm to lungs. Many CNTs exhibit this combination of toxicologically relevant properties and must therefore be treated as potentially hazardous materials unless material-specific toxicological data is available.
During the last decade, CNT synthesis and application research has therefore been accompanied by toxicological research in the domains of cellular and environmental effects as well as animal and human health. Early studies revealed that some types of CNTs may indeed cause strong inflammation and necrosis in the lungs of mice exposed to different amounts of CNTs [
11,
12]. For some CNT types, the observed toxic effects were compared to that of asbestos fibers [
6,
13,
14]. Based on toxicological results of animal studies, inhalative exposure to airborne CNTs is assumed the most critical CNT-related health risk. Recent and ongoing research focuses on a better understanding of effects of CNTs in the respiratory system and especially of the parameters involved in their pathogenicity [
15,
16]. Based on observations of lesions in lung tissue and cell culture, it was hypothesized that incomplete phagocytosis of fibers is related to morphological properties of CNTs, like diameter, length and aspect ratio [
17,
18]. This is also termed “frustrated” phagocytosis and stands for the failure of alveolar macrophages to completely ingest a fiber, which is a prerequisite for alveolar “clearance”, i.e., particle and fiber removal from the lung tissue. In a series of studies, Donaldson et al. observed that macrophages failed to ingest CNTs longer than 15 µm, causing injuries of cell membranes (lesions). This initiated inflammatory cell response, similar to effects known from long asbestos fibers. On the other hand, neither short nor tangled CNTs were observed to induce similar effects [
19,
20,
21], which supports the hypothesis that short (<5 µm), flexible CNTs or tangled agglomerates of CNTs are less harmful. Nagai et al. [
22] likewise studied the role of fiber thickness in contact with lung cells and found that tangled, non-rigid multi-walled carbon nanotubes (MWCNTs) caused less harm, whereas non-agglomerated rigid nanotubes, both thin and thick, caused stronger damage, both in macrophages and the mesothelium. The authors used the term “rigidity” to discuss fiber thickness-related effects. The important role of high bending modulus and rigidity has recently been highlighted also by Kane et al. 2018 [
23]. High flexural rigidity is believed to be associated with cell lesions and incomplete phagocytosis.
Physically, the flexural rigidity
of a fiber is defined as product of bending modulus
and second moment of axial area
For a tubular fiber like a CNT with outer
and inner
diameter, the second moment of axial area
is
The rigidity
of cylindrical fibers thus scales with their bending modulus
and the 4th power of their fiber diameter
[
24].
For future interpretation of toxicological data on fibers, we propose to substitute the parameter “fiber diameter” by “fiber rigidity” and to develop reliable rigidity measurement techniques for nanofibers. This would allow extending the fiber toxicology paradigm, which intrinsically is a material-independent hypothesis, by the following hypothesis that also includes flexural rigidity:
For some CNT types, extreme values of the Young’s modulus have been predicted theoretically and determined experimentally, e.g., 1.2 TPa for MWCNTs [
25]. Such high modulus values promoted materials science research on technical applications of CNTs. Many researchers have developed methods to determine CNT properties either theoretically by using computational simulations or experimentally [
26]. Experimental approaches are generally based on atomic force microscopy (AFM) or electron microscopy (EM) and use various mechanical setups like uniaxial loading, bending tests and resonance frequencies detection to determine (static) Young’s modulus values
and static (
) or dynamic (
) bending modulus values, respectively. In most cases, continuum mechanics and linear elasticity theory was applied [
25,
27,
28,
29] and Young’s modulus values were approximated by bending modulus values for infinitesimal deflection. Some authors also included and discussed non-linear rippling and buckling effects [
30,
31,
32,
33,
34] that introduce deviations from the continuum mechanics approach. For many commercially available, industrially relevant CNT types however, the bending modulus is still not reliably known. The reason is that routinely applicable and calibrated techniques are missing for measuring the flexural rigidity of nanofibers.
In the following, the rigidity of individual commercial MWCNTs produced by chemical vapor deposition was studied in mechanical excitation experiments, using the dynamic scanning electron microscopy (DySEM) technique [
35,
36] to determine their bending modulus. By detecting resonance frequencies of cantilevered MWCNTs and applying the Euler–Bernoulli beam theory, bending modulus values
of individual MWCNTs were derived. Using individual tube diameters and lengths, flexural rigidity values were determined.
2. Materials and Methods
2.1. MWCNT
The MWCNTs used here were of type NM-401 provided by the European Joint Research Center (JRC) Repository for Representative Test Materials. Materials available from this repository are from homogenized batches but the original suppliers are not communicated by the JRC. The NM-401 material has been widely used for toxicological research and became a kind of benchmark material. The report published by JRC specified a high degree of graphitization (Raman peak ratio of G/D = 5), an average diameter of about 64 ± 24 nm and only a small inner diameter
below 10 nm [
15]. However, the samples tested in this work showed an average outer diameter of 98 nm. NM-401 are supposedly MWCNTs produced by cCVD that were additionally coated by carbon and heat treated. Such materials are also known as vapor-grown carbon fibers (VGCF) [
37,
38]. The material density of NM-401 was assumed to be (1.8 ± 0.1) ∙ 10
3 kg/m
3 [
39].
2.2. Piezoelectric Actuators
Mass-produced tuning fork crystal units of type CA-301 with 18 pF capacity (Seiko Epson Corporation, provided by Mouser Electronics Inc., Munich, Germany) were used as piezoelectric actuators. They are specified with a resonance frequency of 12 MHz ± 30 ppm and were mostly operated well below this resonance. Their cylindrical steel enclosure of 3 mm diameter and 9 mm length was carefully carved on a lathe and removed manually to lay bare the rod-shaped quartz crystal. After the sample preparation as described subsequently, the electrical wires of the piezo quartz were soldered to a coaxial SubMiniature version B connector (SMB—straight jack for PCB mounting,
Figure 1). During measurements, the quartz was mounted on the scanning electron microscope (SEM) stage and connected to a Belling-Lee connector/SubMiniature version B (BNC/SMB) vacuum chamber feedthrough. Reliable detection of fiber resonances required a driving voltage amplitude of about 10 V for the 12 MHz piezo crystal.
2.3. Preparation of Free-Standing MWCNTs
Free-standing MWCNTs attached to a conductive surface of a piezoelectric quartz crystal were prepared by the following procedure: The tip of one side of a quartz crystal was first metallized using a Leica EM ACE600 sputter coater (Leica Microsysteme Vertrieb GmbH, Wetzlar, Germany) through a mask that prevented metal deposition on the electrical contact area of the quartz. This way, the upper quartz-driving metal electrode was extended towards the tip of the quartz rod. Up to 17 crystals were placed in a special 3-D-printed mask and first coated with 10 nm of iridium, followed by 30 nm of gold. Iridium served as an adhesion-promoting layer for gold on quartz. Light scratching with a metallic tool did not damage and adhesive tape could not remove the gold layer.
The tip of the gold-coated quartz was then dip-coated in an ethanol solution with 50 mM of a thiol (9-Mercapto-1-nonanol, Sigma-Aldrich Chemie GmbH, Taufkirchen, Germany) for 48 h and rinsed with ethanol afterwards. The thiol is capable of forming self-assembled monolayers (SAM) on clean gold surfaces, forming stable gold-thiol bonds with one end of the molecule. The polar hydroxyl group at the other end of the molecule improved the wettability of gold and served as adhesion-promoting layer for a subsequent PEDOT:PSS (poly(3,4-ethylenedioxythiophene)) polymer coating. The polymer was applied by dip-coating the quartz tip for 10 s in an aqueous PEDOT:PSS suspension (3.0%–4.0% in H2O, Sigma-Aldrich). The suspension was soft and sticky in wet state but dried to a solid conductive polymer within a few 10 min at room temperature. The polymer served first to electrostatically embed and then to immobilize the ends of nanofibers and to connect them electrically to ground potential. This prevented charging during SEM and DySEM analysis.
The CNT deposition procedure followed dip-coating after a brief initial PEDOT:PSS drying period of 5 min. These 5 min were not sufficient to let the coating dry completely but left it in a viscous state suitable for CNT penetration upon fiber deposition. Impaction of the viscous polymer film with fibers that were vertically oriented with respect to the quartz surface was achieved by electrostatic precipitation of CNT-containing aerosols. Subsequent PEDOT:PSS suspension drying led to the immobilization of immersed fiber ends.
The setup used for aerosol preparation and precipitation is shown in
Figure 2. It consisted of three parts: an aerosol generation chamber, a sedimentation chamber and a nanoparticle aerosol sampler (NAS) of type TSI 3089 (TSI GmbH, Aachen, Germany) [
40]. The aerosol generation chamber was filled with a mixture of glass beads (Swarcoflex glass beads, diameter 400–600 μm, roundness ≥ 80%, SWARCO M. Swarovski GmbH, Germany) and CNT powder with 2 mass percent of CNTs. The aerosol chamber was mounted on a laboratory vortex shaker MS 3 digital (IKA
®-Werke GmbH and CO. KG, Staufen, Germany) operated at 2000 rpm. Actuated by the vibration, the glass beads performed a milling process upon collision with CNT agglomerates. The break-up of CNT agglomerates generated an aerosol containing also individual fibers that was carried by an airflow of 2 slm. Larger agglomerates and glass bead debris settled in the intermediate sedimentation chamber before the aerosol entered the NAS inlet. Inside the NAS, an electric potential difference of 10 kV between inlet and NAS electrode generated a field strength of 1.2 kV/cm. It attracted and accelerated charged aerosol particles in the airflow towards the conductive, semi-dried PEDOT:PSS layer of the quartz crystal on the NAS electrode. The anisotropic morphology of fibers in combination with natural and during milling triboelectrically induced charges on the fiber led to their alignment along the applied electric field. This way, CNTs were impacted fiber-end onwards into the polymer layer. After layer drying, the fibers were immobilized mostly in erected orientation, as required for resonance measurement, cf.
Figure 3.
2.4. EM Imaging and Lock-In Amplifier Analysis
For imaging during the experiments, mainly two different SEM instruments were used. An ultra-high-resolution cold field emitter SEM of type SU8030 (Hitachi High-Tech Europe GmbH, Krefeld, Germany) and a tungsten thermionic emitter SEM of type EVO MA 10 (Carl Zeiss Microscopy GmbH, Jena, Germany). Both setups allowed reproducible measurements of different types of nanofibers. A SEM must provide sufficient resolution to image the fiber under excitation and to measure its shape and diameter. For accurate diameter measurement, the achievable pixel resolution of both SEMs was better than 1/10 of the fiber diameter. It reached 3 nm for the Zeiss and 1 nm for the Hitachi instrument. The vacuum chambers of the SEM provided a BNC/SMB electrical feedthrough to input the piezo driving voltage supplied by a lock-in amplifier (LIA). The SEMs also allowed connecting the analogue output signal of the secondary electron (SE) detector to the LIA using a T-shaped BNC splitter. We used a HF2LI 50 MHz LIA (Zurich Instruments AG, Zurich, Switzerland).
The morphology of the nanotube was assessed in detail with a transmission electron microscope (TEM) of type JEM-2200FS (JEOL Ltd., Akishima, Japan) equipped with an in-column energy filter (Omega-type). Zero-loss conventional bright field imaging (BF-TEM) was conducted at acceleration voltages of 80 and 200 kV, with an energy window of 35 eV. To analyze the same samples that had been tested standing free on the top edges of the quartz crystals, the piezo unit had to be adapted to the size-restricted sample holder of the TEM. For that, the brittle piezo quartz crystal was carefully cut on the bottom, in a location distant to the area where the nanotubes were fixed. In this way, the ring that connects the electrical wires to the electrodes on the piezo quartz was detached and the remaining part, i.e., the tip of the piezo quartz containing the nanotubes to be analyzed, could then be placed on the TEM sample holder and characterized.
For resonance detection, the piezo support of the fibers was excited to oscillations with a displacement amplitude of about 1.2 µm (10 V) using harmonic AC voltages. This actuated the fiber base. Tuning the oscillation frequency of the piezo and monitoring modulations in the fiber image and of the output signal of the SE detector allowed determining fiber resonances that caused fiber oscillation amplitudes larger than the excitation amplitude of the piezo actuator.
Reliable detection of fiber resonance modes by image signal analysis requires sufficiently high signal-to-noise ratios. This was achievable for fibers standing free on an edge of the quartz imaged before a dark background. For fast and sensitive frequency sweeps with the LIA, necessary for reaching frequencies as high as 5 MHz, only the tip of a fiber was imaged with reduced image frame size that permitted SEM frame rates above 30 Hz. The SE detector output signal of these image frames was submitted to the LIA analysis. A schematic diagram of the experimental setup is shown in
Figure 4. Videos of the vibration of two different nanotubes at resonance are provided in the
Supplementary Materials (Video S1a, S1b, S2a, S2b).
2.5. Deriving the Bending Modulus from Resonance Frequencies
To correlate resonance frequencies and the bending modulus of a fiber, Euler–Bernoulli beam theory was applied (Equation (3)). It is a continuum mechanics theory that describes the dependence of the resonance frequencies
, on the nanotube outer
and inner
diameter, length
, density
and Young’s modulus
:
If the fiber bends by elongation of the outer arc and a compression of the inner arc, then the bending modulus
can be identified with the Young’s modulus
of the material [
25]. The
are coefficients for the
th lateral resonance mode that result from solving the beam geometry-related to the boundary problem of the Euler–Bernoulli differential equation. For the first three resonance modes, one finds
= 1.8751,
= 4.6941 and
= 7.8548. For increasing indices
, the difference
approaches the value of
.
For the tested NM-401 MWCNTs, the outer fiber diameter
has to be measured by SEM. Its experimental error depends on the pixel resolution and uniformity of the fiber. It was observed that the inner diameter
of this type of MWCNTs is very small. For the mean diameter of 64 ± 24 nm [
15] a
smaller than 10 nm would contributes less than 3% to the difference term
. The contribution of the inner diameter to Equation (3) was therefore neglected.
The measurement error of the fiber length with SEM depends on the pixel resolution but will be dominated by the geometric length determination error for a fiber of arbitrary orientation in three-dimensional space from two orthogonal SEM views (projections).
The assumed value and error on the density
were discussed above. If we consider independent individual errors, the error
of the
approximated for small
in Equation (4) can be written as the quadratic mean of relative errors
2.6. Calculating the Flexural Rigidity
According to Equations (1) and (2), using Equation (4), the flexural rigidity can be approximated for small
as
with an error of
2.7. Estimation of Resonance Frequencies and Bending Modulus
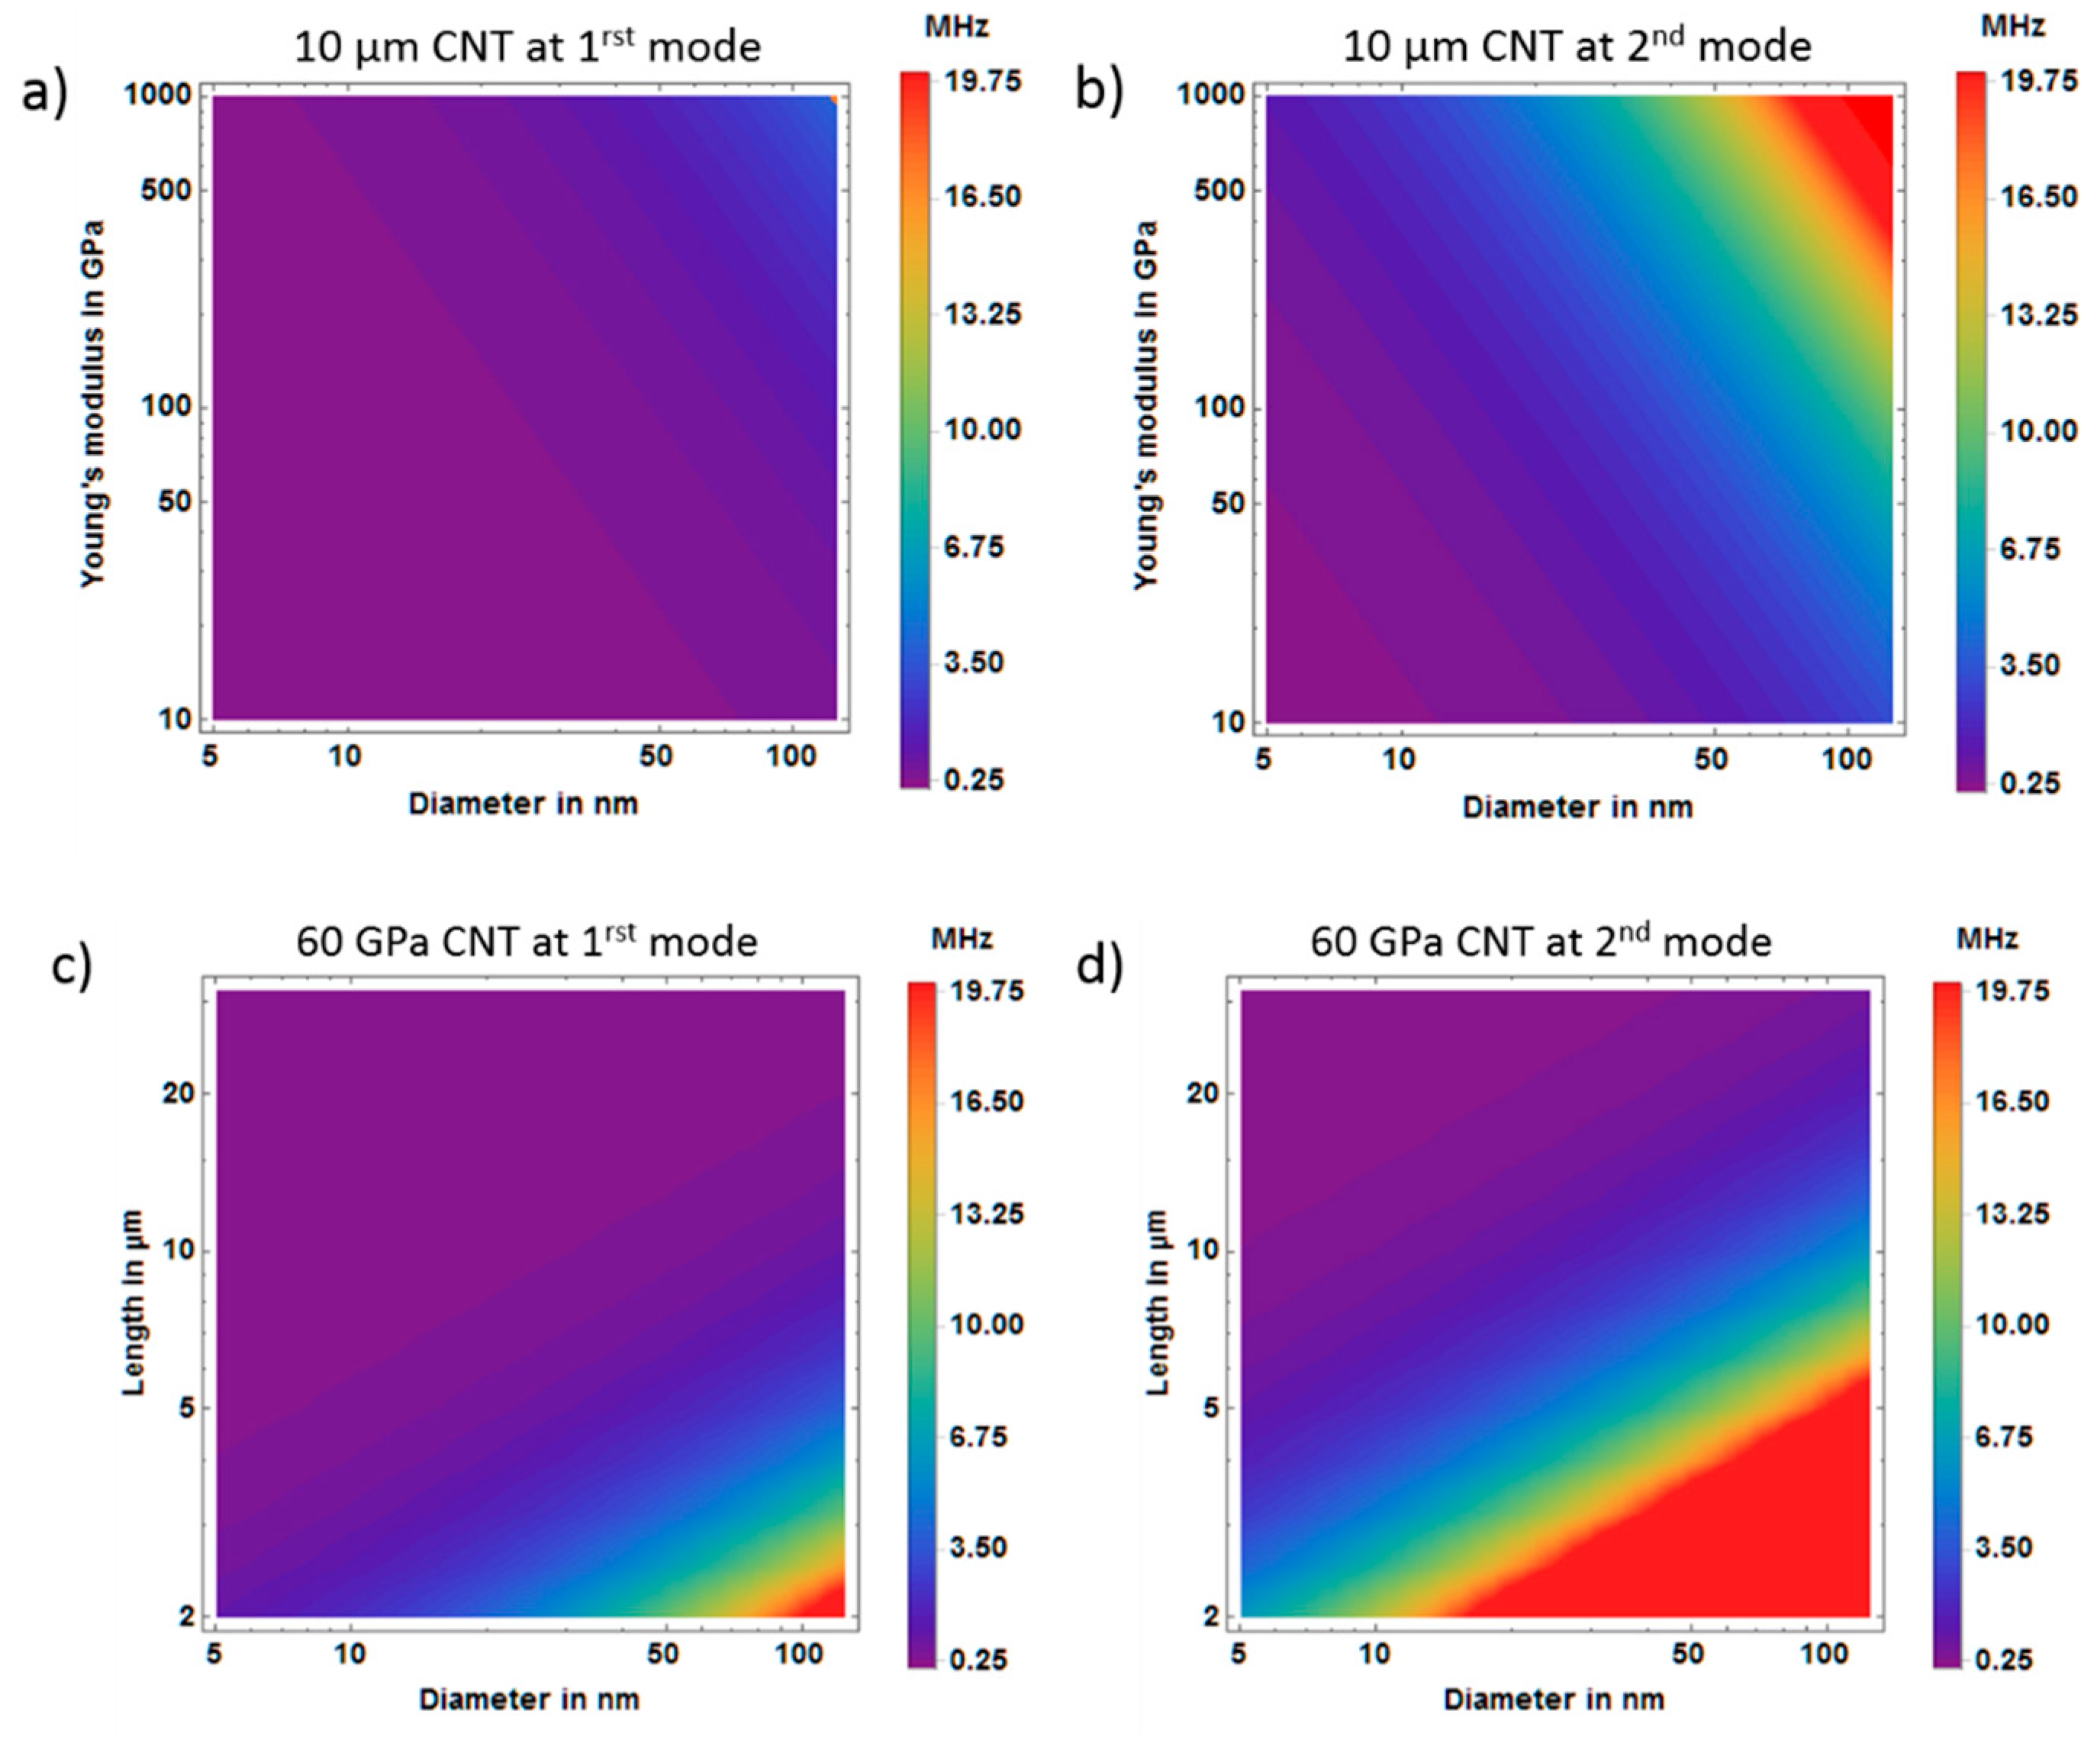
Prior to fiber resonance search with DySEM, the frequency range to study was estimated with the help of two-dimensional parameter plots. Examples for first and second mode resonance of a fiber with a length of 10 µm is given in
Figure 5a,b. The expected resonance frequencies were plotted in dependence on Young’s modulus
of the material and on the outer fiber diameter
. Likewise, plots for selected values of the Young’s modulus, here
= 60 GPa, were generated by plotting fiber length versus diameter in
Figure 5c,d. The resonance frequency range was color coded.
Since most of the evaluated MWCNTs presented lengths around 10 µm with diameters above 50 nm, a piezoelectric crystal with a resonance frequency of 12 MHz could be operated mostly below its resonance for detecting first fiber resonance modes. For a free-standing fiber in focus, the length and thickness were roughly determined to estimate the frequency of its first resonance. For this first estimation, a modulus of 60 GPa was assumed. For the resonance search, frequency sweeps were performed from lower to higher frequencies around this frequency. Once the signal of first resonance mode was identified by LIA analysis, the bending modulus of the fiber was calculated to predict the frequency of the second mode to adjust the sweeping range accordingly. The results are given in Table 2.
3. Results
3.1. Determination of Nanotube Dimensions
Although in the technical report the NM-401 was characterized as straight-wall MWCNT material [
15], the fiber samples used in this work were not completely straight but slightly curved. This made it a challenge to obtain accurate dimensions by SEM metrology, especially of length
. Since the calculation of the bending modulus
from Equation (4) depends on the 4th power of length
, it is important to determine its value as exact as possible to minimize errors of the bending modulus values in Equation (5). For this task, the ultra-high-resolution SEM SU8230 with in-lens detector was used. Its images however only showed the apparent fiber length in a 2-dimensional projection. For a curved fiber oriented in 3-dimensional space, a second, orthogonal view was required to determine the true fiber length, which is defined as the distance from the fixation point of the fiber on the polymer film to the end of its free tip. The two orthogonal projections were obtained by tilting the sample holder by approximately ninety degrees so that the fiber could be imaged from the side.
Figure 6 shows examples of the two orthogonal projections for a MWCNT. Additional images of the length measurement are provided in the
Supplementary Materials (Figure S1a and S1b).
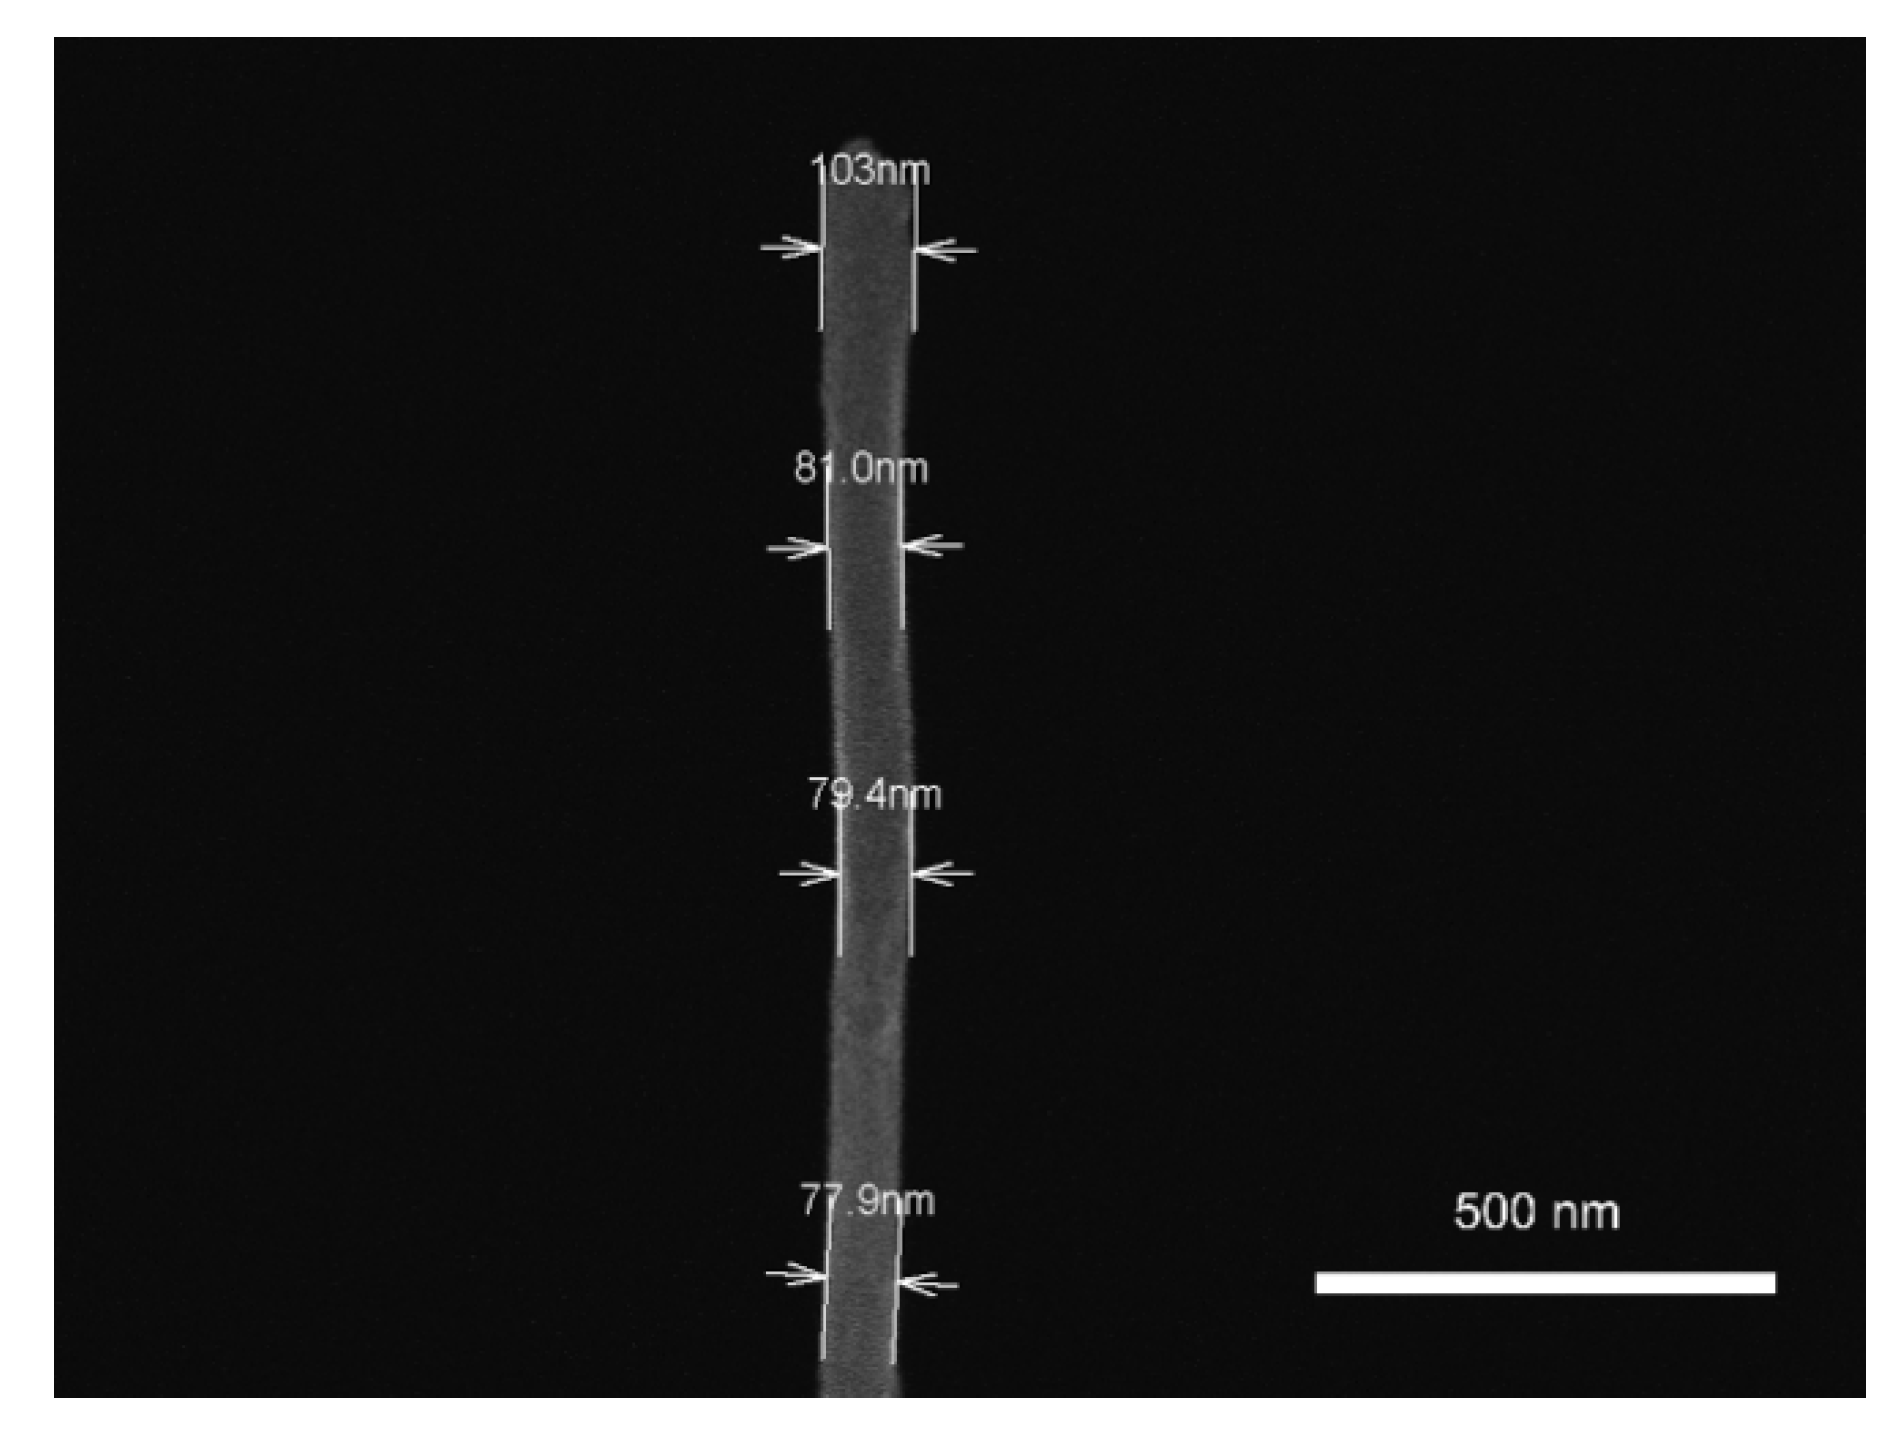
The measurements of the MWCNTs diameter were made on the course of the experiments with the ultra-high-resolution SEM SU8030 (Hitachi), using the fiber width measurement tool from the SEM software. The diameters were determined from the mean value of four selected points along the length of the nanotubes, since their thickness was irregular (
Figure 7). The accuracy of these measurements is as important as the accuracy in determining correct values of the length because the flexural rigidity (
) is directly dependent on the diameter to the 4th power (Equation (1)). Therefore, imprecise measurements of the diameters would impact considerably on the reliability of the rigidity data collected.
The MWCNTs presented an average diameter of 98 nm, while the NM-401 from the European JRC were characterized with an average diameter between 70 and 80 nm. Thicker nanotubes are obtained when the catalytic chemical vapor deposition is made at higher temperatures (from 750 °C on), as described by Kumar and Ando [
41]. However, since we did not have access to the technical details through which our samples were produced, it is not possible to confirm why the MWCNTs tested were considerably thicker than the NM-401 specified.
3.2. Fiber Clamping
For fiber length measurement and interpretation of resonance frequencies, it was important to localize the immobilization point of a fiber where it penetrates the PEDOT:PSS layer. For fibers at rest, the footing point was not always easy identifiable by SEM inspection. Fiber resonances helped to track the fiber down to the immobilization point, where no displacement must be observable. For high accuracy measurements, improper clamping to the piezo actuator must be ruled out. Shaky movements of only loosely attached fibers do not allow interpretation in the Euler–Bernoulli framework.
The electrical conductivity of the PEDOT:PSS polymer was found to be sufficient for electrostatic precipitation and SEM imaging. It showed good wetting behavior for CNTs [
42], as is required for embedding and mechanical fixing the fiber base. The rigidity of the PEDOT:PSS film affects the damping of fiber oscillations, resulting in reduced amplitudes by dissipation for a soft polymer. Mechanical properties of PEDOT:PSS were still satisfactory when dried. With 1.7 GPa, PEDOT:PSS reached only about 50% of the stiffness of commercial epoxides [
43,
44]. The mechanical loss tan δ (the ratio between the loss modulus
E″ and the storage modulus
E′ for polymers) of PEDOT:PSS for low frequencies at room temperature is 0.06, before the polymer is completely dried under ambient conditions. Assuming that adsorbed water is removed in vacuum, tan δ will drop to 0.03 [
45]. The highest loss factor of tan δ = 0.14 was observed at 65 °C and can be considered as the worst case under wet conditions. Heating the surface and the fiber during beam exposure could remove water and lower tan δ further to a value of 0.04, which is not high, but still the intrinsic loss in the polymer contributes to the damping in the system.
Using a more rigid metallic material could reduce such dissipation of the mechanical vibration. A low melting point alloy (Field’s metal) composed of bismuth:indium:tin (32.5:51:16.5 wt % with a melting point of 62 °C was used for fixing free standing microscale carbon fibers and led to measurable resonances. The high electrical and thermal conductivity together with high mechanical stiffness of alloys could be beneficial imaging fiber oscillations with SEM.
3.3. Bending Modulus Results from the Literature
A methodology similar to the one used in this work to determine the dynamic bending modulus
by measuring resonance frequencies of CNTs has been studied before, cf.
Table 1. Poncharal et al. presented a technique to detect the resonance frequencies of MWCNTs synthesized by arc-discharge in the transmission electron microscope (TEM). By applying an alternating voltage to a CNT fixed to an electrode, the fiber was attracted/repelled by a second electrode and stimulated to oscillate. This way, resonance frequencies could be determined, and the bending properties analyzed. In this and similar studies, it was observed that thinner MWCNTs tend to exhibit larger modulus values (1000 GPa), whereas thicker nanotubes exhibited considerably smaller modulus values (200 GPa) [
25,
27,
28]. With the same technique mentioned above, Gao et al. reported the investigation of the mechanical properties of MWCTs synthesized by cCVD. In their work, the dynamic bending modulus for MWCNTs with diameters between 30 and 70 nm were considerably smaller (30 GPa) than the values described by Poncharal et al. This difference in the bending modulus was associated by the authors to the diameter and the CNTs synthesis method. Lower bending modulus values were observed also for MWCNTs synthesized by cCVD tested with atomic force microscopy, SEM and laser Doppler vibrometry. These techniques were combined either with force-versus-deflection testing (denoted as “F vs. δ“ in
Table 1), where a load is applied on the tip of the nanotube and the displacement is measured as the load increases to derive the static bending modulus
, or with a typical tensile test, in which the nanotube was fixed on both extremities and pulled out in opposite directions until fracture to quasi statically derive the Young’s modulus
. The authors associated the low modulus values to the significant presence of defects in the nanotubes structure, the misalignment of the planes and lower degrees of crystallinity for MWCNTs originating from cCVD. However, it appears important to further deepening the understanding of the mechanical properties of MWCNTs synthesized by cCVD, since such materials are most relevant for industrial applications.
3.4. Bending Modulus Results of this Work
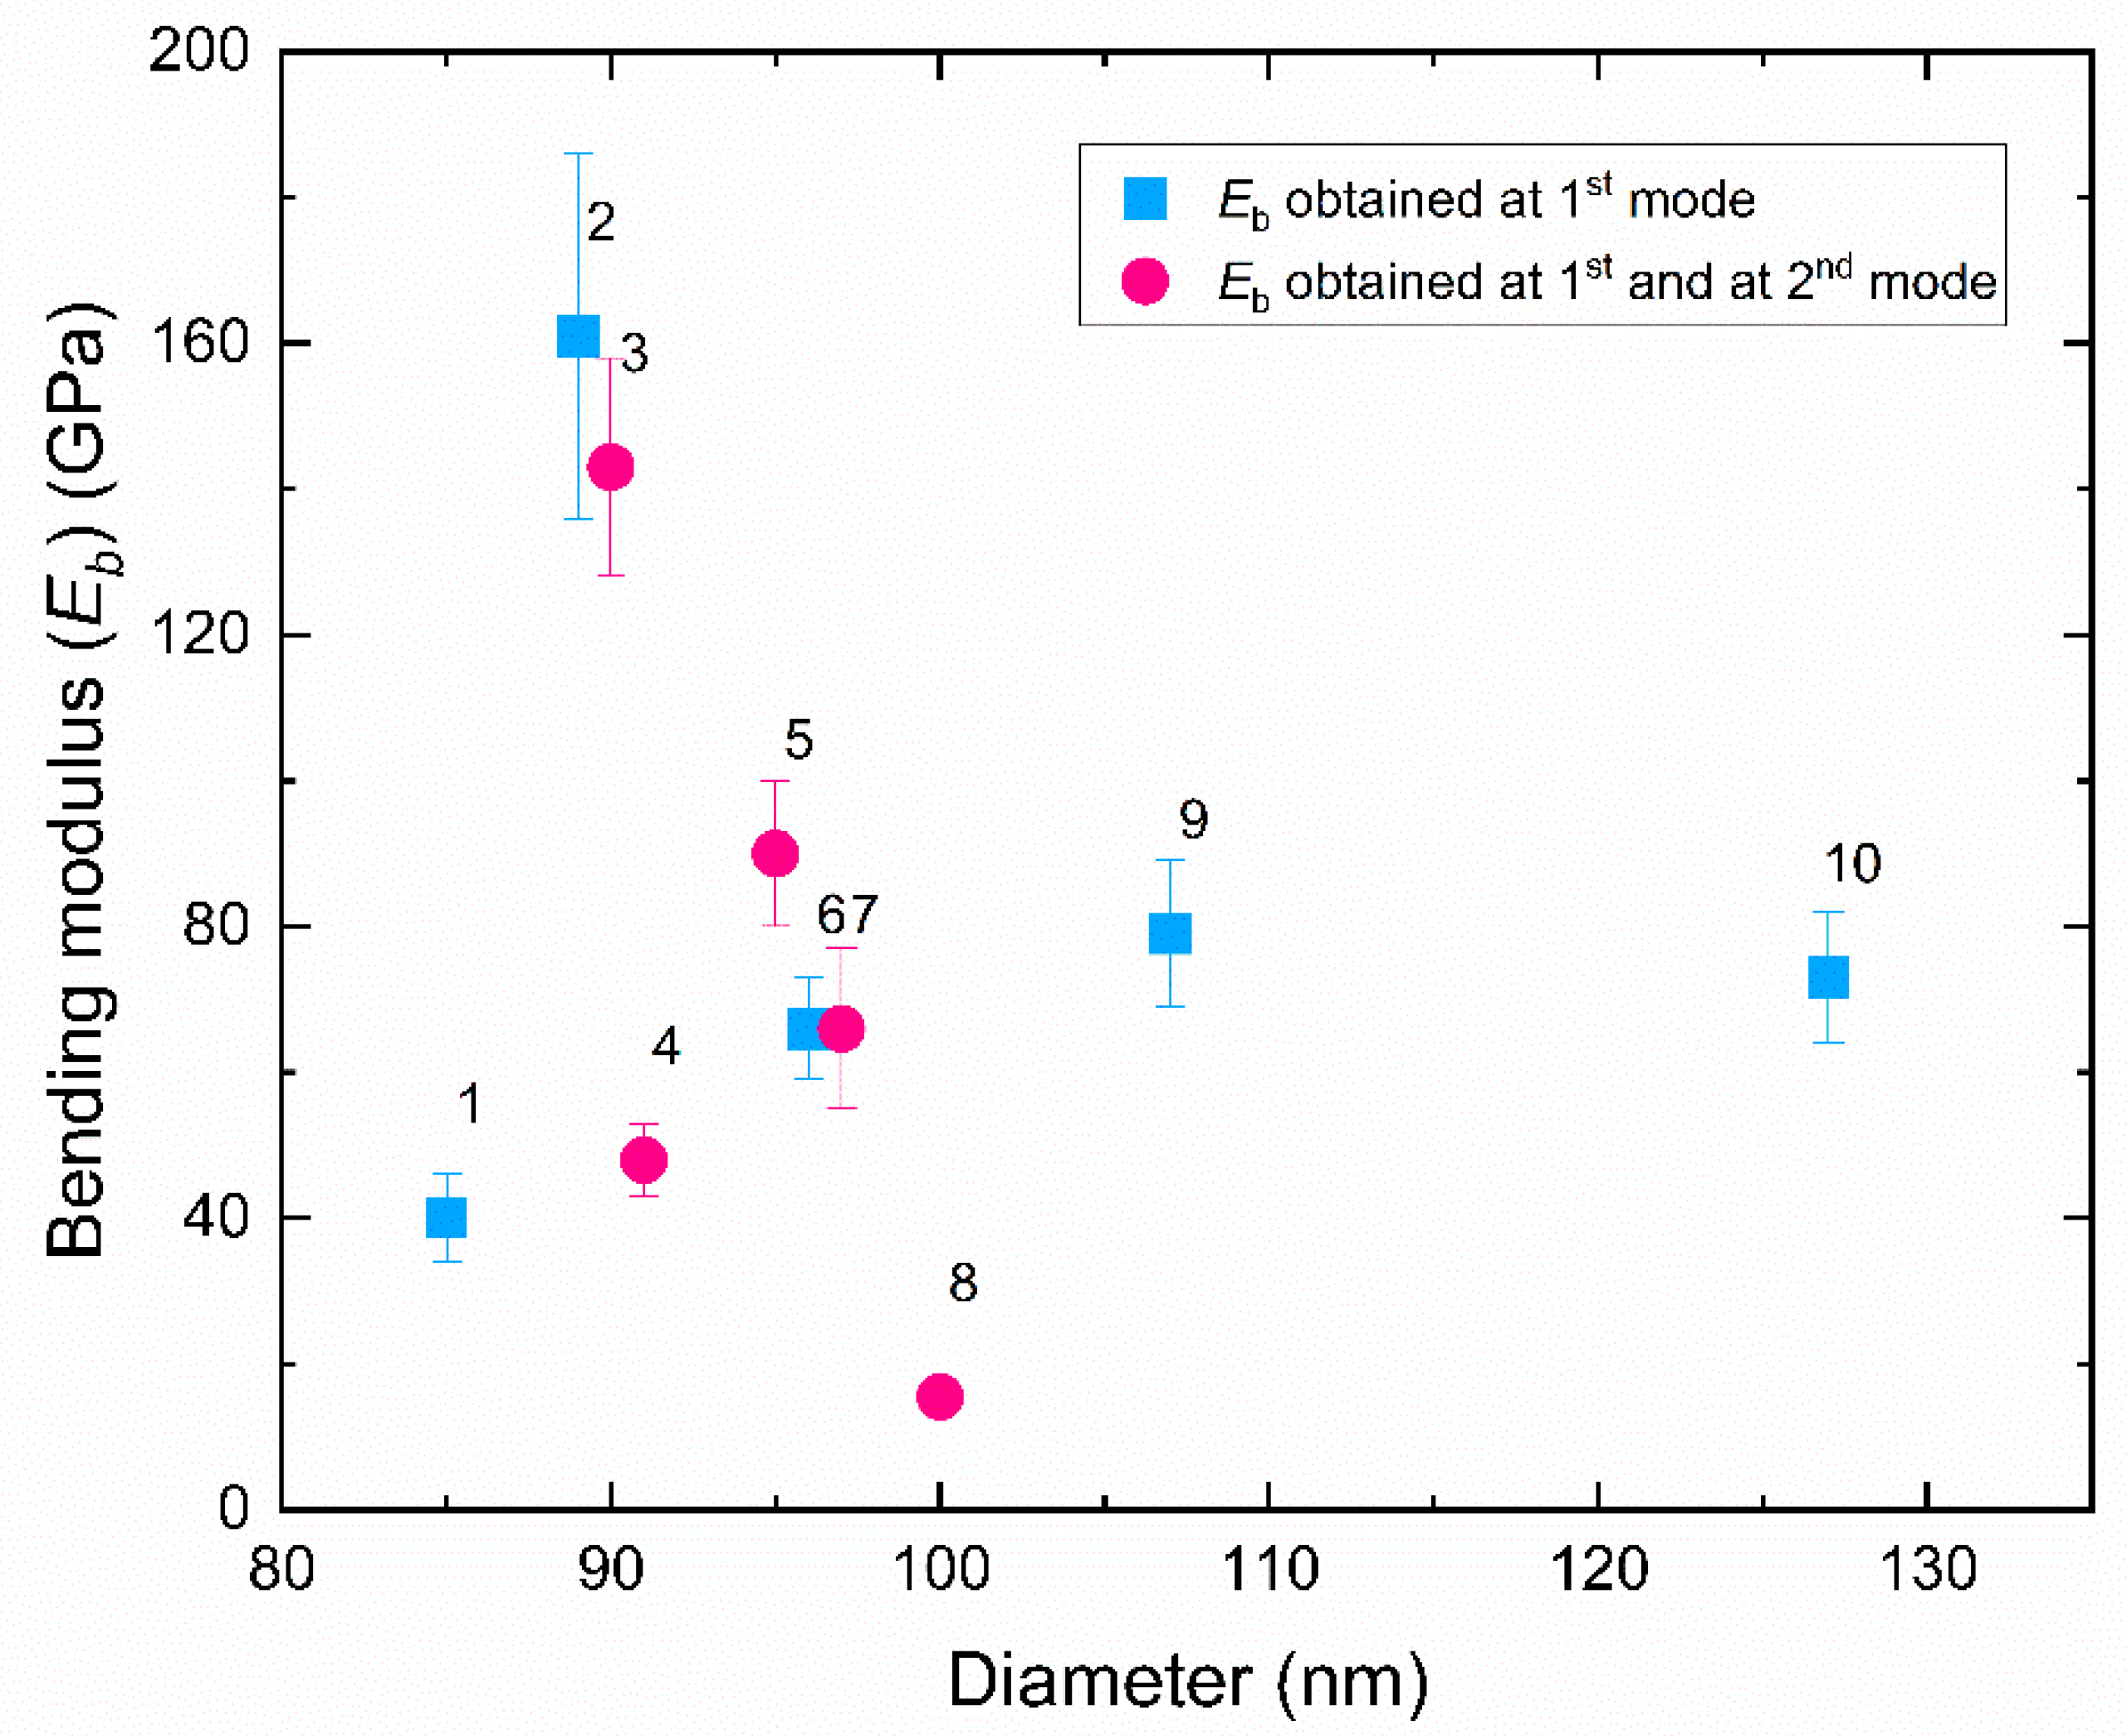
For a set of MWCNTs, both their individual geometric properties and their resonance frequencies could be determined. The results are presented in
Table 2 and in
Figure 8.
The nanotubes studied in this work exhibited bending modulus from 15 to 161 GPa, which are in the range of bending modulus values reported by other authors for MWCNTs synthesized by cCVD (
Table 1). Additionally, for two of the nanotubes tested (CNTs 2 and 3), we found
values above those reported in previous works.
In previous studies, differences in bending modulus values have been related to the fiber diameter [
25,
38,
53], while other authors have associated the presence of defects in the nanotube structure, heterogeneity in shape or mass distribution to low bending modulus values, especially for MWCNTs produced by chemical vapor deposition [
50]. For the nanotubes tested in this work no correlation between the thickness or the length of the nanotube to the value of the bending modulus was observed, since for the thinnest nanotubes, low and high bending modulus were obtained and the same occurred for the shortest nanotubes. Compared to the values of bending modulus found in this work, a higher bending modulus has been reported for MWCNTs produced by arc-discharge synthesis [
25,
46,
47,
48,
49]. However, a range of values similar to those found in this work, was found for nanotubes produced by catalytic chemical vapor deposition, as mentioned previously [
46,
50,
51,
52]. For such differences in bending modulus values, several structural and morphological characteristics were made responsible, including structural inhomogeneity, the presence of defects, curved vs. straight fiber shape, non-uniform mass distribution and nanotube dimensions. In [
28], Wang et al. found a remarkably low bending modulus of 2.2 GPa for a MWCNT that, although it was produced by arc-discharge, exhibited volume defects along its body, impairing considerably its stiffness. In [
54], the authors showed that volume defects and attached masses affect the bending modulus less or more, depending on the position of them on the nanotube length and also argue that curly shapes also contribute to the decrease of the stiffness. Jackman et al. [
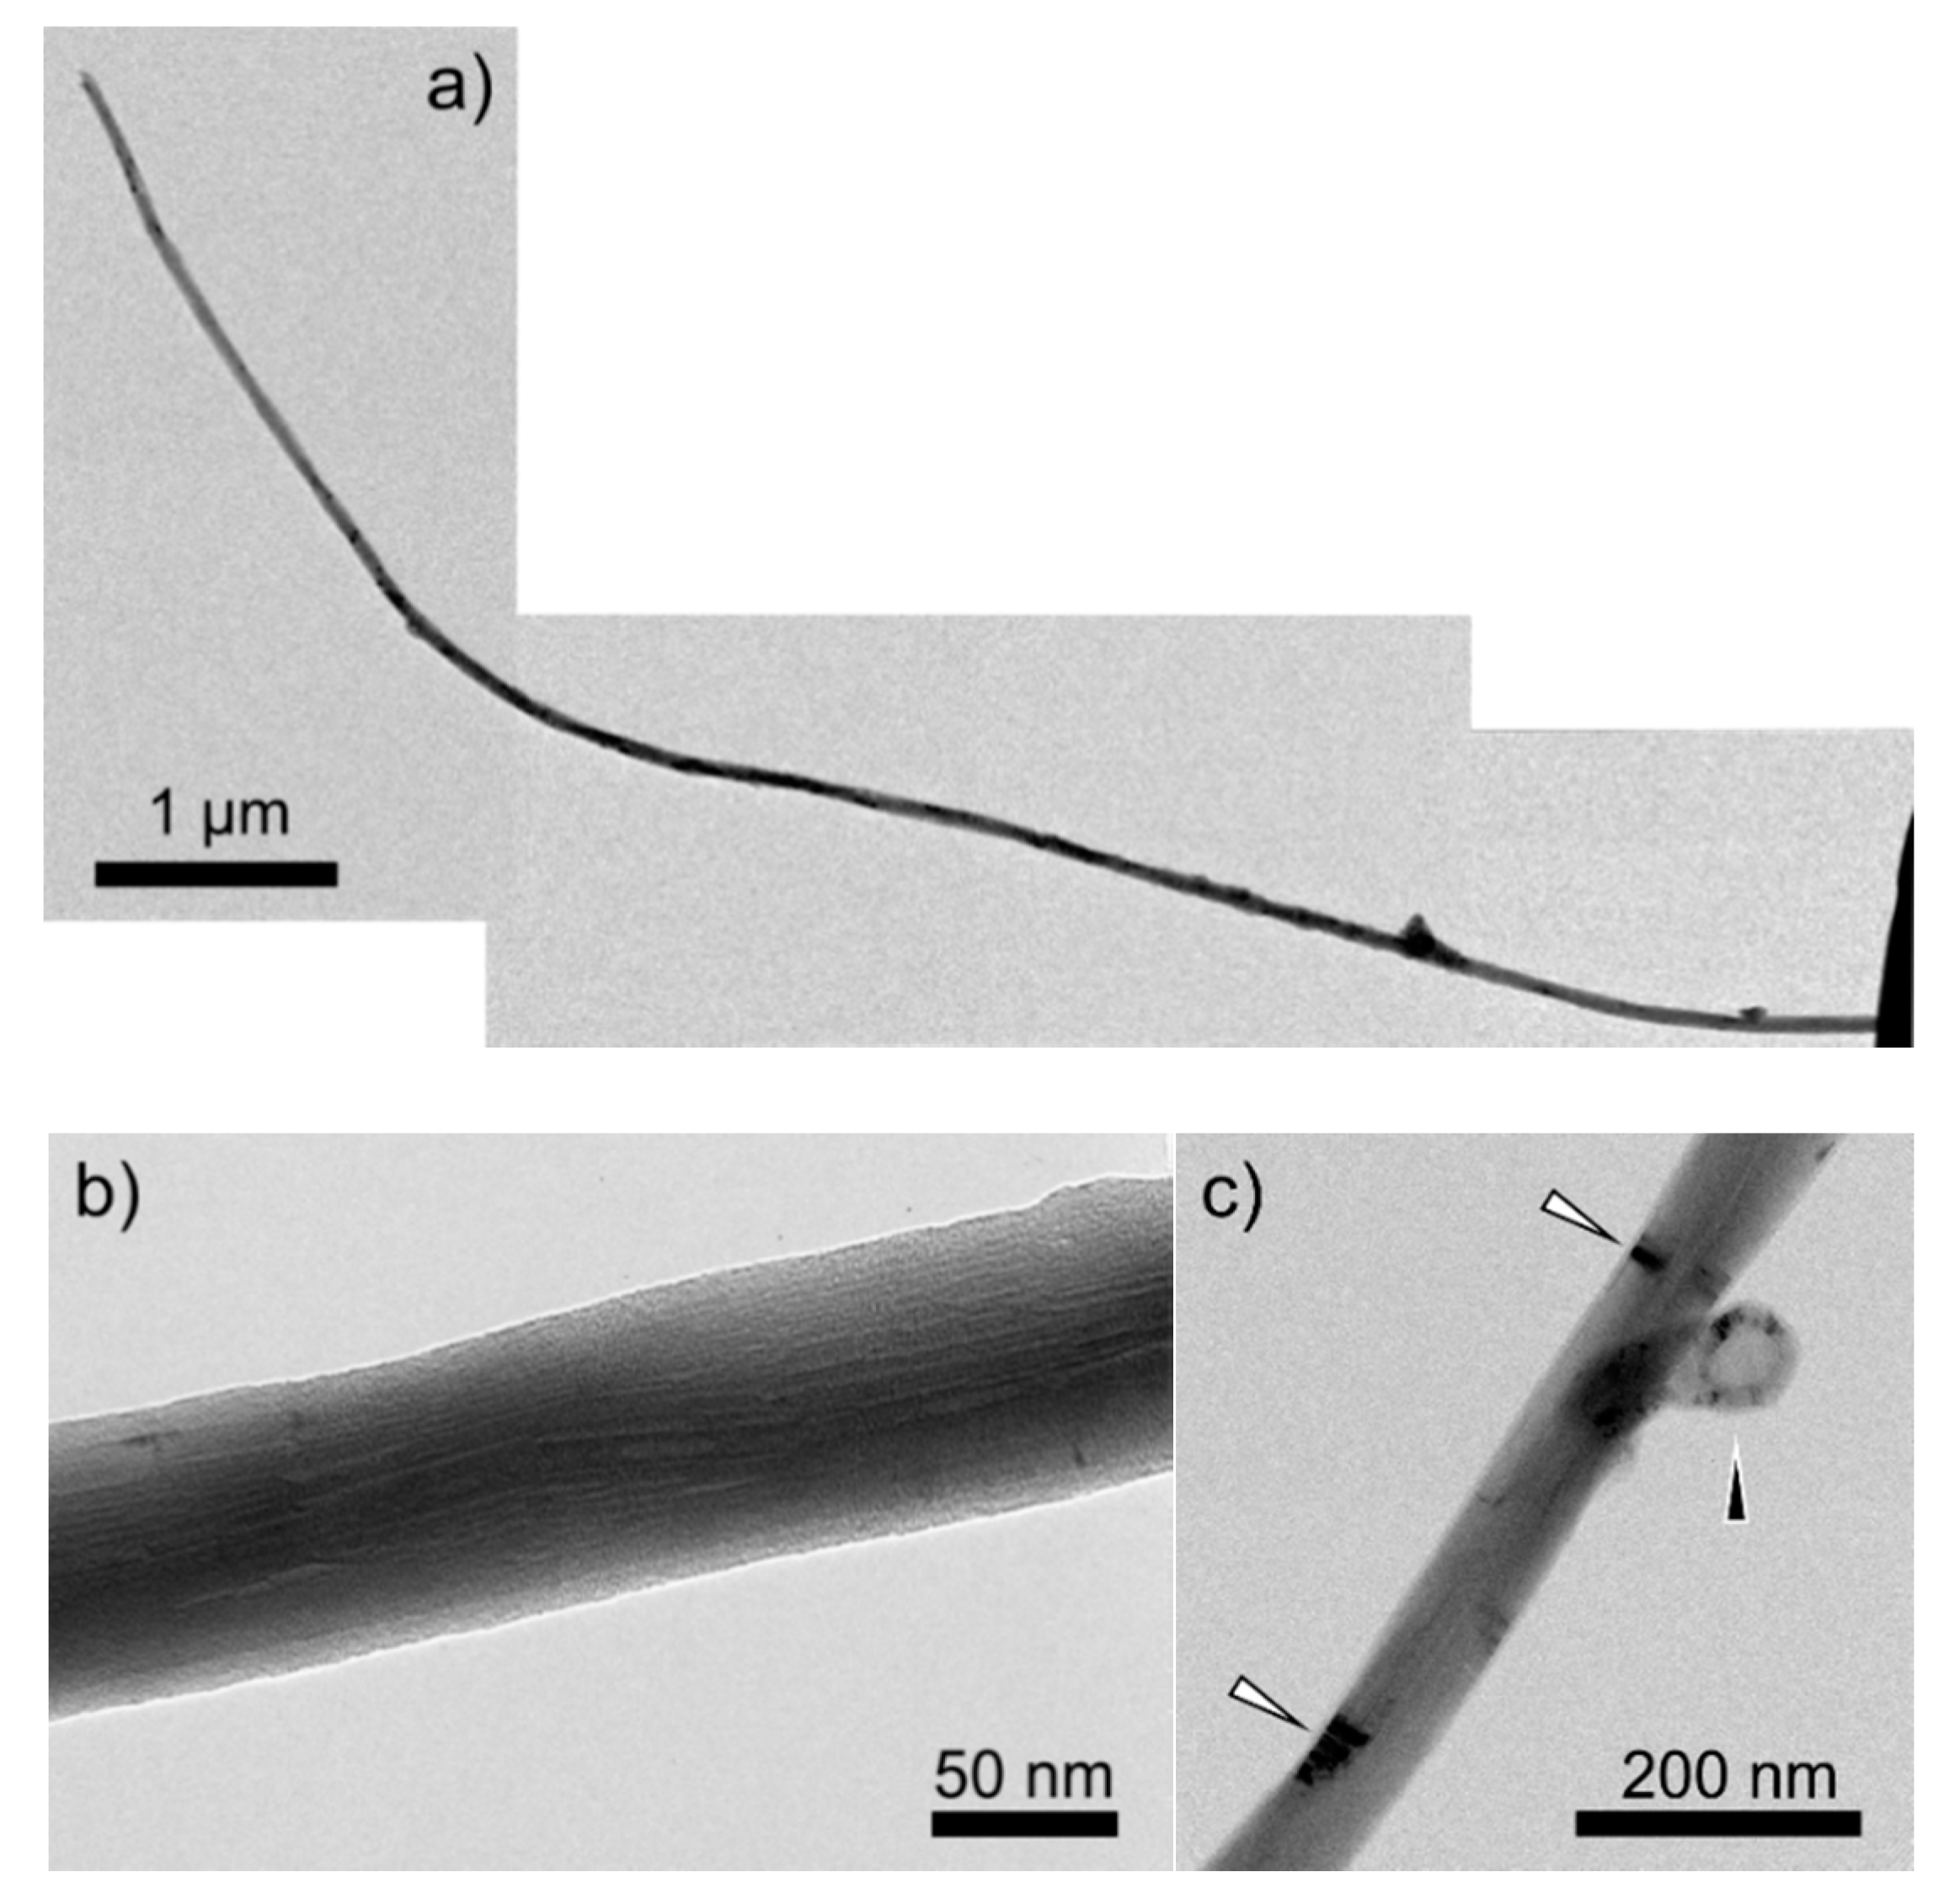
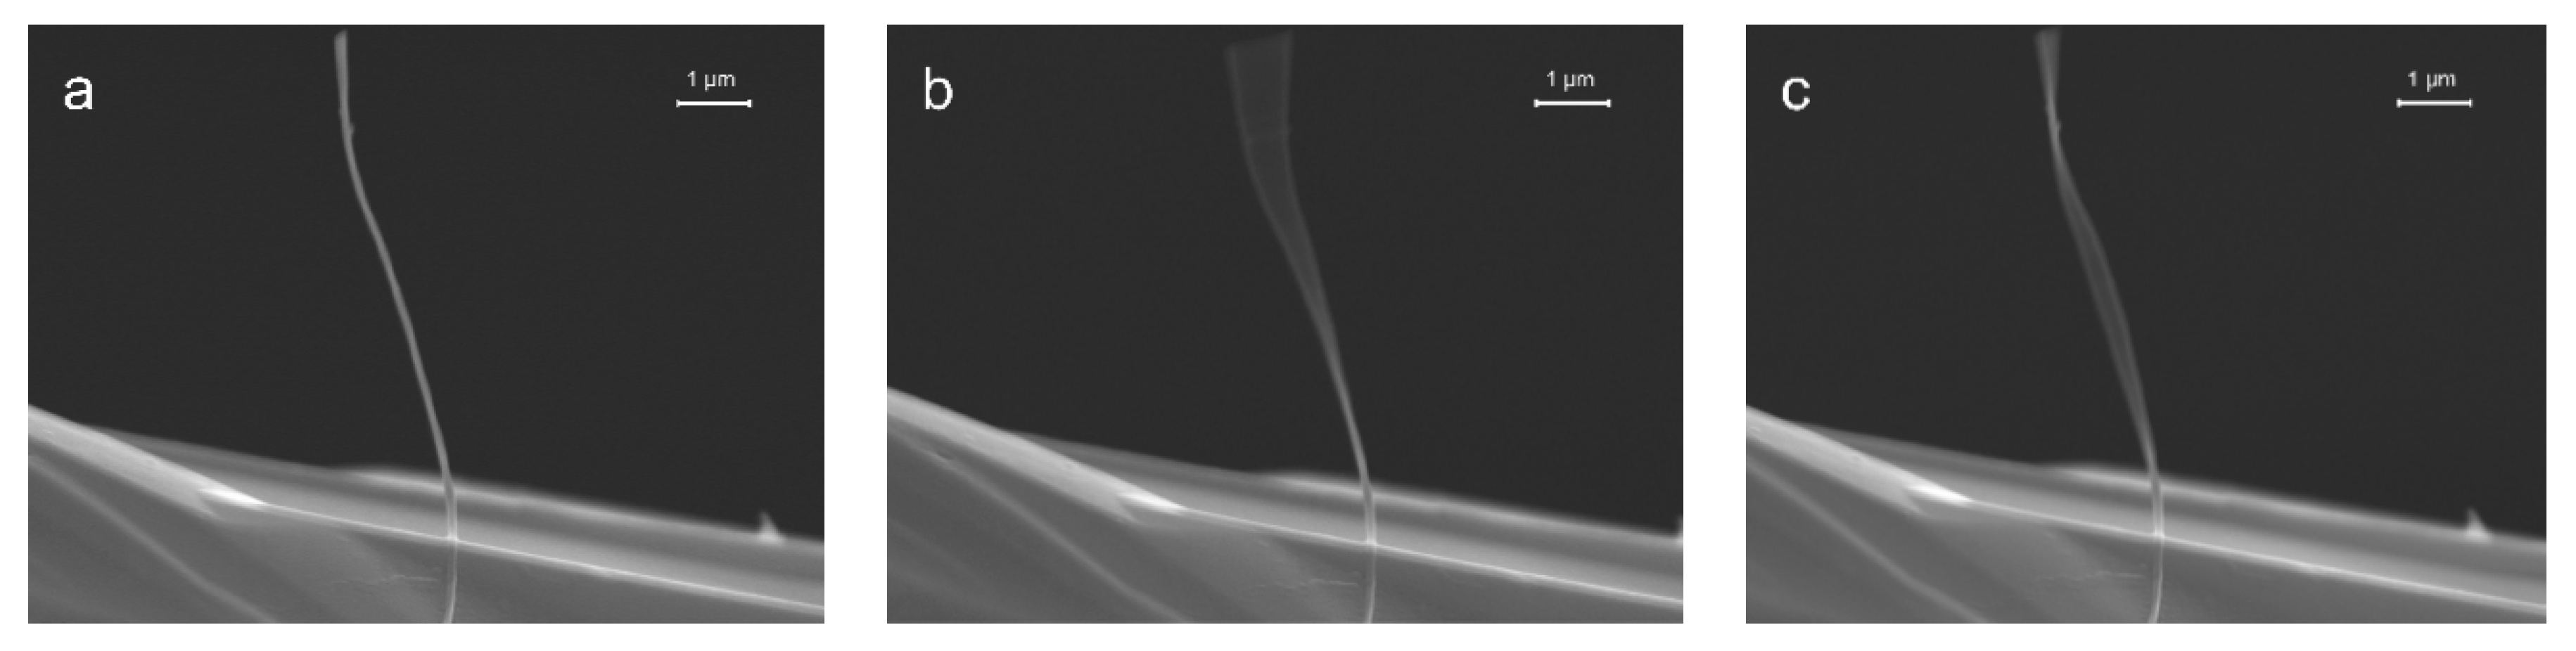
50], compared the bending modulus of MWCNTs produced by arc-discharge and cCVD and associated the distinct bending behaviors of the two types of nanotubes to the difference in crystallinity, which is higher for arc-discharge produced MWCNTs, granting more rigidity to these tubes. As can be seen in the bright field TEM images of different nanotubes from the same batch of the ones used in this work (
Figure 9), our nanotubes had a wavy form (
Figure 9a) and presented defects such as misalignment of walls (
Figure 9b), branching (see arrow pointing up in
Figure 9c) and a disturbed structure (indicated by the dark areas, e.g., marked by oblique arrows in
Figure 9c). These aspects modify the rigidity of the fibers, since they generate weak points and are present in different ways from fiber to fiber, which explains the assorted values of
.
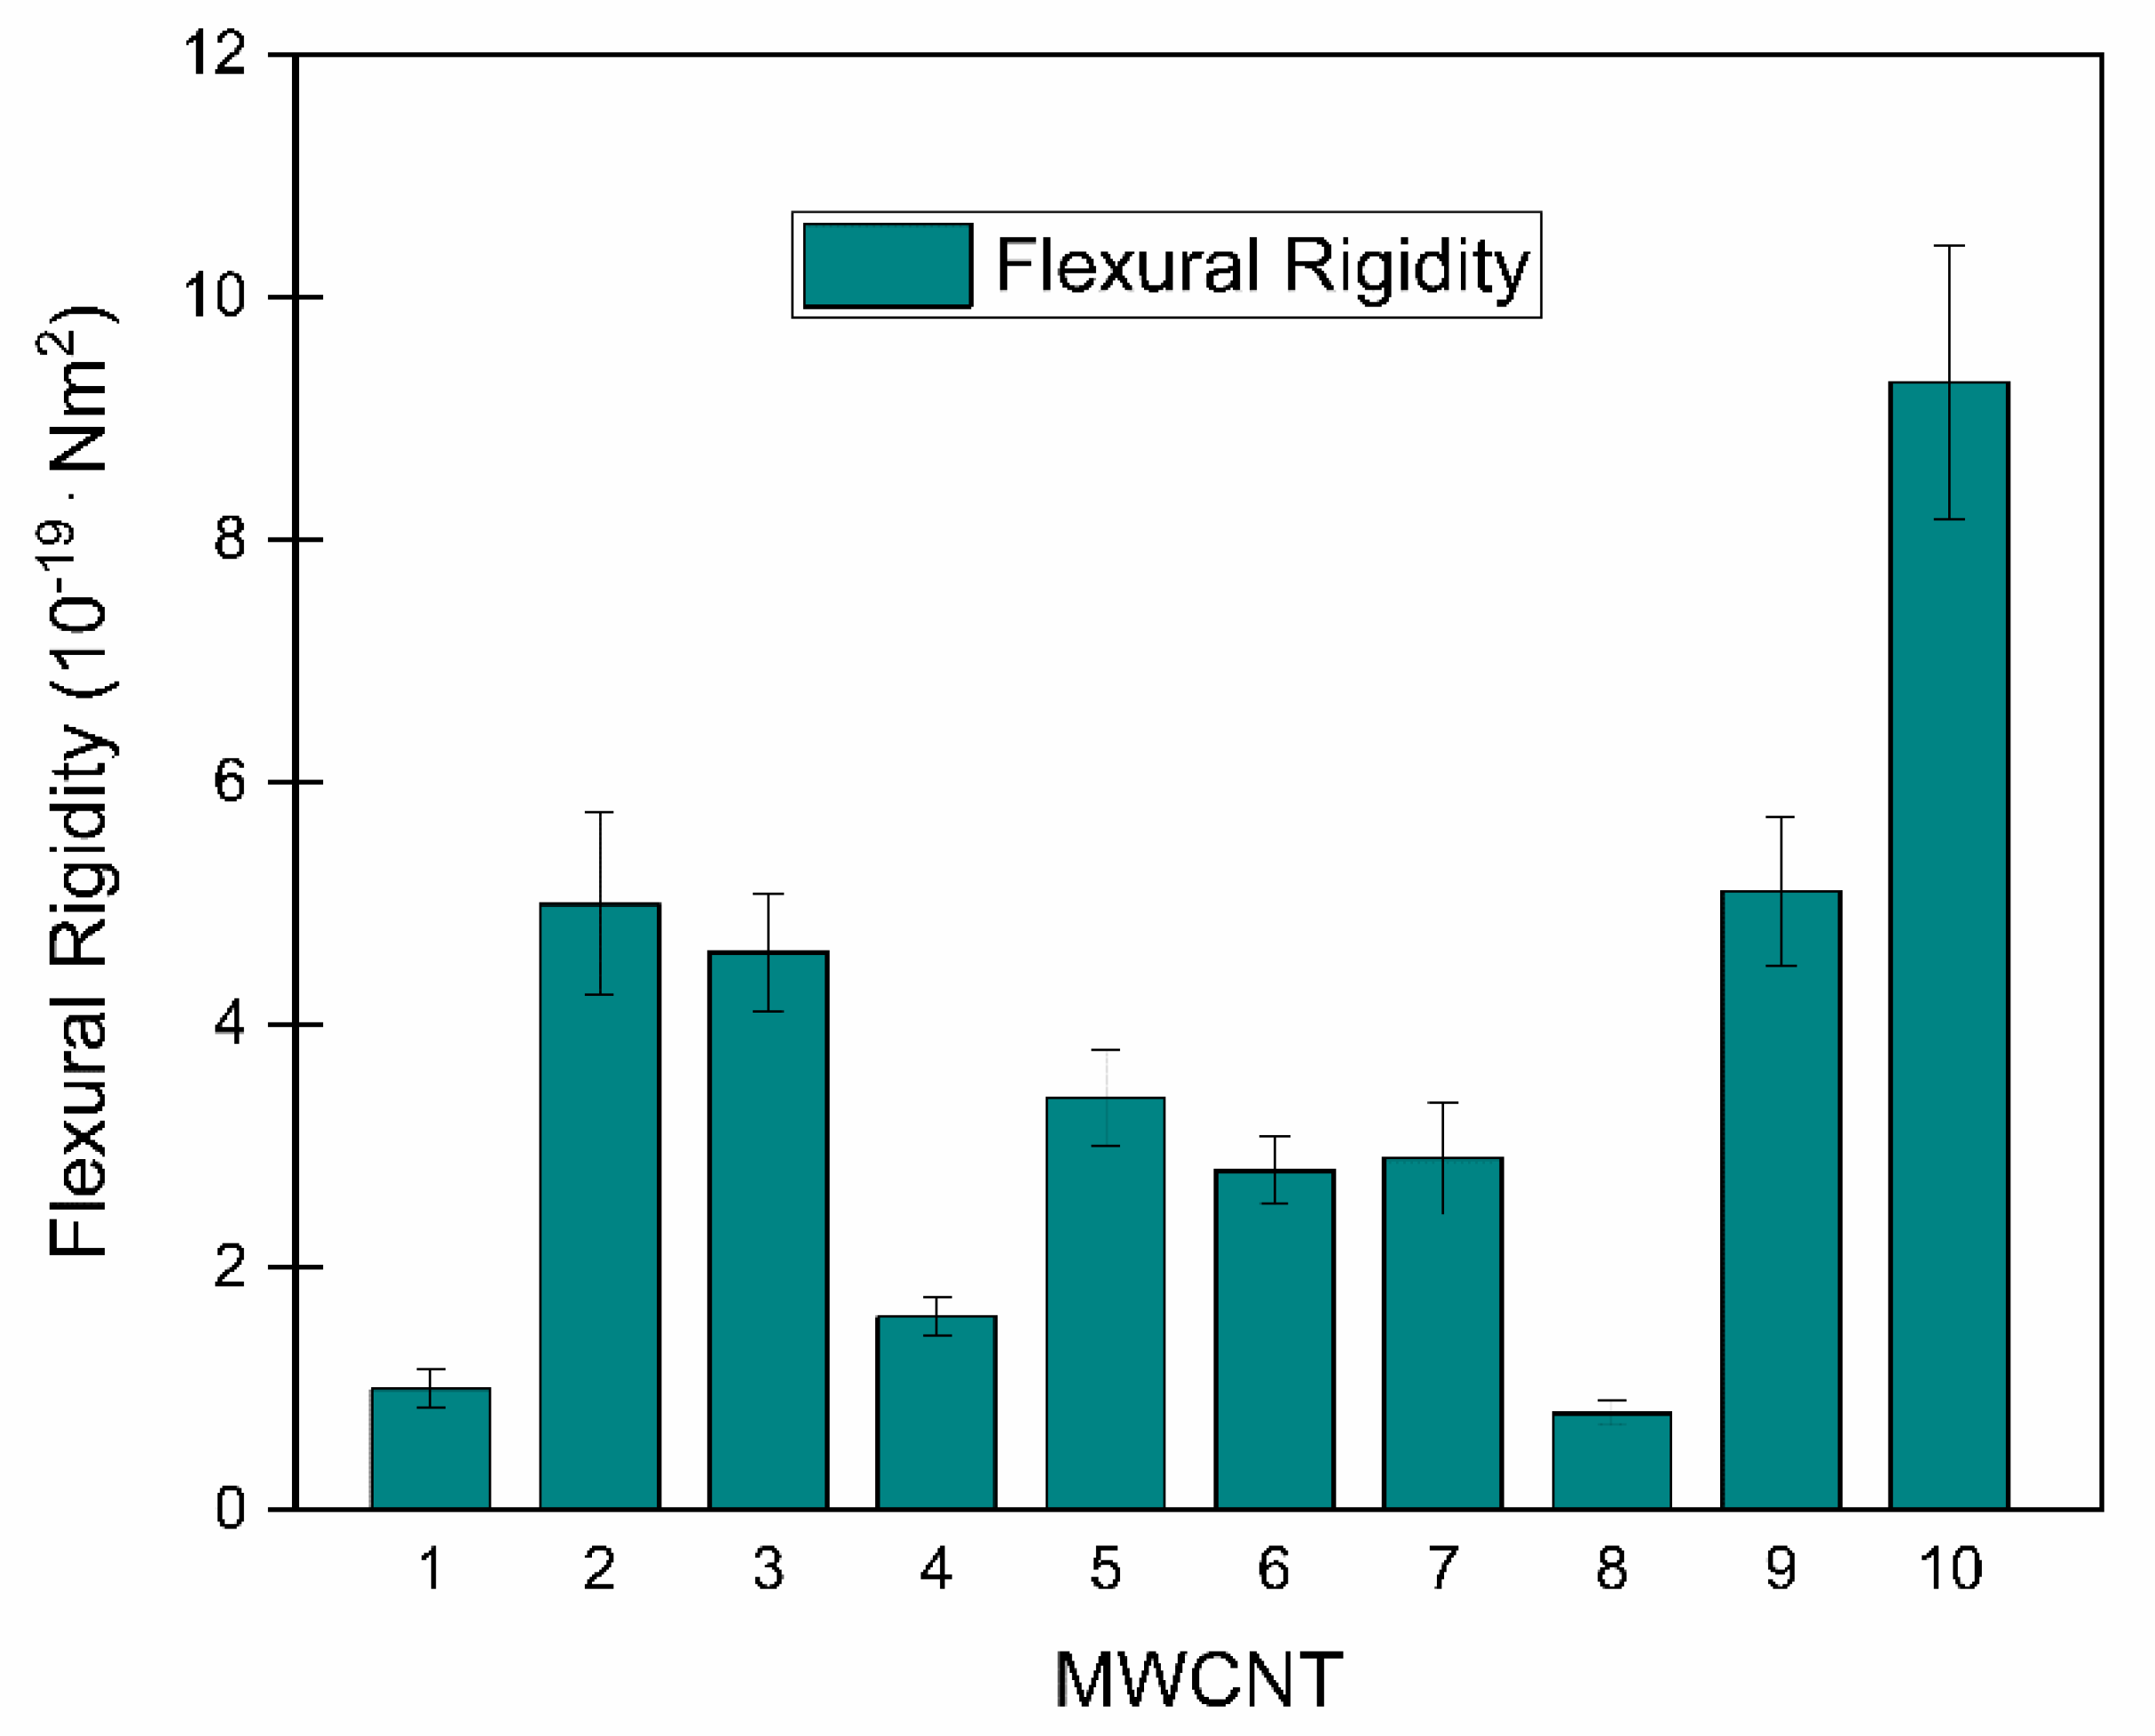
3.5. Flexural Rigidity
As described previously in this article, the fiber toxicology paradigm is associated with the rigidity of nanofibers and according to [
55], the flexural rigidity threshold for a macrophage to be able to perform the complete phagocytosis of a biopersistent nanofiber is
. This means that fibers presenting a flexural rigidity lower than
are classified as flexible and harmless, fibers with rigidity in the order of
could be either flexible or rigid and fibers with rigidity above
are rigid and pose hazard to macrophages.
The flexural rigidity of the MWCNTs studied in this work was determined according to Equation (1), after the calculation of their bending modulus. In the graph (
Figure 10), the flexural rigidity is displayed from the thinnest to the thickest nanotube, just as it was arranged in
Table 2. It was observed that the rigidity does not increase uniformly with the increase of the diameter, which can be explained by the variations encountered on the bending modulus values. However, since the flexural rigidity scales with the 4th power of the diameter, nanotubes that presented low values of bending modulus, but had the highest diameters (MWCNTs 9 and 10) turned out to be the most rigid ones, followed by nanotubes 2 and 3, that had in fact the highest bending modulus. The MWCNTs 9 and 10 also presented flexural rigidity in the order of
and therefore can be classified as rigid and potential agents of frustrated phagocytosis.
Thus, frustrated phagocytosis might result in very stiff or very thick nanofibers, provided their length exceeds the critical 5 µm. This exemplifies that flexural rigidity is considered a more accurate parameter to assess potential fiber hazards than diameter or bending modulus alone. To group the rigid and flexible fibers by the diameter values though, one could define a thickness of 89 nm as the threshold of safety for fibers with an maximum of 160 GPa, which corresponds to the type of MWCNTs used in this work. This means that the nanotubes thicker than 89 nm are defined as rigid and harmful and the ones with diameters smaller than 89 nm are flexible and harmless.
3.6. Effects of an Extra Mass on the Body of the Nanotube
As discussed above, highly varying and especially low values of
found for MWCNTs produced by CVD are possibly caused by the heterogeneity of the morphology of the fibers. The presence of defects can weaken the bending modulus of a fiber. Additionally, a non-uniformity of mass distribution along their bodies (
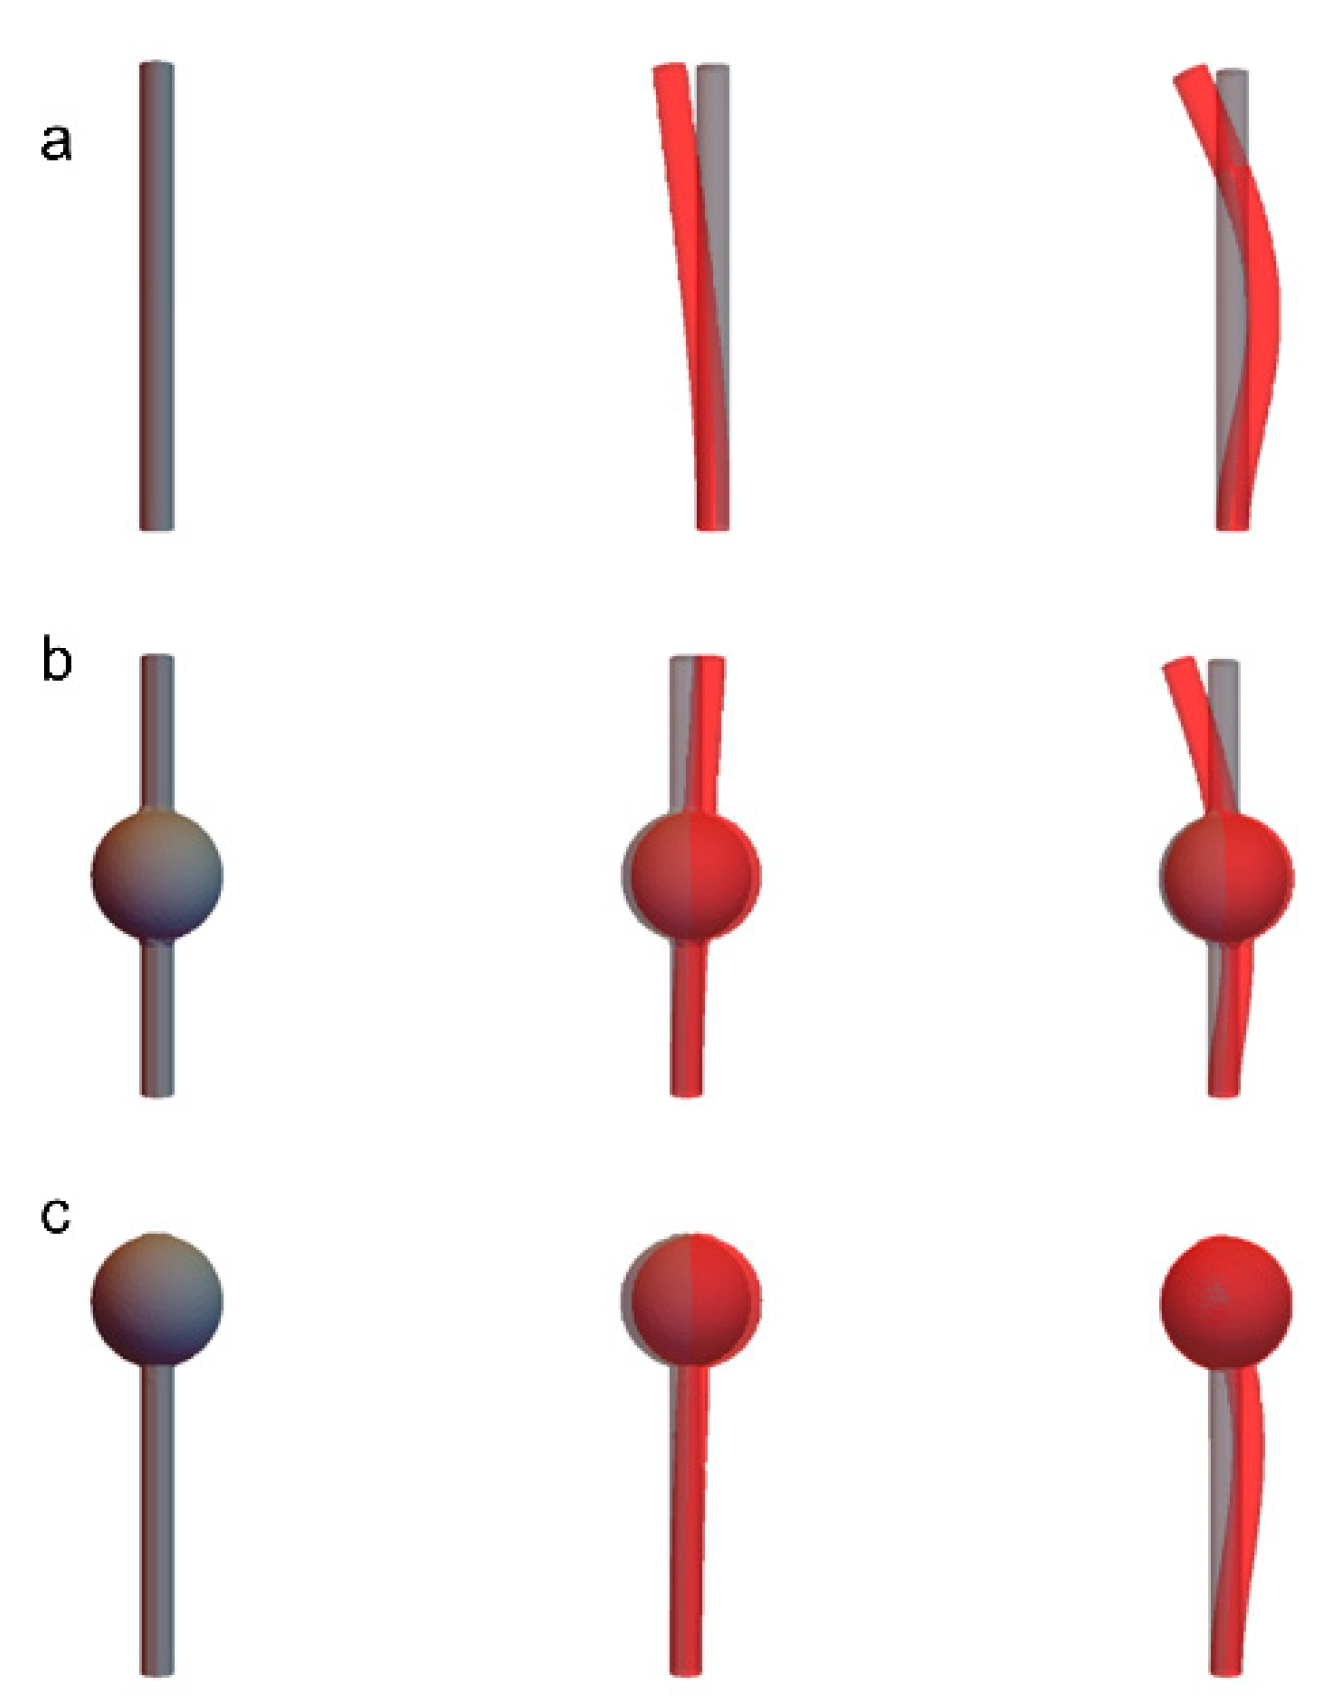
Figure 9a) and accumulations of additional masses at particular positions along the body of the fiber are considered critical for applying the continuum mechanics theory of Euler–Bernoulli. As Equation (3) is based on a perfect uniform and straight beam, it is important to analyze the consequences of imperfections of the shape on the resonance frequencies and consequently on the bending modulus. Therefore, a finite elements simulation of a hypothetical fiber was performed to evaluate how the presence of a spherical mass would influence the vibration behavior of carbon nanotubes.
For such simulation, a carbon nanotube 1 µm long and 75 nm thick was considered. The bending modulus was fixed at 60 GPa and the attached matter was simulated in the middle and at the tip of the tube (
Figure 11b,c, respectively). The simulation showed that the vibration behavior of a nanotube with an extra mass is more affected at the first mode than at the second mode. This is attributed to the fact that the influence of extra masses depends on the dynamic shape of the vibrating fibers, which again depends on the type of excited mode. This is an important reason why it is necessary to identify further modes. This can also be seen for the case that an additional mass at the tip of the tube decreases the resonance frequencies at the first and second modes considerably more than when it is positioned at the center of the nanotube. An additional mass on the tip reduces the resonance at the first mode by 61%, while a mass in the middle of the tube reduces the resonance by 28% (
Table 3). This occurs because, during the excitation at the first mode, most of the vibration amplitude happens at the tip, thus the more distant to the tip the extra mass is, the higher are the chances that this mass is positioned in an area where originally the amplitude of vibration would be very low, or even null. For the excitation at second mode, the extra mass attached at the middle is possibly also in a region of almost null amplitude of vibration, if it is close to a node. This was also shown in the simulation, in which the values of resonance frequency at the second mode for a nanotube with no imperfections and a nanotube with an extra mass in the center of the tube are practically the same.
3.7. Energy Dissipation in the Excitation Tests
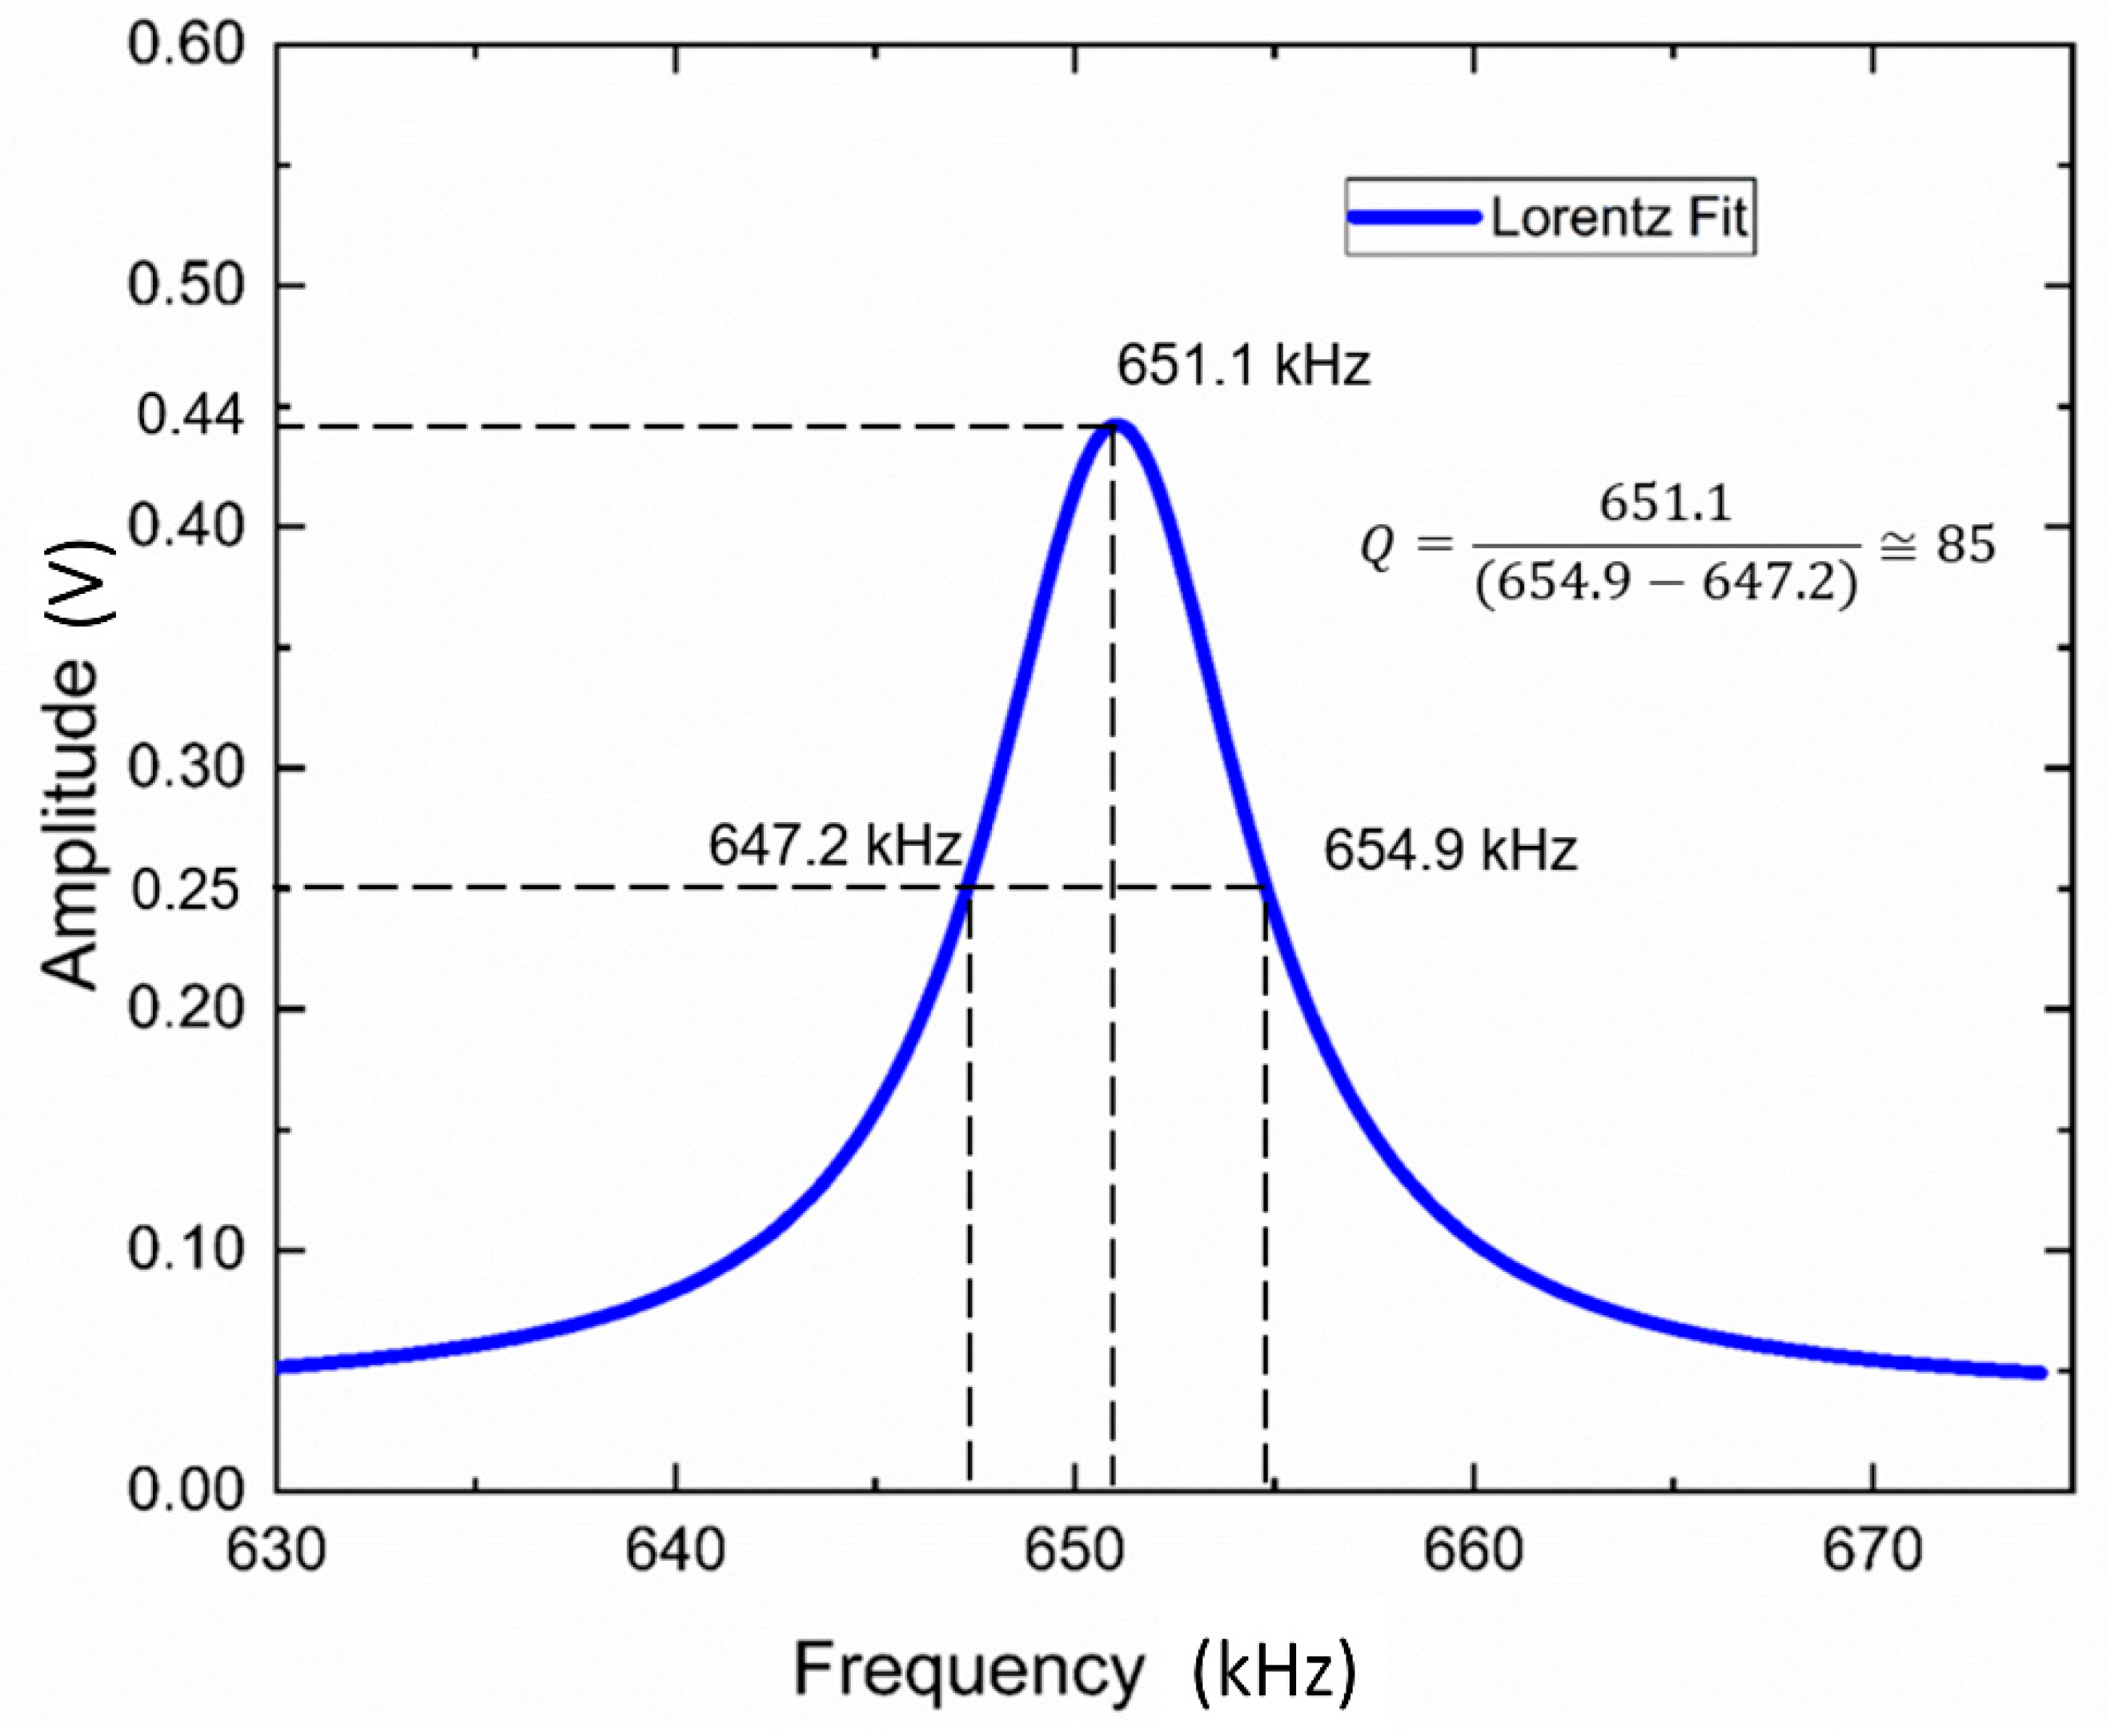
Energy losses during the oscillation cycle in the system composed of piezoelectric actuator, polymer film and CNTs would lead to the detection of damped resonance frequencies, and, in cases where the damping is significantly high, it could even impair the detection of resonance frequencies by the lock-in-amplifier. This occurs mainly when the vibration amplitude originated on the piezo is not fully transmitted to the nanotubes, because there are several sources of energy dissipation. First of all, the influence of the gas pressure in the SEM chamber is small but detectable. Other examples for origins of dissipation are due to mechanical loss of the components, their masses and due to the stiffness of clamping of CNTs within the polymer film PEDOT:PSS. It is reasonable that in MWCNTs even inner frictional processes between the walls lead to energy losses. These are not considered here, because of their miniscule dimensions. As the residual gas pressure in the SEM chamber was below 10−2 Pa, we also disregarded damping effects of the gas on the nanotube oscillation. Other factors can strongly affect the dissipation of energy in the system. One is the total mass deposited on the piezo, consisted by the layers of iridium, gold and PEDOT:PSS, together with a very small weight contribution from the CNTs. It is important to note that the damping of the stimulating vibration has no influence on the resonance frequency of the fiber and thus on the rigidity, but on the vibration amplitude only with which the nanofiber is excited. This makes these considerations practically irrelevant, except for the cases where the excitation amplitude of the piezo would be too small to excite the fiber in a measurable way.
The damping related to the fibers is described by the quality factor
and it is obtained experimentally. The
-factor is the ratio between the resonance frequency
and the full width at half maximum (FWHM;
) from the Lorentzian fit of the amplitude vs. frequency curve of a single MWCNT excitation measurement [
56,
57,
58]. The wider the amplitude peak, the lower is the quality factor, indicating higher energy dissipation. The higher and narrower is the peak, the greater is the quality factor. For the resonance of the MWCNT measured,
= 85 (
Figure 12). This value is within the range of quality factors reported by other authors for MWCNTs [
25,
27,
52,
56,
59].
To evaluate how a
-factor of 85 affects the resonance frequency detected in the case of single-degree-of-freedom (SDOF) damped oscillators, the damped natural frequency
can be described as
where
is the undamped natural frequency and
is the damping ratio, which is described as
Thus, Equation (8) can be rewritten as:
For a
-factor of 85, the damped frequency practically equals the undamped natural frequency, thus for the MWCNT tested, the energy dissipation is minimal. The reason for such a low energy loss system is likely associated with the nanoscale dimensions of the oscillator and the vacuum present in the SEM chamber. If we would quantify the quality factor of the clamping itself according to [
58],
, where
l and
t are the fiber length and thickness, respectively. For nanometric oscillators,
becomes exceptionally high, showing that the energy losses arising on the nanotube and going on the substrate are irrelevant and the forces exert on the PEDOT:PSS fixation point during the oscillation cycles are negligible.
5. Conclusions
The extended fiber toxicological paradigm introduced in
Section 1 emphasized the possible health risk of rigid fibers. For many commercial and advanced fiber materials however, the bending modulus is not reliably known. In order to further elucidate possible correlations between observed toxicological effects and fiber rigidities, we considered flexural rigidity measurement techniques indispensable to achieve progress in the field of fiber toxicology. Therefore, this work focused on developing a routinely applicable method to measure the rigidity of nanofibers. It employed detection of the oscillation resonances a fiber to determine its dynamic bending modulus. Resonance detection was achieved by the so-called dynamic scanning electron microscopy technique. Bending modulus and flexural rigidity values were calculated applying the Euler–Bernoulli beam theory. This methodology is also applicable to other types of nanofibers and nanowires of known material density that exhibit a beam-like shape and are electrically conductive or semiconductive.
By using SEM for nanofiber shape metrology and resonance detection, we presented a routinely applicable alternative to TEM-based techniques used in previous studies reported above. TEM is in general a more sophisticated technique requiring costly equipment, complex sample preparations and profound electron microscopy knowhow, especially to avoid damage of imaged fibers resulting from high beam energies. The SEM instruments used in this work facilitated the experimental set up and did not demand high levels of operational skills. However, it was beneficial to use an ultra-high-resolution SEM for reliable shape measurement and observation of structural details and defects. For fibers that are completely straight, the entire investigation can be made with a more elementary SEM, such as the Zeiss EVO MA 10 used in this work, provided that a higher deviation value of ±5 nm is considered for the diameter measurements. An increment of 2 nm on the deviation of the diameter would cause an increase of 2.5% on the error of both and for the MWCNTs investigated. However, for nanofibers that are thicker and denser than the MWCNTs used here, a deviation value of 3 nm is acceptable. Since the method developed here determined the bending modulus only indirectly from the values of resonance frequency, nanotubes dimensions and material density using assumptions on material homogeneity and a beam-like fiber geometry, errors in these measurands and assumptions contributed to the resulting bending modulus error and should be further reduced.
The bending modulus valued obtained for the MWCNTs studied here was to be compared to reported data from the literature. Those data, however, covered a very wide range from 15 to 1200 GPa. Reported modulus values appeared to strongly depend on the fiber diameter, the presence of structural defects and thus the synthesis technique as well as the used measurement and data analysis technique. The data suggests that MWCNTs from cCVD synthesis tended to exhibit lower bending modulus values and were thus in-line with our results.
For a potentially toxic action of a chemically inert fiber inside the lung tissue, high flexural rigidity was assumed to negatively affect macrophages phagocytosis and other lung clearance mechanisms. Although flexural rigidity scales only linearly with the bending modulus but with the 4th power of fiber diameter, in a specific diameter range, MWCNTs of a larger diameter may not necessarily be of higher toxicological relevance than thinner ones since the bending modulus may increase with decreasing diameter due to microstructure-related reasons. Therefore, further progress appears necessary in routinely and reliably measuring the bending modulus of nanofibers.

 ,
, 


