Abstract
Recent decades have seen substantial interest in the use of natural fibers in continuous fiber reinforced composites, such as flax, jute and hemp. Considering potential applications, it is of particular interest how natural fiber composites compare to synthetic fiber composites, such as glass and carbon, and if natural fibers can replace synthetic fibers in existing applications. Many studies have made direct comparisons between natural and synthetic fiber composites via material coupon testing; however, few studies have made such direct comparisons of full structural members. This study presents compression tests of geometrically identical structural channel sections fabricated from fiber-epoxy composites of flax, jute, hemp, glass and carbon. Glass fiber composites demonstrated superior tension material coupon properties to natural fiber composites. However, for the same fiber mass, structural compression properties of natural fiber composite channels were generally equivalent to, or in some cases superior to, glass fiber composite channels. This indicates there is substantial potential for natural fibers to replace glass fibers in structural compression members. Carbon fiber composites were far superior to all other composites, indicating little potential for replacement with natural fibers.
1. Introduction
Natural fibers such as flax, jute and hemp have attracted substantial interest for use in continuous fiber reinforced composites in recent decades, notably for their favorable sustainability properties including, for example, resource renewability; carbon sink; short growth cycle time; low herbicide requirements; low energy production; recyclability; biodegradability; low hazard manufacturing; and composite handling and working [1,2,3,4,5,6,7,8,9,10,11,12,13]. As the material properties of natural fibers and their composite laminates have become better understood, attention has turned to potential applications for natural fiber composites. A major focus for applications has been the potential for natural fibers to replace synthetic fibers in existing fiber resin composite applications, such as glass fiber and carbon fiber composite.
Direct comparisons between natural and synthetic fiber composite material properties are relatively straightforward, since such material coupon tests are undertaken in accordance with relevant testing standards (for example, compression, tension and flexure composite material testing in accordance with ISO 604 [14], ISO 527 [15] and ISO 14125 [16], respectively). While there exists a wide range of results due to different fiber types, fiber processing techniques, fiber layouts, matrix materials and fabrication methodologies, several review studies have been published in recent years summarizing data from a wide range of sources, which provide comparisons between different natural fibers and natural fiber composites, and their synthetic counterparts (see, for example, [1,2,3,4,5,6,7]).
Direct comparisons between natural and synthetic fiber composite full structural members are relatively few. Such comparisons are more complex than comparisons of material coupon tests, due to the wide variety of possible geometries and testing methodologies of structural members and systems, making direct comparisons between different studies difficult. Indeed, there are relatively few studies of natural fiber composite structural members, including for primary [17,18,19,20] and secondary [21,22,23,24,25] structural applications. Direct comparisons of structural characteristics of flax composite and glass composite wind turbine blades were reported in [20]. Other investigations highlighting the importance of natural and renewable materials include those in [26,27,28,29,30,31].
The present study attempts to address these limitations by undertaking direct comparisons of natural and synthetic fiber composite structural compression members, where members were fabricated with identical cross-section and member geometries, fabrication mandrels, fabrication processes, epoxy matrix materials and fiber masses; and were tested under identical testing procedures in the same apparatus. The member type was the structurally generic cross-section of a plain channel section in compression. The experimental results allow direct comparison of the structural compression characteristics of natural and synthetic fiber composite structures, as described in the following sections.
2. Materials and Methods
2.1. Materials
Five different fabrics were utilized for composite fabrications: flax, jute, hemp, glass and carbon. The natural fiber channel members were tested by the author previously (flax, jute and hemp) [17]. In the present study, synthetic fiber channels (glass and carbon) were fabricated using the exact same methods and materials as in the previous study [17]. Full data for the natural fiber channels are provided in [17], while relevant data were extracted for direct comparisons with the synthetic fiber channels for the present study. The flax and jute fabrics were 400 gsm [0,90] 2 × 2 twill weaves, a generic pattern consisting of bi-directional yarns woven over-over-under-under, where the yarns are perpendicular (i.e., 0°/90°). These fabrics were commercially produced by Composites Evolution, termed Biotex Flax and Biotex Jute, and use a low-twist yarn. Nominal density, tensile strength and modulus values for the flax were 1.5 g/cm3, 500 MPa and 50 GPa, and for the jute were 1.46 g/cm3, 400 MPa and 40 GPa. The hemp fabric was a 287-gsm [0,90] plain weave pure unbleached hemp fabric with a nominal density of 1.48 g/cm3. This fabric was not produced specifically for fiber resin composite fabrication; however, it was recommended as the most appropriate fabric for composites by the manufacturer.
The glass fabric was a commercial 1 × 1 twill weave [0,90] 300-gsm E-glass with nominal density, tensile strength and modulus values of 2.55 g/cm3, 1950 MPa and 72 GPa. The carbon fabric was a commercial 2 × 2 twill weave [0,90] 320-gsm Toray T300 carbon with nominal density, tensile strength and modulus values of 1.76 g/cm3, 3530 MPa and 230 GPa. The epoxy resin used was the bulk laminating epoxy resin Kinetix R240 with H160 hardener. This commercial epoxy resin has a density of 1.1 g/cm3 and measured a (neat) tension strength of 33.1 MPa, and it is a room temperature out-of-autoclave cure resin.
Tension material specimens were water jet cut from untested laminates and tested in accordance with ISO 527 [15]. The tension coupons were 25 mm wide and 250 mm long, and bonded steel end tabs were used. Since the width of the fabric weaves varied from approximately 1 mm for natural fiber fabrics to 2.5 mm for synthetic fiber fabrics, the tension coupons consisted of many weaves across the width of the coupon. The coupons were extracted from the thickest specimens fabricated, and they thus had total fiber areal masses equal to the maximum values for each fiber type in Table 1.

Table 1.
Composite channel dimensions and test results.
2.2. Channel Fabrications
The dimensions selected for the composite channels were a web depth of 100 mm (D), a flange width of 40 mm (B) and a length of 300 mm (L). Since the webs of the channels are stiffened elements, which are known to typically buckle in square half-wavelengths, a channel length of three times the web depth was selected, such that the webs had multiple half-wavelengths of buckle. This minimized end effects. Column member lateral-torsional buckling was precluded due to the short column length.
A hand layup technique was used to fabricate the composite channels. First the fabric was wet out with the epoxy resin using a standard brush and roller, then laid over a mandrel. The mandrel was a steel square hollow section with nominal dimensions of 100 mm (outside dimension) and a corner radius of 8 mm. This resulted in all channels having an internal web depth of 100 mm (Figure 1). Release film was placed between the composite and the mandrel, such that a chemical release agent was not required. A full vacuum (approximately 100 kPa) was set over the channel and held for a minimum of 15 h in a constant temperature room at 23 °C. The fabricated dimensions of the channels were lengths of 850 mm and flange widths of 70 mm. The channels were then cut into two specimens and trimmed to size following curing (using water jet cutting). Table 1 provides the final measured channel geometric properties.
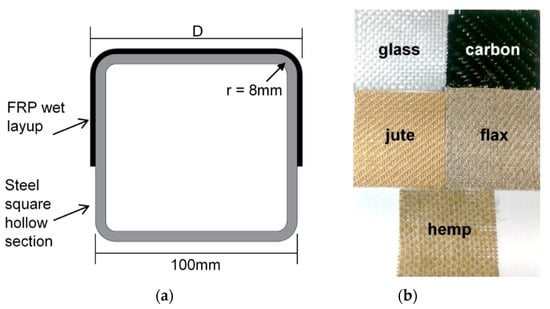
Figure 1.
Mandrel and fiber fabrics used: (a) steel square hollow section mandrel and (b) 50 × 50 mm fabrics.
In the previous investigation [17], flax and jute channels were fabricated with different thicknesses by varying the number of 400 gsm fabric layers—channels with two, three or four fabric layers were fabricated, resulting in channels with total fiber areal masses of 800, 1200 and 1600 gsm. Hemp channels had total fabric areal masses of 861, 1148 and 1722 gsm, where masses could not be matched exactly due to the single layer areal mass of 287 gsm. Similarly, in the present study the number of layers of glass (300 gsm per layer) and carbon fabric (320 gsm per layer) were chosen to approximately equal the values for flax and jute, resulting in total fabric areal masses for glass of 900, 1200 and 1500 gsm, and for carbon of 640, 960 and 1600 gsm (the values for carbon were selected such that they did not exceed those for the other fabrics, since carbon is substantially stiffer and stronger). In the present study comparisons are made between different fiber types within these three comparator groups, i.e., groups with approximate total fiber areal masses of 800, 1200 and 1600 gsm, corresponding to groups with actual values of 640–900 gsm, 960–1200 gsm and 1500–1722 gsm, respectively.
2.3. Channel Tests
Compression testing was conducted in an MTS machine with fixed-end bearings. The channel column test specimens had bonded steel end plates of 2 mm thickness. This reduced possible end effects (stress concentrations, eccentric loading, etc.) resulting from the fabrication procedure. The end plates precluded edge rotations, resulting in the ends being fixed-ended [17,18,32]. The testing machine contained spherical end bearings that were initially unlocked while the specimen was installed and a small load applied. The bearings were then locked providing a fixed-end bearing condition. Buckling deformations (out-of-plane) were measured with displacement transducers, which were located at 75 mm intervals longitudinally along the web, and at the mid-length of both flanges. The loading procedure was displacement control, with a speed of 0.5 mm/min.
3. Results
3.1. Laminate Thickness
An important difference between the channels fabricated from the various fabrics is the laminate thickness. While comparator channels had approximately equal total fiber areal masses, they did not have equal laminate thicknesses. This results primarily from the different density of the fabrics, resulting in different nominal fabric thicknesses for the same fabric mass and different epoxy uptake during fabric wet out. Other factors may include that natural fibers contain a lumen core which may compress differently to synthetic fibers under vacuum pressure, and different fabrics and/or weaves may lead to different void contents in the matrix. The measured laminate thickness values are tabulated in Table 1, where it is evident that when comparing laminates with approximately equal total fiber areal masses, the laminate thickness is generally proportional to the fiber density. Laminates in order from thinnest to thickest (for the same total fiber areal mass) were glass, carbon, flax, jute and hemp.
In Table 1 it is evident from the buckling loads that, for approximately equivalent fiber total areal mass, the buckling loads for the natural fiber composite channels are similar to those for the glass fiber composite channels and in some cases exceed them. This results from the thickness values discussed above. Thin laminate compression buckling is dependent on the thickness of the laminate squared and the material elastic modulus (E) (in the present study the other relevant geometric properties are the same for all channels). While the glass fiber composite elastic modulus is greater than those for the natural fiber composites (Table 2), the buckling load of the glass fiber composites can be lower than the natural fiber composites in cases where the thickness is much lower.
Table 2.
Measured mean uni-axial tension coupon material properties of the fiber composite laminates (ET is the elastic modulus in tension, εuT is the failure strain in tension, and fuT is the ultimate tension stress).
In Table 1 it is evident from the axial stiffness values that, for approximately equivalent fiber total areal mass, the axial stiffness of the glass fiber composite channels in many cases is similar to or less than those for the natural fiber composite channels. The axial stiffness is dependent on the cross-section area of the laminate and the material elastic modulus (E). While the glass fiber composite elastic modulus is greater than those for the natural fiber composites (Table 2), the cross-sectional area of the glass fiber composite channels is much less than those of the natural fiber composite channels, since the thickness values are much lower, while the other relevant geometric properties are the same for all channels.
In Table 1 it is evident from the ultimate load values that, for approximately equivalent fiber total areal mass, the ultimate load of the glass fiber composite channels in many cases is similar to or less than those for the natural fiber composite channels. The ultimate load is dependent on the buckling load, the post-buckling ductility and the material strength. While the glass fiber composite material strength is greater than those for the natural fiber composites (Table 2), the buckling loads are lower in many cases, and the glass fiber composite response is more brittle than that of the natural fiber composites with post-buckling ductility values (Pu/Pb) less than those for natural fibers in many cases (Table 1).
Meanwhile, since the material properties of the carbon fiber composites far exceeded those of the natural and glass fiber composites (Table 2), the performance of the carbon fiber composite channels with respect to stiffness, buckling and strength were superior to natural and glass fiber composite channels in all cases, despite the carbon fiber laminates being relatively thin (Table 1).
3.2. Fiber Volume Fractions
Fiber mass fractions were calculated using the mass of fabric prior to fabrication and the mass of composite after fabrication, and fiber volume fractions were estimated from mass fractions and constituent densities. Natural fiber mean mass fractions for flax, jute and hemp were 0.48, 0.50 and 0.47, respectively. Synthetic fiber mean mass fractions for carbon and glass were 0.75 and 0.77, respectively. These data indicate that natural and synthetic fibers took up epoxy resin at significantly different rates, due to their different densities (and weaves). The fiber volume fraction mean values for flax, jute, hemp, carbon and glass were 0.41, 0.44, 0.41, 0.66 and 0.60, respectively. It should be noted that since natural fibers contain a lumen core, these fibers may compress slightly under a vacuum pressure. This may slightly increase the natural fiber density resulting in the volume fractions being an upper bound estimate for these fibers.
3.3. Material Tension Test Results
Material tension strength results are tabulated for all laminates in Table 2, where the mean values for flax, jute, hemp, carbon and glass were 45.4, 52.1, 35.3, 771 and 484 MPa, respectively. It is noted that these are uni-axial stresses on bi-directional fabric [0,90] composites, and thus the material values are nominally one half of those for uni-directional fabric composites. As expected, the synthetic fiber composites had substantially higher tension strengths than the natural fiber composites, and carbon was the strongest composite. It should be noted the natural fiber composite tension strengths are relatively low and may result from the following: voids in the matrix may result from the multilayer bi-directional twill weave; the epoxy resin may not completely penetrate the lumens; the natural fiber is a low-twist yarn, however, if the twist is not zero the twist angle may change during tension loading; and the natural fiber yarn contains elementary fibers that can move (relative to each other) during tension loading.
Exemplar tension material stress–strain responses are plotted in Figure 2, and mean elastic moduli and fracture strains are tabulated in Table 2. These data indicate that the synthetic fiber composites had highly linear stress–strain responses, while natural fiber composites had highly non-linear responses. The carbon fiber composite had the lowest fracture strain (1.1%), while the fracture strain of the glass fiber composite (2.3%) was comparable with those of the natural fiber composites (1.6–3.1%).
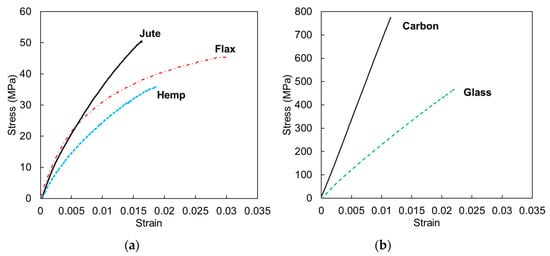
Figure 2.
Exemplar uni-axial tension coupon material tests of the fiber composite laminates: (a) natural fiber composite laminates [17] and (b) synthetic fiber composite laminates.
3.4. Channel Test Results
Full results for the ultimate compression strength of all channel sections are tabulated in Table 1, and exemplar axial compression–axial displacement test data are shown in Figure 3 and Figure 4 for carbon and glass channels, respectively, including photos at key points (a to g). Test data for the flax, jute and hemp channels are provided in [17]. The compression results indicate typical behavior for thin-walled structural sections, with reference to Figure 3 and Figure 4: an initial linear elastic response (a,b); followed by compression buckling of one or more web or flange elements (typically in multiple half-wavelengths) with corresponding bi-furcation from linear elasticity (c); followed by a post-buckling response characterized by increasing out-of-plane buckling deformations and concomitant softening, resulting from the re-distribution of axial stresses away from these buckled regions (d); the attainment of an ultimate limit state resulting from material fracture in the channel corners (e,f); followed by post-ultimate load shedding, typically also involving the development of additional fractures (g). Material failure is discussed further in the following section.
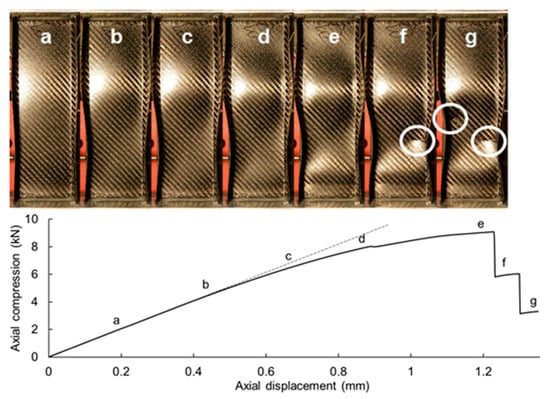
Figure 3.
Exemplar carbon fiber composite channel (960 gsm) compression test (dashed line indicates the channel compression stiffness; circles indicate fractures; all column heights are 300 mm).
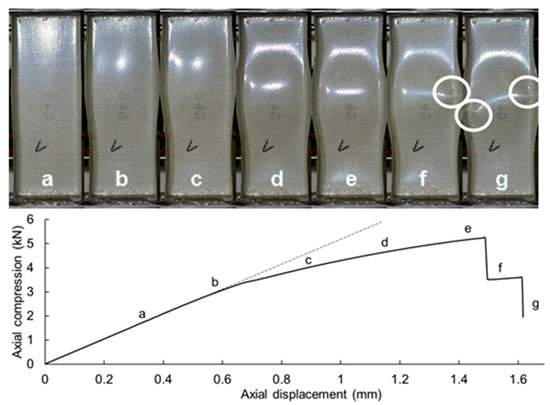
Figure 4.
Exemplar glass fiber composite channel (1200 gsm) compression test (dashed line indicates the channel compression stiffness; circles indicate fractures; all column heights are 300 mm).
Exemplar axial compression—axial displacement test data for each fabric material and each of the three total fiber areal mass comparator groups are shown in Figure 5, Figure 6 and Figure 7, including photos at the ultimate limit state, for direct comparison between different fabrics. These data indicate that the natural fiber channels demonstrated a much more ductile response, partly due to lower elastic moduli, but predominantly due to their much more ductile post-buckling and post-ultimate responses. As demonstrated in Figure 2, the synthetic fiber laminates demonstrated highly linear material behavior, while the natural fiber laminates demonstrated highly non-linear material behavior. These material characteristics allowed the natural fiber channels to develop large out-of-plane buckling displacements prior to reaching the ultimate limit state, during which the axial stresses redistributed and allowed the channel to continue to resist load. This produced a pronounced post-buckling strength, gradual attainment of the ultimate load and gradual unloading post-ultimate. Conversely, the synthetic fiber channels reached the ultimate state in an abrupt manner and failed suddenly in a brittle manner, shedding load rapidly post-ultimate. This was also qualitatively evident during the experiments, where the synthetic fiber composite channels failed suddenly with an audibly loud noise, corresponding to the sudden release of the stored compression energy associated with material fracture.
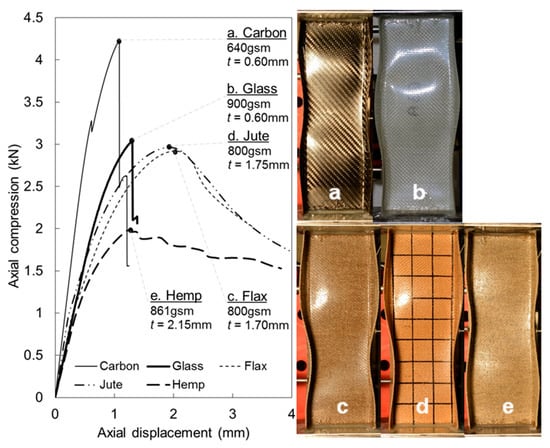
Figure 5.
Exemplar composite channel compression tests for the approximately 800 gsm total fiber areal mass comparator group (640–900 gsm) (all column heights are 300 mm).
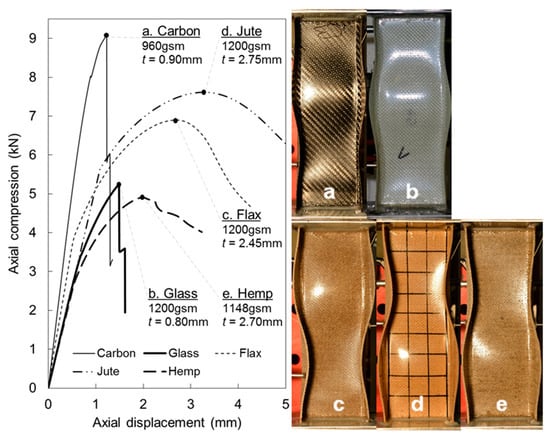
Figure 6.
Exemplar composite channel compression tests for the approximately 1200 gsm total fiber areal mass comparator group (960–1200 gsm) (all column heights are 300 mm).
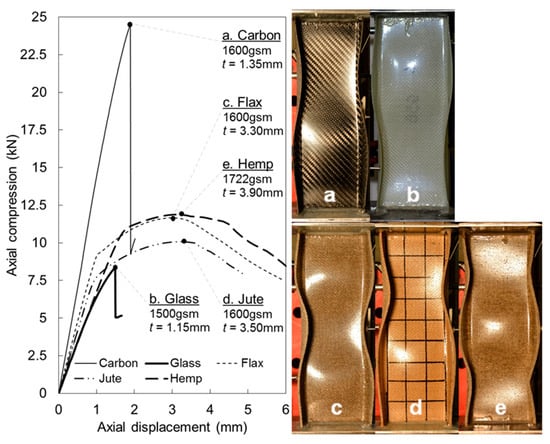
Figure 7.
Exemplar composite channel compression tests for the approximately 1600 gsm total fiber areal mass comparator group (1500–1722 gsm) (all column heights are 300 mm).
The post-buckling strength was quantified using the ratio of the ultimate load to the section buckling load (Table 1). The change in column stiffness methodology was used to quantify the buckling loads. The linear elastic axial stiffness bi-furcation point was identified, and the column buckling load was taken as the compression load corresponding to this bi-furcation point (this methodology is discussed further in [17,18,33]). It is noted that this provides an upper bound to the column buckling load, as the reduction in column stiffness occurs immediately following buckling. These data indicate the post-buckling strength of the synthetic fiber channels (ratios of 1.3 to 1.7) were generally less than those of the natural fiber channels (ratios of 1.1 to 3.6); however, it is noted that these ratios changed with the laminate thickness.
3.5. Failure Modes
In accordance with fundamental thin plate mechanics theories, in the post-buckled state the stresses redistribute away from the buckled regions into the non-buckled regions: in the present case into the corners of the channel sections. It is via this mechanism that a post-bucking strength develops, during which the stresses continue to increase in these corner regions until the ultimate limit state, characterized by the attainment of a stress limit corresponding to failure of the material. In accordance with the material behavior (Section 3.3), the channel material failure was brittle for the synthetic fiber composites, characterized by concentrated matrix fractures (including fiber fracture), and ductile for the natural fiber composites, characterized by diffuse matrix failure (without fiber fracture). Exemplar matrix failures are shown in Figure 8 for typical carbon and glass composites, and for flax composites which were typical to the natural fiber composites (natural fiber composite matrix failures are elaborated further in [17]). The post-buckling mechanics model for composite structural channel sections is described further in [17,18,19].
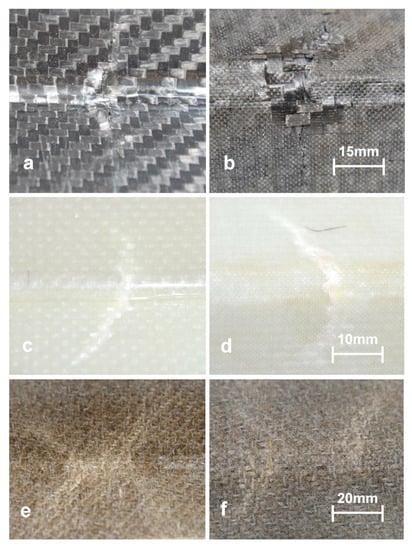
Figure 8.
Exemplar matrix failures in the corners of the composite channels associated with the ultimate limit state: (a) carbon (inside view), (b) carbon (outside view), (c) glass (inside view), (d) glass (outside view), (e) flax (inside view) and (f) flax (outside view).
3.6. Comparisons of Structural Compression Characteristics—Compressive Strength and Stiffness
Since the total fiber areal masses of the channels had small variations within the three comparator groups, the strength is compared using the value of the channel ultimate compression strength (N) per unit fiber areal mass (gsm), i.e., the strength efficiency (N/gsm). While the channels had different relative quantities of epoxy material, this strength efficiency value was selected to directly compare between different types of fiber reinforcements. The strength efficiency values are tabulated in Table 1, and all data are plotted in Figure 9, along with a linear trend for each fiber type. These data indicate that for each fiber type, strength efficiency increased with composite thickness. This is a well-known result for thin-walled structural sections in compression, where thinner sections are less efficient since they are susceptible to compression buckling of the thin plate elements of the section. These data also indicate that carbon fiber composites have superior strength efficiencies to all other fiber types, despite being comparatively thin, while glass fiber composite strength efficiencies are comparable with natural fiber composites.
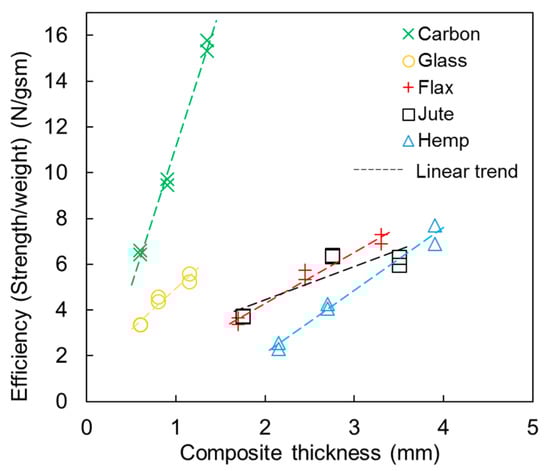
Figure 9.
Composite channel compression strength efficiency (strength per fiber mass, N/gsm).
While strength efficiencies varied with thickness, the average value for all thicknesses provides a comparative measure for the strength efficiency for each fiber type, and these values were then normalized to the average value for flax and plotted in Figure 10a. Similarly, each channel section compression stiffness (i.e., the slope of the linear elastic portion of the axial load—axial displacement plot) was normalized to its total fiber areal mass, then averaged for each fiber type, then normalized to the average value for flax, and plotted in Figure 10b. It is noted that the channel section compression stiffness thus calculated corresponds to the section EA/L value (where E is the elastic modulus, A is the cross-section area, and L is the channel length). These data indicate that the carbon fiber composite channels were more efficient than all other composites, with respect to both strength (1.9 times flax) and stiffness (1.8 times flax). Meanwhile, glass fiber composite channels were less efficient than flax fiber composites channels, with respect to both strength (0.8 times flax) and stiffness (0.8 times flax). Glass fiber composite channels were less efficient than jute fiber composite channels, and approximately equally efficient with hemp fiber composite channels. Flax and jute fiber composite channels were approximately equally efficient, and they were slightly more efficient than hemp fiber composite channels.
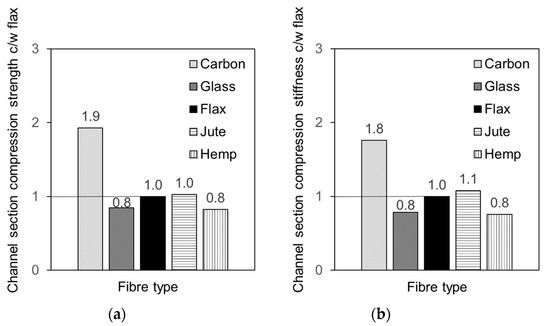
Figure 10.
Mean compression strength and stiffness efficiency of structural columns from channel tests: (a) strength and (b) compression stiffness (EA/L, where E is the elastic modulus, A is the cross-section area, and L is the channel length), compared with the values for flax.
4. Discussion
The present study has demonstrated that, for equivalent fiber mass, natural fiber composite structural compression members are generally structurally equivalent to their glass fiber counterparts. For the specific purpose of ascertaining if natural fibers (flax, jute and hemp) may replace glass fiber in structural composites, it is concluded that this would be achievable on a fiber mass replacement basis (subject to the geometric limitations of the present test series of thin structural laminates in compression). It should be noted, however, this conclusion does not infer similar equivalency on a volume replacement basis (i.e., comparing structural characteristics for channels with identical thickness).
Direct comparisons between structural laminates of flax and glass fiber polyester composites were made in [20], comparing nominally identical small wind turbine blades. In that study the blades were nominally volume constrained, whereby approximately the same volume of flax and glass fiber reinforcements were used. Flax fiber density was 60% of glass fiber density, resulting in a total flax fiber mass that was 55% of the total glass fiber mass. However, the flax composite took up more resin such that the resin used in the glass composite was 90% of that used in the flax composite (the authors attributed this to a small difference in the fiber volume and a resin cavity in the flax mold). The net effect was that the flax blade was 10% lighter than the glass blade. The fiber mass fractions of the flax and glass composites were 28.2% and 44.3%, respectively, which are somewhat lower than those in the present study. The structural testing of the blades indicated that the glass blade had a flexural stiffness 1.76 times greater than that of the flax blade. This is in contrast to the present study and highlights the note above regarding the difference between making comparisons using equivalent mass or equivalent volume. The authors also noted the flax blades had a highly non-linear response, while the glass blade was highly linear, which reflects somewhat the different ductility between flax and glass noted in the present study. The failure load of the glass blade was not disclosed, so ultimate strength comparisons could not be made. The authors also noted the importance of investigating the composites at the application/structural scale, rather than limiting analyzes to data extracted from material coupon testing.
With regards to potential structural applications for natural fiber composites, it is noted that in primary structural applications in civil infrastructure, both appropriate strength and ultimate limit state ductility are required. Ultimate limit state ductility is especially important to provide redundancy in cases of extreme loading or overloading, while large deflections prior to the ultimate limit state provide visible indications of impending failures. Thus while ultimate strength is critical, ductility of that state is also important. These considerations indicate that high ductility of the natural fiber composites in the present study lend themselves to primary structural applications, in such cases as when strength requirements are satisfied. It has been shown by the author in [18,19], that geometrically optimized structural channel sections of flax and jute have sufficient strength for light primary structural applications, such as in residential buildings.
Conversely, in other structural applications, said ductility may make natural fiber composites inappropriate and may lend themselves to synthetic composites. In the wind turbine blade study [20], the authors noted the flax blade tip deflection was up to 2.7 times greater than that of the glass blade for the same load. While the flax blade passed the strength requirements, the higher tip deflection would need to be accommodated in the tower design.
5. Conclusions
Direct comparisons between structural characteristics of synthetic fiber (glass and carbon) and natural fiber (flax, jute and hemp) composite structural members have been made experimentally for thin-walled channel sections in compression. It has been shown that natural fiber structural laminates are generally structurally equivalent to their glass fiber counterparts in equivalent fiber mass applications, with regards to compression strength and stiffness. Carbon fiber was superior to all other fiber types. The ductility of the structural members was notably different between synthetic and natural fiber composites, where the former was much less ductile than the latter, which may lend different composites to different types of structural applications. With regards to the specific issue of replacing glass fiber with natural fiber in structural compression applications, it has been demonstrated that, subject to the geometric limitations of the present experiments on thin-walled channels, structural equivalency may be generally achieved based on direct substitution with the same fiber mass.
Funding
This research received no external funding.
Conflicts of Interest
The authors declare no conflict of interest.
References
- Summerscales, J.; Dissanayake, N.P.J.; Virk, A.S.; Hall, W. A review of bast fibers and their composites. Part 1—Fibers as reinforcements. Compos. Part A 2010, 41, 1329–1335. [Google Scholar] [CrossRef]
- Summerscales, J.; Dissanayake, N.P.J.; Virk, A.S.; Hall, W. A review of bast fibers and their composites. Part 2—Composites. Compos. Part A 2010, 41, 1336–1344. [Google Scholar] [CrossRef]
- Ku, H.; Wang, H.; Pattarachaiyakoop, N.; Trada, M. A review on the tensile properties of natural fiber reinforced polymer composites. Compos. Part B Eng. 2011, 42, 856–873. [Google Scholar] [CrossRef]
- Yan, L.B.; Chouw, N.; Jayaraman, K. Flax fibe and its composites—A review. Compos. Part B. 2014, 56, 296–317. [Google Scholar] [CrossRef]
- Pickering, K.L.; Efendy, M.G.A.; Le, T.M. A review of recent developments in natural fiber composites and their mechanical performance. Compos. Part A 2016, 83, 98–112. [Google Scholar] [CrossRef]
- Faruk, O.; Bledzki, A.K.; Fink, H.-P.; Sain, M. Biocomposites reinforced with natural fibers: 2000–Prog. Polym. Sci. 2012, 37, 1552–1596. [Google Scholar] [CrossRef]
- Dicker, M.P.M.; Duckworth, P.F.; Baker, A.B.; François, G.; Hazzard, M.K.; Weaver, P.M. Green composites: A review of material attributes and complementary applications. Compos. Part A Appl. Sci. Manuf. 2014, 56, 280–289. [Google Scholar] [CrossRef]
- Weclawski, B.T.; Fan, M.; Hui, D. Compressive behaviour of natural fiber composite. Compos. Part B 2014, 67, 183–191. [Google Scholar] [CrossRef]
- Costa, F.H.M.M.; D’Almeida, J.R.M. Effect of Water Absorption on the Mechanical Properties of Sisal and Jute Fiber Composites. Polym. Technol. Eng. 1999, 38, 1081–1094. [Google Scholar] [CrossRef]
- Hargitai, H.; Rácz, I.; Anandjiwala, R.D. Development of HEMP Fiber Reinforced Polypropylene Composites. J. Thermoplast. Compos. Mater. 2008, 21, 165–174. [Google Scholar] [CrossRef]
- Oksman, K. High quality flax fiber composites manufactured by the resin transfer moulding process. J. Reinf. Plast. Comp. 2001, 20, 621–627. [Google Scholar] [CrossRef]
- Da Silva, H.S.P.; Júnior, H.L.O.; Júnior, J.H.A.; Zattera, A.J.; Amico, S.C. Mechanical behavior and correlation between dynamic fragility and dynamic mechanical properties of curaua fiber composites. Polym. Compos. 2013, 35, 1078–1086. [Google Scholar] [CrossRef]
- Da Silva, L.V.; Júnior, J.H.A.; Angrizani, C.C.; Amico, S.C. Short beam strength of curaua, sisal, glass and hybrid composites. J. Reinf. Plast. Compos. 2012, 32, 197–206. [Google Scholar] [CrossRef]
- ISO 604: Plastics—Determination of Compressive Properties; ISO: Geneva, Switzerland, 2002.
- ISO 527-4: Plastics—Determination of Tensile Properties. Part 4: Test Conditions for Isotropic and Orthotropic Fiber-Reinforced Plastic Composites; ISO: Geneva, Switzerland, 1997.
- ISO 14125: Fiber-Reinforced Plastic Composites—Determination of Flexural Properties; ISO: Geneva, Switzerland, 1998.
- Bambach, M.R. Compression strength of natural fiber composite plates and sections of flax, jute and hemp. Thin Walled Struct. 2017, 119, 103–113. [Google Scholar] [CrossRef]
- Bambach, M.R. Geometric optimisation and compression design of natural fiber composite structural channel sections. Compos. Struct. 2018, 185, 549–560. [Google Scholar] [CrossRef]
- Bambach, M. Durability of natural fibre epoxy composite structural columns: High cycle compression fatigue and moisture ingress. Compos. Part C Open Access 2020, 2, 100013. [Google Scholar] [CrossRef]
- Shah, D.U.; Schubel, P.J.; Clifford, M.J. Can flax replace E-glass in structural composites? A small wind turbine blade case study. Compos. Part B Eng. 2013, 52, 172–181. [Google Scholar] [CrossRef]
- Yan, L.B.; Chouw, N. Crashworthiness characteristics of flax fiber reinforced epoxy tubes for energy absorption application. Mat. Des. 2013, 51, 629–640. [Google Scholar] [CrossRef]
- Yan, L.B.; Chouw, N. Behaviour and analytical modelling of natural flax fiber reinforced polymer tube encased coir fiber reinforced concrete composite column. J. Comp. Mater 2013, 47, 2133–2148. [Google Scholar] [CrossRef]
- Mak, K.; Fam, A.; MacDougall, C. Flexural Behavior of Sandwich Panels with Bio-FRP Skins Made of Flax Fibers and Epoxidized Pine-Oil Resin. J. Compos. Constr. 2015, 19, 04015005. [Google Scholar] [CrossRef]
- Le Duigou, A.; Deux, J.-M.; Davies, P.; Baley, C. PLLA/Flax Mat/Balsa Bio-Sandwich Manufacture and Mechanical Properties. Appl. Compos. Mater. 2010, 18, 421–438. [Google Scholar] [CrossRef]
- Uddin, N.; Kalyankar, R. Manufacturing and Structural Feasibility of Natural Fiber Reinforced Polymeric Structural Insulated Panels for Panelized Construction. Int. J. Polym. Sci. 2011, 2011, 963549. [Google Scholar] [CrossRef]
- Lansiaux, H.; Soulat, D.; Boussu, F.; Labanieh, A.R. Development and Multiscale Characterization of 3D Warp Interlock Flax Fabrics with Different Woven Architectures for Composite Applications. Fibers 2020, 8, 15. [Google Scholar] [CrossRef]
- Wahab, N.; Srinophakun, P.; Hussain, Q.; Chaimahawan, P. Performance of Concrete Confined with a Jute–Polyester Hybrid Fiber Reinforced Polymer Composite: A Novel Strengthening Technique. Fibers 2019, 7, 72. [Google Scholar] [CrossRef]
- Manaia, J.P.; Manaia, A.T.; Rodriges, L. Industrial Hemp Fibers: An Overview. Fibers 2019, 7, 106. [Google Scholar] [CrossRef]
- Ateş, B.; Koytepe, S.; Ulu, A.; Gurses, C.; Thakur, V. Chemistry, Structures, and Advanced Applications of Nanocomposites from Biorenewable Resources. Chem. Rev. 2020, 120, 9304–9362. [Google Scholar] [CrossRef]
- Singha, A.; Thakur, V. Physical, Chemical and Mechanical Properties of Hibiscus sabdariffa Fiber/Polymer Composite. Int. J. Polym. Mater. 2009, 58, 217–228. [Google Scholar] [CrossRef]
- Singha, A.; Thakur, V. Fabrication and characterization of S. cilliare fibre reinforced polymer composites. Bull. Mater. Sci. 2009, 32, 49–58. [Google Scholar] [CrossRef]
- Bambach, M. Axial capacity and crushing of thin-walled metal, fibre–epoxy and composite metal–fibre tubes. Thin Walled Struct. 2010, 48, 440–452. [Google Scholar] [CrossRef]
- Bambach, M. Photogrammetry measurements of buckling modes and interactions in channels with edge-stiffened flanges. Thin Walled Struct. 2009, 47, 485–504. [Google Scholar] [CrossRef]
© 2020 by the author. Licensee MDPI, Basel, Switzerland. This article is an open access article distributed under the terms and conditions of the Creative Commons Attribution (CC BY) license (http://creativecommons.org/licenses/by/4.0/).